Multi-Objective Optimal Design of Stand-Alone Hybrid Energy System Using Entropy Weight Method Based on HOMER


1
Department of Electrical Engineering, Army Logistics University of PLA, Chongqing 401331, China
2
Department of Electrical Engineering, Chongqing Communication Institute, Chongqing 400036, China
*
Authors to whom correspondence should be addressed.
Energies 2017, 10(10), 1664; https://doi.org/10.3390/en10101664
Submission received: 15 September 2017
/
Revised: 10 October 2017
/
Accepted: 16 October 2017
/
Published: 20 October 2017
(This article belongs to the Section F: Electrical Engineering)
Abstract
:Implementation of hybrid energy system (HES) is generally considered as a promising way to satisfy the electrification requirements for remote areas. In the present study, a novel decision making methodology is proposed to identify the best compromise configuration of HES from a set of feasible combinations obtained from HOMER. For this purpose, a multi-objective function, which comprises four crucial and representative indices, is formulated by applying the weighted sum method. The entropy weight method is employed as a quantitative methodology for weighting factors calculation to enhance the objectivity of decision-making. Moreover, the optimal design of a stand-alone PV/wind/battery/diesel HES in Yongxing Island, China, is conducted as a case study to validate the effectiveness of the proposed method. Both the simulation and optimization results indicate that, the optimization method is able to identify the best trade-off configuration among system reliability, economy, practicability and environmental sustainability. Several useful conclusions are given by analyzing the operation of the best configuration.
1. Introduction
In contrast with lives illuminated by electricity in well-developed urban areas, over 1085 million people around the globe are still managing to make a living in the dark with no access to electricity [1]. For remote areas such as rural villages and isolated islands, conventional grid electrification is extremely expensive, or even impractical due to geographical inaccessibility. In this context, small autonomy power system (SAPS), composed of diesel generator, is generally considered as a feasible solution for power supply [2]. Nevertheless, continuous burning of fossil fuel releases a huge amount of greenhouse gas into the atmosphere as an inevitable consequence, which will lead to serious deterioration of ecological environment.
Fortunately, the majority of these remote areas usually reserve abundant of renewable sources such as solar and wind energy, which are widely distributed, freely available and environmental friendly comparing to the conventional fossil based energy [3]. In this regard, integrating these renewable based generating units with battery storage and backup diesel generator into a HES cannot only tackle the aforementioned environmental problems, but also satisfy the electrification requirements for these remote areas.
However, with the growing penetration of renewable power in HES, the unpredictable output of renewable based generating units has a significant impact on the reliability of distribution system, since the intermittent and stochastic nature of renewable sources impose considerable uncertainty to the power generation [4]. In this case, it is quite necessary for an optimal design of HES to ensure the consistency of power supply, as well as to utilize the renewable sources in an efficient and economic manner.
The optimal design of HES is a multi-objective optimization problem with contradicting objectives [5]. Several literatures on HES optimization have been published with different methodologies and objectives [6,7,8,9]. The classic optimization approaches such as iterative technique [10], linear programming method [11], design space concept [12] and analytical model [13] were adopted in earlier researches. Nevertheless, classic optimization approaches are easily trapped in the local optimum [14]. In order to overcome this drawback, the meta-heuristic approaches were adopted owing to their ability to find the global optimum. Wu et al. [15] introduced a novel reconfiguration methodology for distribution system that guaranteed increment of load balance factor with minimum power loss, and the ant colony algorithm was used to find the global optimal solution due to its outstanding characteristics of positive feedback, constructive greedy heuristics and distributed computation. Shayeghi and Hashemi [16] addressed the attuned design of a hybrid generation system by using the non-dominated sorting genetic algorithm-II. Three principal aims including economic, reliability and environmental criteria were simultaneously considered, and the fuzzy decision making method was introduced for selecting the best compromised configuration from a set of Pareto optimum solutions. Raji et al. [17] proceeded a dimensioning of distributed renewable generation and a distributed energy storage system by utilizing the genetic algorithm (GA). Minimization of the power supply cost and the battery value loss were achieved, and a distribution microgrid in Okinawa was used for testing the algorithm. Baghaee et al. [18] proposed a multi-objective particle swarm optimization based methodology for sizing a stand-alone solar/wind/fuel cell generation microgrid system, in order to minimize three objective functions viz. loss of load expected, annualized cost of system and loss of energy expected during 20 years operation period. Katsigiannis et al. [19] presented a simulated annealing-tabu search hybrid optimization algorithm, which fully took the advantages of both meta-heuristic methods to design a small autonomous power system with the least cost of energy. Dufo-López et al. [20] developed the Hybrid Optimization by Genetic Algorithms (HOGA) as a design tool for HES optimization. HOGA utilized the multi-objective evolutionary algorithm as main algorithm to find the optimal size of major components to minimize CO2 emissions and cost of energy, then, GA was applied as secondary algorithm to search the optimum control strategy for each feasible combination of components with least cost. Apparently, the meta-heuristic approaches have excellent performance on identifying the global optimum solution. However, it should be noted that, complicated codification and long computational time due to massive iterative calculations are the two main shortcomings of metaheuristic approaches. In addition, a set of trade-off solutions known as the Pareto optimal set is mostly obtained by using the Pareto based meta-heuristic method. Although the Pareto optimal set is able to provide an effective support on decision-making, the final decision still relies heavily on the subjective judgments of designer.
In the last decade, several softwares have been developed for designing and optimizing HES [21]. The Hybrid Optimization of Multiple Energy Resources (HOMER) is one of the most popular optimization softwares with the advantage of easy implementation and high efficiency [22,23,24,25]. It is able to conduct a time series simulation of HES and generate a set of feasible configurations sorted by the total net present cost. During the optimization process, both reliability and environmental indices will be converted into penalty functions as the additional cost of the system. Then, the multi-objective optimization problem is transformed into a single-objective one with the only target of system cost. Finally, the configuration with minimum total net present cost will be recommended as the optimal system. However, for practical design of HES, it is more reasonable to take all of these indices into consideration rather than just converting them into penalty functions.
For this reason, a decision-making methodology is proposed for searching the best trade-off configuration of HES from a set of feasible combinations obtained from HOMER. A multi-objective function, which comprises four crucial and representative indices, is formulated considering the reliable, economic, practical and environmental performance of HES. Moreover, in order to enhance the objectivity of decision making, the entropy weight method is employed as a quantitative methodology for weighting factors calculation. In the end, the optimal design of a stand-alone PV/wind/battery/diesel HES in Yongxing Island, China, is conducted as a case study in order to validate the effectiveness of the proposed optimization method.
This paper is organized as follows, Section 1 gives the introduction. Section 2 describes the proposed HES. The optimization problem is formulated in Section 3. Section 4 elaborates the proposed method. Results and discussions are presented in Section 5. In the end, Section 6 summarizes the conclusion.
2. Description of HES
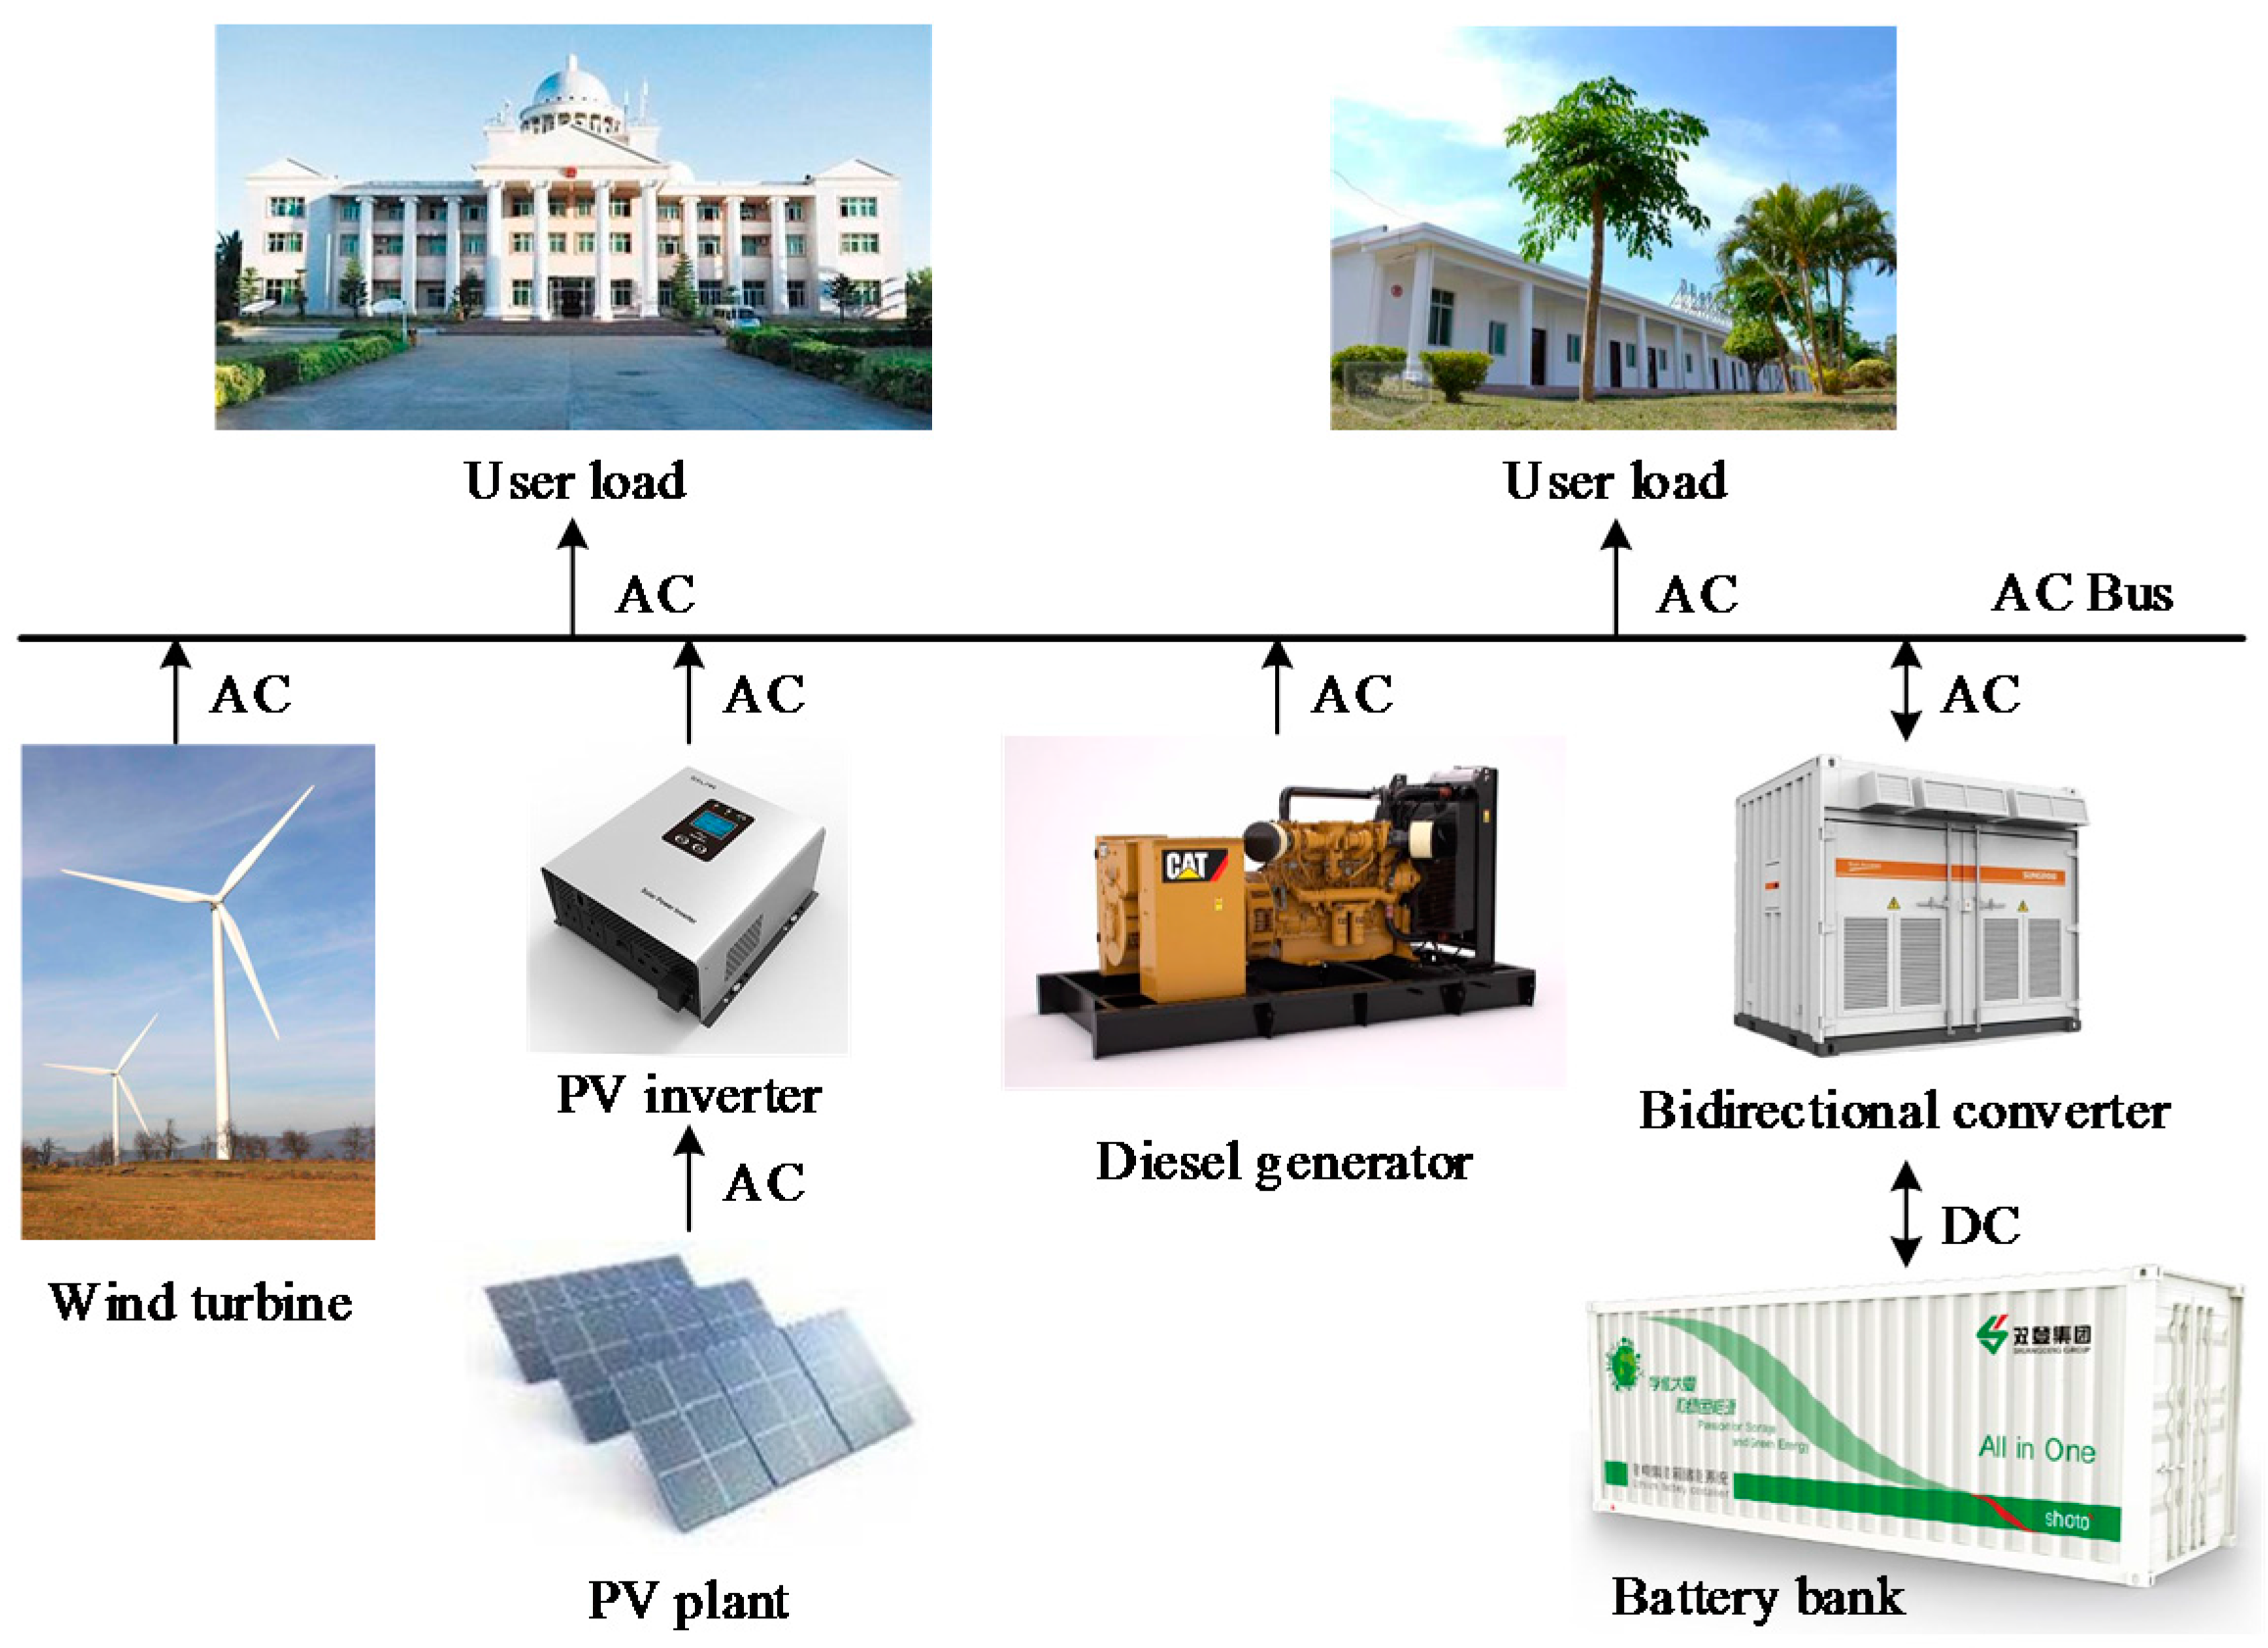
Figure 1 gives the schematic configuration of a PV/wind/battery/diesel stand-alone HES. In this system, the distributed generating units including wind turbine and PV plant are connected to the AC bus. The battery bank is integrated to the AC bus through AC/DC bidirectional converter. The diesel generator is operating as a backup power supply in order to meet the peak load of the system.
2.1. Mathematical Model of Major Components
2.1.1. Model of Photovoltaic (PV) Panel
The output power of PV panel is dependent on both the solar irradiation and the performance of the module itself. In order to improve the accuracy of estimation, the effect of ambient temperature on PV panel output should also be taken into consideration by introducing the temperature coefficient. In this way, the output power of PV panel in any given solar irradiation can be calculated with the following equation [26]:
where is the output power of PV panel, is the rated capacity of PV panel, is the derating factor used to compensate the reduction in power output due to wiring losses, aging and dust covering, is the solar irradiation incident on the PV panel, is the temperature coefficient, is the PV panel temperature, which can be calculated by Equation (2) as [27]:
where is the ambient temperature, is the nominal operating cell temperature, is the efficiency at standard test condition.
In this paper, the bifacial PV panel, TwinMax 60 Cell manufactured by Yingli Solar is used as a promising option to increase the output power per unit of PV array, the specifications of selected PV panel are presented in Table 1.
2.1.2. Model of Wind Turbine (WT)
In this paper, the FD16-30 is adopted as the wind energy conversion system. This is a type of direct drive permanent magnet WT manufactured by GHREPower. The actual output power of selected WT () can be calculated using the power curve (depicted in Figure 2), which is provided by manufacturer as part of the technical datasheets.
It can be found that, the actual output power directly correlates to the wind speed at hub height. Accordingly, the measured wind speed at reference height should be transformed into desired hub height using the logarithmic law as follows [28]:
where, is the wind speed at hub height, is the measured wind speed at reference height, stands for the hub height, is the reference height, is the surface roughness length.
More detailed specifications of the selected WT can be found in Table 2.
2.1.3. Model of Battery Bank
As the intermediary of energy shifting, battery bank is able to maintain the power balance of HES by either storing the excess energy or supplying the power deficit in different operation modes.
For the present study, the battery bank is composed of Narada GFM-800RC lead-acid batteries with nominal capacity and efficiency of 1.92 kWh and 86%, respectively. Usually, the number of batteries is calculated according to the average load demand and the autonomy-hour (AH) by using the following equation [29]:
where is the number of batteries, is the average load demand, is the autonomy-hour, and are the nominal capacity and roundtrip efficiency of batteries, respectively, is the depth of discharge, which takes the value of 70% based on the technic specification from manufacture.
In addition, the state of charge (SOC) of battery is determined by the total available energy and the load demand with the following formulation:
where is the state of charge of battery, is the total available energy, is the load demand, is the capacity of battery bank.
For each working hour, the physical constraints of battery bank shown in Equation (6), should be satisfied in order to prevent batteries from degradation due to overcharge or excessive discharge.
where and are the minimum and maximum state of charge, respectively. and are the charging and discharging power, respectively. and are the maximum charging and discharging power of battery bank, respectively. The specifications of selected battery are shown in Table 3 [30]:
2.1.4. Model of Diesel Generator
The hourly fuel consumption of diesel generator is one of the most important parameters in HES designing, since both the pollutant emission and the operating cost are directly dependent on diesel consumption. For each time step, the fuel consumption rate of diesel generator can be written as follows [31]:
where is the fuel consumption rate of diesel generator, and are constant parameters representing the intercept coefficient and slope of the fuel curve; and are the rated and real output power of diesel generator, respectively.
2.2. Control Strategy
Considering the stochastic nature of renewable generation and load demand, the load following strategy (LFS) is adopted as the control strategy for the proposed stand-alone HES. For LFS, the energy generated from renewable power system or stored in battery bank should be the first choice. The diesel generator will be called upon whenever there is a power deficit between the total available power generation and the load demand, this is a mandatory operating state to provide reliable power supply and prevent batteries from degradation. However, the diesel generator will offer just enough power to meet the power deficit, and the charging of battery bank is still dependent on renewable energy. The net power of HES is defined as follows:
where, is the net power of HES. In order to describe the control strategy of the proposed HES, the flowchart of control strategy is shown in Figure 3.
3. Problem Formulation
3.1. Evaluation Indices
As the fundamental of evaluation, numerous indices were recommended to assess the operation characteristics of HES [33]. In the present study, four indices are chosen for the reliability, economic, practical and environmental assessment, which are discussed as follows:
3.1.1. Reliability Index
For a given HES, a power deficit is inevitable when the total available power generation is less than the load demand. In such case, Loss of Power Supply Probability (LPSP) is a widely used index to quantify the stability of HES on a yearly basis. LPSP is defined as the ratio of the total unmet load to the total electric load demand. It can be described by the following equation [34]:
where is the number of hours during a year, here H = 8760, is the total electric load demand, is the unmet load in hour , which can be expressed with the following equation:
where is the load demand in hour , is the total available power generation in hour .
Moreover, Loss of Load Expected (LOLE) is introduced as a reliability constraint in this paper, LOLE is the total hours of interruption when the power generation is unable to meet the load demand, which can be descried by the following equation [35]:
where indicates the power deficit sign in hour , which is defined by:
According to the regulations presented by the State Grid Corporation of China, LOLE should not exceed 8 h [36].
3.1.2. Economic Index
Being widely recognized as a convenient metric for economic evaluation between different HES, levelized cost of energy (LCOE) is defined as the ratio of the total annualized cost of power generation to the total electric load demand [37]. The mathematical formulation of LCOE is given by:
denotes the total annualized cost of power generation which can be calculated as follows:
where TNPC is the total net present cost of HES which includes all of the costs as well as revenues incurred over the project lifetime such as initial capital costs, O&M costs, replacement costs, fuel costs and salvage value. signifies the capital recovery factor (CRF), which is utilized to convert the present value into the equal annual cash flows. The equation of CRF can be described as follows:
where and are the real discount rate and number of years, respectively.
3.1.3. Practical Index
Considering the limited land space of a remote island, the occupied area (OA) of HES is regarded as an important index for practical assessment. According to the shape data of the distributed generating units, the occupied area of a wind turbine is 191 m2, the occupied area of a PV array is 141 m2 (each PV array contains 66 PV panels with a rated capacity of 27.885 kWp), the occupied area of a battery bank is 14.77 m2 (there are 274 batteries in one battery bank). OA of HES can be described as follows:
where is the capacity of PV plant, is the number of wind turbines.
3.1.4. Environmental Sustainability Index
Renewable fraction (RF) is the percentage of total electric load demand covered by energy generated from renewable sources per year. RF of 100% represents an ideal condition that HES works based on renewable energy only. On the contrary, RF of 0% shows a situation that the power generation from diesel generator is equivalent to the total electric load demand. The RF can be formulated as follows [38]:
where is the energy generated from renewable sources per year.
3.2. Objective Function
From a practical perspective, it is necessary to choose the best compromise configuration of HES in terms of all the above-mentioned indices. For this reason, a multi-objective function is proposed by adopting the weighted sum method, which collects multiple indices into a single aggregate function as follows:
where () is the weighting factor for the ith index. All of the indices are normalized, and the higher value the better performance.
The weighted sum method has been proven as an effective methodology for ranking alternatives based on the rating values, which are calculated through summing up the product of each index and their weighting factors. Thus, the determination of weighting factors should be handled carefully since the value of weighting factors represents the relative importance of each index. In this paper, the entropy weight method is employed as a quantitative method to calculate the value of weighting factors in an objective and reasonable manner.
4. Methodology
4.1. Entropy Weight Method
The entropy weight method is derived from the Shannon entropy, which was first proposed as a quantitative measurement of uncertainty in the information system [39]. For this method, the weighting factors are purely dependent on the value of indices rather than human subjective assessment. Hence, it has been recognized as an objective method for weight calculation. Here, the main steps of entropy weight method are discussed as follows [40]:
- Step 1: Initialization of the decision matrix. Assuming that there are alternatives need to be evaluated in terms of indices, the initial decision matrix can be established as follows:
- Step 2: Normalization of the decision matrix. In order to solve the uniformity of indices’ units, the normalization of all indices is performed. For benefit type, the higher value the better performance, the normalization can be conducted by the listed expression [41]:For cost type, the lower value the better property, the normalization can be conducted by the listed expression:Then, the normalized decision matrix can be obtained.
- Step 3: Calculation of weighting factors. The information entropy of each index is calculated by:where is the information entropy of each index, can be calculated by:Based on the value of the information entropy, the weighting factors of each index can be calculated by:where and .
4.2. Description of the Proposed Method
Obviously, the application of the entropy weight method significantly enhances the objectivity of weighting factors calculation. However, for entropy weight method, accurate and sufficient data is the premise of computation. In this regard, HOMER is capable of performing a comprehensive simulation of HES and providing various system operation data in detail. Hence, by making full advantages of both the entropy weight method and the excellent performance of HOMER, an effective decision making methodology which aims at searching the best trade-off solution from a set of feasible configurations is proposed. In order to concisely explain the proposed methodology, the main steps are given below:
- Step 1: System simulation with HOMER. Several types of data including load profile, component specifications, meteorological data, system control, search space, and constraints are fed into HOMER. After that, every feasible combination in search space will be simulated in each time step of the year, and the desired output such as LPSP, LCOE, OA and RF will be calculated for further use.
- Step 2: Evaluation system establishment. Multi-objective function is carried out by adopting the weight sum method. Then, weighting factors of each index is calculated according to the output data obtained from previous step.
- Step 3: Decision making process. The rating values of each feasible configuration is calculated by multiplying the index value and corresponding weighting factors. Finally, the configuration with maximum rating value will be recommended as the optimal one.
5. Results and Discussions
5.1. Case Study
The proposed method was adopted for optimal design of a stand-alone HES in Yongxing Island, China, which is one of the remote islands located in The South China Sea (11.84° N latitude and 112.34° E longitude).
The meteorological data including monthly average solar irradiation, wind speed and ambient temperature of Yongxing Island are obtained from NASA atmospheric database [42]. The annual average solar irradiation and wind speed are 5.57 kWh/m2/day and 7.29 m/s, respectively.
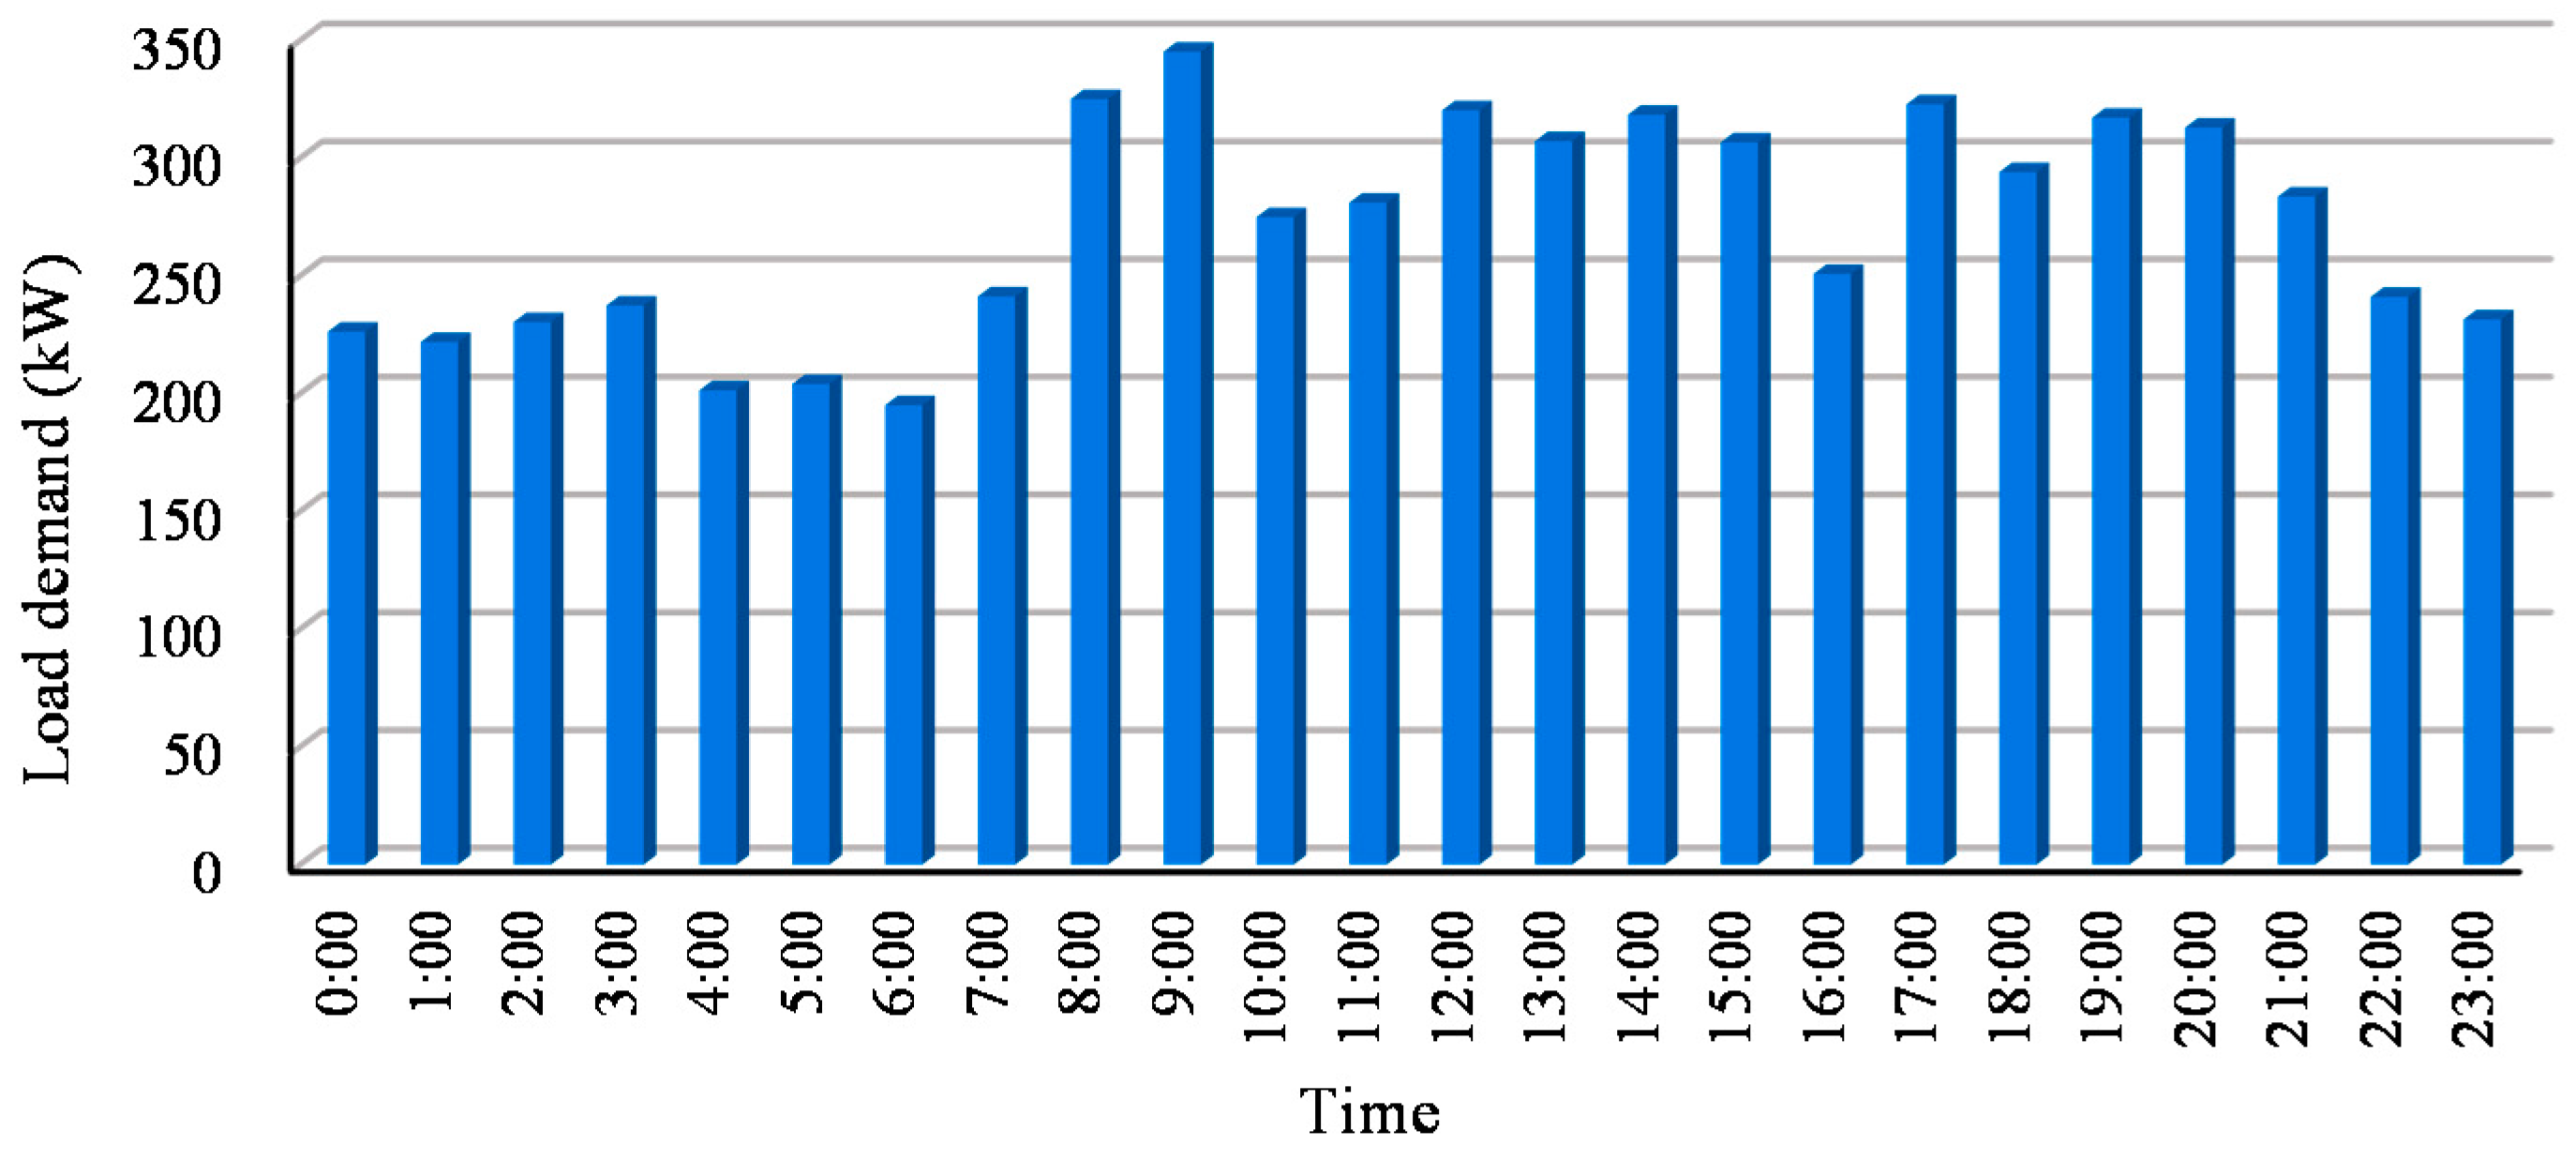
The typical daily load profile is taken from the existing energy management system on Yongxing Island. As shown in Figure 4, the average and peak load are 269.5 kW and 345.2 kW, respectively. The load profile maintains in the vicinity of 200 kW from 11 p.m. to 6 a.m., accounting for about 60% of the total capacity of the system due to many refrigeration equipment operates around the clock under the high annual average temperature (26.1 °C). Moreover, the price of fossil fuel is 1.38 $/L since high transport costs.
According to the specifications of selected battery in Table 3 and Equation (4), each autonomy-hour corresponds to approximately 234 batteries (about 449 kWh of the capacity of battery bank). The minimum is assumed to be 1 h to offer the emergency power supply for HES.
Given the land planning of Yongxing Island, the maximum OA for PV panel and wind turbine installation are 4800 m2 and 4250 m2, respectively. Therefore, the rated power of PV panel is set between 0 kWp to 948.09 kWp (correspond to 4794 m2) with a step size of 55.77 kWp, the rated number of wind turbine is predefined from 0 to 22 (correspond to 4202 m2) with a step size of 1, and the is set between 1 h to 5 h with a step size of 1 h, which means there are 2070 configurations in the search space and to be simulated by HOMER.
5.2. Economic Analysis
In order to investigate the economic performance of proposed HES, Figure 5 gives the LCOE for different sizes of PV panels and wind turbines (with ), which are calculated according to the simulation results obtained from HOMER.
As shown in Figure 5, the LCOE decreases gradually with the increasing size of PV panels and wind turbines, and reaches the lowest value at the sizing point of PV = 613.47 kWp and WT = 15. For this reason, HES is economically feasible comparing with the conventional diesel generator system with the assumption of using the same generator (correspond to the sizing point of PV = 0 kWp, WT = 0). Moreover, LCOE of the economic best scenario (PV = 613.47 kWp, WT = 15, AH = 2) is 0.25 $/kWh, the reduction is as high 43.6% as compared to the conventional diesel generator system.
5.3. Environmental Analysis
Figure 6 shows the RF for different sizes of PV panels and AH (with WT = 15). It is obvious that, the application of the proposed HES is beneficial for environment since the majority of scenarios reach RF more than 50%. Meanwhile, with the same number of wind turbines, the more capacity of PV panels, the more penetration of renewable power is achieved. Besides, from the environmental perspective, it is more reasonable to meet the power deficit by expanding the capacity of battery bank, rather than utilizing the backup diesel generator and burning fossil fuel. Thus, the RF would reach the maximum value of 97.08% at the sizing point of PV = 948.09 kWp, WT = 22 and AH = 5, which are the upper limit for each component.
5.4. Optimal Design of HES
In the beginning of the optimization process, both the information entropy and the weighting factors of each index are calculated based on the simulation data obtained from HOMER and the entropy weight method. Calculation results are presented in Table 5.
As mentioned in Section 4.1, the information entropy is a quantitative measurement of uncertainty. Hence, when the ith index has more disorder rating values, its information entropy is lower, and the weighting factor is higher, which means this index provides more valuable information from the viewpoint of information theory, and should be especially considered. In this regard, the practical index OA which possesses the lowest value of information entropy among all the indices, can be regarded as the most important factor for the objective function. Eventually, according to the rating values of each alternative, the configuration with a PV panel capacity of 613.47 kW, wind turbine number of 9 and battery bank capacity of 1796 kWh is recommended as the best configuration.
In order to demonstrate the effectiveness of the proposed method, three scenarios have been created with different indices:
- Scenario 1: The most economical scenario. Only LCOE is taken into consideration, and the rest of the indices in Equation (18) are neglected. Configuration with least LCOE would be recognized as the most economical scenario.
- Scenario 2: The most practical scenario. According to simulation results from HOMER, there are only 1941 feasible configurations compliant with the regulations presented by the State Grid Corporation of China (LOLE ≤ 8). Among them, the configuration with least OA would be recognized as the most practical scenario.
- Scenario 3: The environmental best scenario. This scenario is similar to the most economical one, except the index is composed of RF only, and the configuration with maximum RF would be recognized as the environmental best scenario.
Here, simulation results of abovementioned scenarios and the best configuration are presented in Table 6.
Apparently, there are prominent differences in the indices of different scenarios. In terms of system reliability, LOLE of the best configuration is 0 h, indicating that the best configuration is able to provide a reliable and sustainable power supply. Besides, comparing to the most economical scenario, LCOE of the best configuration increase 4.18% only, whereas OA decrease over 25%, meaning that the best configuration achieves an excellent trade-off between economic and practical performance of HES. Moreover, in the best configuration, renewable energy provides the majority of total electric load demand (81%), by contrast, duo to the environmental best scenario suggests more capacity of distributed generating units, the capacity of PV panels and wind turbines are 54.5% and 144% more than that of the best configuration. Furthermore, although OA of the best configuration is six times of the most practical solution, the best configuration which only covers an area of 3361 m2 (about 2% of the island area), still has a high practicability. Therefore, we can draw a conclusion that the best configuration can be recognized as the best trade-off solution among system reliability, economy, practicability and environmental sustainability.
5.5. Analysis of the Best Configuration
For the best configuration, the percentage of power generation from PV panels, wind turbines and diesel generator over a year are exhibited in Figure 7. The system mainly works on PV panels and wind turbines, with a high penetration of energy generated from renewables. Therefore, considering the intense solar irradiation and high wind speed, the proposed HES can be considered as a promising alternative for electrification in Yongxing Island.
The cost distribution for the best configuration is illustrated in Figure 8. Apparently, with enormous cost of fossil fuel which is caused by high transportation expenses, the cost of diesel generator accounting for 38.89% of total costs is the highest among all of these distributed generating units. In contrast, despite generating about 43.6% of the system’s total power generation, the cost of PV panel is still lower than that of diesel generator, which signifies the fact that the PV panel is the most cost-effective choice for power generation in the study area. It is noteworthy that battery bank covers 15.64% of total costs, due to the expensive replacement cost and the short life of batteries caused by frequent charging and discharging operation for power balancing.
5.6. Sensitivity Analysis
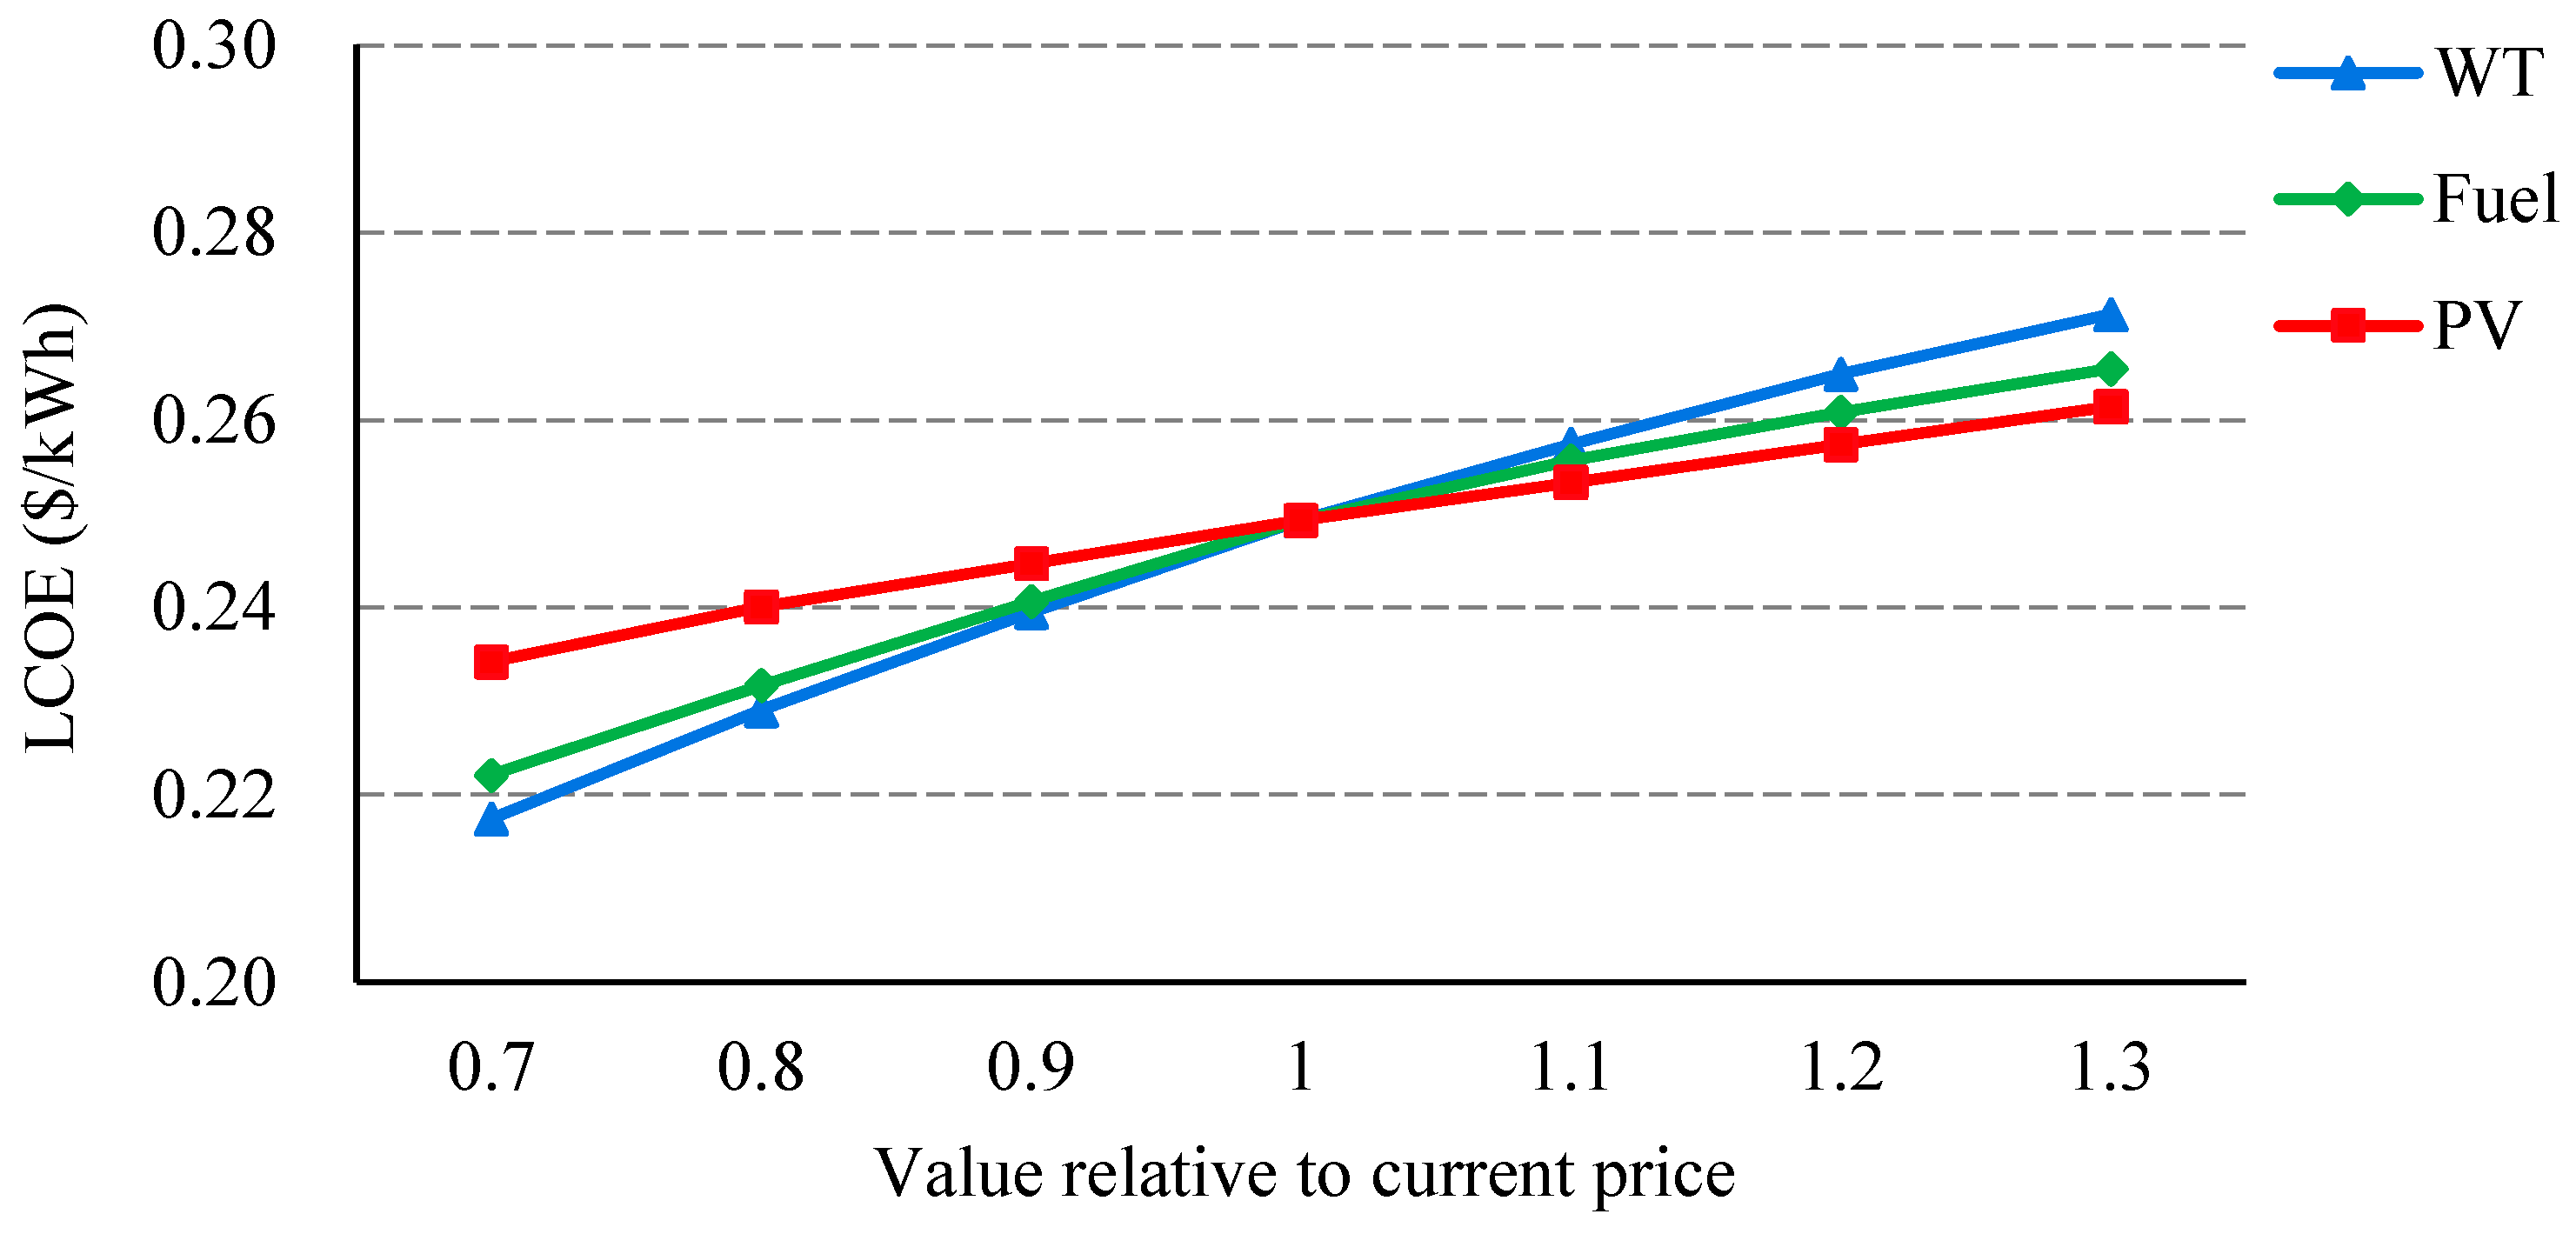
Sensitivity analysis is utilized to confirm how the results are affected according to the sensitivity variables. Multiple economic parameters such as the cost of PV panel, wind turbine, as well as fossil fuel are selected as the main sensitivity variables, which range from 30% below to 30% above the current price. The spider graph in Figure 9 gives the result of economic sensitivity analysis. Comparing the three lines, it can be seen that, LCOE is most sensitive to the cost of wind turbine, since its line is steeper than rest of the variables. In this regard, the selection of the most cost-effective wind turbine according to existing wind resource is of great importance on the economical operation of HES.
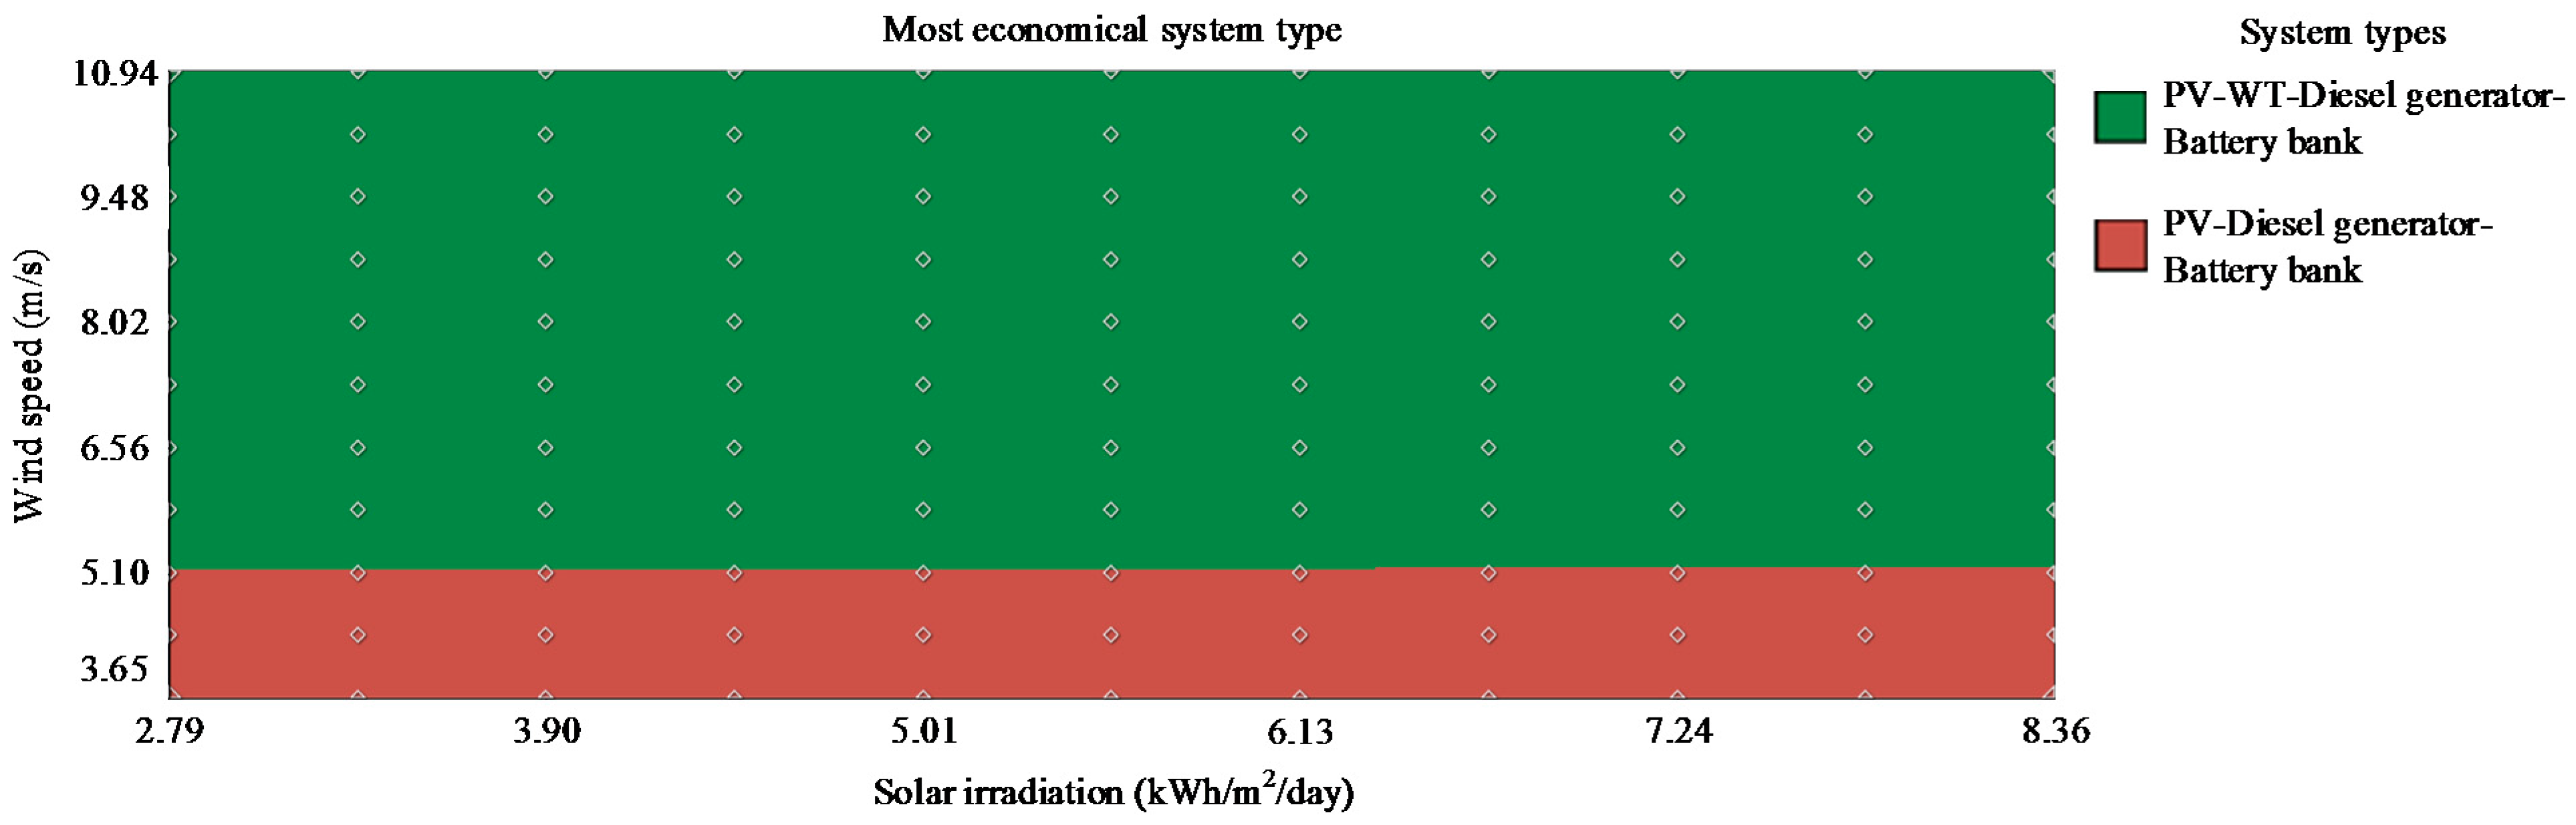
Figure 10 displays the effects of wind speed and solar irradiation on the most economical system type. As shown in the figure, a particular system type is economical at a certain wind speed or solar irradiation. Apparently, the PV-WT-Diesel generator-Battery bank system is cost-effective only when the annual average wind speed is higher than 5.1 m/s, since wind turbines start up and generate amount of electric power at such high wind speeds. By contrast, PV panel is a favorable way to tackle varying wind speed, indicating that PV panel should be integrated into the HES as long as the system is deployed in remote island like Yongxing.
6. Conclusions
The implementation of HES is generally considered as a promising alternative for electrification in remote areas. In this paper, a decision making methodology based on the weighted sum method was proposed with the aim of identifying the best trade-off configuration of HES from a set of feasible combinations obtained from HOMER.
Both the simulation and optimization results indicate that, the proposed method is able to identify the best trade-off configuration among system reliability, economy, practicability and environmental sustainability. Furthermore, the objectivity of decision-making is enhanced by employing the entropy weight method as a quantitative methodology for the calculation of weighting factors.
According to the analysis of the best configuration, PV panel can be considered as the most cost-effective component for power generation in Yongxing Island, since it accounts for approximately 43.6% of the system’s total power generation, while taking only 16.71% of total costs. The selection of the most cost-effective wind turbine according to existing wind resource is of great importance on the economical operation of HES. In terms of renewable energy resources, the PV-WT-Diesel-Battery bank system is cost-effective only when the annual average wind speed is higher than 5.1 m/s, indicating that PV panel should be integrated into the HES as long as the system is deployed in remote island like Yongxing. Finally, all the proposed models and methods are available for HES designing and optimization in any installation site.
Acknowledgments
This work is financially supported by “The national science and technology support program (supported by Ministry of Science and Technology of P.R.C. No. 2014BAC01B05)”. The authors are grateful that comments and suggestions provided by anonymous reviewers and editor helped to improve the quality of the paper.
Author Contributions
Jiaxin Lu designed the main parts of the research, including HES modeling and optimal methodology designing. Weijun Wang was responsible for guidance, a number of key suggestions, and manuscript editing. Yingchao Zhang and Song Cheng mainly contributed to the writing of the paper and also responsible for some constructive suggestions.
Conflicts of Interest
The authors declare no conflict of interest.
References
- World Bank. Sustainable Energy for All (SE4ALL) Database from World Bank Global Electrification Database. Available online: http://data.worldbank.org/indicator/EG.ELC.ACCS.ZS (accessed on 20 March 2017).
- Goodarzi, H.M.; Kazemi, M. A novel optimal control method for islanded microgrids based on droop control using the ICA-GA algorithm. Energies 2017, 10, 485. [Google Scholar] [CrossRef]
- Borhanazad, H.; Mekhilef, A.; Ganapathy, V.G. Optimization of micro-grid system using MOPSO. Renew. Energy 2014, 71, 295–306. [Google Scholar] [CrossRef]
- Yan, B.; Wang, B.; Zhu, L.; Liu, H.; Liu, Y.; Ji, X. A novel, stable, and economic power sharing scheme for an autonomous microgrid in the energy internet. Energies 2015, 8, 12741–12764. [Google Scholar] [CrossRef]
- Dufo-López, R.; Bernal-Agustín, J.L. Multi-objective design of PV-wind-diesel-hydrogen-battery systems. Renew. Energy 2008, 33, 2559–2572. [Google Scholar] [CrossRef]
- Jing, L.; Wei, W.; Ji, X. A simple sizing algorithm for stand-alone PV/Wind/Battery hybrid microgrids. Energies 2012, 5, 5307–5323. [Google Scholar]
- Ahmad, M.A.E.M.; Bekdache, S.K.; Barrios, L.A. Optimal sizing for a hybrid power system with wind/energy storage based in stochastic environment. Renew. Sustain. Energy Rev. 2016, 59, 1149–1158. [Google Scholar]
- Zhou, N.; Liu, N.; Zhang, J.; Lei, J. Multi-objective optimal sizing for battery storage of PV-based microgrid with demand response. Energies 2016, 9, 591. [Google Scholar] [CrossRef]
- Kamjoo, A.; Maheri, A.; Dizqah, A.M. Multi-objective design under uncertainties of hybrid renewable energy system using NSGA-II and chance constrained programming. Int. J. Electr. Power Energy Syst. 2016, 74, 187–194. [Google Scholar] [CrossRef]
- Kaabeche, A.; Belhamel, M.; Ibtiouen, R. Sizing optimization of grid-independent hybrid photovoltaic wind power generation system. Energy 2011, 36, 1214–1222. [Google Scholar] [CrossRef]
- Ren, H.; Zhou, W.; Nakagami, K. Multi-objective optimization for the operation of distributed energy systems considering economic and environmental aspects. Appl. Energy 2010, 87, 3642–3651. [Google Scholar] [CrossRef]
- Arun, P.; Banerjee, R.; Bandyopadhyay, S. Optimum sizing of battery-integrated diesel generator for remote electrification through design-space approach. Energy 2008, 33, 1155–1168. [Google Scholar] [CrossRef]
- Jakhrani, A.Q.; Othman, A.K.; Rigit, A.R.H. A novel analytical model for optimal sizing of standalone photovoltaic systems. Energy 2012, 46, 675–682. [Google Scholar] [CrossRef]
- Tezer, T.; Yaman, R.; Yaman, G. Evaluation of approaches used for optimization of stand-alone hybrid renewable energy systems. Renew. Sustain. Energy Rev. 2017, 73, 840–853. [Google Scholar] [CrossRef]
- Wu, Y.K.; Lee, C.Y.; Liu, L.C. Study of reconfiguration for the distribution system with distributed generators. IEEE Trans. Power Deliv. 2010, 25, 1678–1685. [Google Scholar] [CrossRef]
- Shayeghi, H.; Hashemi, Y. Application of fuzzy decision-making based on INSGA-II to designing PV-wind hybrid system. Eng. Appl. Artif. Intell. 2015, 45, 1–17. [Google Scholar] [CrossRef]
- Raji, A.; Noboru, Y. Distributed renewable generation and storage system sizing based on smart dispatch of microgrids. Energies 2016, 9, 176. [Google Scholar]
- Baghaee, H.R.; Mirsalim, M.; Gharehpetian, G.B. Reliability/cost-based multi-objective Pareto optimal design of stand-alone wind/PV/FC generation microgrid system. Energy 2016, 115, 1022–1041. [Google Scholar] [CrossRef]
- Katsigiannis, Y.A.; Georgilakis, P.S.; Karapidakis, E.S. Hybrid simulated annealing-tabu search method for optimal sizing of autonomous power systems with renewables. IEEE Trans. Sustain. Energy 2012, 3, 330–338. [Google Scholar] [CrossRef]
- Dufo-López, R.; Bernal-Agustín, J.L.; Yusta-Loyo, J.M. Multi-objective optimization minimizing cost and life cycle emissions of stand-alone PV-wind-diesel systems with batteries storage. Appl. Energy 2011, 88, 4033–4041. [Google Scholar] [CrossRef]
- Mendes, G.; Ioakimidis, C.; Ferrão, P. On the planning and analysis of integrated community energy systems: A review and survey of available tools. Renew. Sustain. Energy Rev. 2011, 15, 4836–4854. [Google Scholar] [CrossRef]
- Sigarchian, S.G.; Paleta, R.; Malmquist, A. Feasibility study of using a biogas engine as backup in a decentralized hybrid (PV/wind/battery) power generation system—Case study Kenya. Energy 2015, 90, 1830–1841. [Google Scholar] [CrossRef]
- Chauhan, A.; Saini, R.P. Techno-economic feasibility study on integrated renewable energy system for an isolated community of India. Renew. Sustain. Energy Rev. 2016, 59, 388–405. [Google Scholar] [CrossRef]
- Kusakana, K. Techno-economic analysis of off-grid hydrokinetic-based hybrid energy systems for onshore/remote area in South Africa. Energy 2014, 68, 947–957. [Google Scholar] [CrossRef]
- Bahramara, S.; Moghaddam, M.P.; Haghifam, M.R. Optimal planning of hybrid renewable energy systems using HOMER: A review. Renew. Sustain. Energy Rev. 2016, 62, 609–620. [Google Scholar] [CrossRef]
- Ding, M.; Wang, B.; Zhao, B.; Chen, Z.N. Configuration optimization of capacity of standalone PV-wind-diesel-battery hybrid microgrid. Power Syst. Technol. 2013, 37, 575–581. [Google Scholar]
- Li, G.; Liu, W.; Jiao, B.; Wang, C. Multi-objective optimal planning design method for stand-alone microgrid system. Proc. CSEE 2014, 34, 524–536. [Google Scholar]
- Manwell, J.F.; Mcgowan, J.G.; Rogers, A.L. Wind Energy Explained: Theory, Design and Application; Wiley: Hoboken, NJ, USA, 2006. [Google Scholar]
- Azaza, M.; Wallin, F. Multi objective particle swarm optimization of hybrid micro-grid system: A case study in Sweden. Energy 2017, 123, 108–118. [Google Scholar] [CrossRef]
- Mamaghani, A.H.; Escandon, S.A.A.; Najafi, B. Techno-economic feasibility of photovoltaic, wind, diesel and hybrid electrification systems for off-grid rural electrification in Colombia. Renew. Energy 2016, 97, 293–305. [Google Scholar] [CrossRef]
- Tazvinga, H.; Zhu, B.; Xia, X. Energy dispatch strategy for a photovoltaic-wind-diesel-battery hybrid power system. Sol. Energy 2014, 108, 412–420. [Google Scholar] [CrossRef]
- Khan, M.R.B.; Jidin, R.; Pasupuleti, J. Optimal combination of solar, wind, micro-hydro and diesel systems based on actual seasonal load profiles for a resort island in the South China Sea. Energy 2015, 82, 80–97. [Google Scholar] [CrossRef]
- Acuña, L.G.; Padilla, R.V.; Mercado, A.S. Measuring reliability of hybrid photovoltaic-wind energy systems: A new indicator. Renew. Energy 2017, 106, 68–77. [Google Scholar] [CrossRef]
- Bakelli, Y.; Arab, A.H.; Azoui, B. Optimal sizing of photovoltaic pumping system with water tank storage using LPSP concept. Sol. Energy 2011, 852, 288–294. [Google Scholar] [CrossRef]
- Maheri, A. Multi-objective design optimisation of standalone hybrid wind-PV-diesel systems under uncertainties. Renew. Energy 2014, 66, 650–661. [Google Scholar] [CrossRef]
- State Grid Corporation of China. Power Grid Standards. Available online: http://www.sgcc.com.cn/fgbz/dwbzgf/default.shtml (accessed on 3 October 2017).
- Bortolini, M.; Gamberi, M.; Graziani, A. Economic and environmental bi-objective design of an off-grid photovoltaic-battery-diesel generator hybrid energy system. Energy Convers. Manag. 2015, 106, 1024–1038. [Google Scholar] [CrossRef]
- Wang, S.; Li, Z.; Wu, L. New metrics for assessing the reliability and economics of microgrids in distribution system. IEEE Trans. Power Syst. 2013, 28, 2852–2861. [Google Scholar] [CrossRef]
- Shannon, C.E.; Weaver, W. The Mathematical Theory of Communication; The University of Illinois Press: Urbana, IL, USA, 1947. [Google Scholar]
- Jian, L.; Zhiman, H.; Youyuan, W.; Jinzhuang, L.; Linjie, Z. A two-dimensional cloud model for condition assessment of HVDC converter transformers. Energies 2012, 5, 157–167. [Google Scholar]
- Ji, Y.; Huang, G.H.; Sun, W. Risk assessment of hydropower stations through an integrated fuzzy entropy-weight multiple criteria decision making method: A case study of the Xiangxi River. Expert Syst. Appl. 2015, 42, 5380–5389. [Google Scholar] [CrossRef]
- Atmospheric Science Data Center. Available online: https://eosweb.larc.nasa.gov/ (accessed on 13 March 2017).
Figure 1.
Schematic configuration of a PV/wind/battery/diesel stand-alone HES.

Figure 2.
The power curve of FD16-30.
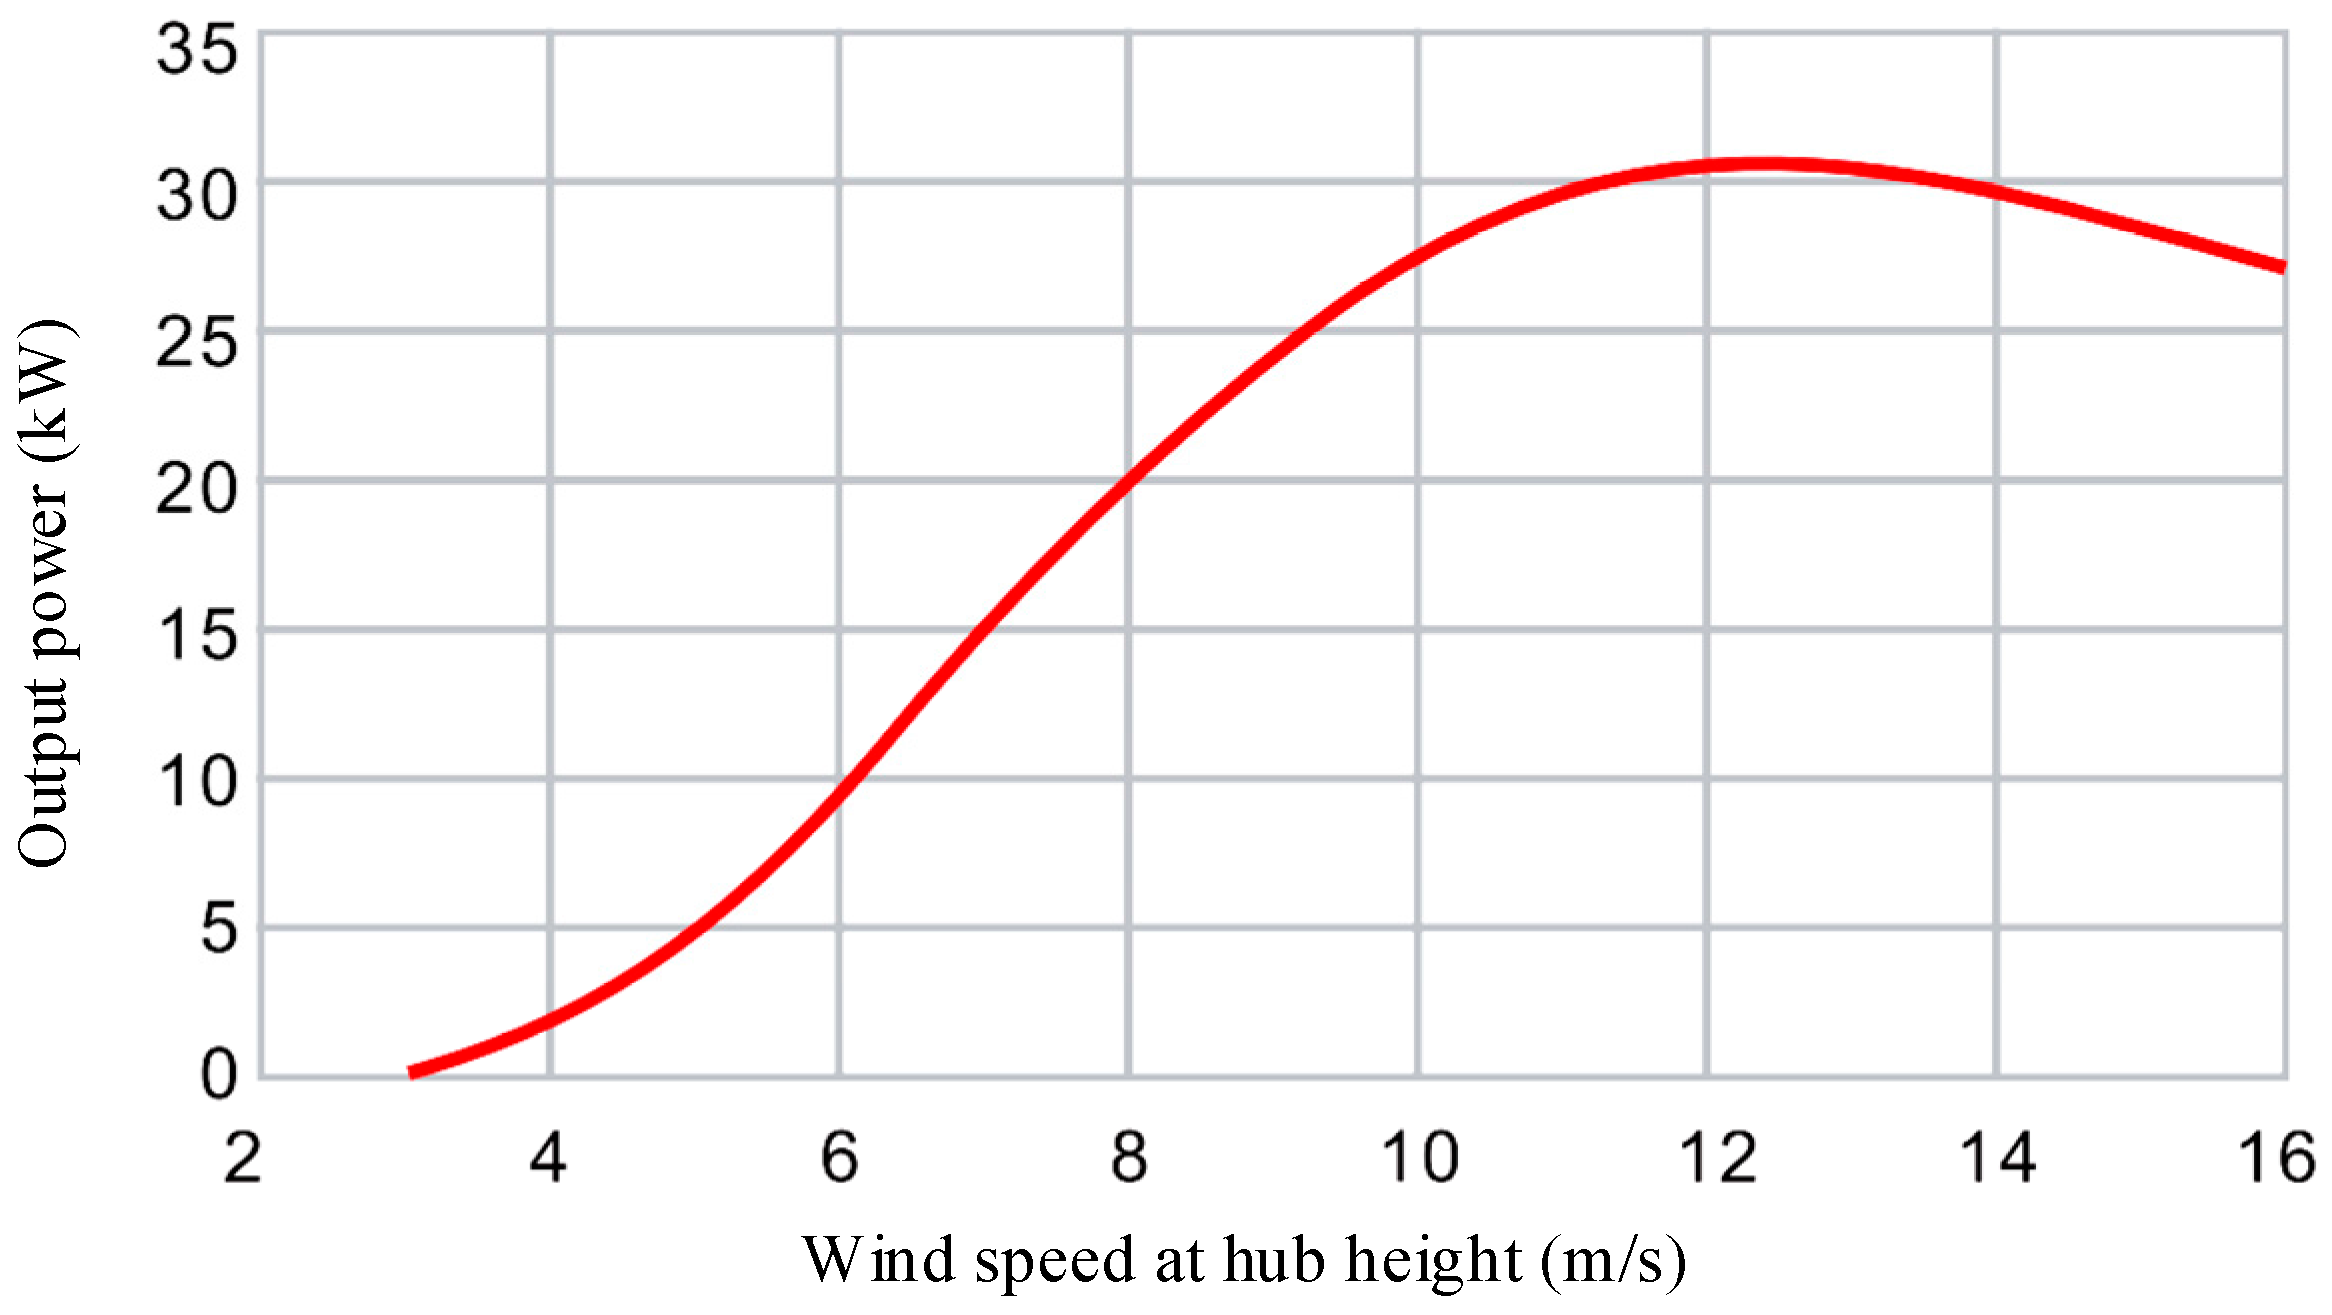
Figure 3.
The flowchart of control strategy.
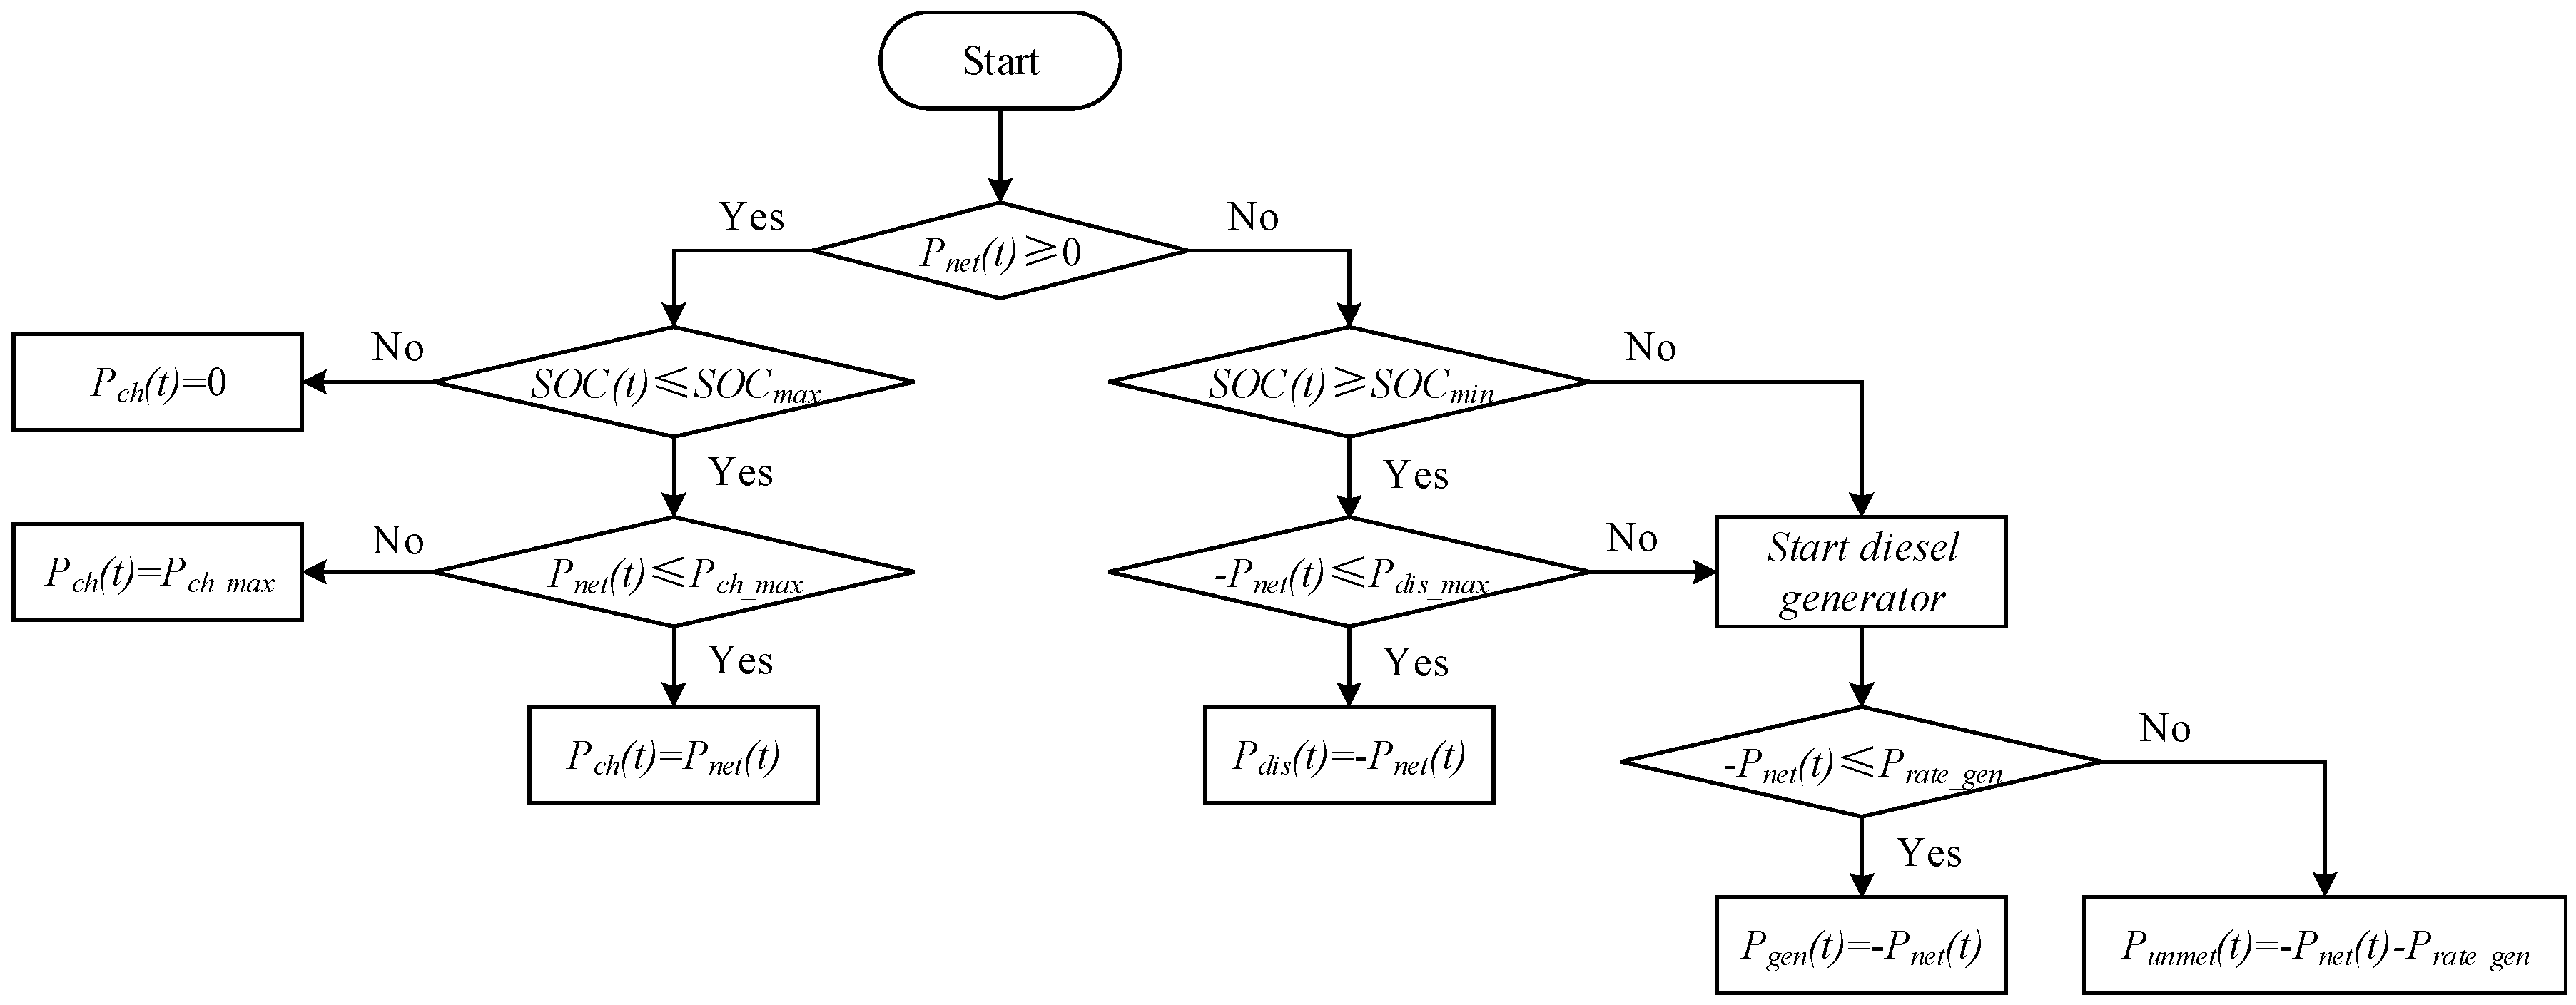
Figure 4.
Typical daily load profile for Yongxing Island.

Figure 5.
LCOE for different sizes of PV panels and wind turbines.
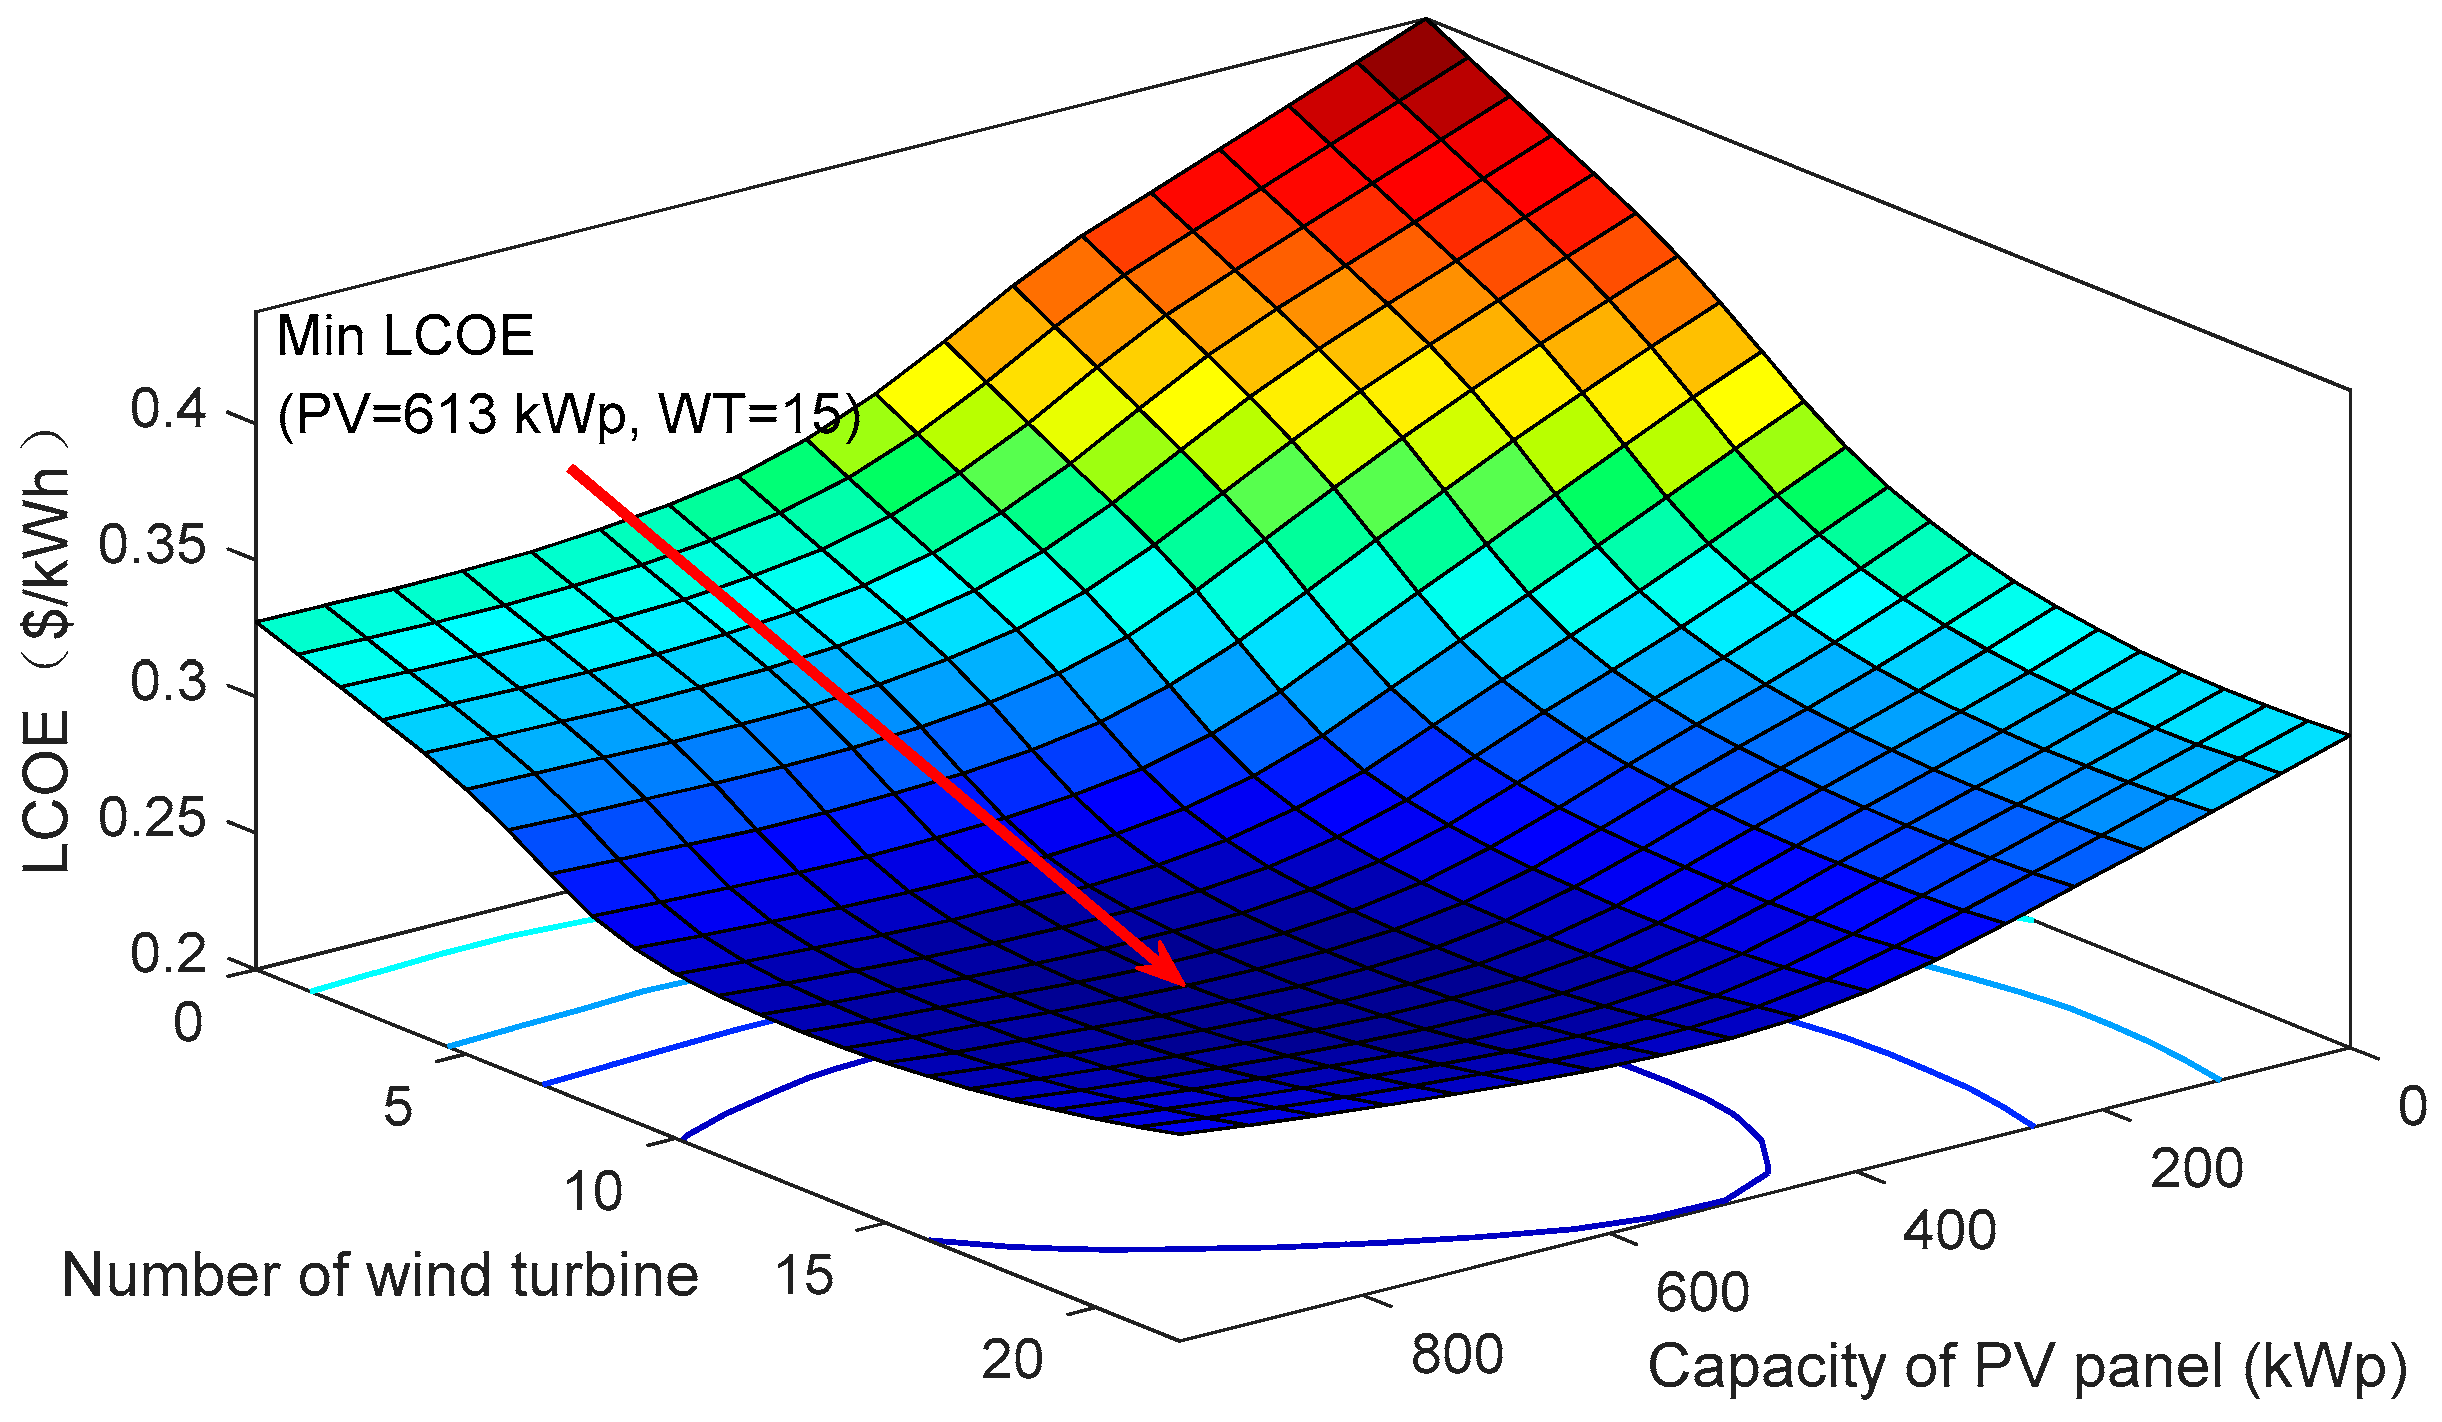
Figure 6.
RF for different sizes of PV panels and autonomy-hour.
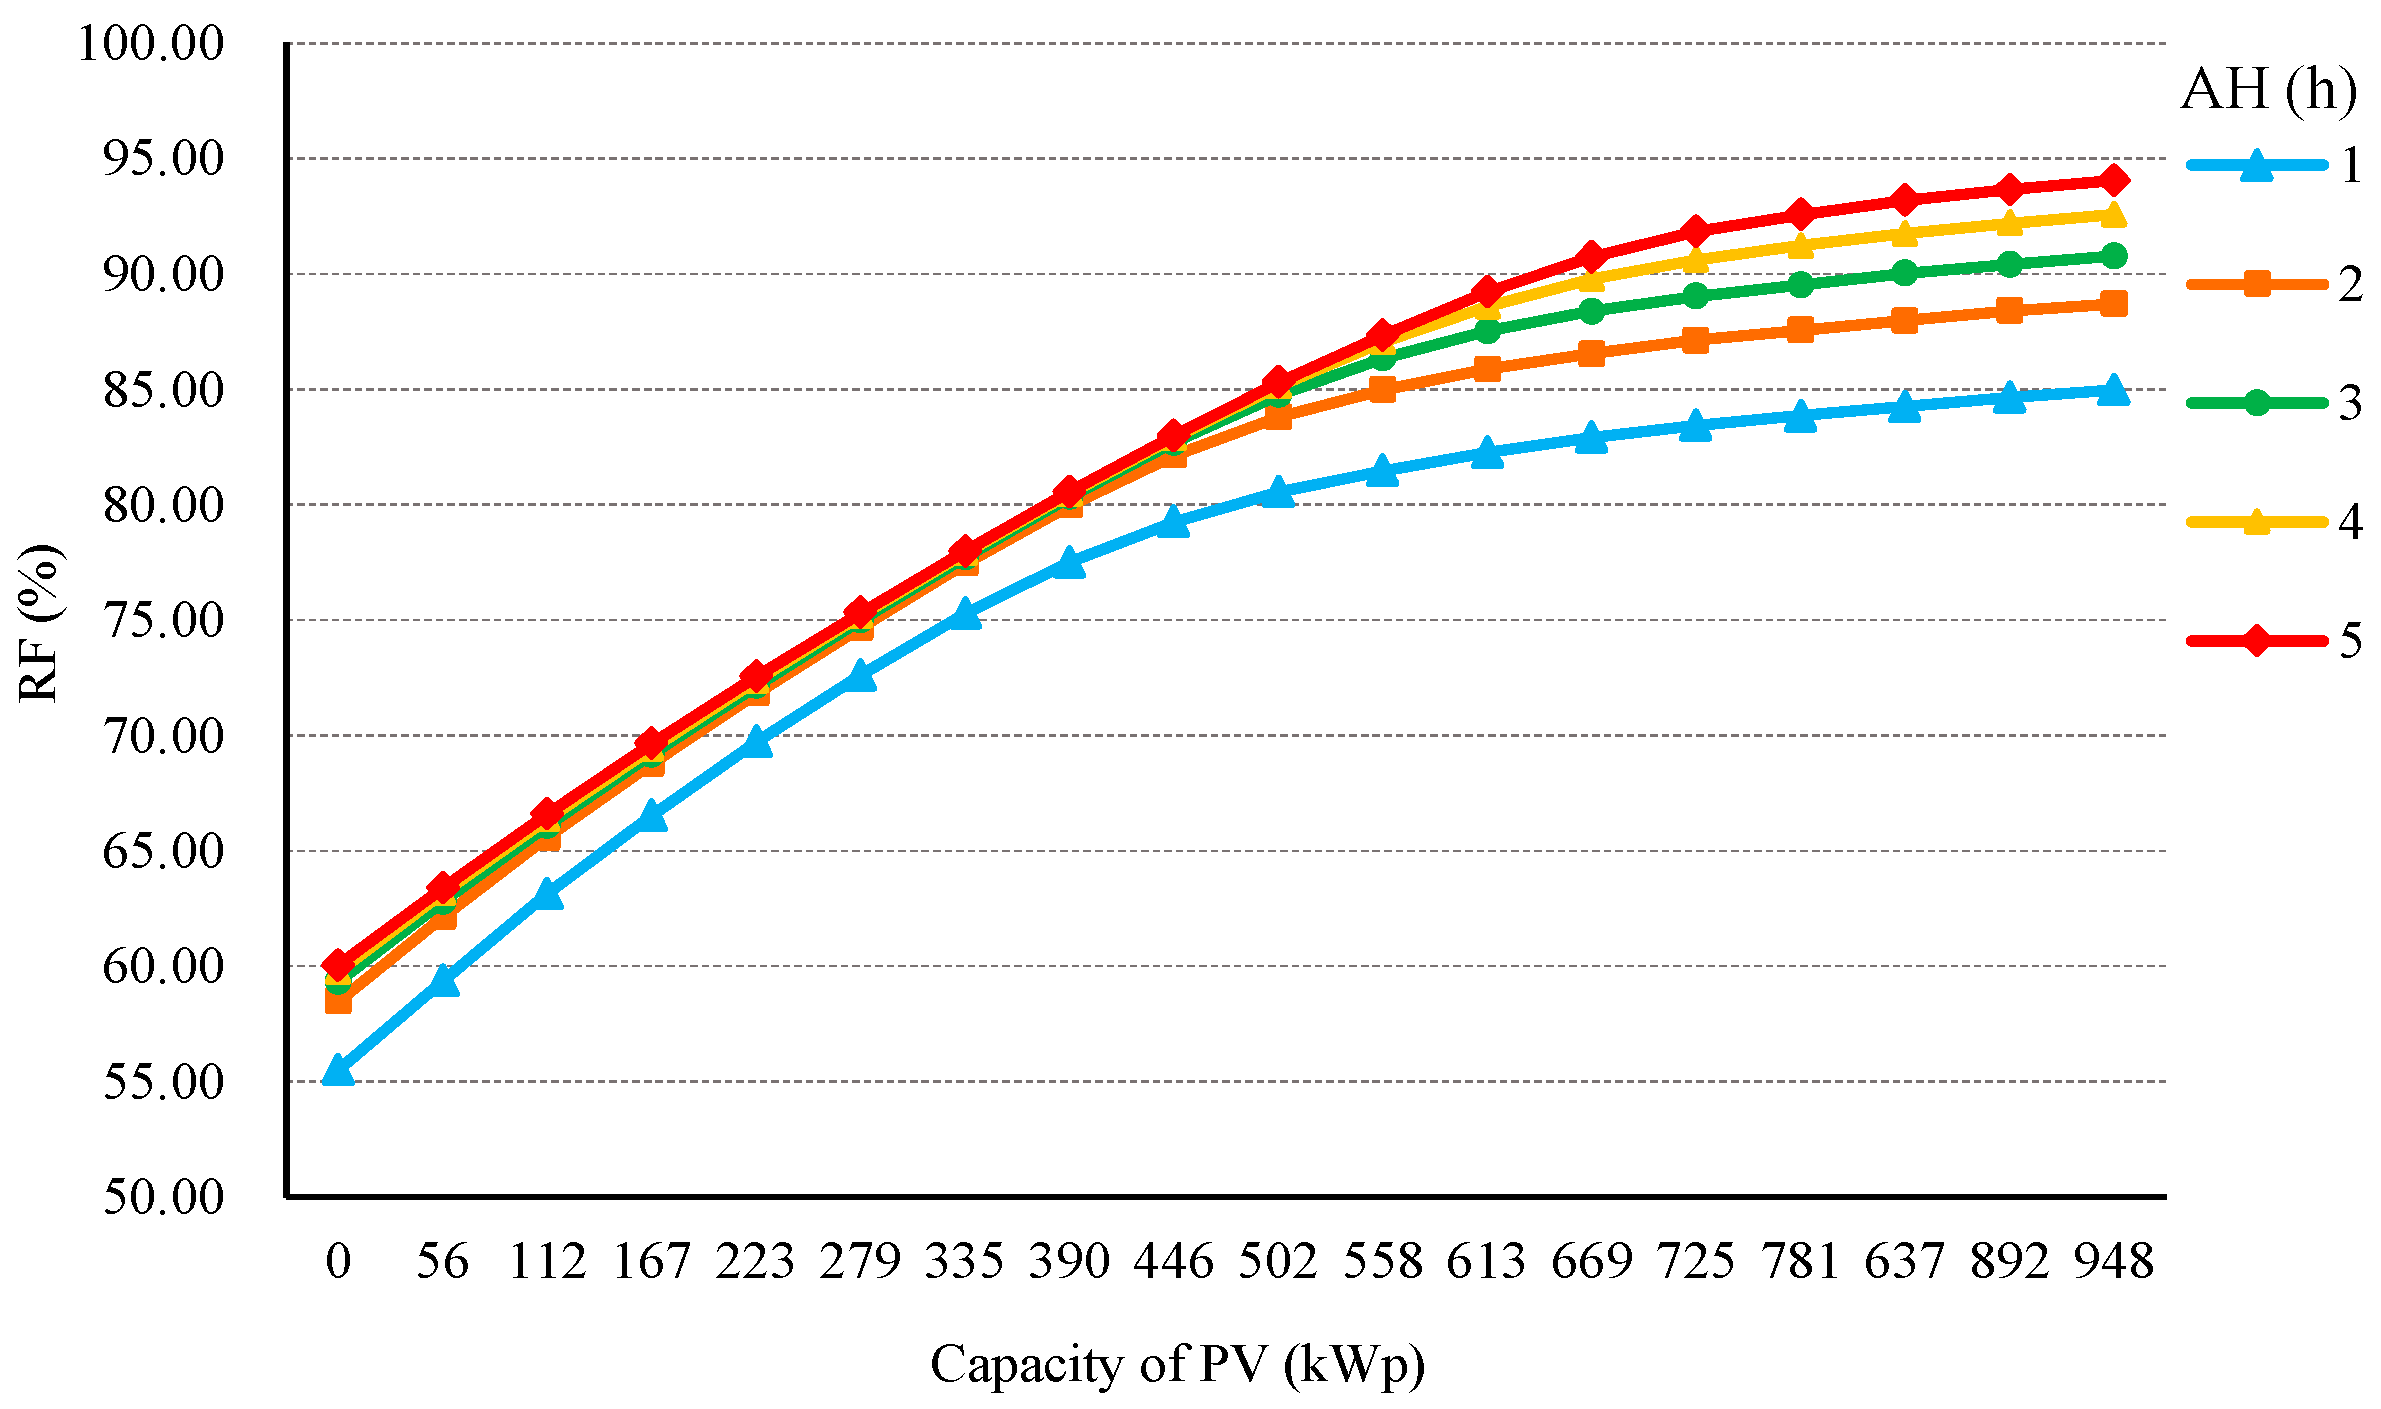
Figure 7.
HES power distribution for the best configuration.
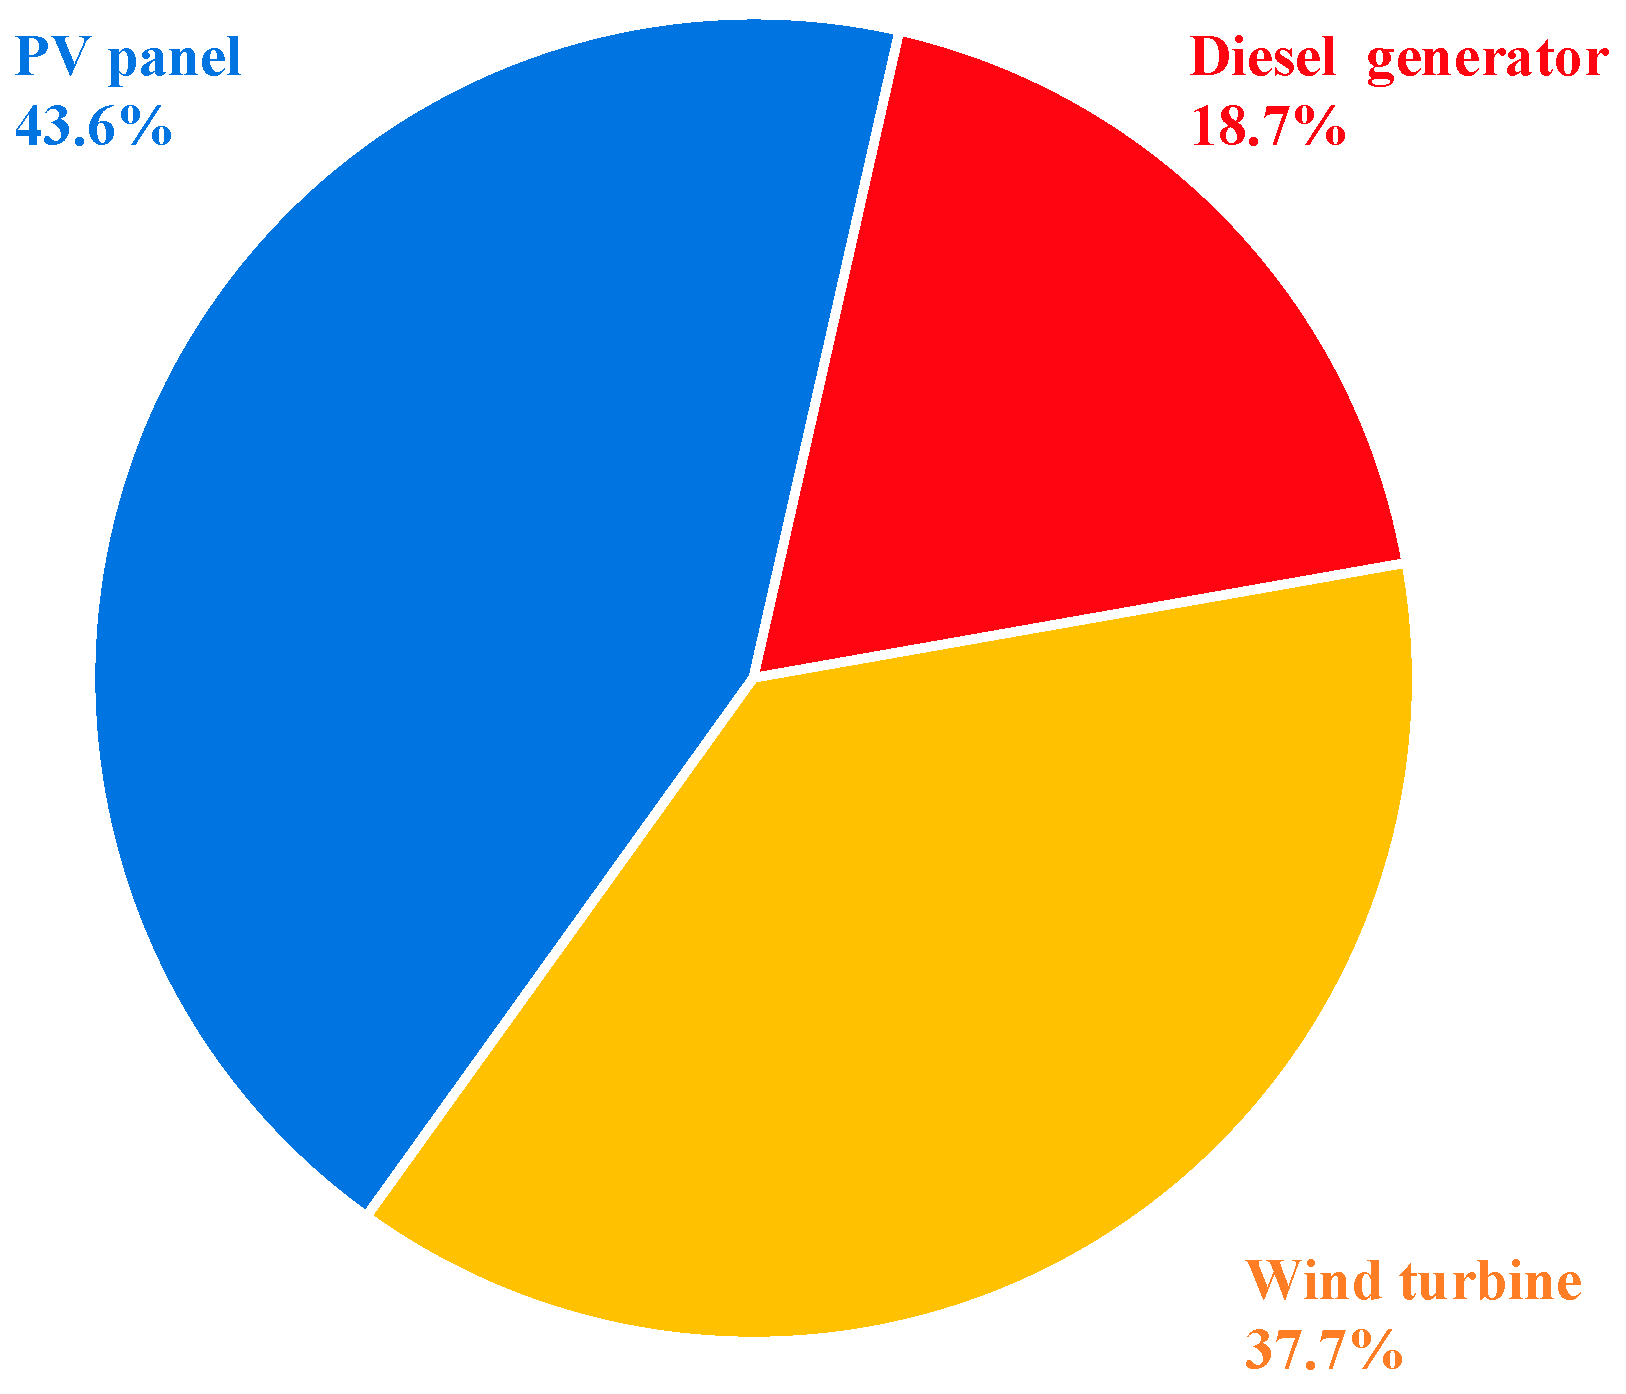
Figure 8.
HES cost distribution for the best configuration.

Figure 9.
Economic sensitivity analysis.

Figure 10.
Most economical system type with different wind speed and solar irradiation.


Table 1.
Specifications of selected PV panel.
| Parameter | Value |
|---|---|
| Capital cost ($/kW) | 2250 |
| Operation and maintenance cost ($/year) | 0 |
| Replacement cost ($/kW) | 2250 |
| Derating factor (%) | 93.5 |
| Efficiency at standard test condition (%) | 19.5 |
| Nominal operating cell temperature (°C) | 46 |
| Temperature coefficient of power (%/°C) | −0.38 |
Table 2.
Specifications of selected wind turbine.
| Parameter | Value |
|---|---|
| Capital cost ($) | 96,500 |
| Operation and maintenance cost ($/year) | 8100 |
| Replacement cost ($) | 81,000 |
| Cut-in wind speed (m/s) | 3 |
| Cut-out wind speed (m/s) | 25 |
| Rated wind speed (m/s) | 13 |
| Hub height (m) | 16 |
Table 3.
Specifications of selected battery.
| Parameter | Value |
|---|---|
| Capital cost ($/battery) | 314 |
| Operation and maintenance cost ($/battery/year) | 31 |
| Replacement cost ($) | 314 |
| Nominal capacity (kWh) | 1.92 |
| Roundtrip efficiency (%) | 86 |
Table 4.
Specifications of selected diesel generator.
| Parameter | Value |
|---|---|
| Capital cost ($) | 56,000 |
| Operation and maintenance cost ($/h) | 0.277 |
| Replacement cost ($) | 40,000 |
| Minimum load ratio (%) | 30 |
| Life time (h) | 90,000 |
Table 5.
Information entropy and weighting factors of each index.
| Indices | LPSP | LCOE | OA | RF |
|---|---|---|---|---|
| Information entropy | 0.99392 | 0.991628 | 0.986248 | 0.9959 |
| Weighting factors (%) | 12.7 | 18.8 | 42.6 | 25.9 |
Table 6.
Simulation results of different scenarios and the best configuration.
| Scenarios | Most Economical | Most Practical | Environmental Best | Best Configuration |
|---|---|---|---|---|
| PV panel (kW) | 613.47 | 111.54 | 948.09 | 613.47 |
| Wind turbine | 15 | 1 | 22 | 9 |
| Battery bank (kWh) | 898 | 449 | 2245 | 1796 |
| LOLE (h/year) | 0 | 8 | 0 | 0 |
| LCOE ($/kWh) | 0.2488 | 0.405 | 0.2836 | 0.2592 |
| OA (m2) | 4505 | 506 | 6728 | 3361 |
| RF (%) | 86 | 13 | 97 | 81 |
© 2017 by the authors. Licensee MDPI, Basel, Switzerland. This article is an open access article distributed under the terms and conditions of the Creative Commons Attribution (CC BY) license (http://creativecommons.org/licenses/by/4.0/).
Share and Cite
MDPI and ACS Style
Lu, J.; Wang, W.; Zhang, Y.; Cheng, S. Multi-Objective Optimal Design of Stand-Alone Hybrid Energy System Using Entropy Weight Method Based on HOMER. Energies 2017, 10, 1664. https://doi.org/10.3390/en10101664
AMA Style
Lu J, Wang W, Zhang Y, Cheng S. Multi-Objective Optimal Design of Stand-Alone Hybrid Energy System Using Entropy Weight Method Based on HOMER. Energies. 2017; 10(10):1664. https://doi.org/10.3390/en10101664
Chicago/Turabian StyleLu, Jiaxin, Weijun Wang, Yingchao Zhang, and Song Cheng. 2017. "Multi-Objective Optimal Design of Stand-Alone Hybrid Energy System Using Entropy Weight Method Based on HOMER" Energies 10, no. 10: 1664. https://doi.org/10.3390/en10101664
Note that from the first issue of 2016, this journal uses article numbers instead of page numbers. See further details here.