Multi-Objective Analysis of a CHP Plant Integrated Microgrid in Pakistan
by
 ,
,
Asad Waqar
* ,
,
Muhammad Shahbaz Tanveer
,
Jehanzeb Ahmad
,
Muhammad Aamir
,
Muneeb Yaqoob
and
Fareeha Anwar
Department of Electrical Engineering, Bahria University, 44000 Islamabad, Pakistan
*
Author to whom correspondence should be addressed.
Energies 2017, 10(10), 1625; https://doi.org/10.3390/en10101625
Submission received: 15 September 2017
/
Revised: 12 October 2017
/
Accepted: 13 October 2017
/
Published: 17 October 2017
(This article belongs to the Section F: Electrical Engineering)
Abstract
:In developing countries like Pakistan, the capacity shortage (CS) of electricity is a critical problem. The frequent natural gas (NG) outages compel consumers to use electricity to fulfill the thermal loads, which ends up as an increase in electrical load. In this scenario, the authors have proposed the concept of a combined heat & power (CHP) plant to be a better option for supplying both electrical and thermal loads simultaneously. A CHP plant-based microgrid comprising a PV array, diesel generators and batteries (operating in grid-connected as well as islanded modes) has been simulated using the HOMER Pro software. Different configurations of distributed generators (DGs) with/without batteries have been evaluated considering multiple objectives. The multiple objectives include the minimization of the total net present cost (TNPC), cost of generated energy (COE) and the annual greenhouse gas (GHG) emissions, as well as the maximization of annual waste heat recovery (WHR) of thermal units and annual grid sales (GS). These objectives are subject to the constraints of power balance, battery operation within state of charge (SOC) limits, generator operation within capacity limits and zero capacity shortage. The simulations have been performed on six cities including Islamabad, Lahore, Karachi, Peshawar, Quetta and Gilgit. The simulation results have been analyzed to find the most optimal city for the CHP plant integrated microgrid.
1. Introduction
During the winter season in Pakistan, natural gas (NG) is used as a primary source to supply the thermal load in the form of heating [1]. However, due to frequent outages of NG during the winter season, consumers tend to switch to electricity to fulfil their heating needs [1]. As there is an average capacity shortage (CS) of around 27% in electricity, the supply of thermal load by electricity puts an extra burden on the grid [2]. In such a situation, a microgrid along with a combined heat and power (CHP) plant represents a sensible solution to utilize the wasted heat and improving the efficiency to 75–88% [3,4,5,6,7,8]. A conventional thermal generation system has an efficiency of 25–35%, whereas the rest of energy is wasted in the form of unhealthy pollutant emissions [3,4,5,7]. A CHP plant recovers the wasted heat by using a waste heat recovery (WHR) unit, and therefore helps in controlling the greenhouse gas (GHG) emissions [5,9,10]. A microgrid with a CHP plant ensures the supply of electrical and thermal loads at the same time. Microgrids can range from small units for a single home to larger units for an entire community [4,5,6,7,11]. Moreover, a microgrid with a CHP plant can operate both in grid-connected as well as islanded modes [3,7,8]. Currently, CHP plants have broadly grabbed the attention in various countries and pilot projects are being undertaken in Europe, the U.S. and Japan [8,12].
So far, various researchers have investigated the operation of a CHP plant from certain perspectives. Guo et al. [3] have conducted research on an isolated hybrid CHP system consisting of PV/wind/gas turbine generator with vanadium redox flow battery (VRB) for the Qingshan Hu Campus of Hangzhou Dianzi University in China. With the implementation of a CHP system, the efficiency of the gas turbine was significantly improved from 29.5% to 82%. Ebara-Ballard et al. [4] have reported the steady state electrical efficiency of a combined fuel cell/CHP plant operating on NG to be 31%. For this unit, a net increase in fuel consumption and CO2 emissions was expected. However, 52% of the fuel energy was recollected in the form of heat, which has improved the energy efficiency up to 83%. Boljevic et al. [5,11] have analyzed the impact of CHP plant on thermal and electrical energy supply systems for small and medium sized enterprises. The authors have shown that the mentioned system has improved the overall efficiency of the system to around 77.6% and reduced the emissions to 57.8%. Ivanova et al. [6] have increased the efficiency of a CHP plant integrated with renewable energy sources up to 88%, by proposing a flexible operation algorithm. Bjelic et al. [12] have developed a microgrid with a CHP plant in HOMER to assess the lowest total net present costs (TNPC) under the variation of CO2 reduction constraint. Ren et al. [13] have evaluated the economic as well as environmental effects of distributed energy resources (DER) on the power system by using a multi-objective linear programming (MILP) technique. An eco-campus in Japan was selected for case study while considering PV, fuel cell and gas turbine for the satisfaction of both electrical and thermal loads. Hossain et al. [14] have improved the efficiency of a diesel generator by utilizing the waste heat of a 4-stroke 4-cylinder water cooled direct injection Hino W04D internal combustion engine (usually known as diesel engine coupled with 50 kVA generator-set considering ammonia and HFC-134a), and finally compared their results with water. Hopulele et al. [15] have worked in the field of combined cool, heat and power (CCHP) plant using genetic algorithm and used HOMER as an optimization tool. The system has fulfilled 90% of electrical load and 75% of thermal load. Surdu et al. [16] have developed an optimization tool which focuses on CHP employment in a competitive energy market context. The authors have minimized the total operating cost by solving the long-term unit commitment involving a CHP plant. Colson et al. [7] have evaluated the benefits of a hybrid solid oxide fuel cell (SOFC) with CHP plant for energy sustainability and emissions control. The hybrid system fulfils the electricity as well as hot water needs for a residential community of 500 homes, more sustainably with less environmental emissions as compared to conventional power plants. Chernyaev et al. [17] have developed a load distribution optimization tool for a CHP plant. The tool optimizes the fuel consumption by using a CHP power plant. Dvorak et al. [18] have scheduled the operation of a CHP plant by using the decomposition methods based on the heat demand, fuel cost and electricity pricing. Sekgoele et al. [8] have carried out the assessment of land filled gas-based CHP plants in South Africa, both technically and economically. The authors have assumed that the stand-alone CHP plant will supply both heat and power to remote communities, while the grid-connected CHP plant will work only during the peak load periods. Chandan et al. [19] have modelled and optimized a CCHP plant to fulfil the cooling, heating and power needs of the University of California, Irvine (UCI) by using cogeneration and thermal storage capabilities. The authors have minimized the operating cost of the plant by forecasting the electrical and thermal loads. Ruieneanu et al. [9] have conducted the parallel operation of a CHP plant with wind farms and have reduced the CO2 emissions, and therefore have reduced the operating cost of the system. Dai et al. [20] have proposed a new dispatch model for a CHP plant considering the heat transfer process. Boljevic [11,21] has developed a planning algorithm for optimal sizing of CHP plant connected to an urban distributed network with least costs under long term network planning policy. Pierre et al. [10] have technically and economically accessed a flexible CHP plant with carbon capturing and storage. Their work resulted in gaining higher profits by reducing CO2 emissions. Scholz et al. [22] have evaluated a system consisting of a CHP plant and a conventional gas-fired boiler with a power to heat unit. The authors have evaluated the benefits of the flexibility of power to heat unit to gain the economic incentives during low electricity price hours. Buoro et al. in [23] have evaluated a distributed energy supply system consisting of a CHP plant with PV and thermal storage by using mixed integer linear programming (MILP). Pareto fronts have been applied to the results to find the most optimized solution. Somma et al. in [24] have investigated a sustainable hybrid CHP-PV system to supply the both electrical and thermal loads. The results have shown that about 21–36% of the total annual costs were minimized with the optimized solution. Somma et al. [25] have developed a multi-objective optimization problem to reduce the energy costs and CO2 emissions. The authors have considered various thermal energy storage systems to fulfill a time-varying load profile. The results have indicated that a reduction of 27% in costs and 26% in CO2 emissions was achieved. Zhang et al. [26] have proposed a CHP plant integrated microgrid with energy storage to satisfy the electricity and heat demand. In order to minimize the computational burden, the authors have used a stochastic non-convex optimization which results in minimum operating cost. Ping et al. [27] have proposed a CHP plant dispatch model while considering thermal performance of pipe line and building’s inertia. The model is executed by decoupling the electricity and heat supply and in this way the wind penetration is increased. The overall result is saving of operational costs of system. Zidan et al. [28] have proposed a multi-objective optimization problem to minimize the overall costs and CO2 emissions simultaneously. A genetic algorithm (GA) was applied to find the optimal generation-mix among the CHP plants (with various properties), renewable sources and energy storages. Hussain et al. [29] have proposed a CCHP plant for building microgrids (BMGs) in grid-connected mode. A mixed integer linear programming (MILP) based optimization model to minimize the day to day operational cost has been developed. The cost has been reduced by the energy exchange with the external grid and heat exchange with the prosumer. Alarcon et al. [30] have performed a detailed review of the distributed energy resources integration in distribution networks. Various optimization techniques have been discussed to gain benefits like low operational costs, minimum CO2 emissions, reduction in network losses, enhancement in power quality etc. Moreover, the challenges of grid-integration like voltage regulation, frequency stability, adequacy, system reliability etc. have been investigated. Somma et al. [31] have developed a Pareto frontier based stochastic optimization technique for the daily scheduling of distributed energy resources to minimize the operating costs and CO2 emissions. A sensitivity analysis has been carried out to investigate the impact of high renewable penetration on the economic and environmental aspects. Maroufmashat et al. [32] have proposed a multi-objective optimization based on augmented epsilon constraint technique to minimize the operating costs and GHG emissions.
Most of the abovementioned research has been conducted to improve the efficiency of systems with a CHP plant with waste heat recovery (WHR). This WHR results in minimizing the operating costs. However, from microgrid perspective, there are other parameters like total net present costs (TNPC), cost of generated energy (COE), greenhouse gas (GHG) emissions, WHR and grid sales (GS), which also effect the efficiency of a CHP plant integrated microgrid. Therefore, in this paper the authors have analyzed a CHP plant integrated microgrid considering multiple objectives. The multiple objectives include the minimization of TNPC, COE, annual GHG emissions, and the maximization of the annual WHR and annual GS. Moreover, the CHP plant integrated microgrid has never been evaluated for Pakistan. This multi-objective optimization problem has been simulated for six cities of Pakistan including Islamabad, Lahore, Karachi, Peshawar, Quetta and Gilgit. Different configurations of distributed generators (DGs) like PV/diesel generators with/without batteries have been simulated in both grid-connected as well as isolated modes, to find the optimal configuration. The final optimal solution concludes the most optimum city. These cities are considered for evaluation because these are the most populous cities and provincial capitals [33].
The rest of the paper is organized as follows: Section 2 presents an existing urban community load profile (electrical and thermal), solar energy resource (average monthly solar irradiance) for above mentioned six cities, and temperature resource for same cities. Section 3 shows the microgrid modeling in the form of different DG configurations with/without batteries. Section 4 shows the analysis of results considering multiple objectives. Section 5 concludes the paper.
2. Data Collection
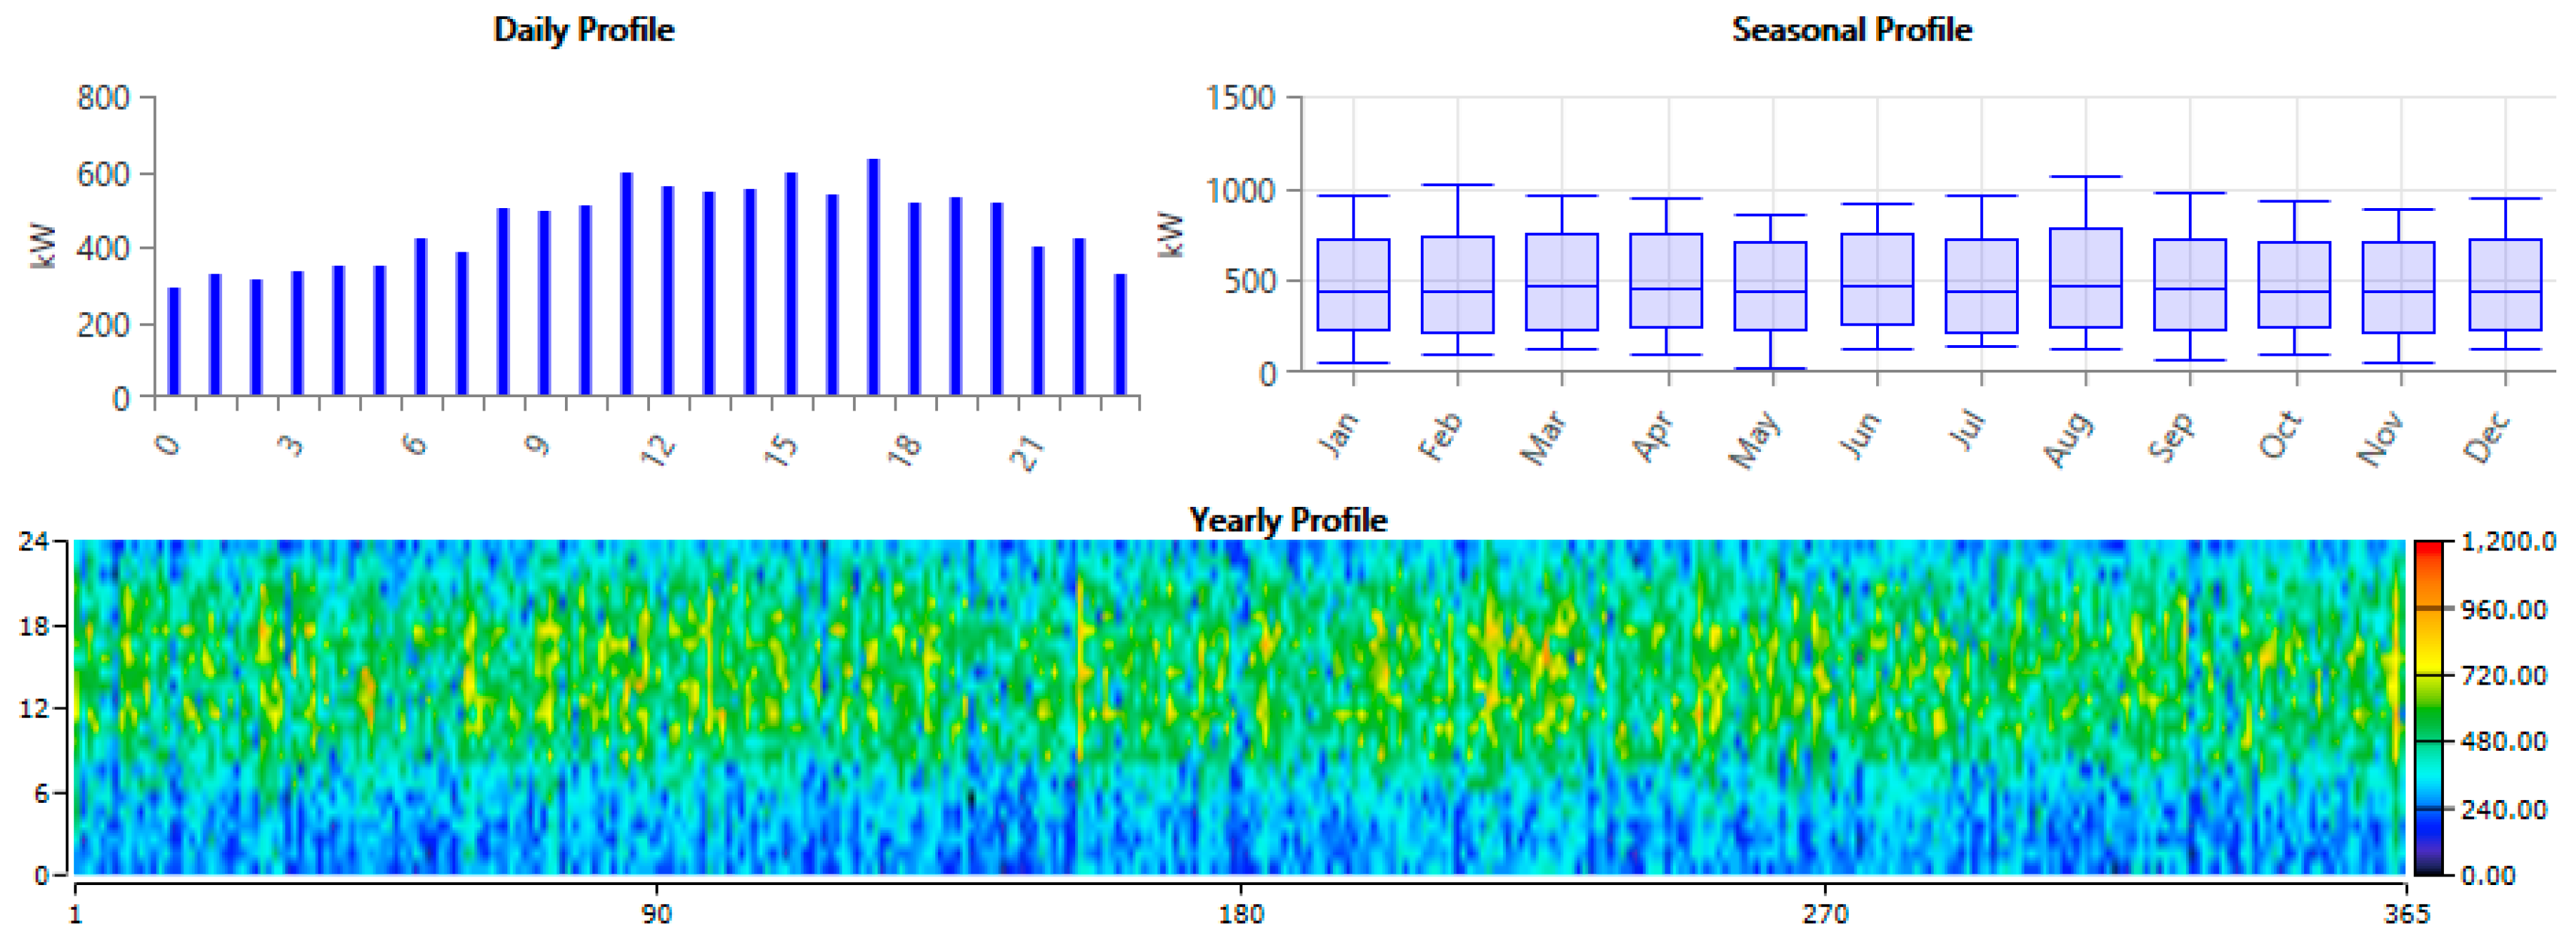
2.1. Load Profile
An urban community identical load profile (electrical and thermal) has been assumed for all the above-mentioned cities. In case of a non-thermal system (without WHR), the scaled annual electrical energy utilization is 13,331.07 kWh/d, peak electric load is 1427.06 kW and an average load is 555.46 kW, as shown in Figure 1. In case of a thermal system (with WHR), the scaled annual electrical energy utilization is 10,911.02 kWh/d, peak electric load is 1073.99 kW and the average load is 454.63 kW, as shown in Figure 2. An equivalent scaled annual thermal energy utilization is 2419.8 kWh/d, peak thermal load is 407.45 kW and an average load is 100.83 kW, as shown in Figure 3.
2.2. Solar Energy Resource
The 22-years (from July 1983 to June 2005) average monthly solar irradiance profiles of the Islamabad, Lahore, Karachi, Peshawar, Quetta and Gilgit located at 33°43.8’ N, 73°5.6’ E; 31°33.3’ N, 74°21.4’ E; 24°51.7’ N, 67°0.6’ E, 34°0.9’ N, 71°34.8’ E, 30°11.0’ N, 66°59.9’ E and 35°55.2’ N, 74°18.5’ E respectively, are taken from NASA (National Aeronautics and Space Administration) database [34]. According to the NASA database, as shown in Figure 4, the average monthly solar irradiance in Karachi is greater than other cities during the winter months (January to April, October to December), whereas Peshawar has its peak during the peak summer months of June and July. Quetta has high irradiance in the months of August and September, Lahore has a high irradiance in the month of May.
2.3. Temperature Resource
The same NASA database is utilized for the 22-year (July 1983–June 2005) average monthly temperature of earth’ surface for the above-mentioned cities, as shown in Figure 5. Karachi has greater average temperature for eight months (January–April, September-December), while Lahore has its peak for four months (May–August). On the other hand, Gilgit has the lowest peak during the entire year.
3. Microgrid Modelling
A microgrid introduces the concept of operating the generating sources close to the loads. The generating sources could be thermal or renewable sources, supported by energy storage. This model enhances the efficiency, reliability and cost-effectiveness of the system, which cannot be achieved with a single generating source [25]. In this paper, the microgrid model composes of DGs including PV/diesel generators with/without batteries in both grid-connected as well as isolated modes, with and without considering the effect of WHR. In the context of a grid-connected system, the grid connection is utilized to sale the excess electricity of the microgrid in case of capacity shortage.
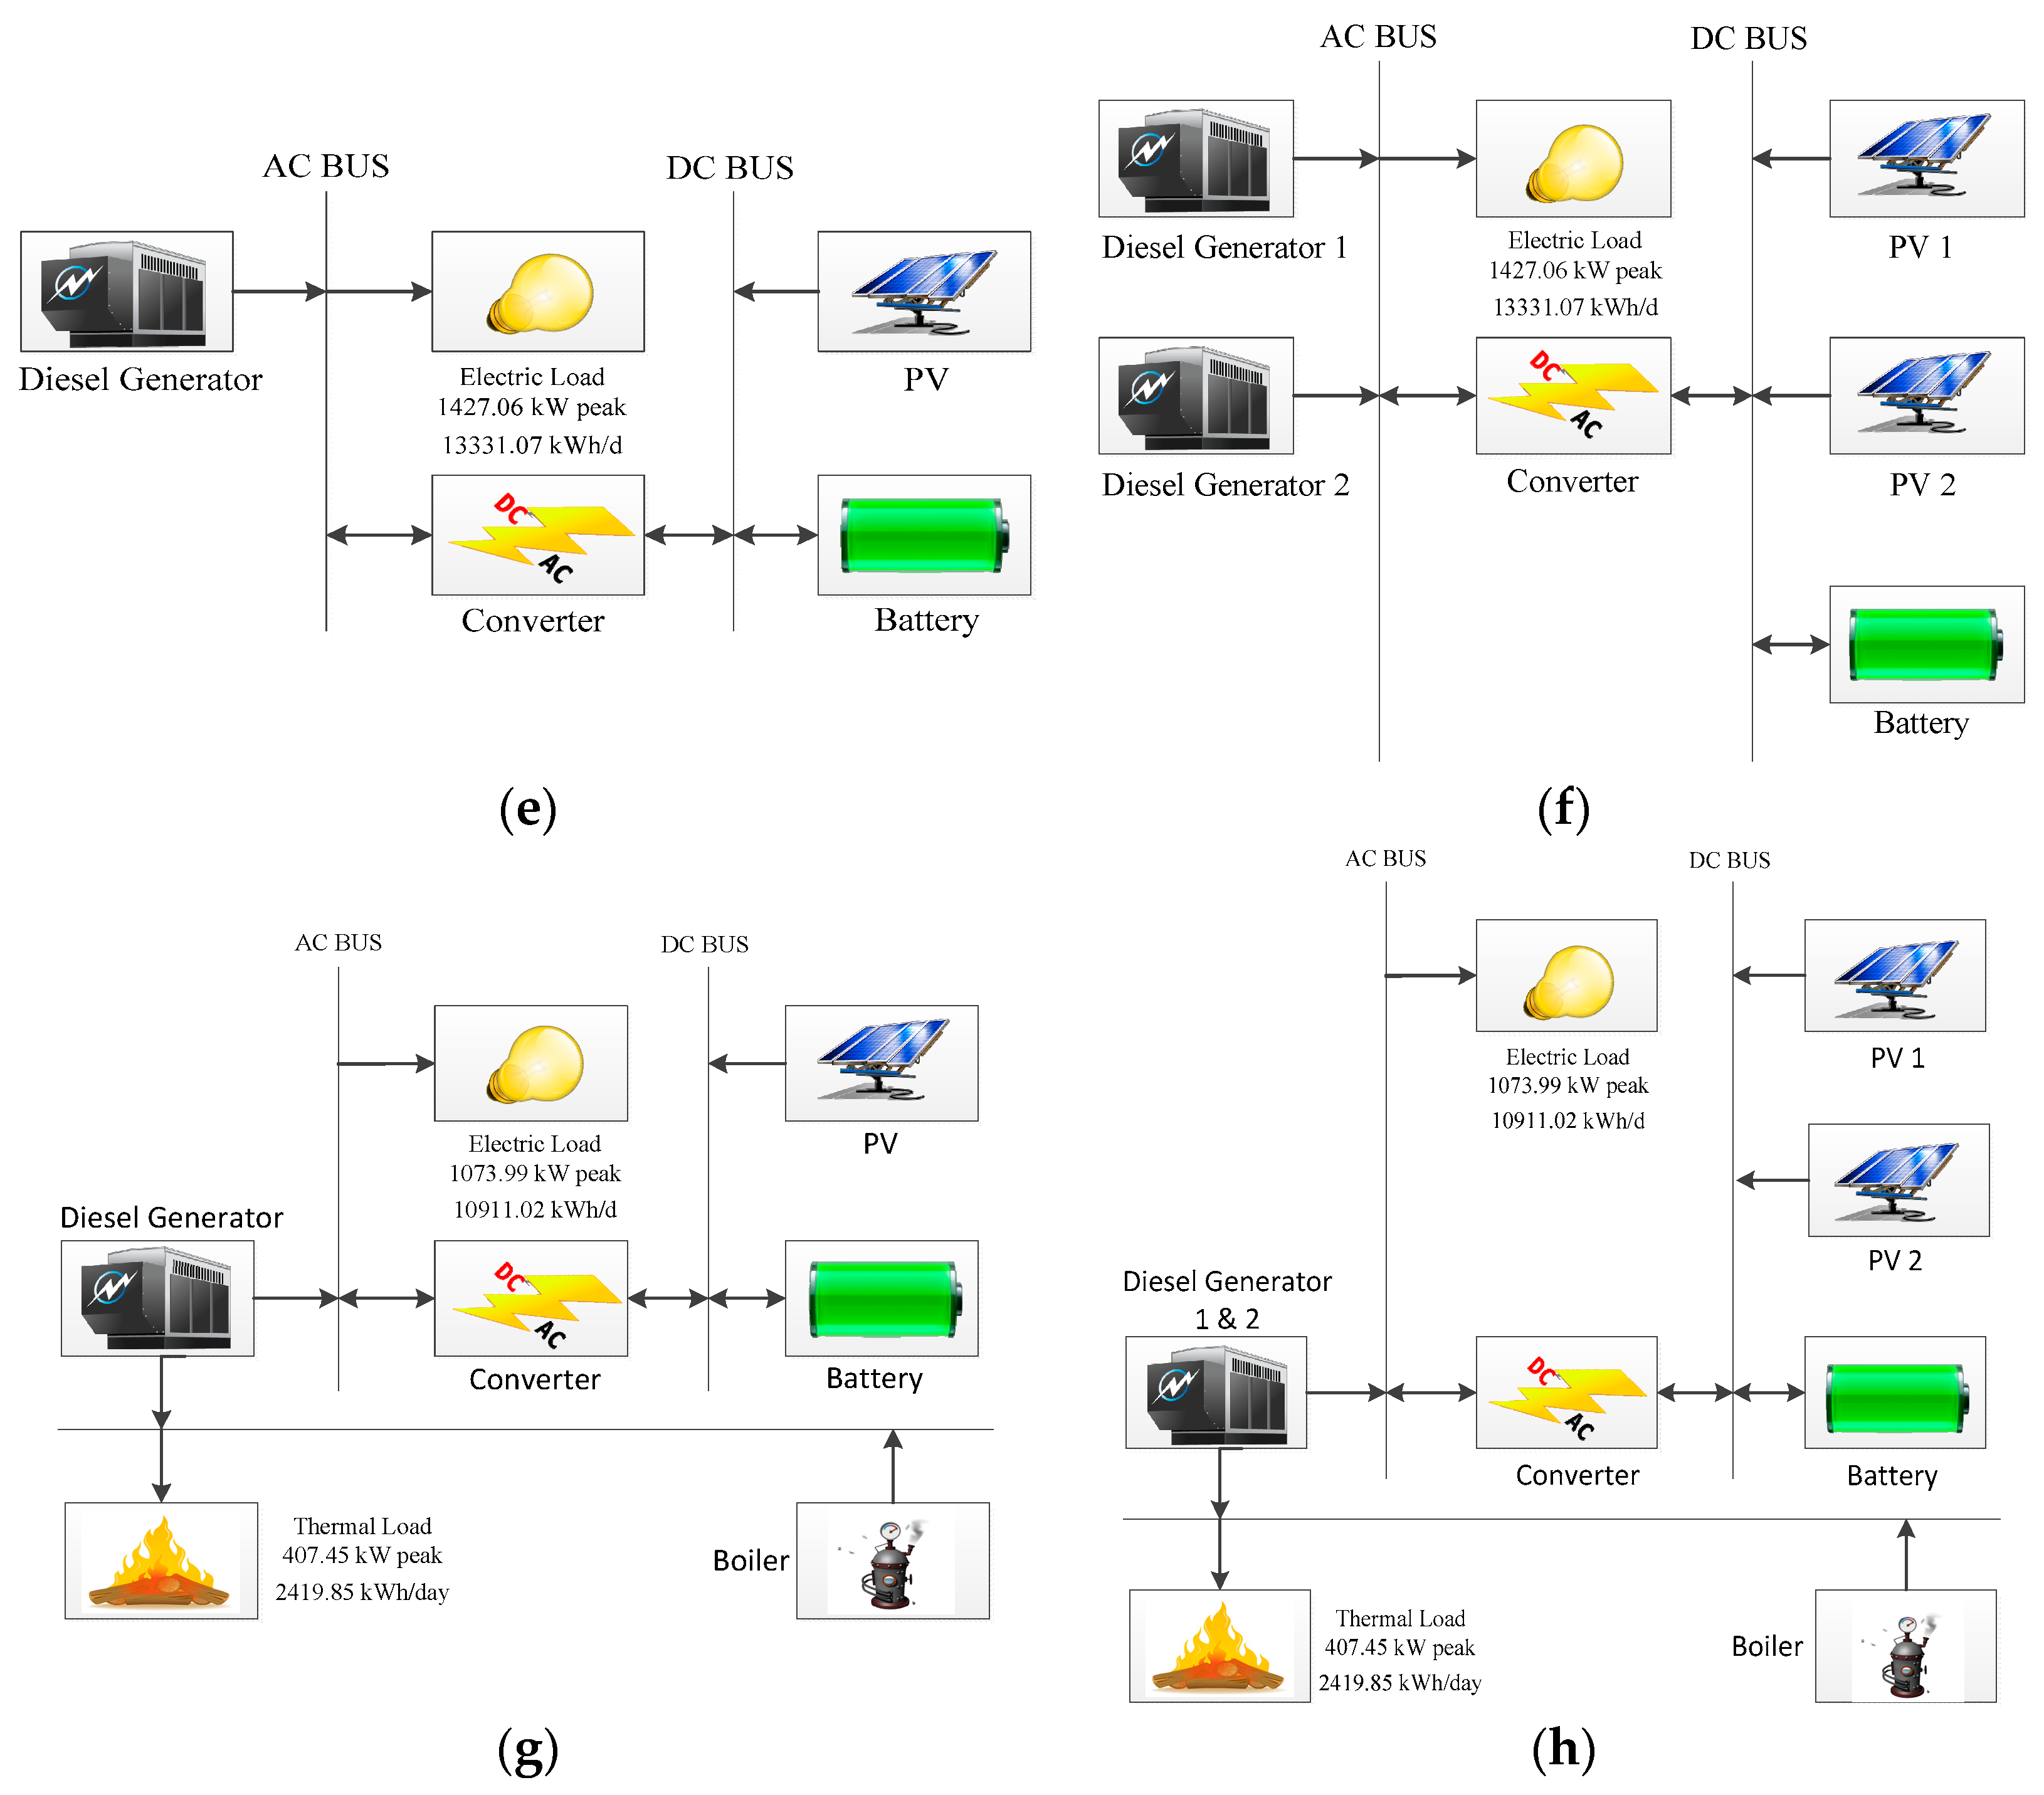
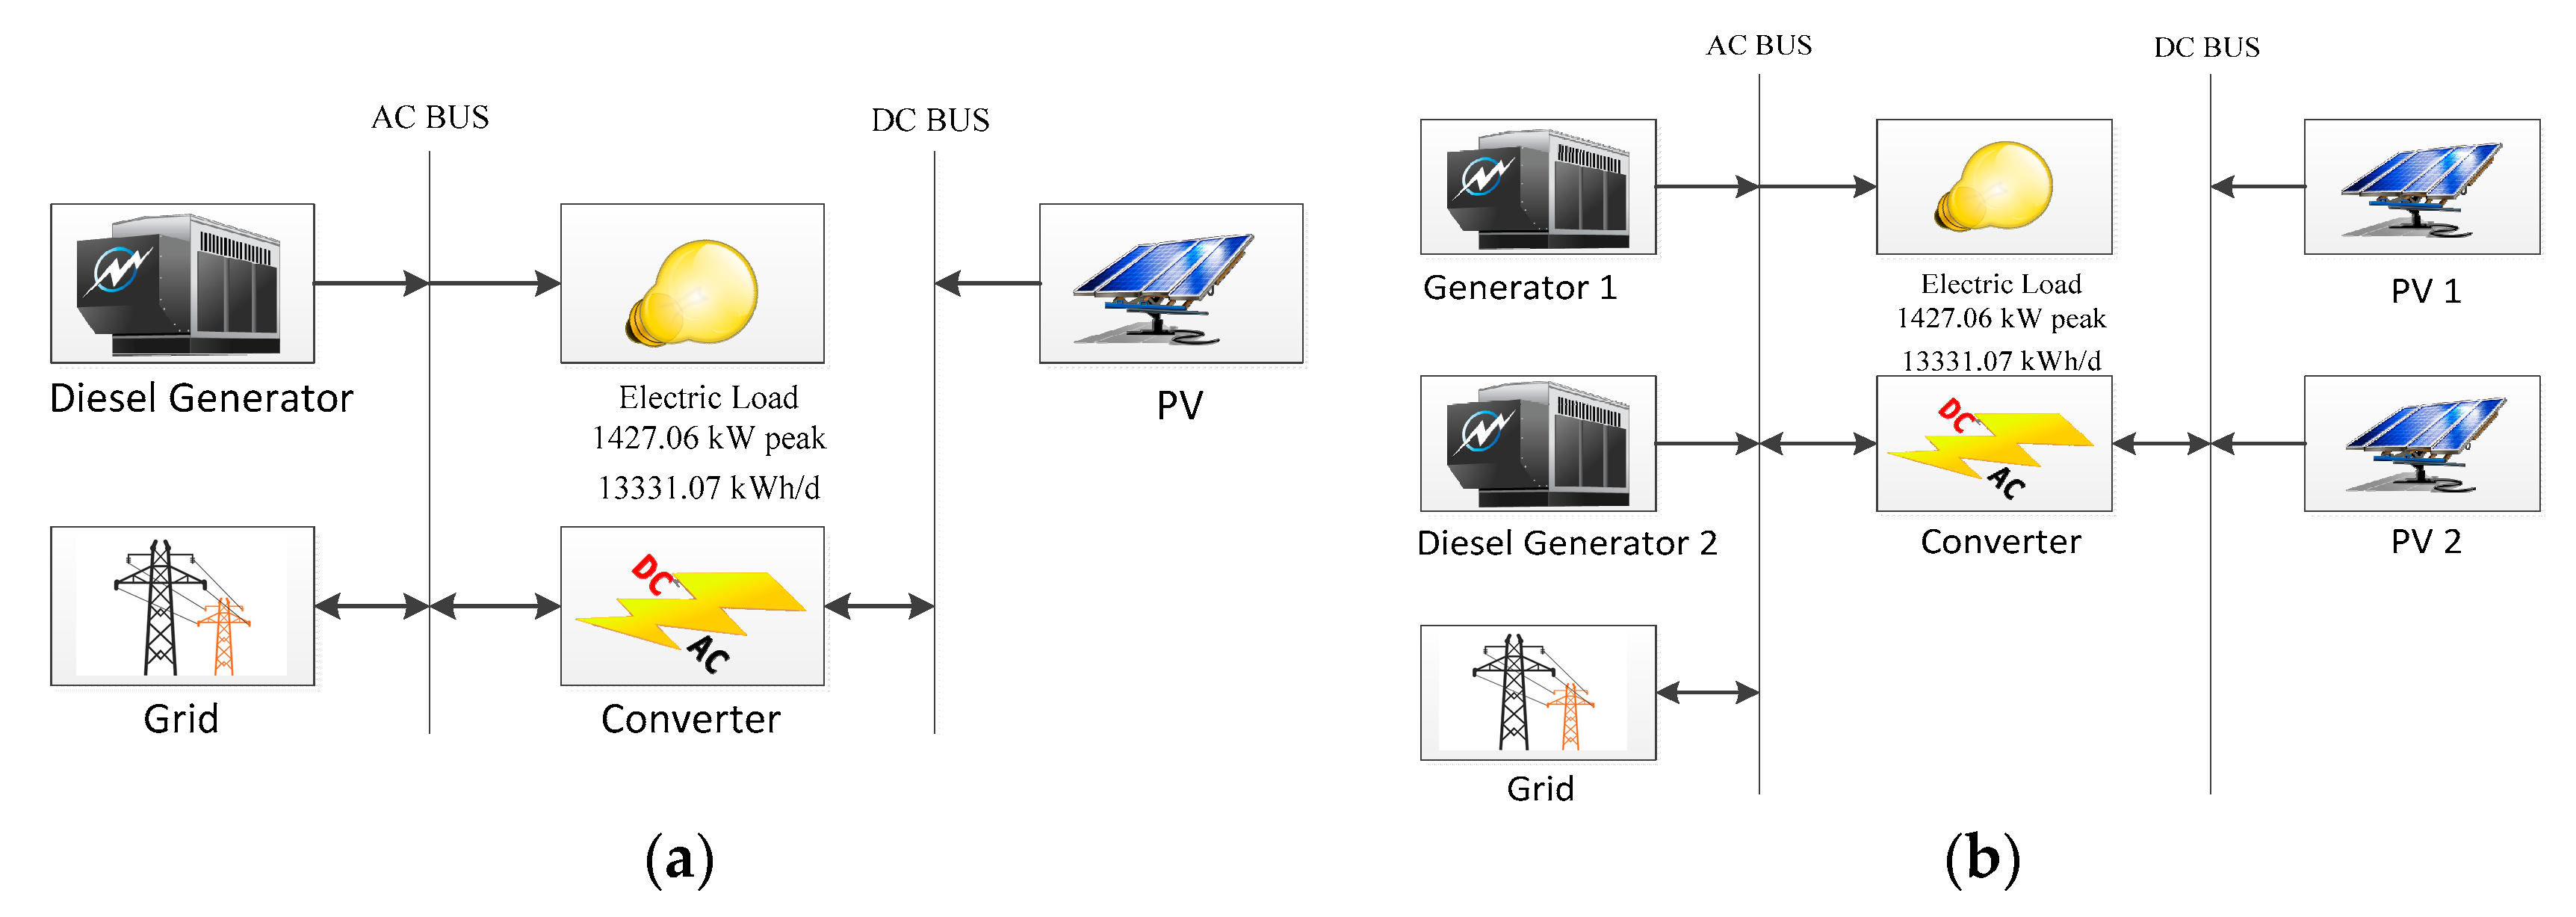
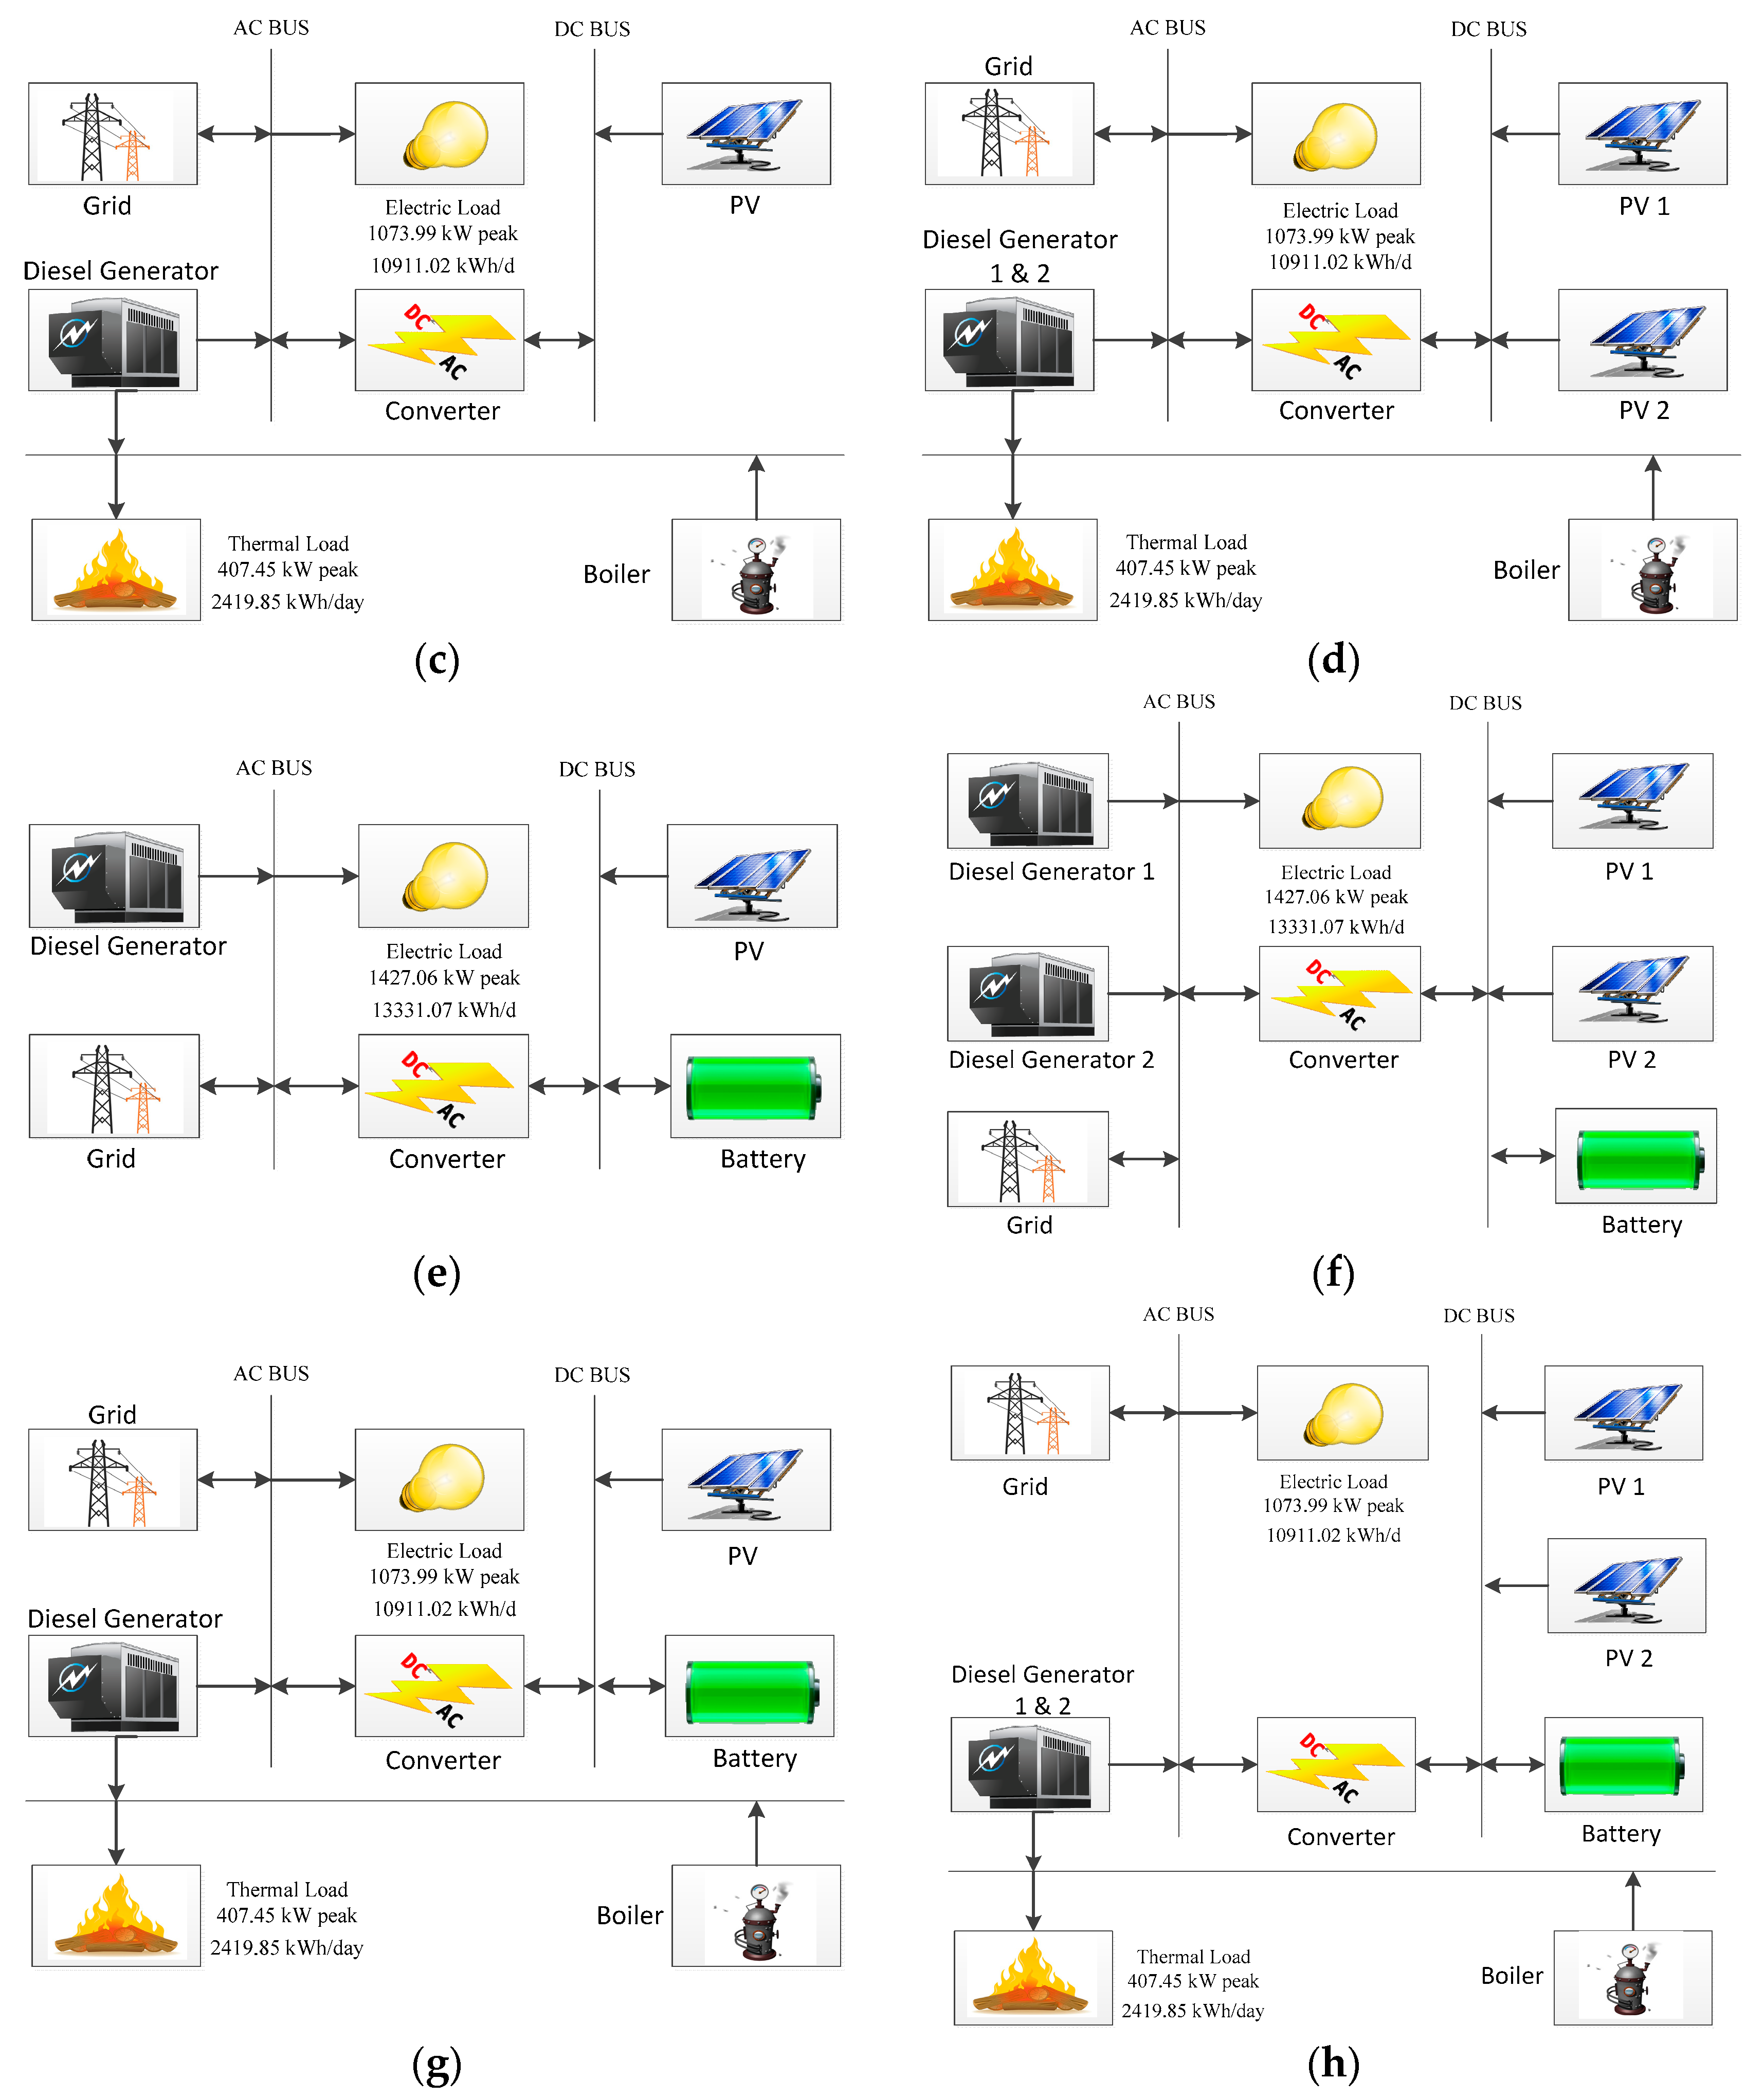
In total seventeen different configurations have been analyzed. The conventional diesel generators only system, as shown in Figure 6, has been considered as a first configuration. Among the remaining sixteen configurations, eight are analyzed in isolated mode, as shown in Figure 7a–h and rest of the eight are analyzed in grid-connected mode, as shown in Figure 8a–h. In addition, among the remaining sixteen configurations, eight configurations have been simulated while considering the WHR effect, as shown in Figure 7c,d,g,h and Figure 8c,d,g,h. The PV is the only renewable energy resources used in study (because of the 2.9 million MW solar potential in Pakistan [35]), while batteries are used as the only storage device.
Table 1 and Table 2 [36], highlight different costs and technical details of the DGs with/without batteries. These parameters are the input data to HOMER Pro software. The GHG emissions penalty and CS penalty has been set at $20/ton and $20/kWh respectively [36], whereas Pakistan’s fuel price has been set at 0.75 $/L [37]. Table 3, highlights the sizes of the DGs with/without batteries taken under consideration.
3.1. Multi-Objective Analysis Using HOMER Pro
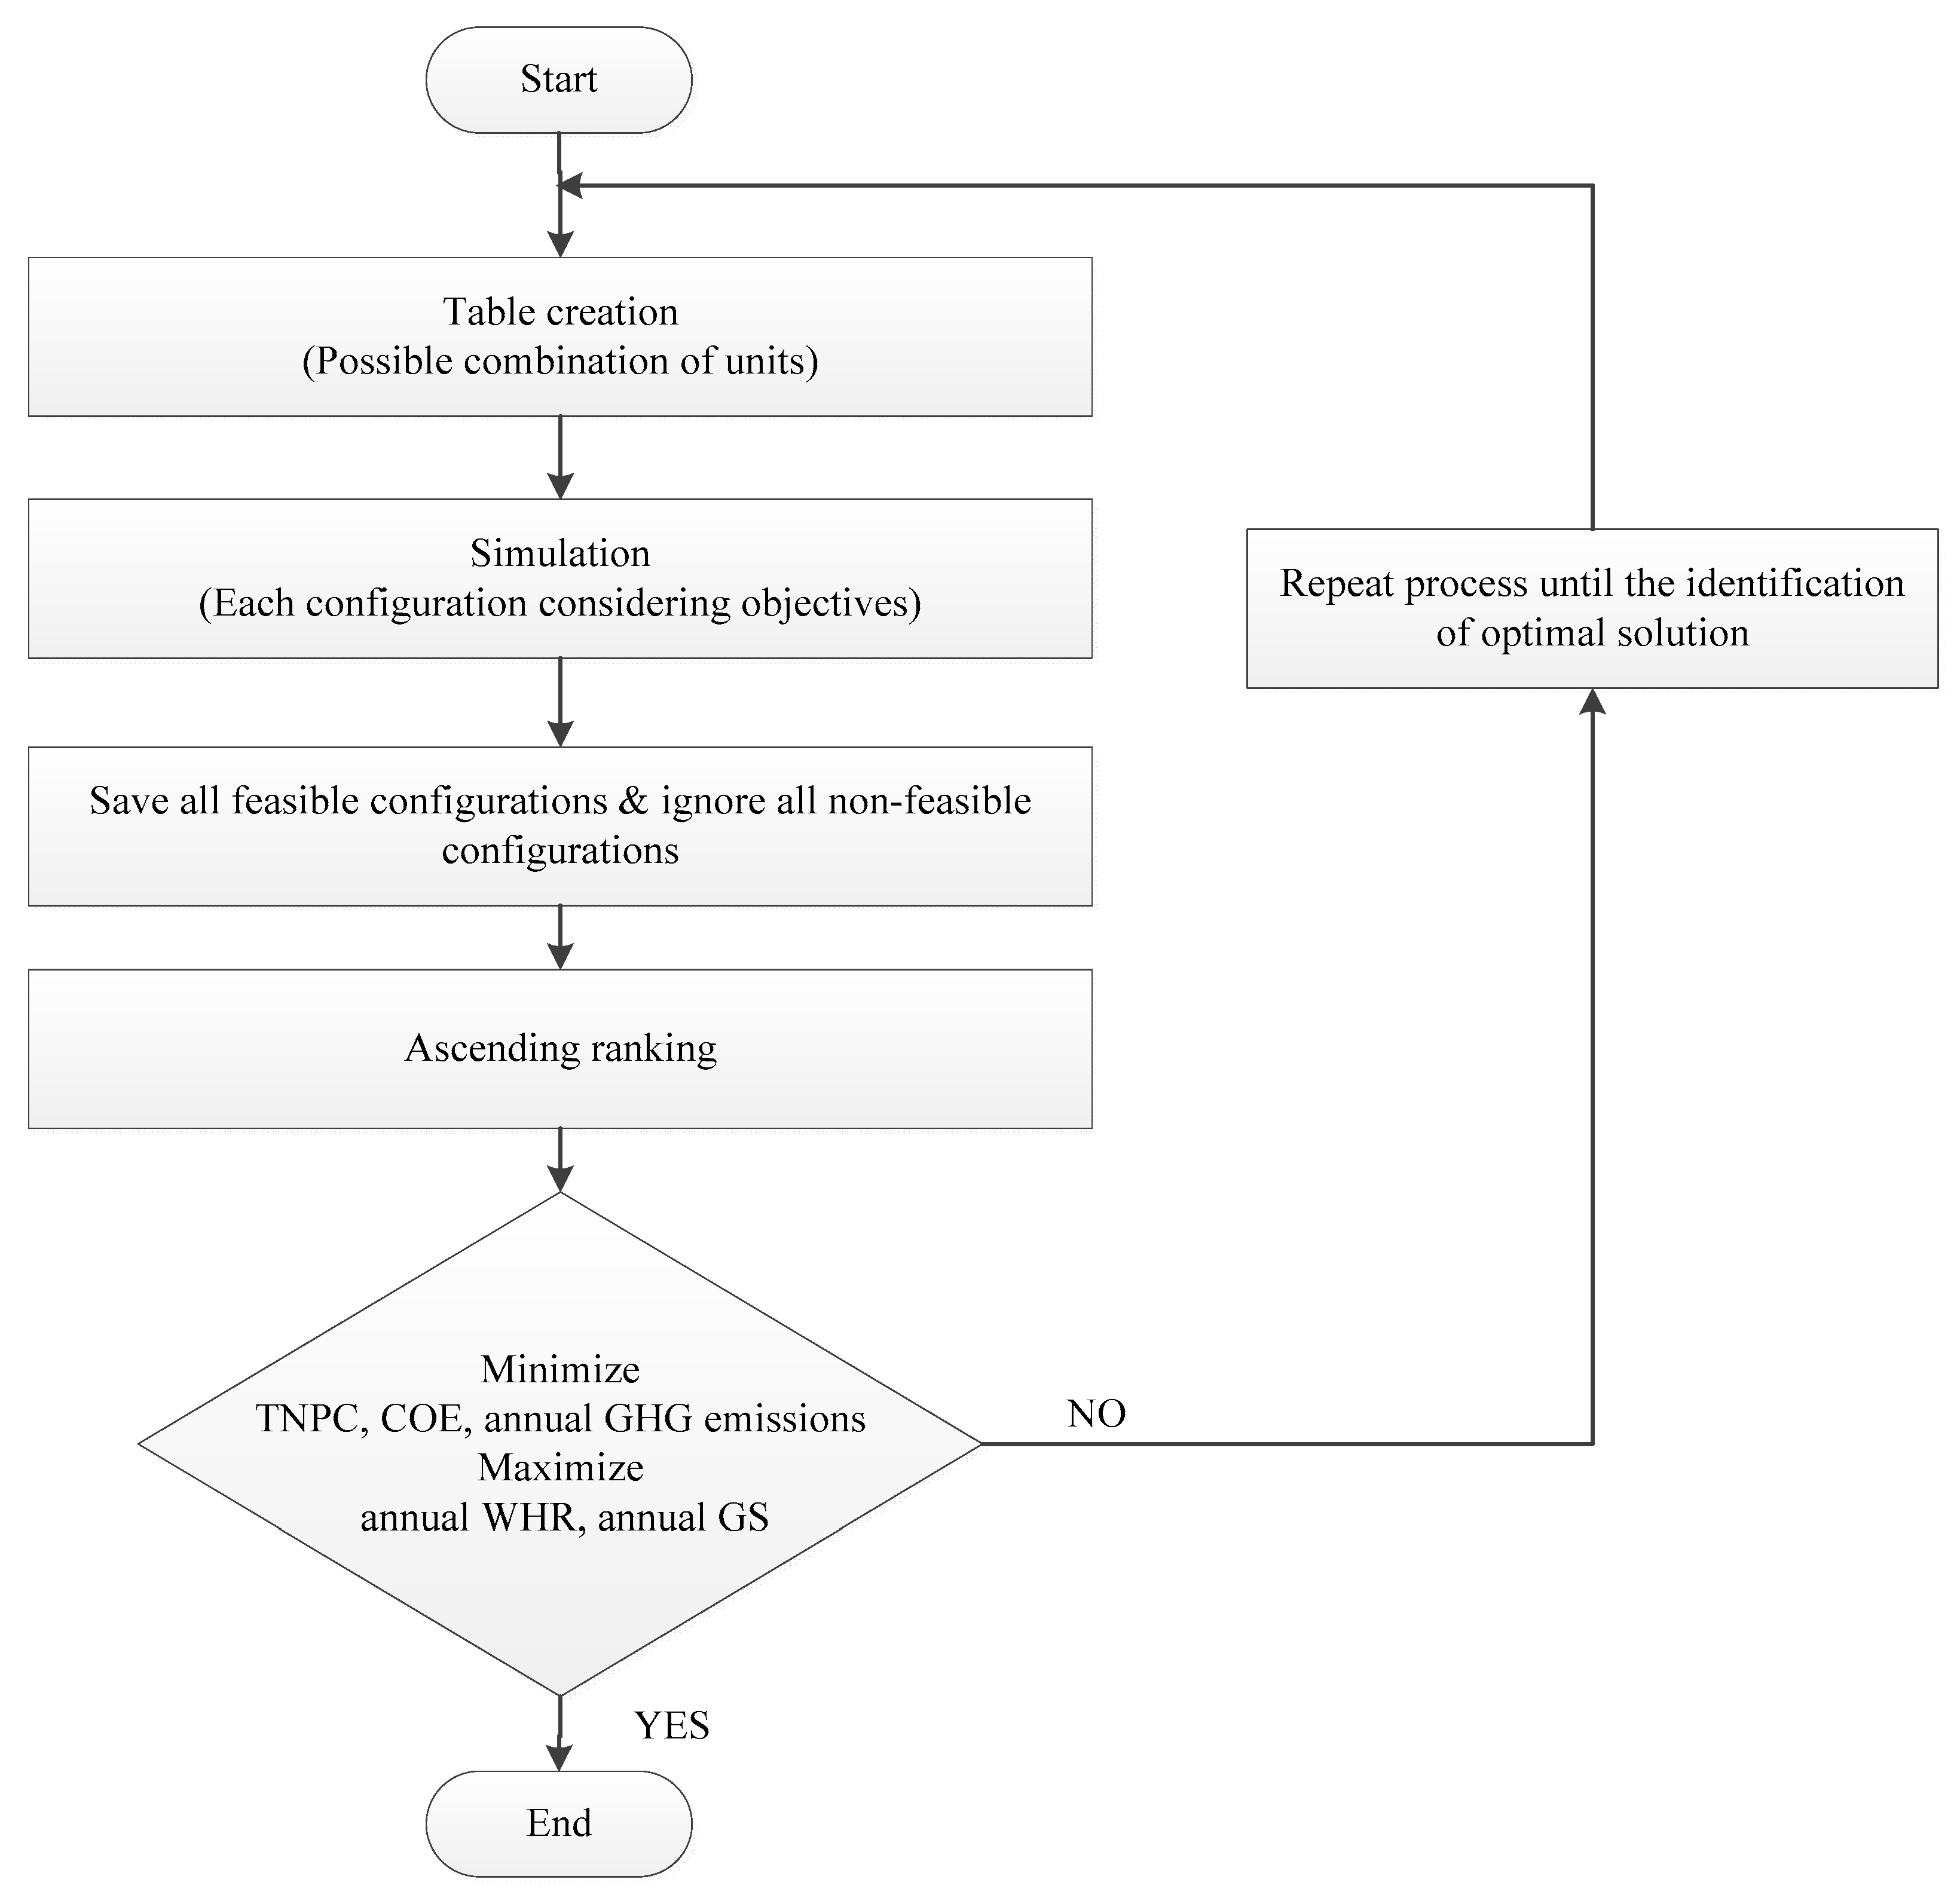
HOMER is an optimization tool developed by the U.S. National Renewable Energy Laboratory (NREL). HOMER Pro is the latest version. HOMER models the physical behavior and the life-cycle cost of a power system [38,39]. In addition, HOMER allows the user to analyze different configurations of generating and storage units based on their technical and economic benefits. The user provides the resource data like average daily solar irradiance, load profile to be served, generating/storage units to be considered and their costs as input to the HOMER. The software then performs an hourly power balance calculation for each configuration for a year. After simulating all the possible configurations, the infeasible configurations are discarded and the feasible solutions are ranked according to the lowest total net present cost (TNPC).
HOMER uses an optimizer which is based on a derivative free optimization. The optimization algorithm uses a modified grid search algorithm. The user specifies different options (in the form of inputs) related to the generating/storage units in a searchable grid, while the algorithm searches for the optimal solution [40]. The HOMER initially takes input data in a table form, then it performs the simulations on the given data to find out all the possible configurations [40]. These configurations are then analyzed to shortlist the optimal configuration while considering the objectives. Figure 9 shows the flowchart for HOMER Pro.
3.2. Objective and Constraints
The optimal configuration for the CHP plant integrated microgrid is based on multiple objectives. The multiple objectives include the minimization of the, total net present cost (TNPC) of microgrid, cost of generated energy (COE) and the annual greenhouse gas (GHG) emissions, and the maximization of the, annual waste heat recovery (WHR) of thermal units and annual grid sales (GS). These multiple objectives are subject to the constraints of power balance with 25% of operating reserve, battery operation within state of charge (SOC) limits, generation capacity limit and zero capacity shortage.
The TNPC of generating/storage unit is the present value of all the costs that it acquires during its lifespan minus the present value of all the revenues that it earns over its lifetime. Revenues include salvage value and grid sales [38]. The COE is calculated based on the total annualized cost and the total load supplied including the grid sales (GS). The GHG emissions include the pollutants like carbon dioxide (CO2), carbon monoxide (CO), unburned hydrocarbons (HC), Sulphur dioxide (SO2) and nitric oxides (NOx). All emissions are calculated by multiplying the fuel quantity with the emission coefficients [38]. In case of a CHP plant, the generator’s heat is recovered to supply the thermal load. Normally the generator’s fuel curve is used to estimate the electricity production for a given fuel. It is assumed that the remaining fuel energy will be converted to heat. Waste heat recovery (WHR) is the energy that can be recovered to supply thermal load [38]. Excess of energy that can be sold to the grid is accounted as grid sales (GS). This energy is the difference between total annual load and total annual generation [38].
The power balance with 25% of operating reserve is an equality constraint which not only supplies the load demand, but also ensures 25% additional reserves. Battery operation within SOC limits is an inequality constraint which is maintained to achieve a prolonged battery life. Generator operation within capacity limits is also an inequality constraint to maintain fuel efficiency. Zero capacity shortage is a constraint to ensure the uninterrupted supply of load.
4. Results and Analysis
Table 4 and Table 5 indicate the optimal configurations of DGs with/without batteries for each mentioned city individually. The configurations include sizes of diesel generators (kW), PV arrays (kW), batteries (kWh) and converters (kW). Some configurations involve single generator (1Gen) and single PV (1PV), however some configurations involve double generator (2Gen) and double (PV). Table 6 and Table 7, show the values of the multiple objectives based on the optimal configurations for each city. Finally, a comparative analysis has been performed to identify best solution in terms of defined objectives. Table 8 shows the most optimal value of each individual objective from different optimal configurations.
Table 8 indicates the optimal solutions considering the objectives. Table 8 further shows that all the objectives are not pertaining to a single city. Gilgit has the most optimum values for TNPC and COE. However, its other three objectives are not optimum. Lahore has the most optimum value for annual GHG emissions. Similarly, Quetta has the most optimum values for annual WHR and annual grid sales.
4.1. Graphical Representation
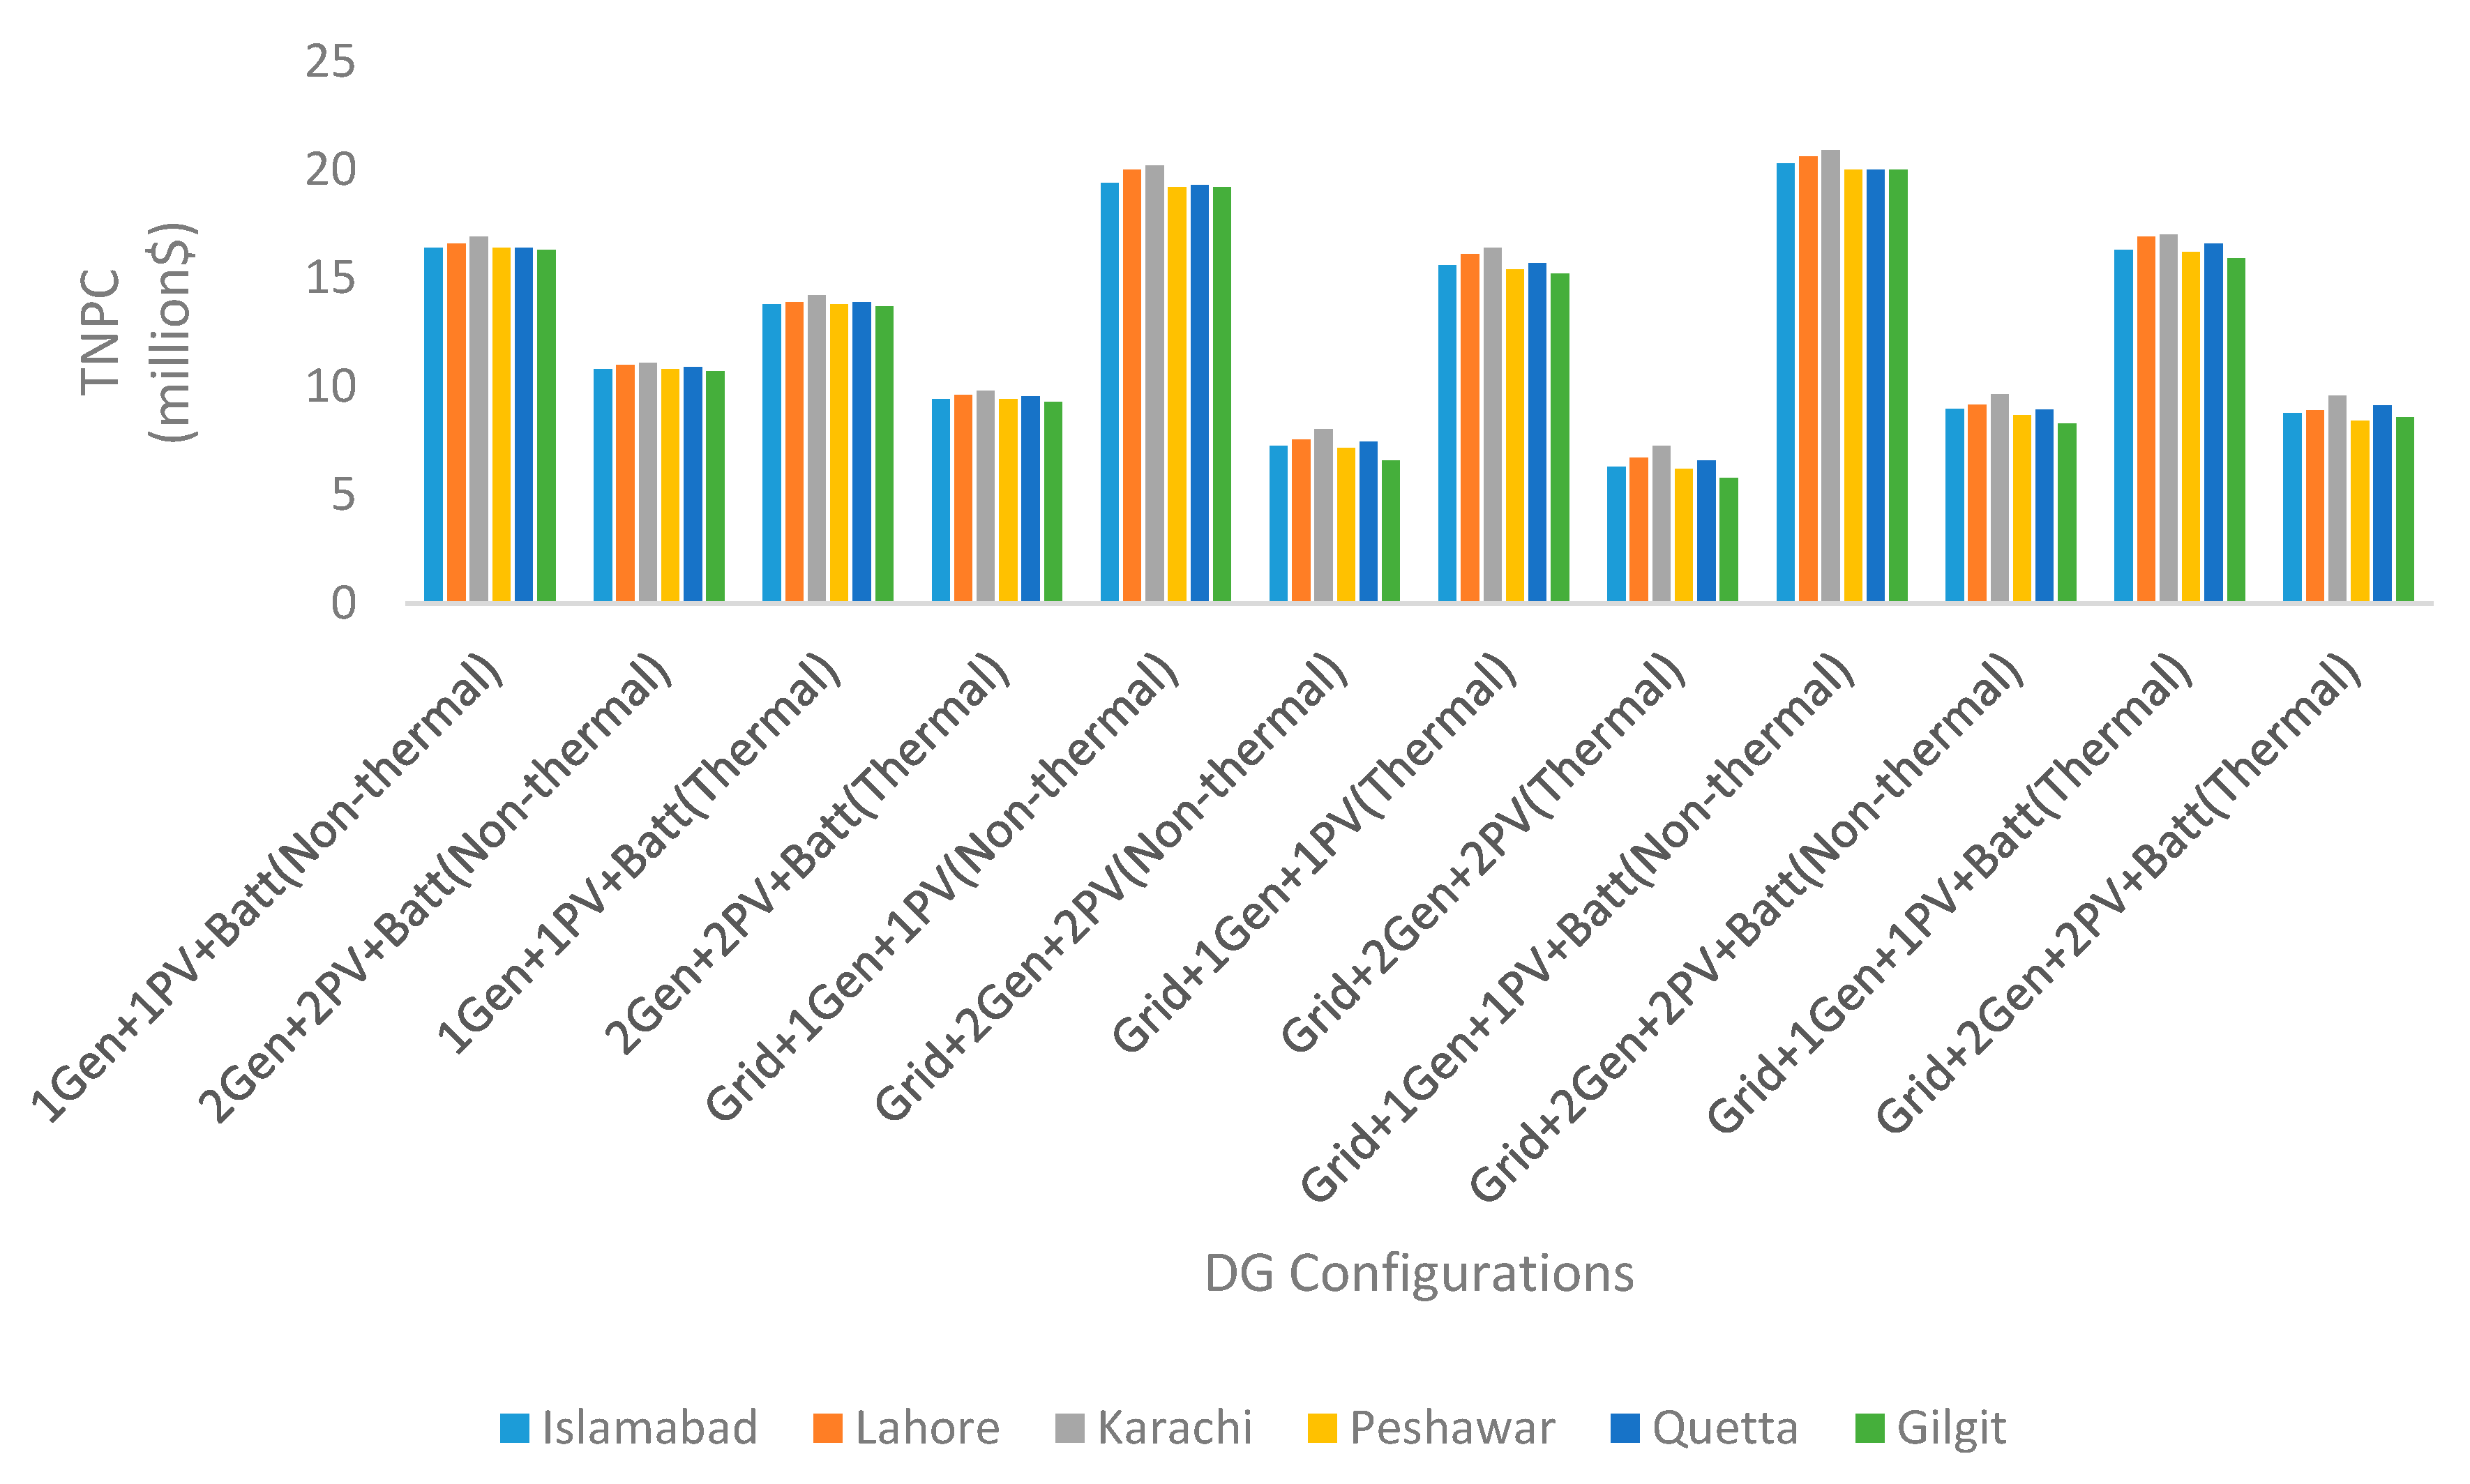
4.1.1. Total Net Present Cost
Figure 10 shows the comparative analysis of TNPC for different DG configurations for the six cities. Gilgit has the lowest TNPC among all DG configurations. In grid-connected mode, double diesel generator (2Gen) and double PV (2PV) with WHR system costs about 5.79 million$, which is the lowest TNPC.
4.1.2. Cost of Generated Energy
Figure 11 shows the comparative analysis of COE for different DG configurations for the six cities. Gilgit has the lowest COE among all DG configurations. In grid-connected mode, double diesel generator (2Gen) and double PV (2PV) with WHR system costs about 0.049 $/kWh.
4.1.3. Greenhouse Gas Emissions
Figure 12 shows the annual GHG emissions for different DG configurations for the six cities. The DG configurations without WHR have lower GHG emissions. However, these configurations are excluded due to zero WHR. Lahore has the lowest annual GHG emissions among all DG configurations. In isolated mode, single generator (1Gen), single PV (1PV) and battery with WHR has the lowest GHG emissions of about 1000.214 tons/year.
4.1.4. Waste Hear Recovery
Figure 13 shows annual WHR for different DG configurations for the six cities. Configurations with WHR are only considered. Quetta has the highest annual WHR among all DG configurations. In grid-connected mode, double diesel generator (2Gen), double PV (2PV) and battery has the highest annual WHR of about 2,040,282 kWh/year.
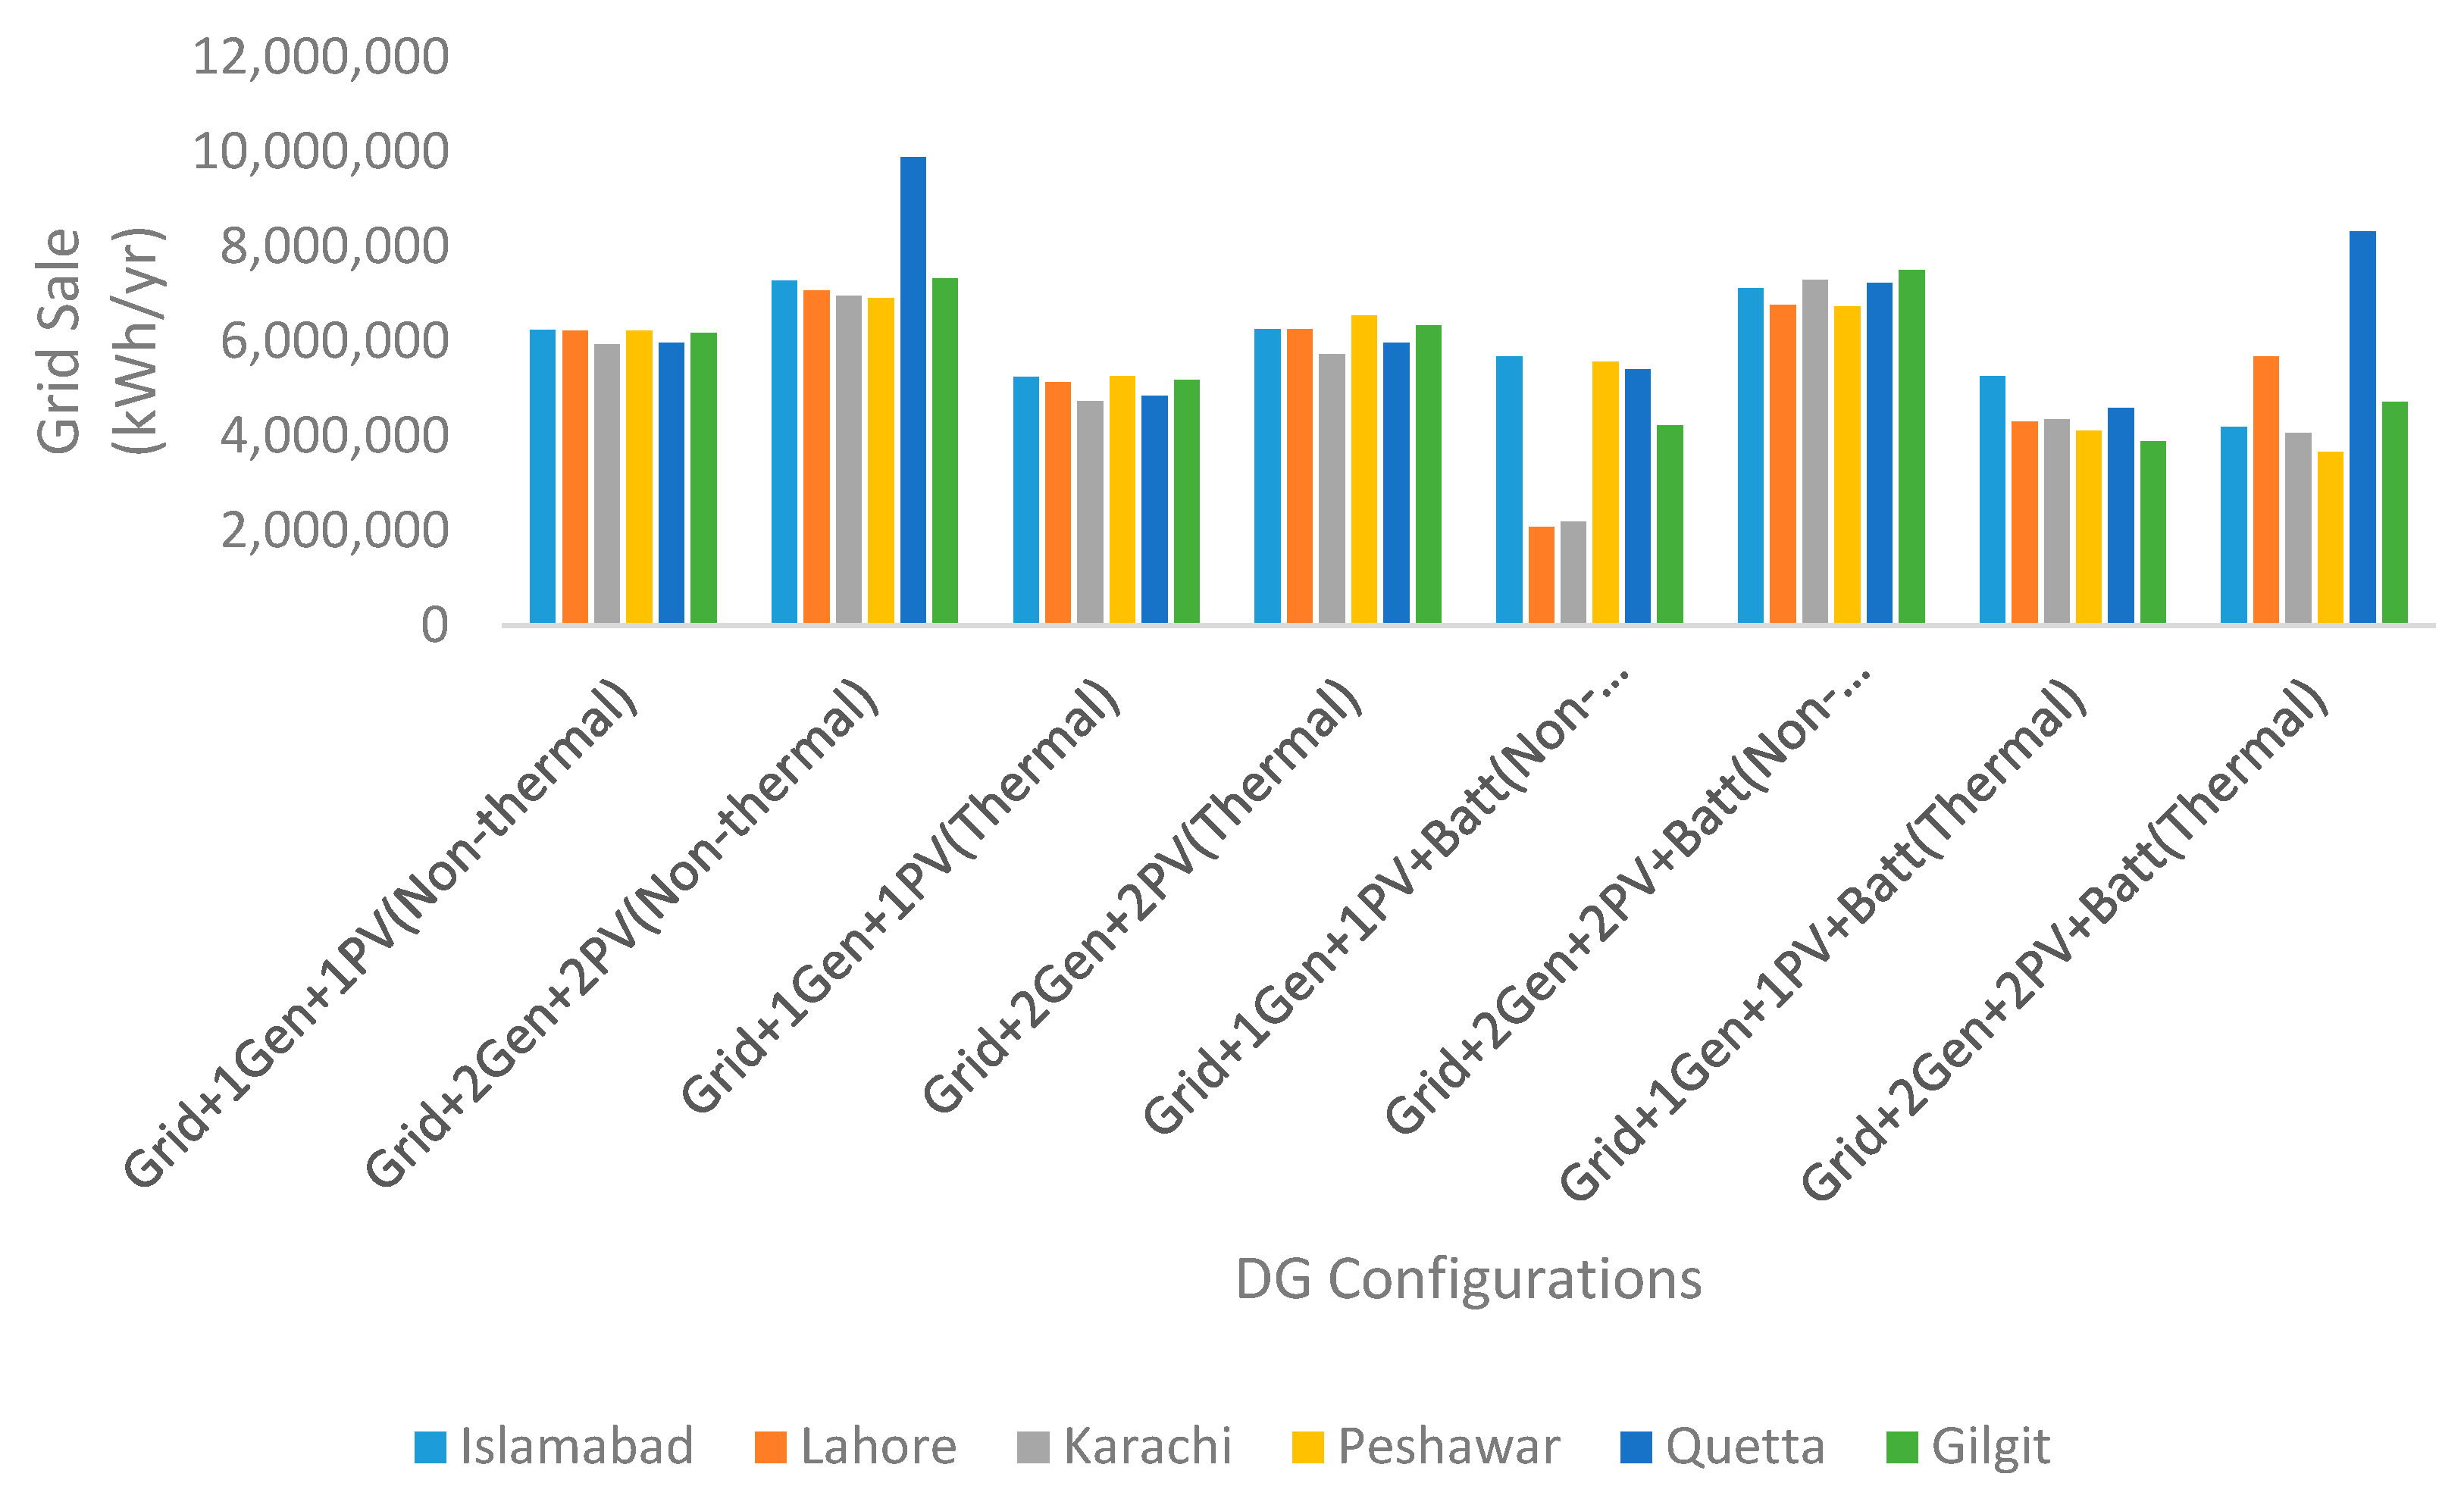
4.1.5. Grid Sales
Figure 14 shows the annual grid sales for different DG configurations for the six cities. Quetta has the highest annual grid sales among all DG configurations. In grid-connected mode, double diesel generator (2Gen) and double PV (2PV) and battery with WHR has the highest annual grid sales of about 8,322,268 kWh/year.
5. Conclusions
In this research authors have demonstrated the use of CHP plant when the consumers of NG start using electricity due to outage of natural gas. This supply of thermal load by the electricity was putting an extra burden on the electricity grid. The authors have proposed a solution in the form of a CHP plant integrated microgrid to supply both electrical and thermal loads simultaneously. In this aspect HOMER Pro software has been used to simulate a CHP plant integrated microgrid. Different configurations of the DGs with/without batteries were evaluated considering multiple objectives, including the minimization of TNPC, COE and annual GHG emissions as well as the maximization of annual WHR and annual GS. These multiple objectives were subject to the constraints of power balance, battery operation within state of charge limits, generator operation within capacity limits and zero capacity shortage. The multi-objective analysis shows that a single city does not meet all the objectives in a single configuration. However, Gilgit and Quetta are two cities which satisfy more than one objective in a single configuration.
Gilgit has the lowest TNPC, in both grid-connected and isolated modes. It is because the temperature profile of Gilgit is very contented for solar PV power generation. As the operating cost of renewable energy is very low, and this in return makes the TNPC low. The value of TNPC is lower in configurations where double generators (2Gen) and double PV (2PV) systems of different ratings are used as compared to configurations with single generators (1Gen) and single PV (1PV) systems. This is because a single generator may operate inefficiently during low loads. A single generator (1Gen) with WHR has lower TNPC than a single generator (1Gen) with no WHR. It is because, a single generator (1Gen) with WHR supplies both the electrical as well as with WHR loads. Same is true for double generators (2Gen) with WHR. Among all the cities Gilgit has the lowest TNPC, followed by Peshawar, Islamabad, Quetta, Lahore and Karachi respectively.
Gilgit also has the lowest COE. It is because the temperature profile of Gilgit is very contented for solar PV power generation. As the operating cost of renewable energy is very low, and this in return makes the COE low. Authors concluded that the value of COE is lower in grid-connected configurations as compared to isolated configurations. This is due to the fact that the excess electricity could be sold to the grid. Furthermore, the value of COE is lower in double generator (2Gen) configurations as compared to single generator (1Gen) configurations, as during light loads, a single generator (1Gen) may operate inefficiently.
Lahore has the lowest annual GHG emissions. This is because the DG configuration in isolated mode (1Gen) with single generator has the lowest annual GHG emissions. It is concluded that GHG emissions are higher in grid-connected configurations as compared to isolated configurations. The configurations without battery have low GHG emissions as compared the configurations with battery. This is because battery charging from the generators results in higher GHG emissions. The configurations without WHR have lower GHG emissions as compared to the configurations with WHR. It is concluded that a configuration with double generator (2Gen) have more GHG emissions than configurations with single generator (1Gen).
Quetta has the highest annual WHR. A double generator (2Gen), double PV (2PV) and battery with WHR, recover the maximum heat in grid-connected mode.
Quetta also has the highest annual grid sales. A double generator (2Gen), double PV (2PV) and battery with WHR, sales maximum electricity to the grid on yearly basis.
The decision for selection of final most optimal city for the CHP integrated microgrid is left to the state authorities and the planning commission. In future work the authors expect a more detailed analysis on the effect of WHR on TNPC by varying the heat recovery ratio. Moreover, a more detailed analysis is expected by changing the generator fuel to biomass or natural gas.
Author Contributions
All authors have contributed to this work. Asad Waqar proposed the research idea and contributed to writing the paper. Shahbaz Tanveer, Fareeha Anwar performed the simulations. Jehanzeb Ahmad, Muhammad Aamir and Muneeb Yaqoob contributed to the analysis of results. All authors have approved this paper.
Conflicts of Interest
The authors declare no conflict of interest.
References
- Diversifying Pakistan’s Energy Needs. Available online: http://naturalgasglobal.com/2016/06/20/diversifying-pakistans-energy-needs-a-case-of-natural-gas-lng (accessed on 20 June 2016).
- Dunya News. Available online: http://dunyanews.tv/en/Pakistan/285583-Electricity-shortfall-reaches-5500-MW-in-Pakistan (accessed on 18 December 2016).
- Tengfei, G.; Qiuxuan, W. Optimal design and feasibility analysis of a stand-alone hybrid CHP system-based on PV/Wind/gas turbine generator/VRB for a university in Hangzhou city. In Proceedings of the 2016 Chinese Control and Decision Conference (CCDC), Yinchuan, China, 28–30 May 2016; Volume 28, pp. 6187–6191. [Google Scholar]
- Adrain, B.D. Integration of Combined Heat and Power Generators into Small Buildings. Master’s Thesis, University of Waterloo, Waterloo, ON, Canada, 2006. [Google Scholar]
- Sreto, B.; Barry, N. Impact of combined heat and power plant on thermal and electrical energy supply for small and medium size enterprises. In Proceedings of the 42nd International Universities Power Engineering Conference, Brighton, UK, 4–6 September 2007; Volume 42, pp. 17–20. [Google Scholar]
- Plina, I.; Antans, S.; Olegs, L.; Maris, B. Combined heat and power plants towards efficient and flexible operation. In Proceedings of the IEEE 16th International Conference on Environment and Electrical Engineering (EEEIC), Florence, Italy, 7–10 June 2016; Volume 16. [Google Scholar]
- Colson, C.M.; Nehrir, M.H. Evaluating the Benefits of a hybrid solid oxide fuel cell combined heat and power plant for energy sustainability and emissions avoidance. IEEE Trans. Energy Convers. 2011, 26, 140–148. [Google Scholar] [CrossRef]
- Alexey, C.; Vladimir, M.; Alexander, A. Combined heat and power plants load distribution optimization. In Proceedings of the 45th International Universities Power Engineering Conference UPEC2010, Wales, UK, 31 August–3 September 2010; Volume 45. [Google Scholar]
- Michal, D.; Petr, H. Decomposition methods for operations scheduling problem in a combined heat and power plant. In Proceedings of the 10th International Conference on Environment and Electrical Engineering, Rome, Italy, 8–11 May 2011; Volume 10, pp. 1–4. [Google Scholar]
- Sekgogele, K.; Chowdhury, S.; Chowdhury, S.P. Technical and economic assessment of landfill gas-based CHP plants in South Africa. In Proceedings of the 46th International Universities’ Power Engineering Conference (UPEC), Soest, Germany, 5–8 September 2011; Volume 46, pp. 1–5. [Google Scholar]
- Vikas, C.; Anh-Tuan, D.; Baoduo, J.; Faryar, J.; Jack, B.; Ioannis, A.; Amit, C.; Andrew, A. Modeling and optimization of a combined cooling, heating and power plant system. In Proceedings of the 2012 American Control Conference (ACC), Montreal, QC, Canada, 27–29 June 2012. [Google Scholar]
- Ilija, B.B.; Rade, M.C. Optimal distributed generation planning at a local level—A review of Serbian renewable energy development. Renew. Sustain. Energy Rev. 2014, 39, 79–86. [Google Scholar]
- Liviu, R.; Mihai, P.M. Parallel operation of combined heat and power plants and wind farms. In Proceedings of the 2012 International Conference on Applied and Theoretical Electricity (ICATE), Craiova, Romania, 25–27 October 2012; pp. 1–4. [Google Scholar]
- Yuanhang, D.; Lei, C.; Yong, M.; Qun, C.; Kang, H.; Junhong, H.; Yiwei, Z.; Fei, X. Dispatch model of combined heat and power plant considering heat transfer process. IEEE Tarns. Sustain. Energy 2017, 8, 1225–1236. [Google Scholar]
- Ren, H.; Weisheng, Z.; Ken’ichi, N.; Weijun, G.; Qiong, W. Multi-onjective optimization for the operation of distributed energy systems considering economic and environmental aspects. Appl. Energy 2010, 87, 3642–3651. [Google Scholar] [CrossRef]
- Sreto, B. Planning algorithm for optimal combined heat & power generation plant connection in urban distribution network (UDN). In Proceedings of the 11th International Conference on the European Energy Market (EEM14), Krakow, Poland, 28–30 May 2014; Volume 11, pp. 1–7. [Google Scholar]
- Shekh, N.H.; Saiful, B. Waste heat recovery from exhaust of a diesel generator set using organic fluids. In Proceedings of the 10th International Conference on Mechanical Engineering, Dhaka, Bangladesh, 20–22 December 2013; Volume 10, pp. 439–444. [Google Scholar]
- Sreto, B. Combined heat & power plant connection into urban distribution network according to least cost technically acceptable principle. In Proceedings of the 50th International Universities Power Engineering Conference, Stoke on Trent, UK, 1–4 September 2015; Volume 50, pp. 1–6. [Google Scholar]
- Saint-Pierre, A.; Pierluigi, M. Techno-economic assessment of flexible combined heat and power plant with carbon capture and storage. In Proceedings of the 2014 Power Systems Computation Conference, Wroclaw, Poland, 18–22 August 2014; pp. 1–7. [Google Scholar]
- Constantin, S.; Nouredine, H.; Christophe, K.; Raphael, C. Combined heat and power plant optimization tool in a competitive energy market context. In Proceedings of the CIRED 2005—18th International Conference and Exhibition on Electricity Distribution, Turin, Italy, 6–9 June 2005; Volume 18. [Google Scholar]
- Eugen, H.; Mihai, G. Optimization of a combined cool, heat and power plant based on genetic algorithms and specialized software. In Proceedings of the 2014 International Conference and Exposition on Electrical and Power Engineering (EPE), Iasi, Romania, 16–18 October 2014; Volume 8, pp. 1030–1033. [Google Scholar]
- Daniel, S.; Felix, M. Increasing flexibility of combined heat and power plants with power-to-heat. In Proceedings of the 12th International Conference on the European Energy Market (EEM), Lisbon, Portugal, 19–22 May 2015; Volume 12, pp. 1–5. [Google Scholar]
- Buoro, D.; Casisi, M.; Nardi, D.A.; Pinamonti, P.; Reini, M. Multicriteria optimization of a distributed energy supply system for an industrial area. Energy 2013, 58, 128–137. [Google Scholar] [CrossRef]
- Somma, D.M.; Yan, B.; Bianco, N.; Graditi, G.; Luh, P.B.; Mongibello, L.; Naso, V. Multi-objective design optimization of distributed energy systems through cost and exergy assessments. Appl. Energy 2017, 204, 1299–1316. [Google Scholar] [CrossRef]
- Marialaura, D.S.; Bing, Y.; Nicola, B.; Peter, B.L.; Giorgio, G.; Luigi, M.; Vincenzo, N. Multi-objective operation optimization of a distributed energy system for a large-scale utility customer. Appl. Therm. Energy 2016, 101, 752–761. [Google Scholar]
- Zhang, G.; Cao, Y.; Cao, Y.; Li, D.; Wang, L. Optimal Energy Management for Microgrids with Combined Heat and Power (CHP) Generation Energy Storages and Renewable Energy Sources. Energies 2017, 10, 1288. [Google Scholar] [CrossRef]
- Li, P.; Wang, H.; Lv, Q.; Li, W. Combined Heat and Power Dispatch Considering Heat Storage of Both Buildings and Pipelines in District Heating System for Wind Power Integration. Energies 2017, 10, 893. [Google Scholar] [CrossRef]
- Zidan, A.; Gabbar, H. DG Mix and Energy Storage Units for Optimal Planning of Self-Sufficient Micro Energy Grids. Energies 2016, 9, 616. [Google Scholar] [CrossRef]
- Hussain, A.; Bui, V.; Kim, H.; Im, Y.; Lee, J. Optimal Energy Management of Combined Cooling Heat and Power in Different Demand Type Buildings Considering Seasonal Demand Variations. Energies 2017, 10, 789. [Google Scholar] [CrossRef]
- Alarcon-Rodriguez, A.; Ault, G.; Galloway, G. Multi-objective planning of distributed energy resources: A review of the state-of-the-art. Renew. Sustain. Energy Rev. 2010, 14, 1353–1566. [Google Scholar] [CrossRef]
- Di Somma, M.; Graditi, G.; Heydarian-Forushani, E.; Shafie-khah, M.; Siano, P. Stochastic optimal scheduling of distributed energy resources with renewables considering economic and environmental aspects. Renew. Energy 2018, 116, 272–287. [Google Scholar] [CrossRef]
- Maroufmashat, A.; Sattari, S.; Roshandel, R.; Fowler, M.; Elkamel, A. Multi-objective optimization for design and operation of distributed energy systems through the multi-energy hub network approach. Ind. Eng. Chem. Res. 2016, 55, 8950–8966. [Google Scholar] [CrossRef]
- Pakistan Bureau of Statistics. Available online: http://www.pbscensus.gov.pk/content/area-population-aadministrative-units (accessed on 23 August 2017).
- NASA Surface Meteorology and Solar Energy. Available online: https://eosweb.larc.nasa.gov/cgi-bin/sse/[email protected] (accessed on 2 January 2017).
- Tribune. Available online: https://www.tribune.com.pk/story/1357453/going-green-pakistan-1-9mw-solar-energy-potential/ (accessed on 17 March 2017).
- Fahd, D.; Hai, L.; Lijun, Z.; Salwa, A. An Environmentally-Friendly Tourist Village in Egypt Based on a Hybrid Renewable Energy System––Part One: What Is the Optimum City? Energies 2015, 8, 6926–6944. [Google Scholar]
- PAkBIZ. Available online: http://www.pakbiz.com/finance/petroleumprices/ (accessed on 3 January 2017).
- Pavan, Y.V.; Ravikumar, B. Renewable energy based microgrid system sizing and energy management for green buildings. J. Mod. Power Syst. Clean Energy 2015, 3, 1–13. [Google Scholar] [CrossRef] [Green Version]
- Tom, L.; Paul, G.; Peter, L. Micropower system modeling with HOMER. Integr. Altern. Sour. Energy 2006, 379–418. [Google Scholar] [CrossRef]
- Homer Microgrid NEWS and Insight. Available online: http://microgridnews.com/homer-optimizer-a-faster-path-to-finding-least-cost-microgrid-options/ (accessed on 23 August 2017).
Figure 1.
Electrical load in a without thermal system.
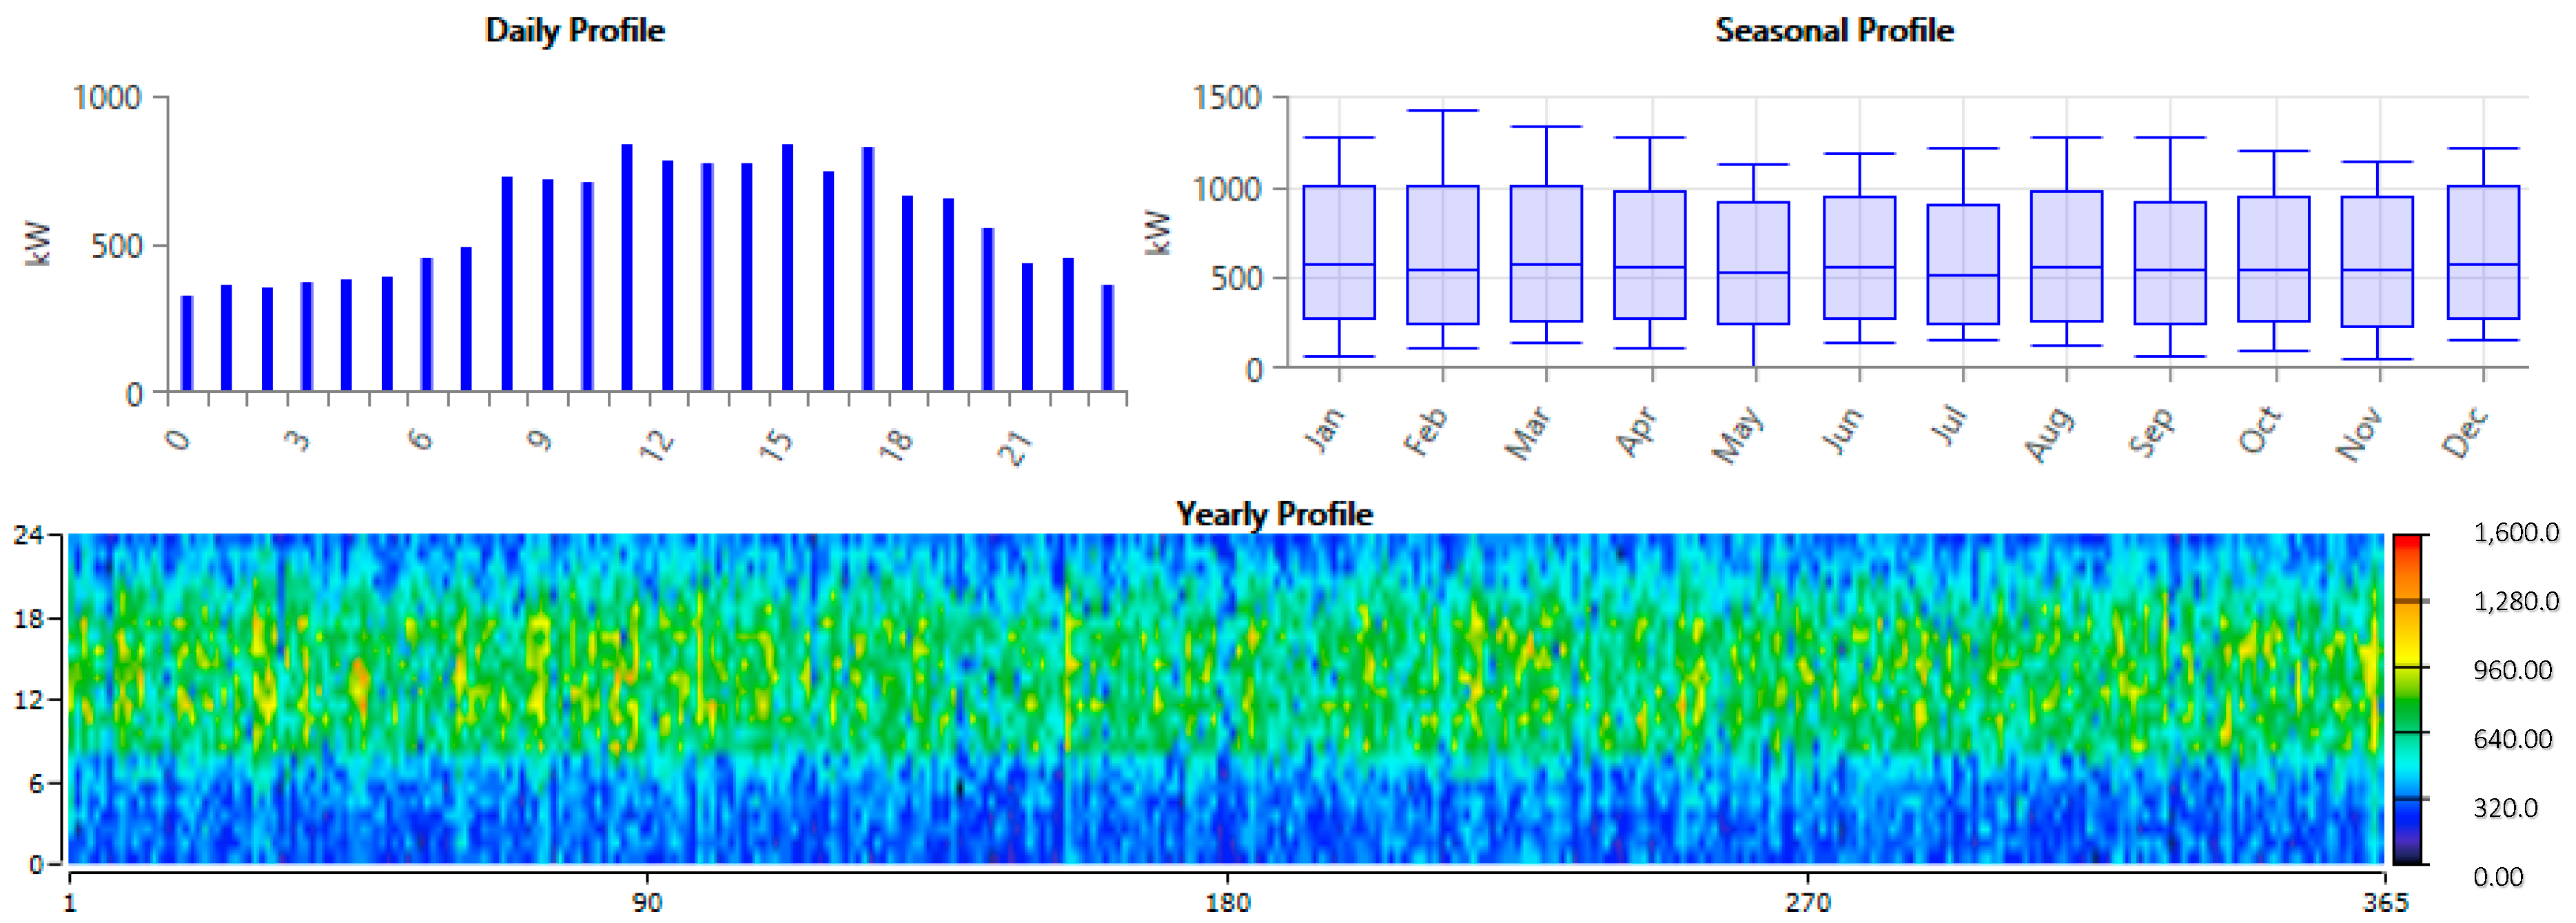
Figure 2.
Electrical load in a CHP plant integrated microgrid.

Figure 3.
Thermal load in a CHP plant integrated microgrid.
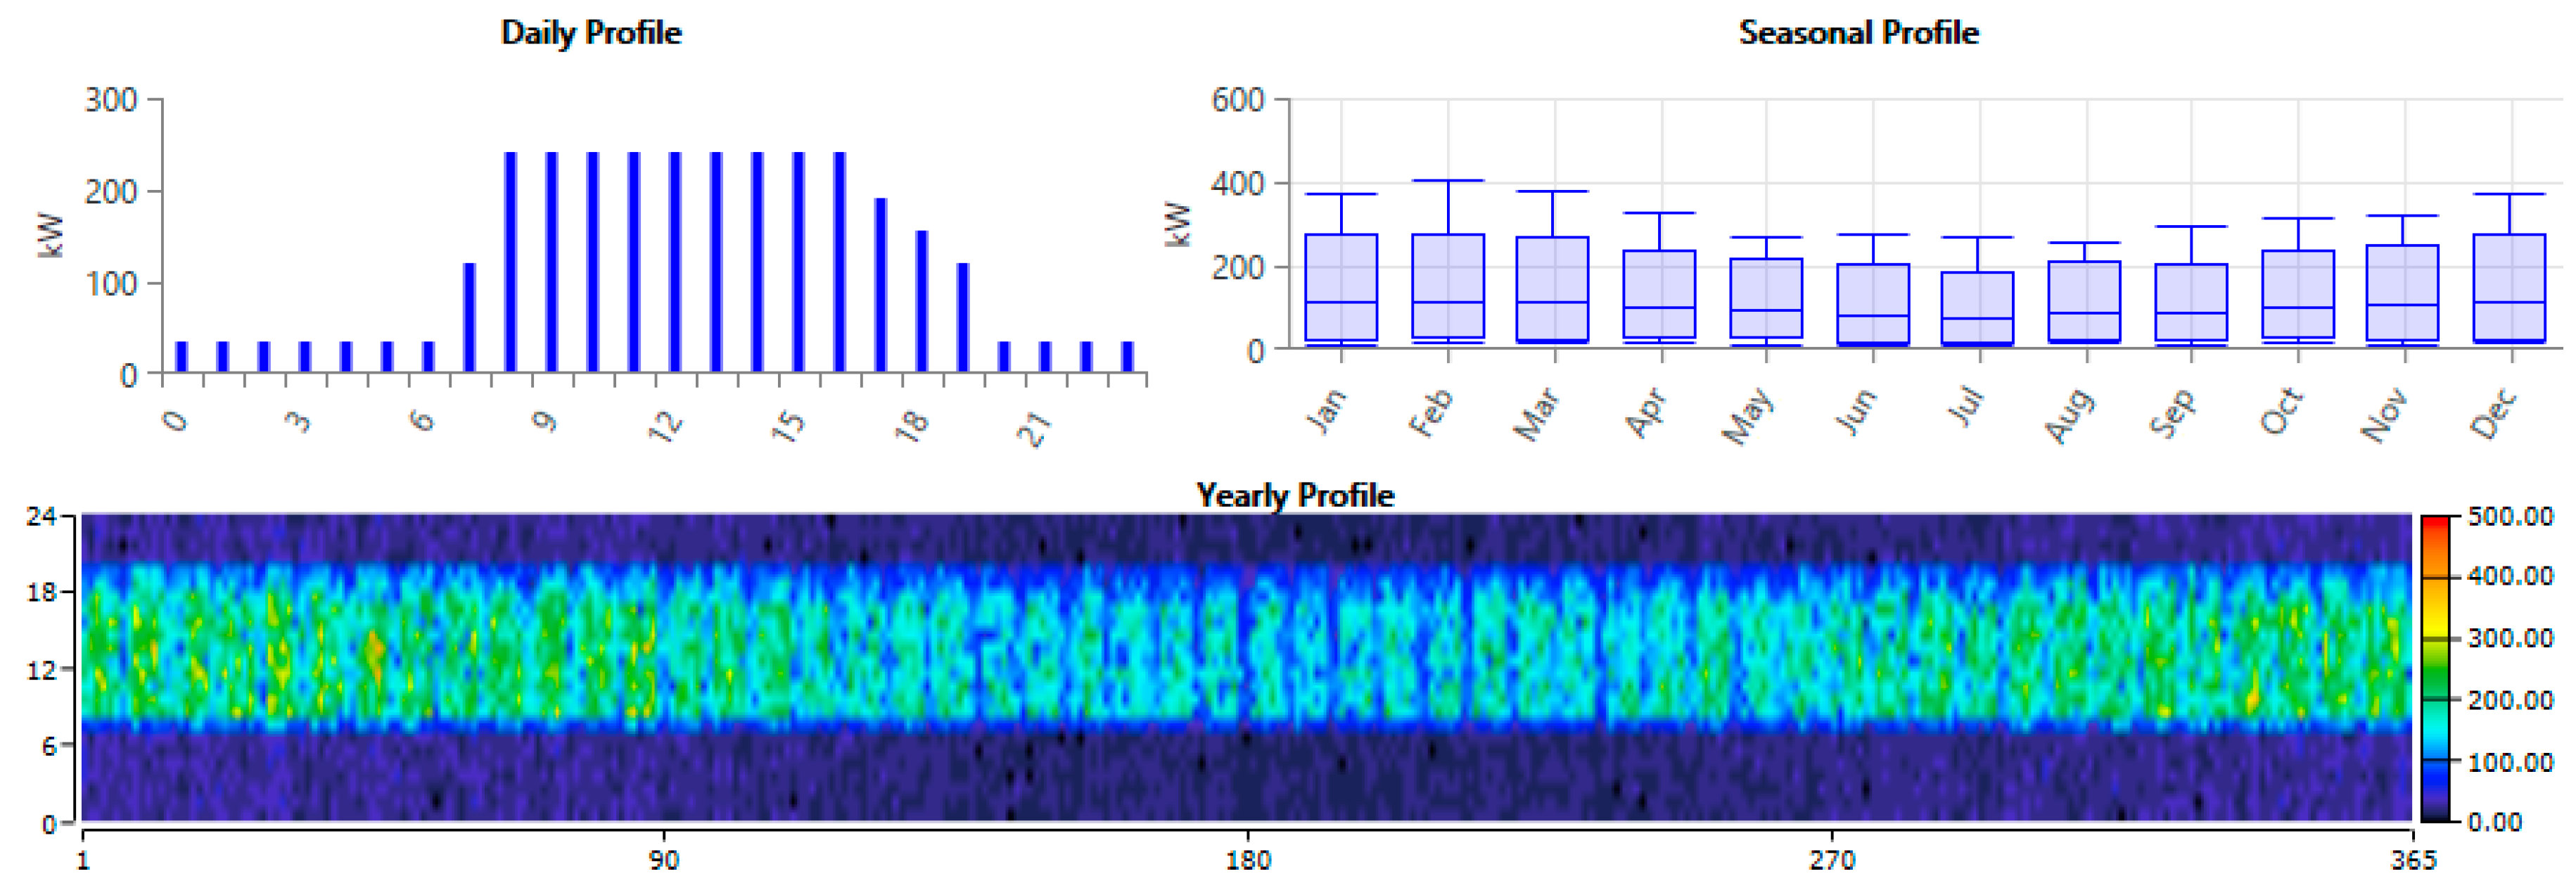
Figure 4.
Average monthly solar irradiance data of Islamabad, Lahore, Karachi, Peshawar, Quetta and Gilgit.
Figure 4.
Average monthly solar irradiance data of Islamabad, Lahore, Karachi, Peshawar, Quetta and Gilgit.
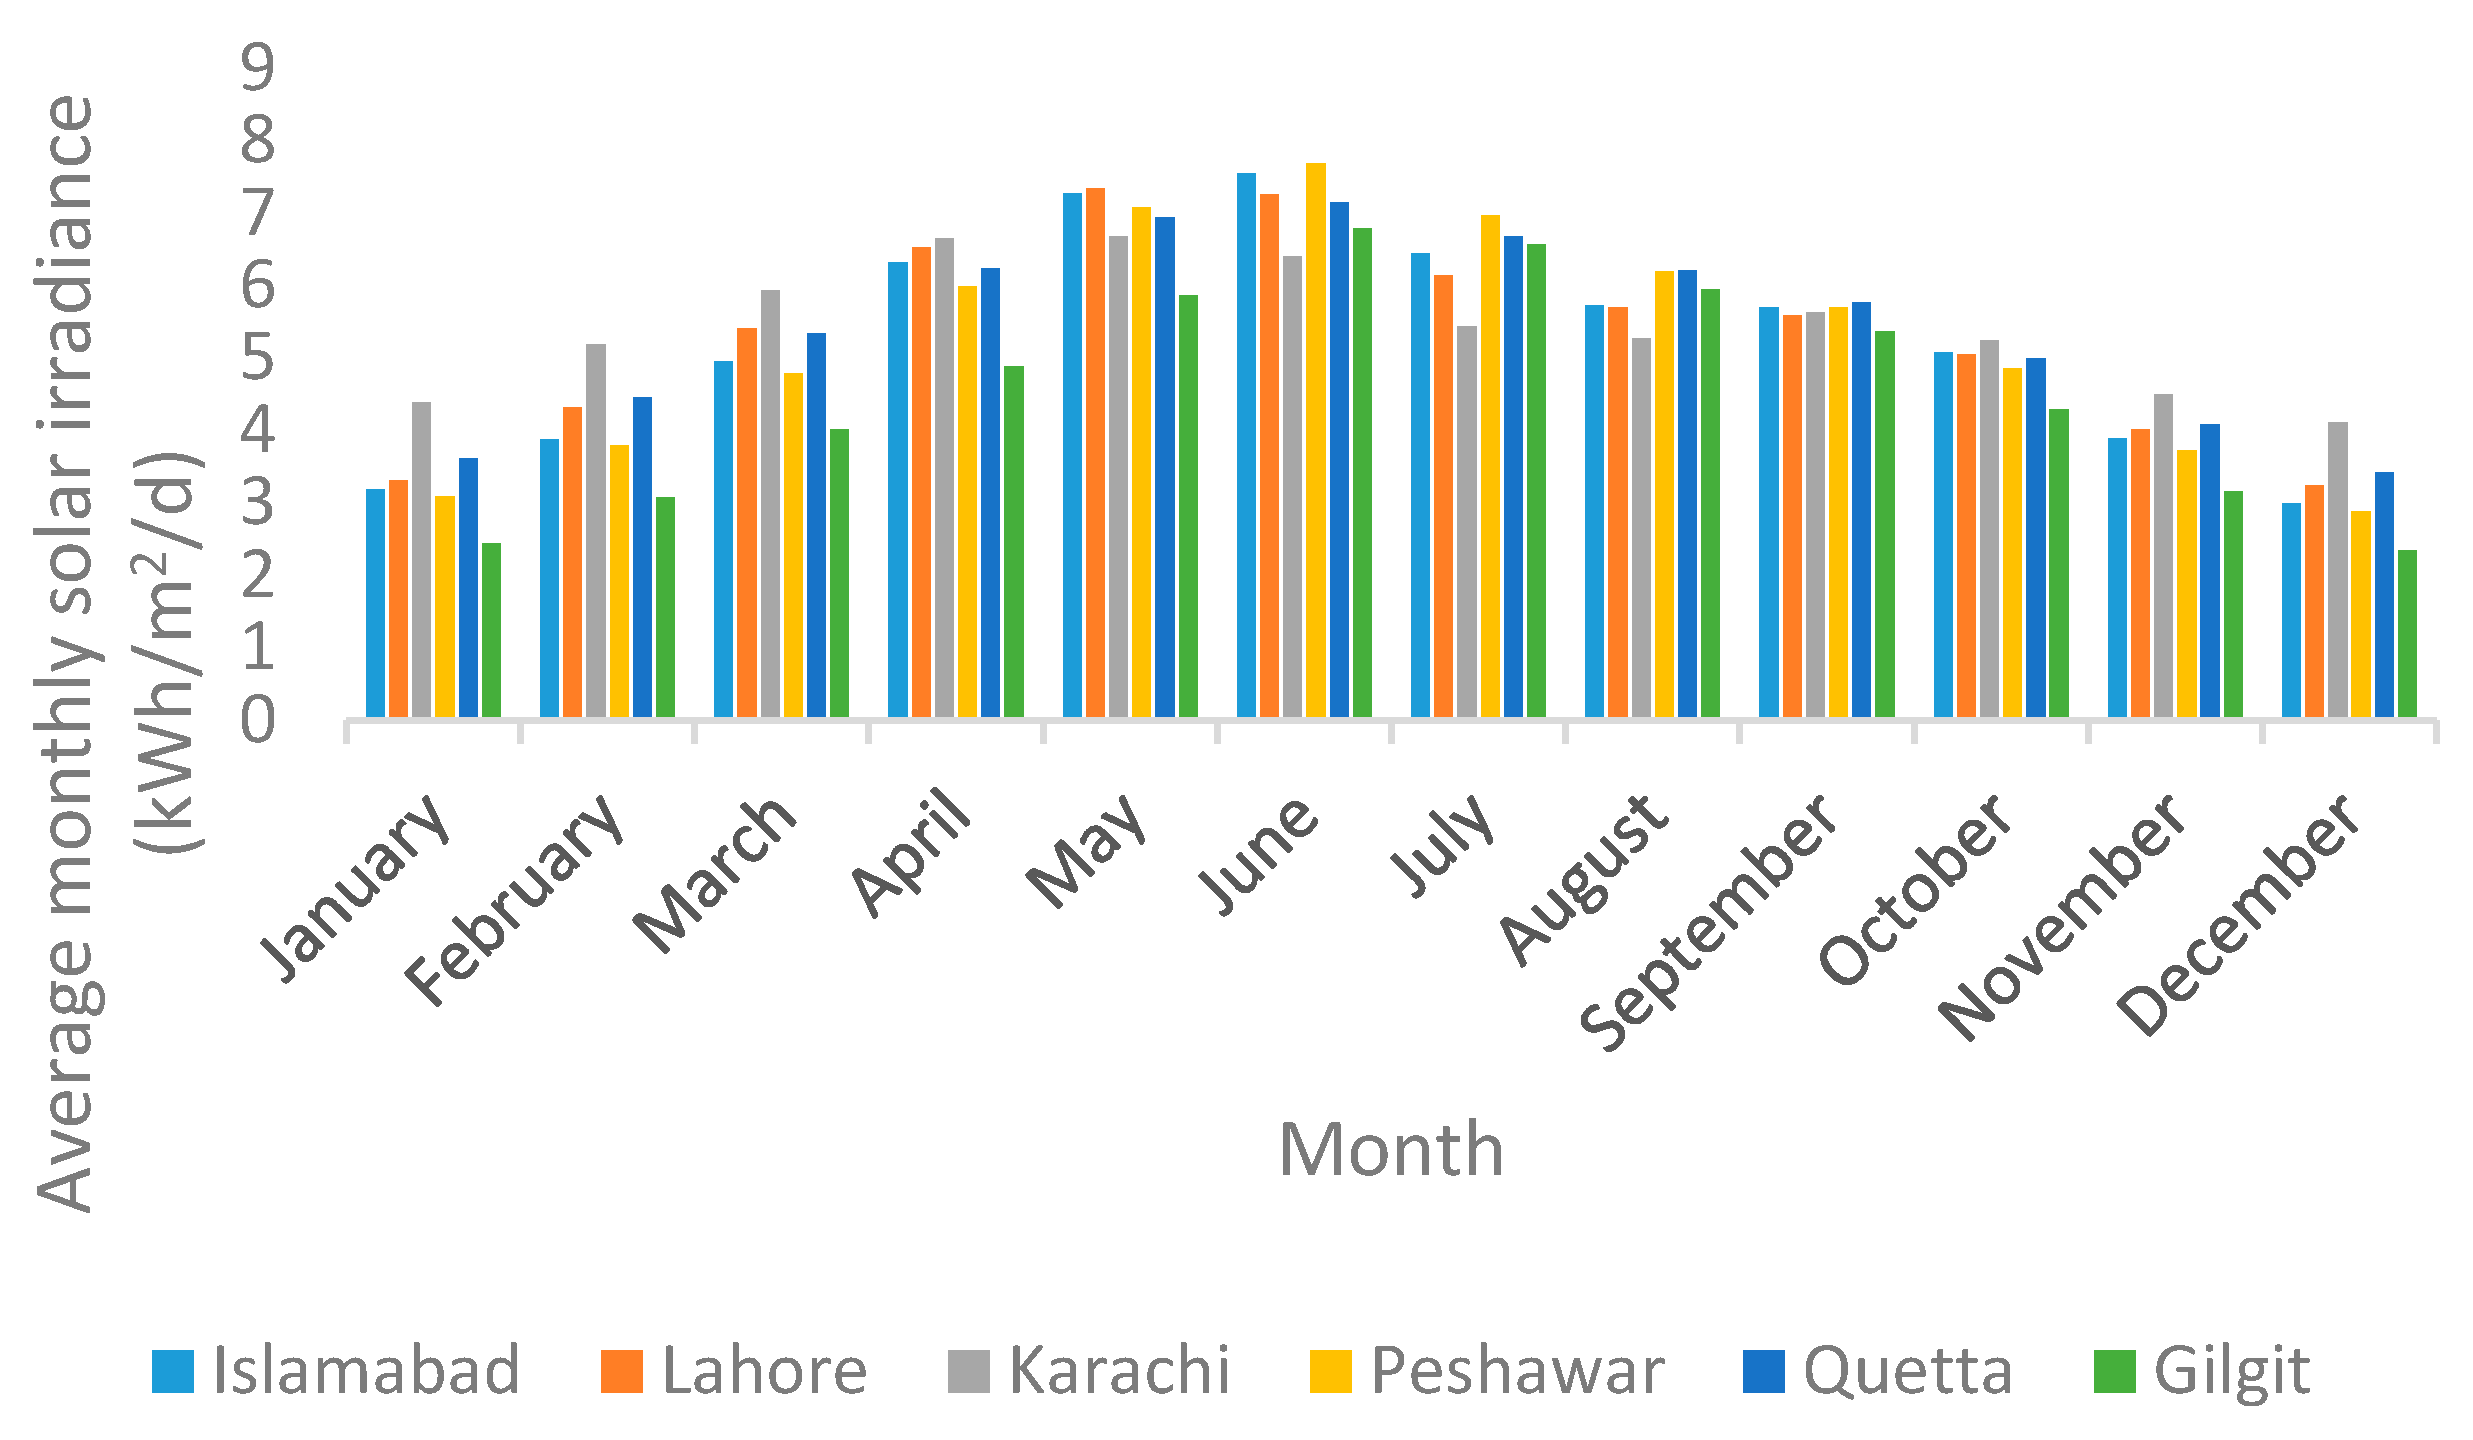
Figure 5.
Average monthly earth’s surface temperature of Islamabad, Lahore, Karachi, Peshawar, Quetta and Gilgit.
Figure 5.
Average monthly earth’s surface temperature of Islamabad, Lahore, Karachi, Peshawar, Quetta and Gilgit.
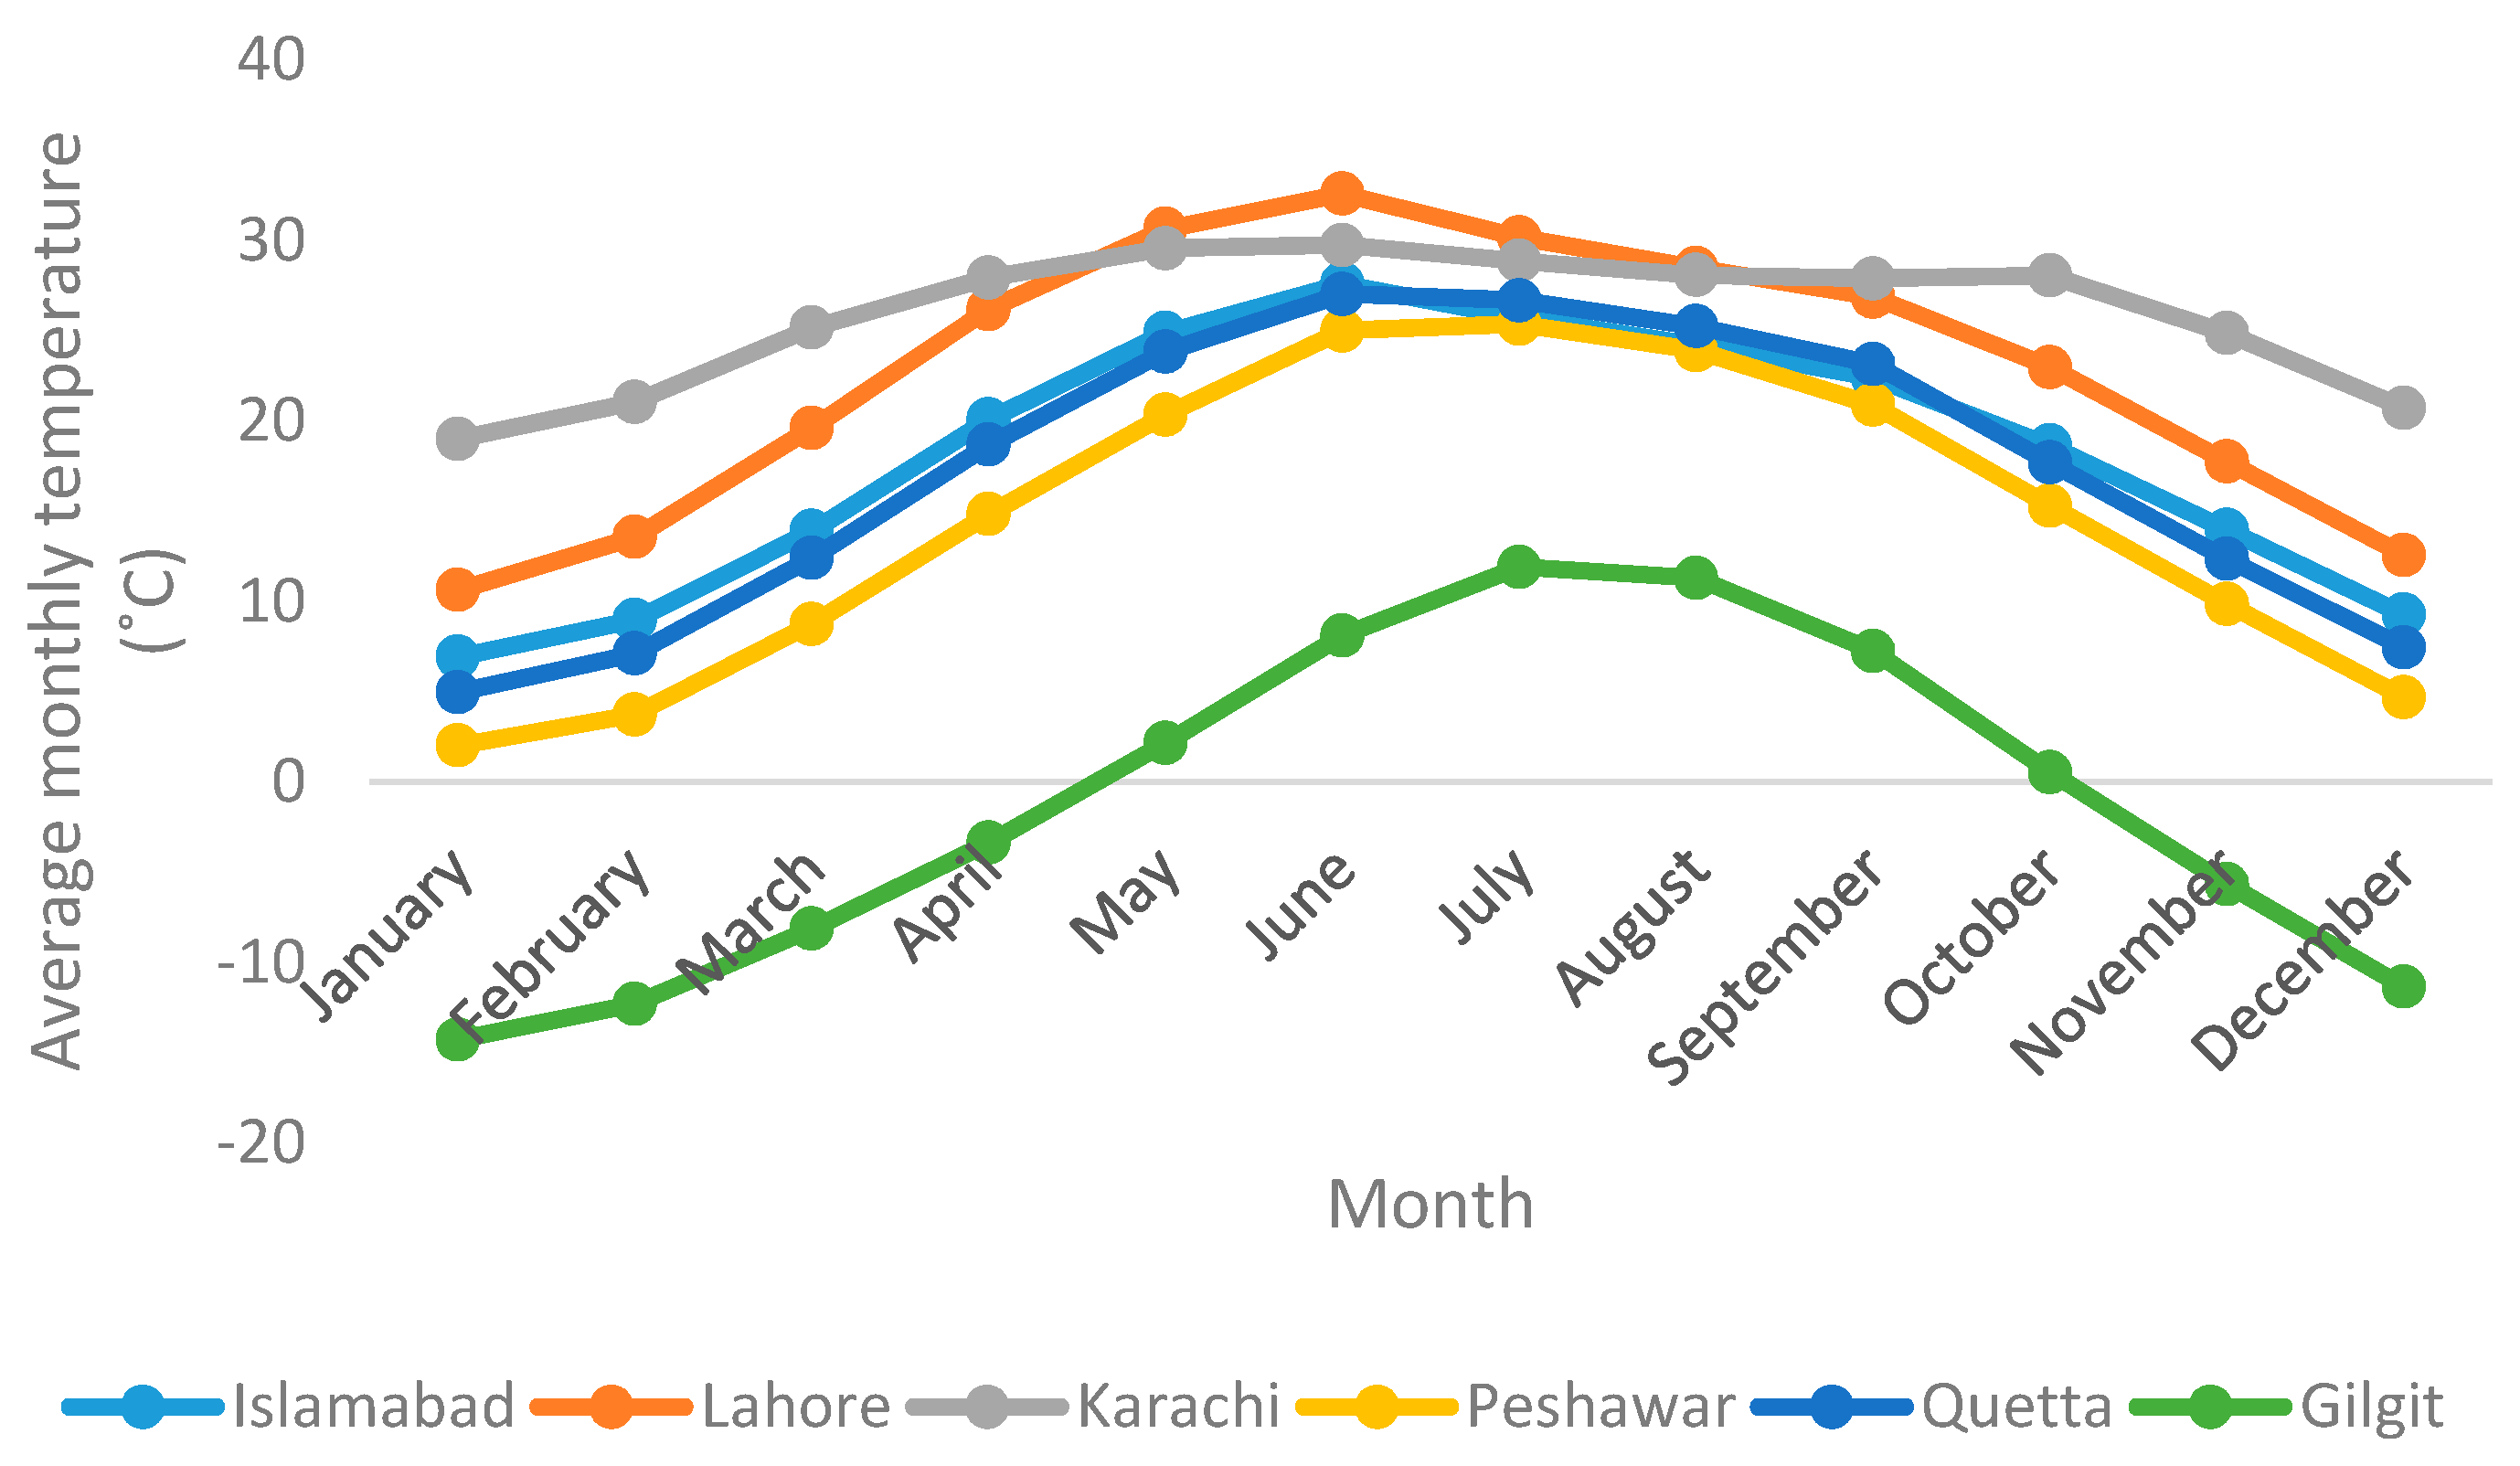
Figure 6.
Conventional diesel generators only system.
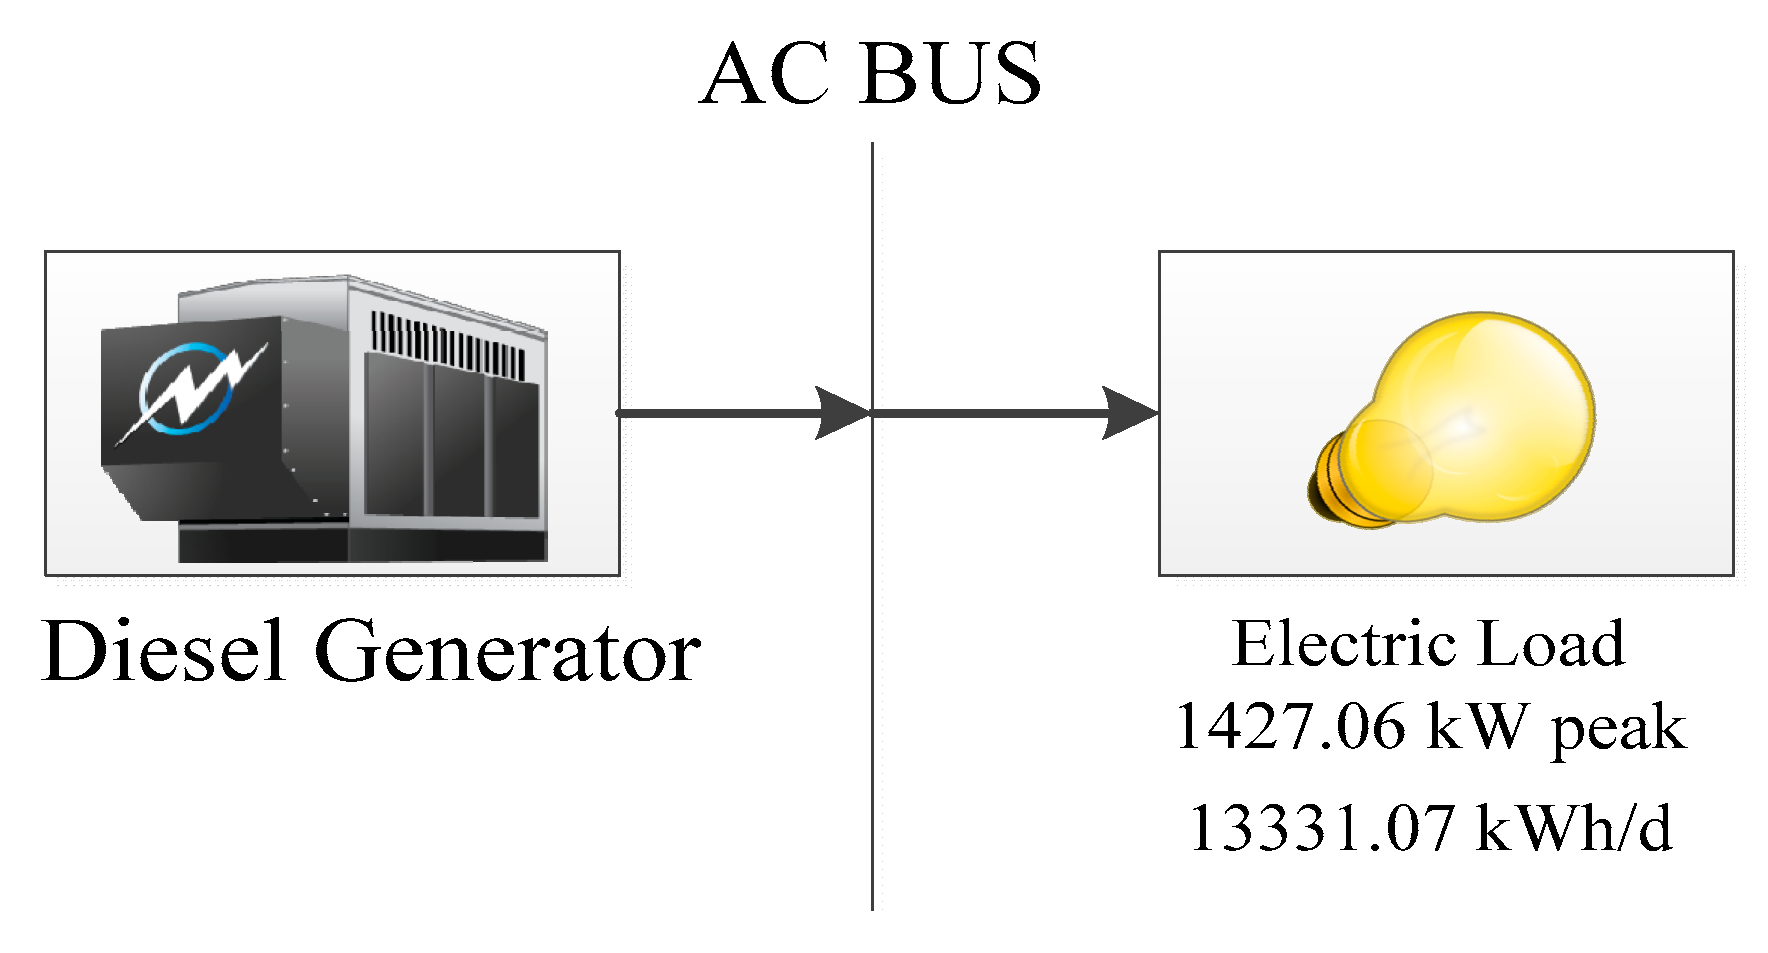
Figure 7.
(a) Isolated single generator (1Gen) and single PV (1PV) without WHR system (b) Isolated double generator (2Gen) and double PV (2PV) without WHR system (c) Isolated single generator (1Gen) and single PV (1PV) with WHR system (d) Isolated double generator (2Gen) and double PV (2PV) with WHR system (e) Isolated single generator (1Gen), single PV (1PV) and battery without WHR system (f) Isolated double generator (2Gen), double PV (2PV) and battery without WHR system (g) Isolated single generator (1Gen), single PV (1PV) and battery with WHR system (h) Isolated double generator (2Gen), double PV (2PV) and battery with WHR system.
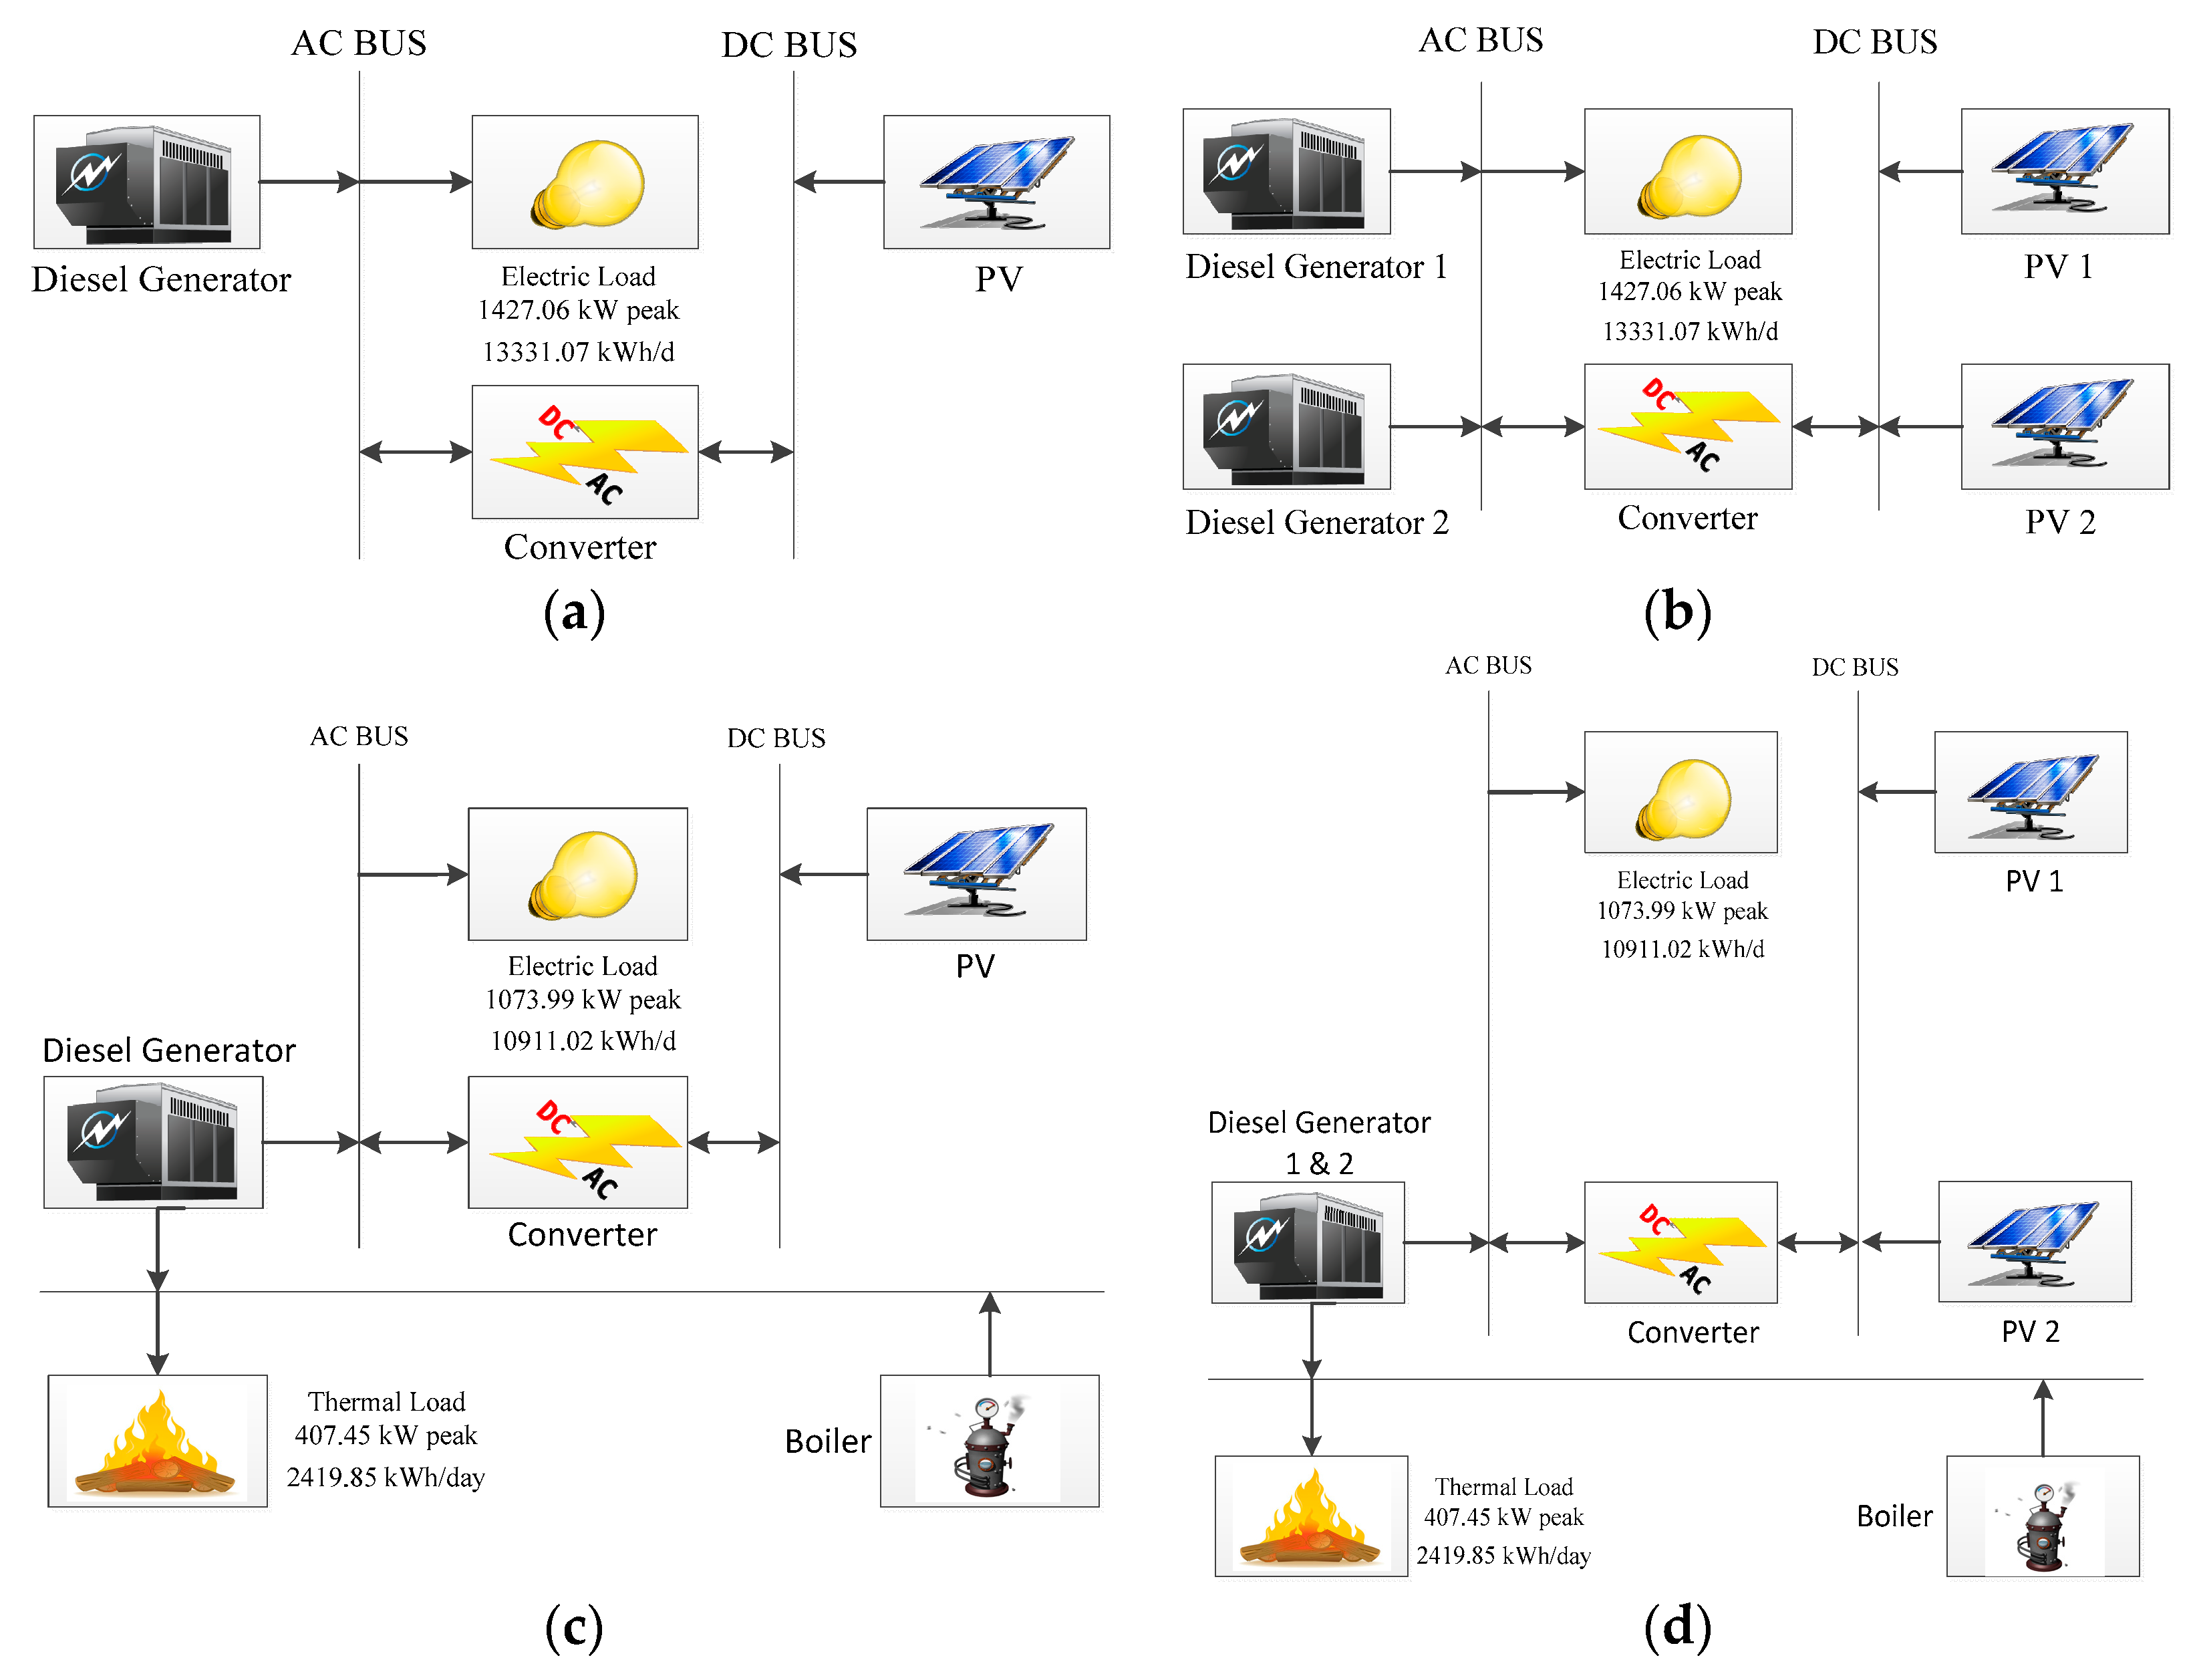

Figure 8.
(a) Grid-connected single generator (1Gen) and single PV (1PV) without WHR system (b) Grid-connected double generator (2Gen) and double PV (2PV) without WHR system (c) Grid-connected single generator (1Gen) and single PV (1PV) with WHR system (d) Grid-connected double generator (2Gen) and double PV (2PV) with WHR system (e) Grid-connected single generator (1Gen), single PV (1PV) and battery without WHR system (f) Grid-connected double generator (2Gen), double PV (2PV) and battery without WHR system (g) Grid-connected single generator (1Gen), single PV (1PV) and battery with WHR system (h) Grid-connected double generator (2Gen), double PV (2PV) and battery with WHR system.


Figure 9.
Homer Pro flow chart.

Figure 10.
TNPC comparison.

Figure 11.
COE comparison.
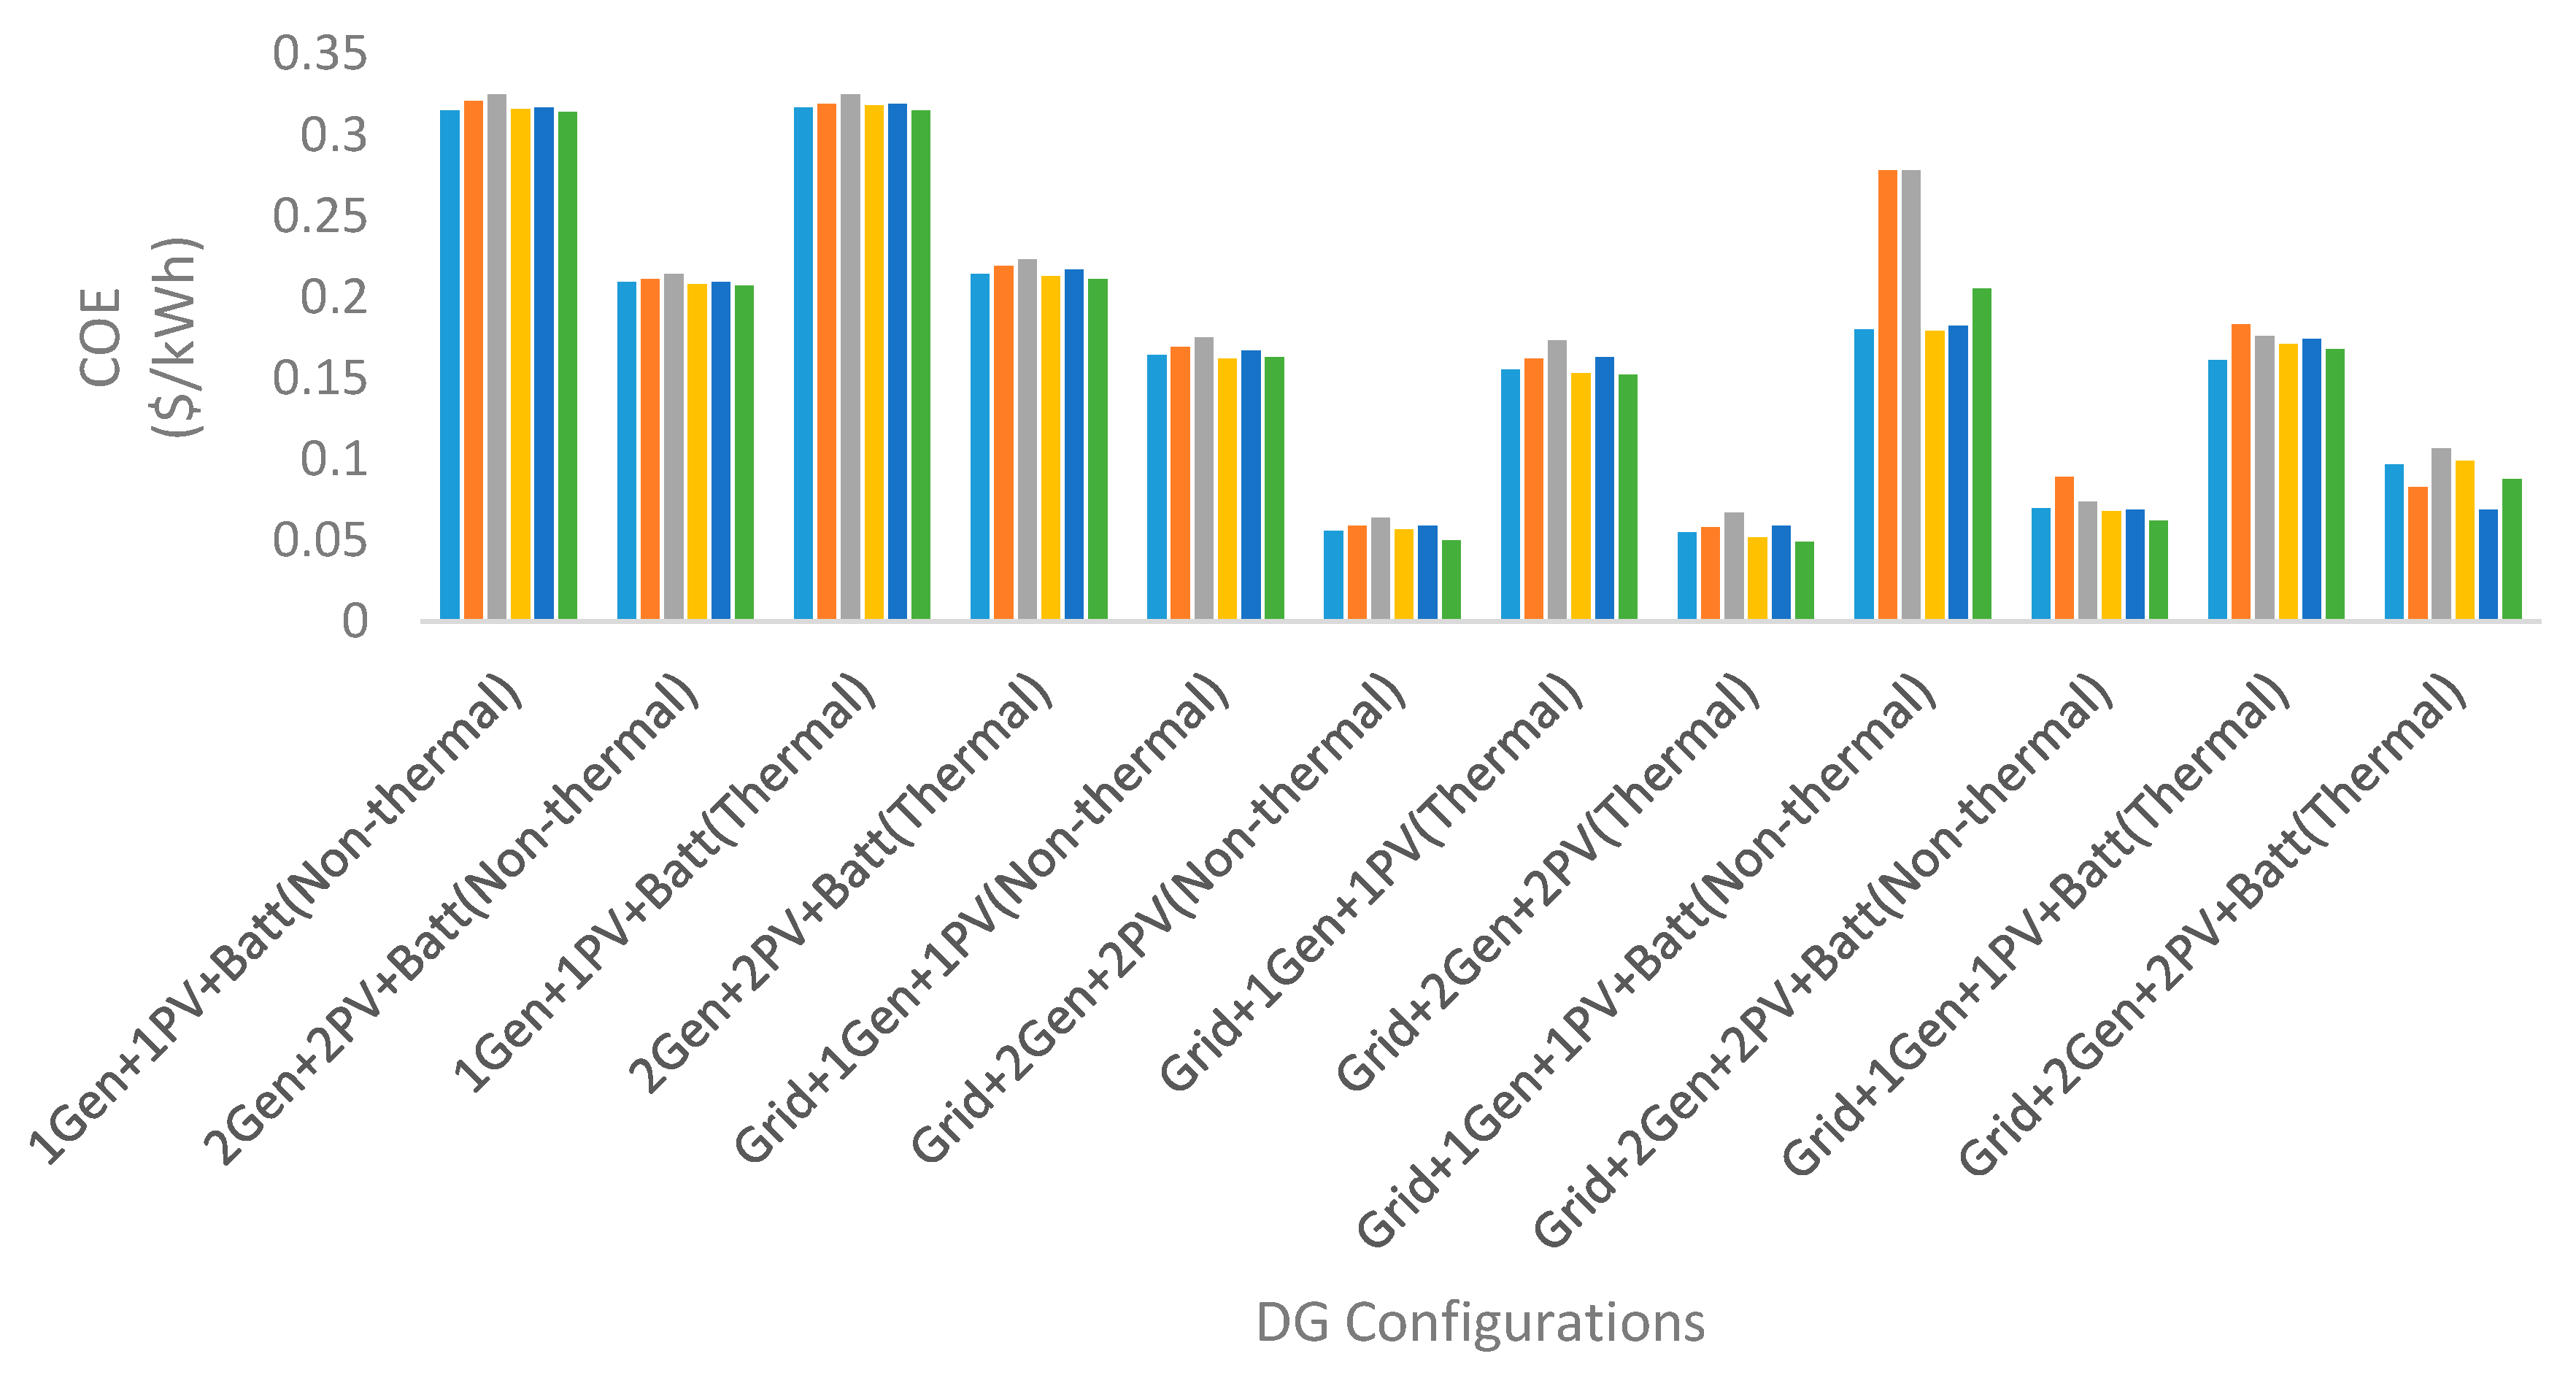
Figure 12.
GHG emissions comparison.
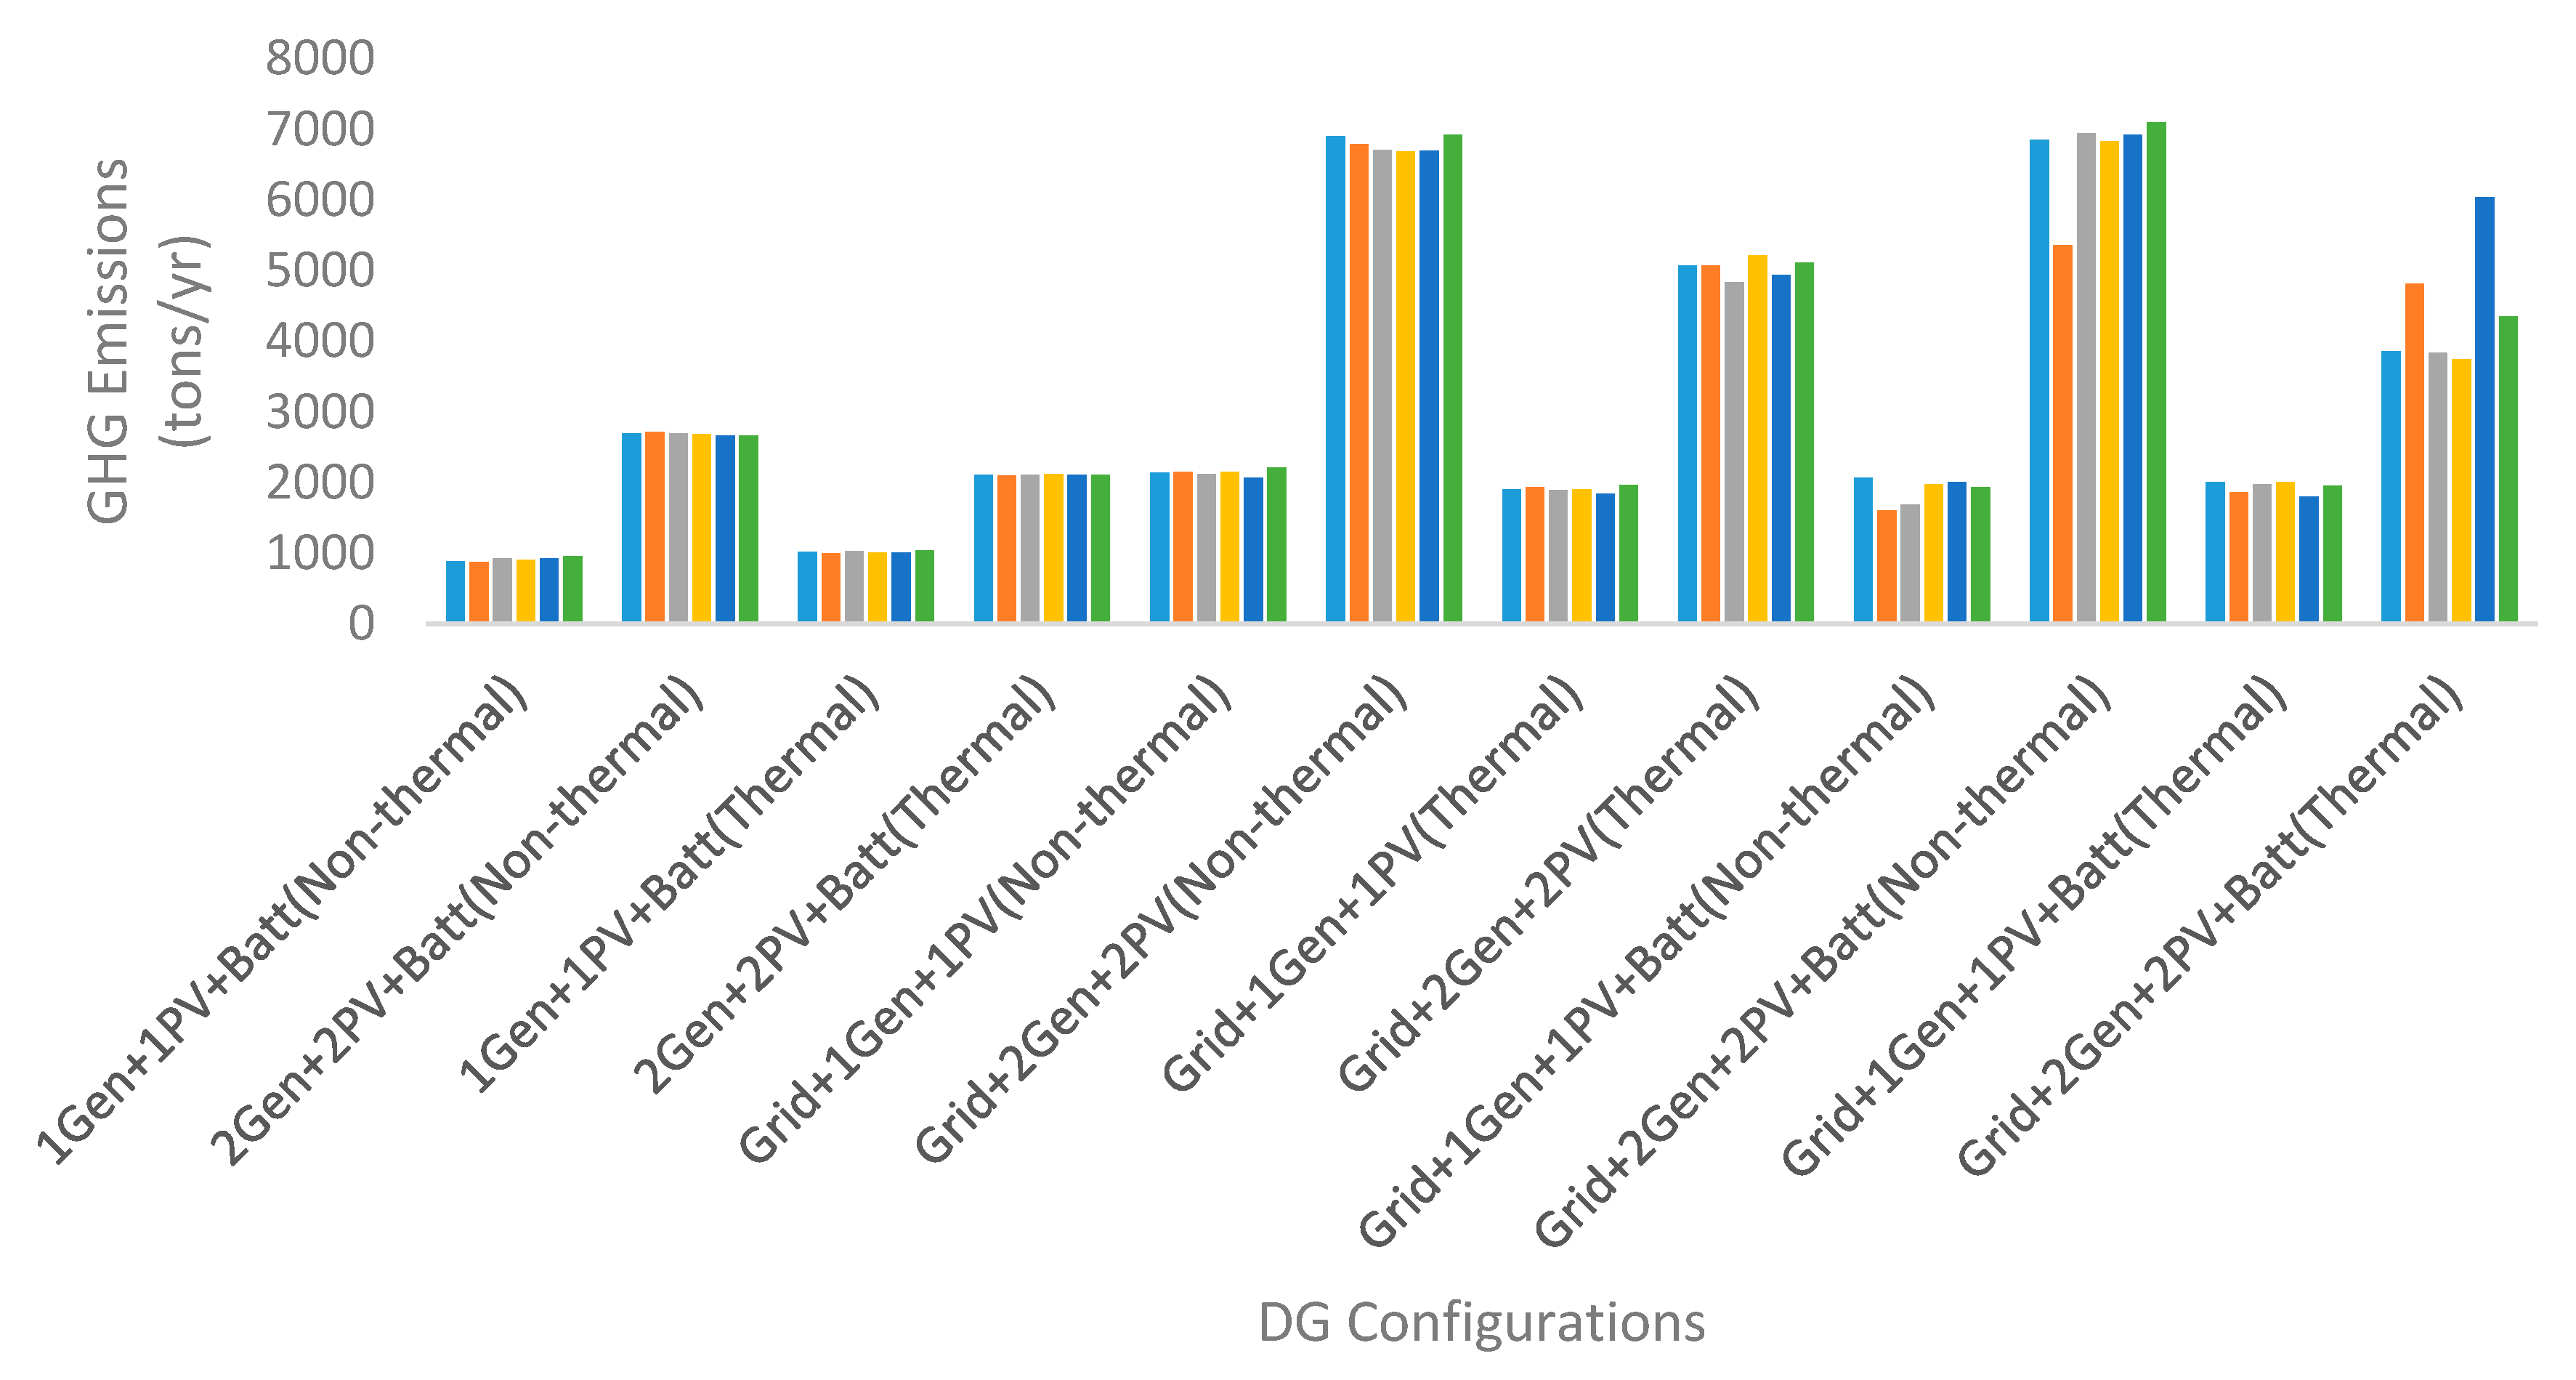
Figure 13.
WHR comparison.
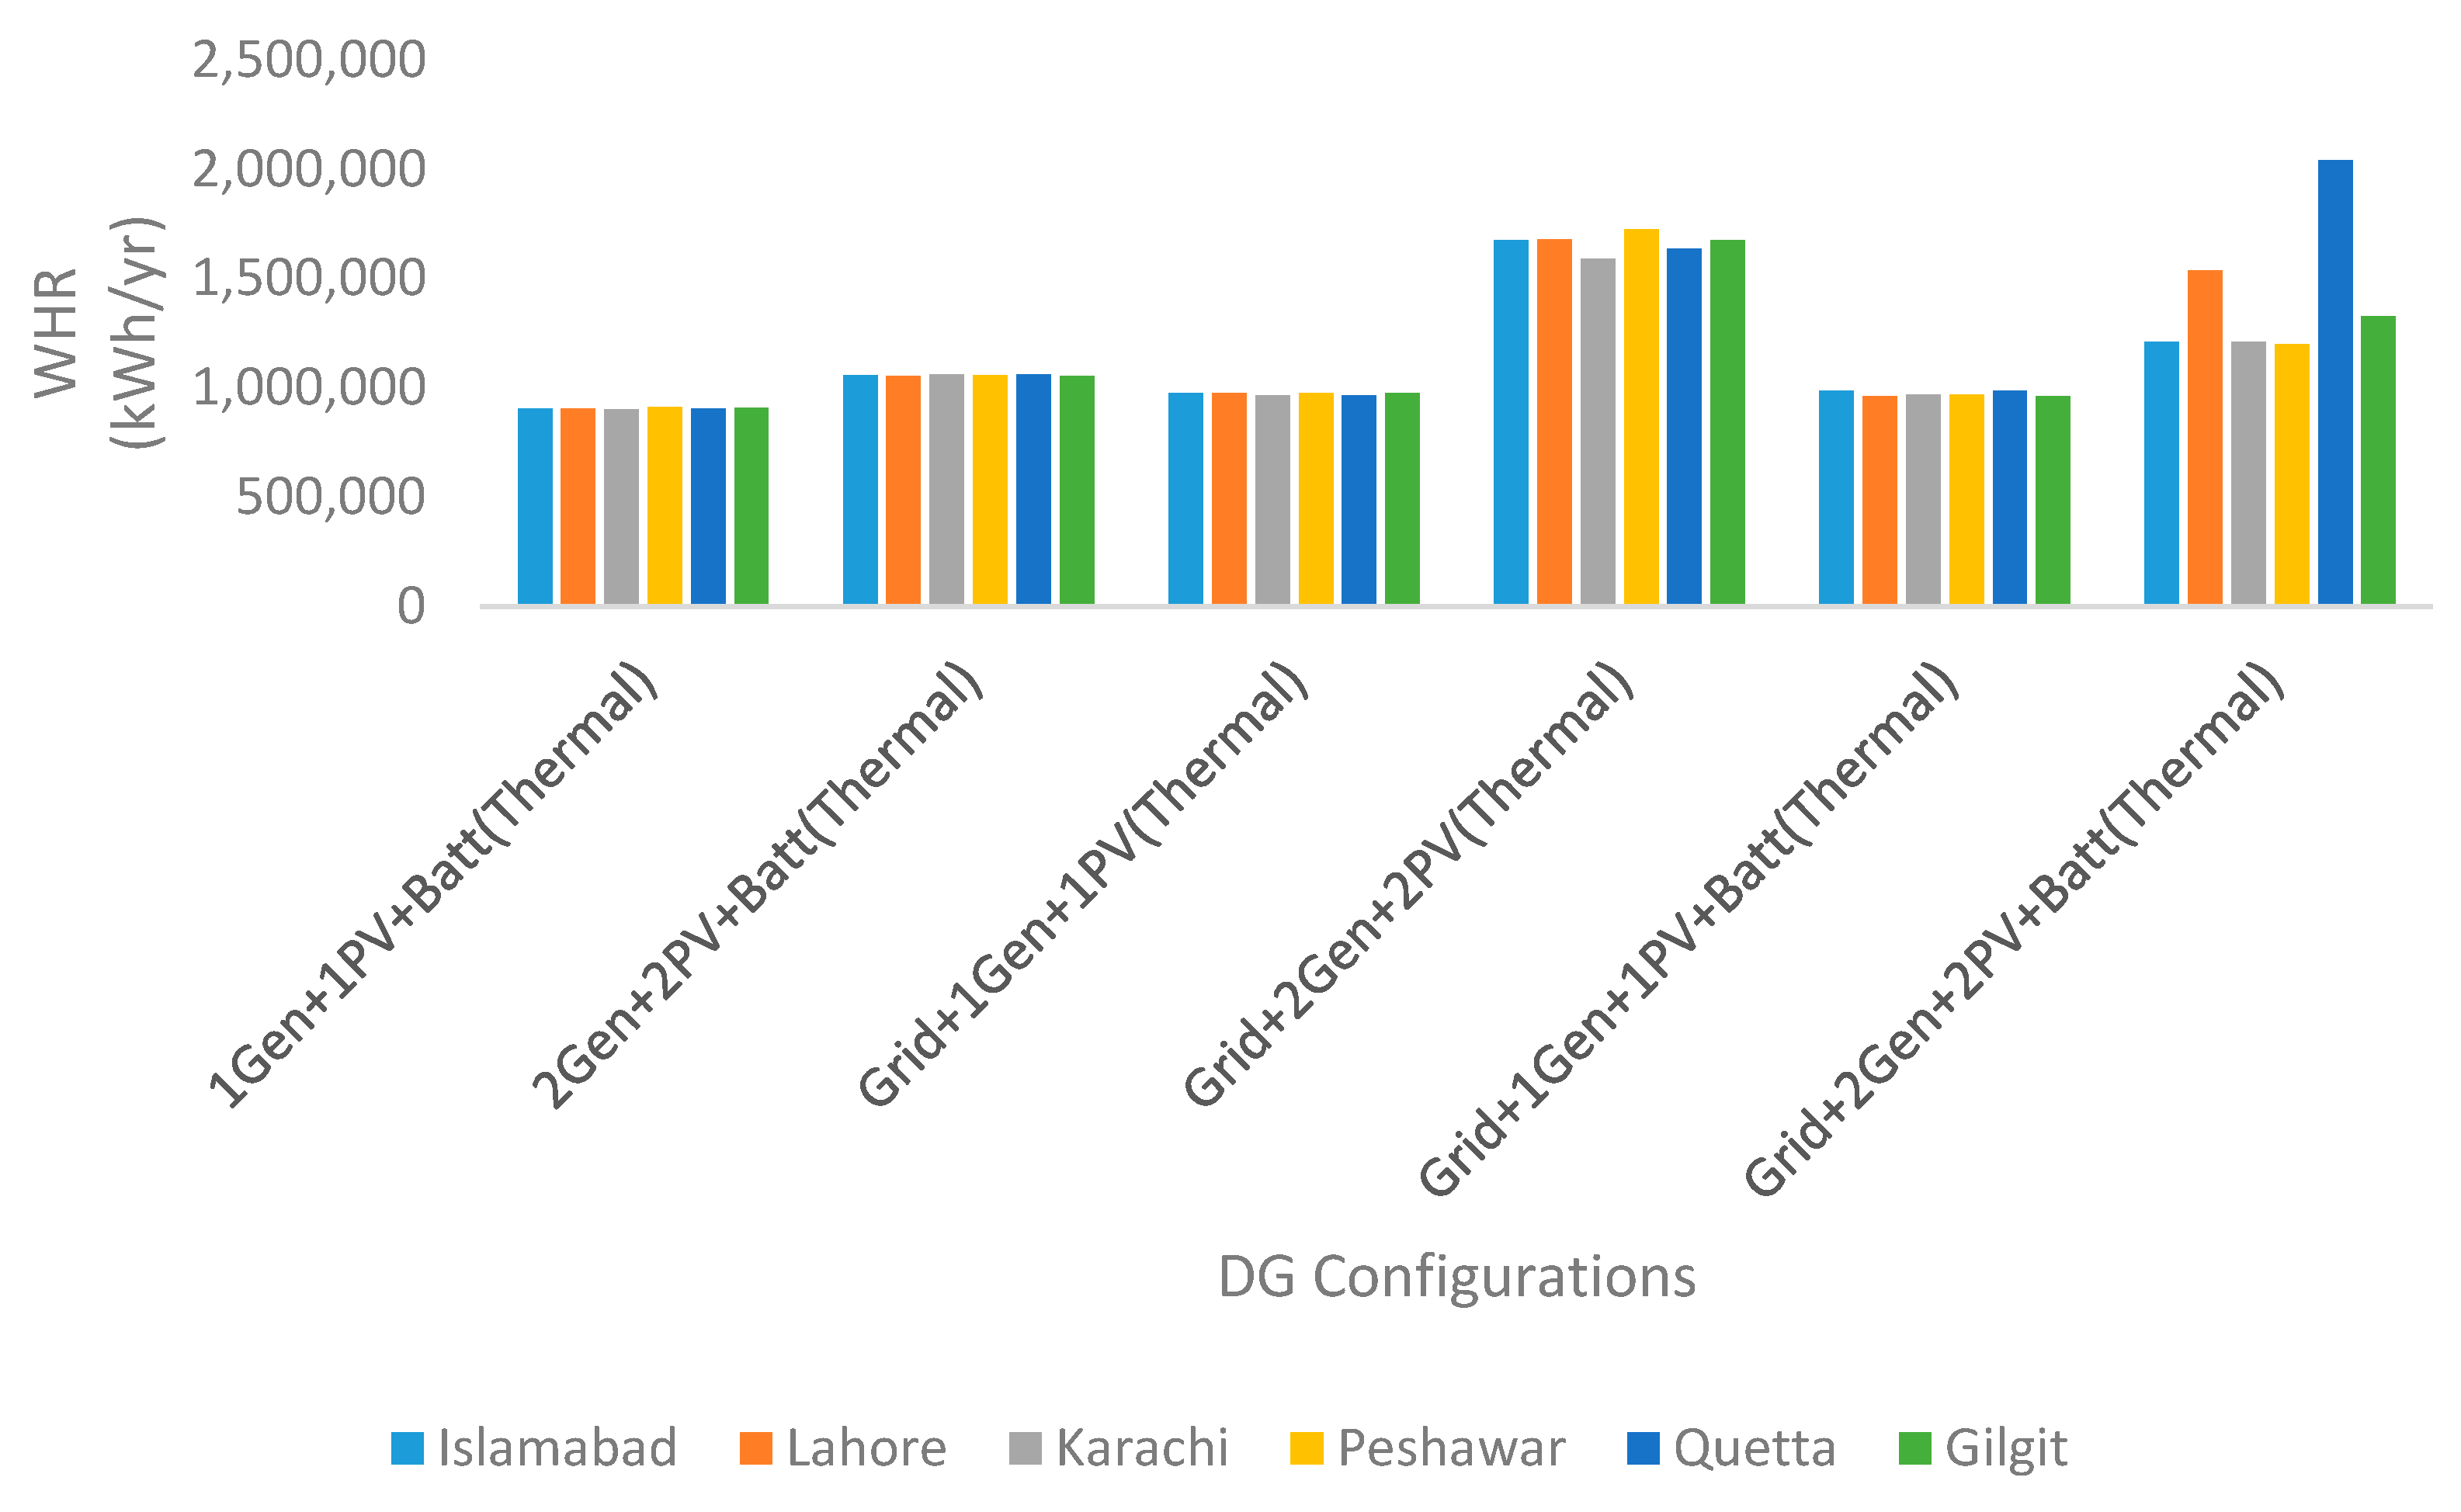
Figure 14.
Grid sales comparison.


Table 1.
Costs.
| Component | Capital Cost | Replacement Cost | O&M Cost | Life Time |
|---|---|---|---|---|
| PV module | 3000 $/kW | 2500 $/kW | 10 $/year | 20 years |
| Power converter | 800 $/kW | 600 $/kW | 5 $/year | 15 years |
| Battery | 300 $/kWh | 250 $/kWh | 10 $/year | 12,600 kWh |
| Diesel generator | 400 $/kW | 300 $/kW | 0.25 $/h | 15,000 h |
Table 2.
Technical details.
| Technical Details | Value |
|---|---|
| Derating factor | 80% |
| Ground reflection | 20% |
| Converter efficiency | 90% |
| Fuel cost | 0.75 $/L |
| Annual nominal interest rate | 8% |
| Project lifetime | 25 years |
| Emissions penalty | 20 $/ton |
| Capacity shortage penalty | 20 $/kWh |
Table 3.
Sizes.
| Component | Range |
|---|---|
| PV | 0–4000 kW |
| Diesel Generator | 0–2000 kW |
| Battery | 0–200 string size |
| Converter | 0–5000 kW |
Table 4.
Optimal configurations for Islamabad, Lahore and Karachi.
| City | Sr. No. | DGs’ Configuration | DGen1 (kW) | DGen2 (kW) | PV1 (kW) | PV2 (kW) | Battery (kWh) | Converter (kW) |
|---|---|---|---|---|---|---|---|---|
| All Cities | CONVENTIONAL DIESEL ONLY SYSTEM | |||||||
| 1 | Diesel only system | 1570 | - | - | - | - | - | |
| Islamabad | ISOLATED SYSTEM | |||||||
| 1 | 1Gen + 1PV + Batt (without WHR) | 750 | - | 1388 | - | 2112 | 1179 | |
| 2 | 2Gen + 2PV + Batt (without WHR) | 300 | 550 | 50 | 891 | 816 | 720 | |
| 3 | 1Gen + 1PV + Batt (with WHR) | 600 | - | 1065 | - | 1536 | 889 | |
| 4 | 2Gen + 2PV + Batt (with WHR) | 300 | 500 | 62.5 | 910 | 480 | 696 | |
| GRID-CONNECTED SYSTEM | ||||||||
| 5 | Grid + 1Gen + 1PV (without WHR) | 1050 | - | 2766 | - | - | 1733 | |
| 6 | Grid + 2Gen + 2PV (without WHR) | 50 | 1350 | 644 | 1405 | - | 1343 | |
| 7 | Grid + 1Gen + 1PV (with WHR) | 850 | - | 2366 | - | - | 1521 | |
| 8 | Grid + 2Gen + 2PV (with WHR) | 50 | 1000 | 1053 | 1269 | - | 1492 | |
| 9 | Grid + 1Gen + 1PV + Batt (without WHR) | 1050 | - | 2698 | - | 1704 | 1727 | |
| 10 | Grid + 2Gen + 2PV + Batt (without WHR) | 550 | 1550 | 1023 | 1308 | 240 | 1110 | |
| 11 | Grid + 1Gen + 1PV + Batt (with WHR) | 900 | - | 2238 | - | 1224 | 1393 | |
| 12 | Grid + 2Gen + 2PV + Batt (with WHR) | 550 | 500 | 436 | 1384 | 1536 | 1201 | |
| Lahore | ISOLATED SYSTEM | |||||||
| 1 | 1Gen + 1PV + Batt (without WHR) | 750 | - | 1502 | - | 2112 | 1184 | |
| 2 | 2Gen + 2PV + Batt (without WHR) | 250 | 550 | 124 | 860 | 864 | 700 | |
| 3 | 1Gen + 1PV + Batt (with WHR) | 600 | - | 1146 | - | 1560 | 914 | |
| 4 | 2Gen + 2PV + Batt (with WHR) | 350 | 500 | 96.9 | 928 | 480 | 698 | |
| GRID-CONNECTED SYSTEM | ||||||||
| 5 | Grid + 1Gen + 1PV (without WHR) | 1050 | - | 2889 | - | - | 1733 | |
| 6 | Grid + 2Gen + 2PV (without WHR) | 50 | 1300 | 729 | 1386 | - | 1307 | |
| 7 | Grid + 1Gen + 1PV (with WHR) | 850 | - | 2354 | - | - | 1468 | |
| 8 | Grid + 2Gen + 2PV (with WHR) | 50 | 1000 | 976 | 1484 | - | 1515 | |
| 9 | Grid + 1Gen + 1PV + Batt (without WHR) | 750 | - | 1839 | - | 2184 | 809 | |
| 10 | Grid + 2Gen + 2PV + Batt (without WHR) | 400 | 850 | 319 | 1451 | 2208 | 1098 | |
| 11 | Grid + 1Gen + 1PV + Batt (with WHR) | 800 | - | 2133 | - | 1416 | 1501 | |
| 12 | Grid + 2Gen + 2PV + Batt (with WHR) | 250 | 850 | 2306 | 265 | 1032 | 1444 | |
| Karachi | ISOLATED SYSTEM | |||||||
| 1 | 1Gen + 1PV + Batt (without WHR) | 700 | - | 1448 | - | 1896 | 1233 | |
| 2 | 2Gen + 2PV + Batt (without WHR) | 300 | 550 | 50 | 1012 | 672 | 743 | |
| 3 | 1Gen + 1PV + Batt (with WHR) | 550 | - | 1169 | - | 1608 | 870 | |
| 4 | 2Gen + 2PV + Batt (with WHR) | 300 | 500 | 160 | 946 | 456 | 750 | |
| GRID-CONNECTED SYSTEM | ||||||||
| 5 | Grid + 1Gen + 1PV (without WHR) | 1000 | - | 2930 | - | - | 1733 | |
| 6 | Grid + 2Gen + 2PV (without WHR) | 50 | 1250 | 1316 | 880 | - | 1368 | |
| 7 | Grid + 1Gen + 1PV (with WHR) | 800 | - | 2313 | - | - | 1425 | |
| 8 | Grid + 2Gen + 2PV (with WHR) | 100 | 900 | 919 | 1533 | - | 1483 | |
| 9 | Grid + 1Gen + 1PV + Batt (without WHR) | 750 | - | 1863 | - | 2352 | 724 | |
| 10 | Grid + 2Gen + 2PV + Batt (without WHR) | 450 | 1550 | 1327 | 1239 | 240 | 1177 | |
| 11 | Grid + 1Gen + 1PV + Batt (with WHR) | 850 | - | 2280 | - | 1080 | 1423 | |
| 12 | Grid + 2Gen + 2PV + Batt (with WHR) | 500 | 500 | 804 | 1198 | 1192 | 1154 | |
Table 5.
Optimal configurations for Peshawar, Quetta and Gilgit.
| City | Sr. No. | DGs’ Configuration | DGen1 (kW) | DGen2 (kW) | PV1 (kW) | PV2 (kW) | Battery (kWh) | Converter (kW) |
|---|---|---|---|---|---|---|---|---|
| Peshawar | ISOLATED SYSTEM | |||||||
| 1 | 1Gen + 1PV + Batt (without WHR) | 750 | - | 1332 | - | 2160 | 1187 | |
| 2 | 2Gen + 2PV + Batt (without WHR) | 300 | 550 | 250 | 671 | 744 | 724 | |
| 3 | 1Gen + 1PV + Batt (with WHR) | 650 | - | 1075 | - | 1776 | 932 | |
| 4 | 2Gen + 2PV + Batt (with WHR) | 300 | 500 | 123 | 818 | 552 | 684 | |
| GRID-CONNECTED SYSTEM | ||||||||
| 5 | Grid + 1Gen + 1PV (without WHR) | 1050 | - | 2704 | - | - | 1724 | |
| 6 | Grid + 2Gen + 2PV (without WHR) | 50 | 1250 | 908 | 1023 | - | 1322 | |
| 7 | Grid + 1Gen + 1PV (with WHR) | 850 | - | 2356 | - | - | 1530 | |
| 8 | Grid + 2Gen + 2PV (with WHR) | 50 | 1050 | 1140 | 1242 | - | 1532 | |
| 9 | Grid + 1Gen + 1PV + Batt (without WHR) | 1000 | - | 2746 | - | 2064 | 1762 | |
| 10 | Grid + 2Gen + 2PV + Batt (without WHR) | 350 | 1550 | 586 | 1730 | 240 | 1123 | |
| 11 | Grid + 1Gen + 1PV + Batt (with WHR) | 850 | - | 1899 | - | 1032 | 1197 | |
| 12 | Grid + 2Gen + 2PV + Batt (with WHR) | 400 | 500 | 548 | 1251 | 624 | 957 | |
| Quetta | ISOLATED SYSTEM | |||||||
| 1 | 1Gen + 1PV + Batt (without WHR) | 700 | - | 1356 | - | 1920 | 1087 | |
| 2 | 2Gen + 2PV + Batt (without WHR) | 250 | 550 | 150 | 850 | 672 | 767 | |
| 3 | 1Gen + 1PV + Batt (with WHR) | 600 | - | 1089 | - | 1632 | 941 | |
| 4 | 2Gen + 2PV + Batt (with WHR) | 350 | 500 | 67.3 | 937 | 504 | 700 | |
| GRID-CONNECTED SYSTEM | ||||||||
| 5 | Grid + 1Gen + 1PV (without WHR) | 1000 | - | 2827 | - | - | 1731 | |
| 6 | Grid + 2Gen + 2PV (without WHR) | 50 | 1250 | 571 | 1503 | - | 1280 | |
| 7 | Grid + 1Gen + 1PV (with WHR) | 800 | - | 2313 | - | - | 1468 | |
| 8 | Grid + 2Gen + 2PV (with WHR) | 50 | 950 | 936 | 1399 | - | 1463 | |
| 9 | Grid + 1Gen + 1PV + Batt (without WHR) | 950 | - | 2657 | - | 1224 | 1570 | |
| 10 | Grid + 2Gen + 2PV + Batt (without WHR) | 450 | 1550 | 688 | 1688 | 240 | 1148 | |
| 11 | Grid + 1Gen + 1PV + Batt (with WHR) | 850 | - | 2493 | - | 1032 | 1573 | |
| 12 | Grid + 2Gen + 2PV + Batt (with WHR) | 450 | 1500 | 1631 | 1979 | 240 | 1735 | |
| Gilgit | ISOLATED SYSTEM | |||||||
| 1 | 1Gen + 1PV + Batt (without WHR) | 750 | - | 1150 | - | 2160 | 1189 | |
| 2 | 2Gen + 2PV + Batt (without WHR) | 400 | 550 | 106 | 749 | 672 | 731 | |
| 3 | 1Gen + 1PV + Batt (with WHR) | 650 | - | 937 | - | 1704 | 937 | |
| 4 | 2Gen + 2PV + Batt (with WHR) | 300 | 500 | 95.5 | 823 | 432 | 750 | |
| GRID-CONNECTED SYSTEM | ||||||||
| 5 | Grid + 1Gen + 1PV (without WHR) | 1050 | - | 2386 | - | - | 1735 | |
| 6 | Grid + 2Gen + 2PV (without WHR) | 50 | 1350 | 680 | 1160 | - | 1457 | |
| 7 | Grid + 1Gen + 1PV (with WHR) | 850 | - | 2025 | - | - | 1510 | |
| 8 | Grid + 2Gen + 2PV (with WHR) | 50 | 1000 | 1431 | 709 | - | 1574 | |
| 9 | Grid + 1Gen + 1PV + Batt (without WHR) | 1050 | - | 2225 | - | 1464 | 1186 | |
| 10 | Grid + 2Gen + 2PV + Batt (without WHR) | 500 | 1650 | 1017 | 1053 | 240 | 1265 | |
| 11 | Grid + 1Gen + 1PV + Batt (with WHR) | 850 | - | 1867 | - | 1320 | 1372 | |
| 12 | Grid + 2Gen + 2PV + Batt (with WHR) | 600 | 650 | 1075 | 1038 | 1584 | 1105 | |
Table 6.
Multiple objectives for Islamabad, Lahore and Karachi.
| City | Sr. No. | DGs’ Configurations | TNPC (million$) | COE ($/kWh) | GHG Emissions (tons/year) | WHR (kWh/year) | Grid Sale (kWh/year) |
|---|---|---|---|---|---|---|---|
| All Cities | CONVENTIONAL DIESEL ONLY SYSTEM | ||||||
| 1 | Diesel only system | 50.4 | 0.9700 | 3595.017 | - | - | |
| Islamabad | ISOLATED SYSTEM | ||||||
| 1 | 1Gen + 1PV + Batt (Without WHR) | 16.4 | 0.315 | 886.650 | - | - | |
| 2 | 2Gen + 2PV + Batt (Without WHR) | 10.8 | 0.209 | 2694.932 | - | - | |
| 3 | 1Gen + 1PV + Batt (With WHR) | 13.8 | 0.317 | 1014.785 | 904,483 | - | |
| 4 | 2Gen + 2PV + Batt (With WHR) | 9.42 | 0.214 | 2112.380 | 1,056,847 | - | |
| GRID-CONNECTED SYSTEM | |||||||
| 5 | Grid + 1Gen + 1PV (Without WHR) | 19.4 | 0.164 | 2145.700 | - | 6,239,867 | |
| 6 | Grid + 2Gen + 2PV (Without WHR) | 7.25 | 0.056 | 6902.004 | - | 7,289,230 | |
| 7 | Grid + 1Gen + 1PV (With WHR) | 15.6 | 0.155 | 1905.514 | 976,228 | 5,245,573 | |
| 8 | Grid + 2Gen + 2PV (With WHR) | 6.29 | 0.055 | 5078.612 | 1,676,691 | 6,255,967 | |
| 9 | Grid + 1Gen + 1PV + Batt (Without WHR) | 20.3 | 0.180 | 2010.973 | - | 5,677,536 | |
| 10 | Grid + 2Gen + 2PV + Batt (Without WHR) | 8.95 | 0.070 | 6844.752 | - | 7,114,622 | |
| 11 | Grid + 1Gen + 1PV + Batt (With WHR) | 16.3 | 0.161 | 2068.991 | 987,366 | 5,259,435 | |
| 12 | Grid + 2Gen + 2PV + Batt (With WHR) | 8.77 | 0.097 | 3860.661 | 1,211,317 | 4,188,724 | |
| Lahore | ISOLATED SYSTEM | ||||||
| 1 | 1Gen + 1PV + Batt (Without WHR) | 16.6 | 0.321 | 875.618 | - | - | |
| 2 | 2Gen + 2PV + Batt (Without WHR) | 11.0 | 0.211 | 2712.651 | - | - | |
| 3 | 1Gen + 1PV + Batt (With WHR) | 13.9 | 0.319 | 1000.214 | 904,691 | - | |
| 4 | 2Gen + 2PV + Batt (With WHR) | 9.62 | 0.2190 | 2102.363 | 1,056,003 | - | |
| GRID-CONNECTED SYSTEM | |||||||
| 5 | Grid + 1Gen + 1PV (Without WHR) | 20.0 | 0.169 | 2154.424 | - | 6,231,266 | |
| 6 | Grid + 2Gen + 2PV (Without WHR) | 7.56 | 0.059 | 6783.642 | - | 7,081,981 | |
| 7 | Grid + 1Gen + 1PV (With WHR) | 16.1 | 0.162 | 1935.756 | 976,475 | 5,140,511 | |
| 8 | Grid + 2Gen + 2PV (With WHR) | 6.70 | 0.058 | 5069.349 | 1,677,087 | 6,258,396 | |
| 9 | Grid + 1Gen + 1PV + Batt (Without WHR) | 20.6 | 0.278 | 1608.812 | - | 2,079,787 | |
| 10 | Grid + 2Gen + 2PV + Batt (Without WHR) | 9.16 | 0.089 | 5361.747 | - | 6,769,393 | |
| 11 | Grid + 1Gen + 1PV + Batt (With WHR) | 16.9 | 0.183 | 1860.616 | 961,111 | 4,310,902 | |
| 12 | Grid + 2Gen + 2PV + Batt (With WHR) | 8.89 | 0.083 | 4817.334 | 1,538,487 | 5,688,099 | |
| Karachi | ISOLATED SYSTEM | ||||||
| 1 | 1Gen + 1PV + Batt (Without WHR) | 16.9 | 0.325 | 925.864 | - | - | |
| 2 | 2Gen + 2PV + Batt (Without WHR) | 11.1 | 0.214 | 2692.043 | - | - | |
| 3 | 1Gen + 1PV + Batt (With WHR) | 14.2 | 0.325 | 1024.433 | 900,601 | - | |
| 4 | 2Gen + 2PV + Batt (With WHR) | 9.81 | 0.223 | 2108.410 | 1,061,929 | - | |
| GRID-CONNECTED SYSTEM | |||||||
| 5 | Grid + 1Gen + 1PV (Without WHR) | 20.2 | 0.175 | 2115.538 | - | 5,941,478 | |
| 6 | Grid + 2Gen + 2PV (Without WHR) | 8.03 | 0.064 | 6708.314 | - | 6,969,520 | |
| 7 | Grid + 1Gen + 1PV (With WHR) | 16.4 | 0.173 | 1893.449 | 965,763 | 4,733,953 | |
| 8 | Grid + 2Gen + 2PV (With WHR) | 7.26 | 0.067 | 4838.588 | 1,591,449 | 5,736,755 | |
| 9 | Grid + 1Gen + 1PV + Batt (Without WHR) | 20.9 | 0.278 | 1688.857 | - | 2,197,825 | |
| 10 | Grid + 2Gen + 2PV + Batt (Without WHR) | 9.64 | 0.074 | 6944.456 | - | 7,296,741 | |
| 11 | Grid + 1Gen + 1PV + Batt (With WHR) | 17.0 | 0.176 | 1976.607 | 970,729 | 4,358,460 | |
| 12 | Grid + 2Gen + 2PV + Batt (With WHR) | 9.57 | 0.107 | 3840.075 | 1,210,031 | 4,071,456 | |
Table 7.
Multiple objectives for Peshawar, Quetta and Gilgit.
| City | Sr. No. | DGs’ Configurations | TNPC (million $) | COE ($/kWh) | GHG Emissions (tons/year) | WHR (kWh/year) | Grid Sale (kWh/year) |
|---|---|---|---|---|---|---|---|
| Peshawar | ISOLATED SYSTEM | ||||||
| 1 | 1Gen + 1PV + Batt (Without WHR) | 16.4 | 0.316 | 905.329 | - | - | |
| 2 | 2Gen + 2PV + Batt (Without WHR) | 10.8 | 0.208 | 2689.675 | - | - | |
| 3 | 1Gen + 1PV + Batt (With WHR) | 13.8 | 0.318 | 1005.361 | 910,638 | - | |
| 4 | 2Gen + 2PV + Batt (With WHR) | 9.40 | 0.213 | 2116.130 | 1,056,336 | - | |
| GRID-CONNECTED SYSTEM | |||||||
| 5 | Grid + 1Gen + 1PV (Without WHR) | 19.2 | 0.162 | 2151.258 | - | 6,222,348 | |
| 6 | Grid + 2Gen + 2PV (Without WHR) | 7.15 | 0.057 | 6680.821 | - | 6,909,362 | |
| 7 | Grid + 1Gen + 1PV (With WHR) | 15.4 | 0.153 | 1901.308 | 976,348 | 5,260,739 | |
| 8 | Grid + 2Gen + 2PV (With WHR) | 6.20 | 0.052 | 5210.133 | 1,724,241 | 6,547,619 | |
| 9 | Grid + 1Gen + 1PV + Batt (Without WHR) | 20.0 | 0.179 | 1979.710 | - | 5,564,821 | |
| 10 | Grid + 2Gen + 2PV + Batt (Without WHR) | 8.67 | 0.068 | 6833.651 | - | 6,738,256 | |
| 11 | Grid + 1Gen + 1PV + Batt (With WHR) | 16.2 | 0.171 | 2008.673 | 968,185 | 4,119,405 | |
| 12 | Grid + 2Gen + 2PV + Batt (With WHR) | 8.41 | 0.099 | 3744.682 | 1,199,142 | 3,658,048 | |
| Quetta | ISOLATED SYSTEM | ||||||
| 1 | 1Gen + 1PV + Batt (Without WHR) | 16.4 | 0.317 | 924.143 | - | - | |
| 2 | 2Gen + 2PV + Batt (Without WHR) | 10.9 | 0.209 | 2663.564 | - | - | |
| 3 | 1Gen + 1PV + Batt (With WHR) | 13.9 | 0.319 | 1011.226 | 905,825 | - | |
| 4 | 2Gen + 2PV + Batt (With WHR) | 9.54 | 0.217 | 2112.711 | 1,059,623 | - | |
| GRID-CONNECTED SYSTEM | |||||||
| 5 | Grid + 1Gen + 1PV (Without WHR) | 19.3 | 0.167 | 2064.567 | - | 5,966,449 | |
| 6 | Grid + 2Gen + 2PV (Without WHR) | 7.44 | 0.059 | 6693.132 | - | 9,879,361 | |
| 7 | Grid + 1Gen + 1PV (With WHR) | 15.7 | 0.163 | 1841.852 | 965,224 | 4,852,982 | |
| 8 | Grid + 2Gen + 2PV (With WHR) | 6.59 | 0.059 | 4939.342 | 1,634,352 | 5,962,893 | |
| 9 | Grid + 1Gen + 1PV + Batt (Without WHR) | 20.0 | 0.182 | 1801.340 | - | 5,405,521 | |
| 10 | Grid + 2Gen + 2PV + Batt (Without WHR) | 9.12 | 0.069 | 6917.252 | - | 7,241,042 | |
| 11 | Grid + 1Gen + 1PV + Batt (With WHR) | 16.6 | 0.174 | 2004.305 | 987,894 | 4,592,684 | |
| 12 | Grid + 2Gen + 2PV + Batt (With WHR) | 8.92 | 0.069 | 6041.482 | 2,040,282 | 8,322,268 | |
| Gilgit | ISOLATED SYSTEM | ||||||
| 1 | 1Gen + 1PV + Batt (Without WHR) | 16.3 | 0.314 | 959.355 | - | - | |
| 2 | 2Gen + 2PV + Batt (Without WHR) | 10.7 | 0.207 | 2669.885 | - | - | |
| 3 | 1Gen + 1PV + Batt (With WHR) | 13.7 | 0.315 | 1040.364 | 910,025 | - | |
| 4 | 2Gen + 2PV + Batt (With WHR) | 9.28 | 0.211 | 2107.538 | 1,055,539 | - | |
| GRID-CONNECTED SYSTEM | |||||||
| 5 | Grid + 1Gen + 1PV (Without WHR) | 19.2 | 0.163 | 2214.816 | - | 6,178,188 | |
| 6 | Grid + 2Gen + 2PV (Without WHR) | 6.60 | 0.050 | 6922.720 | - | 7,330,439 | |
| 7 | Grid + 1Gen + 1PV (With WHR) | 15.2 | 0.152 | 1969.277 | 975,359 | 5,193,023 | |
| 8 | Grid + 2Gen + 2PV (With WHR) | 5.79 | 0.049 | 5116.636 | 1,673,369 | 6,337,434 | |
| 9 | Grid + 1Gen + 1PV + Batt (Without WHR) | 20.0 | 0.205 | 1936.572 | - | 4,230,165 | |
| 10 | Grid + 2Gen + 2PV + Batt (Without WHR) | 8.57 | 0.062 | 7096.481 | - | 7,514,326 | |
| 11 | Grid + 1Gen + 1PV + Batt (With WHR) | 15.9 | 0.168 | 1952.439 | 962,808 | 3,895,477 | |
| 12 | Grid + 2Gen + 2PV + Batt (With WHR) | 8.30 | 0.088 | 4349.394 | 1,329,160 | 4,719,079 | |
Table 8.
Most optimal values of each objective in different optimal configurations.
| City | Sr. No. | Optimal Configuration | Objectives | ||||
|---|---|---|---|---|---|---|---|
| TNPC (million$) | COE ($/kWh) | GHG Emissions (tons/year) | WHR (kWh/year) | Grid Sales (kWh/year) | |||
| Gilgit | 1 | Grid + 2Gen + 2PV (With WHR) | 5.79 | 0.049 | 5116.636 | 1,673,369 | 6,337,434 |
| Lahore | 2 | 1Gen + 1PV + Batt (With WHR) | 13.9 | 0.319 | 1000.214 | 904,691 | - |
| Quetta | 3 | Grid + 2Gen + 2PV + Batt (With WHR) | 8.92 | 0.069 | 6041.482 | 2,040,282 | 8,322,268 |
© 2017 by the authors. Licensee MDPI, Basel, Switzerland. This article is an open access article distributed under the terms and conditions of the Creative Commons Attribution (CC BY) license (http://creativecommons.org/licenses/by/4.0/).
Share and Cite
MDPI and ACS Style
Waqar, A.; Shahbaz Tanveer, M.; Ahmad, J.; Aamir, M.; Yaqoob, M.; Anwar, F. Multi-Objective Analysis of a CHP Plant Integrated Microgrid in Pakistan. Energies 2017, 10, 1625. https://doi.org/10.3390/en10101625
AMA Style
Waqar A, Shahbaz Tanveer M, Ahmad J, Aamir M, Yaqoob M, Anwar F. Multi-Objective Analysis of a CHP Plant Integrated Microgrid in Pakistan. Energies. 2017; 10(10):1625. https://doi.org/10.3390/en10101625
Chicago/Turabian StyleWaqar, Asad, Muhammad Shahbaz Tanveer, Jehanzeb Ahmad, Muhammad Aamir, Muneeb Yaqoob, and Fareeha Anwar. 2017. "Multi-Objective Analysis of a CHP Plant Integrated Microgrid in Pakistan" Energies 10, no. 10: 1625. https://doi.org/10.3390/en10101625
Note that from the first issue of 2016, this journal uses article numbers instead of page numbers. See further details here.