Article

Evaluation of Economic, Social and Environmental Effects of Low-Emission Energy Technologies Development in Poland: A Multi-Criteria Analysis with Application of a Fuzzy Analytic Hierarchy Process (FAHP)

Department of Corporate and Public Finance, Wroclaw University of Economics, Komandorska 118/120, 53-345 Wroclaw, Poland
Energies 2017, 10(10), 1550; https://doi.org/10.3390/en10101550
Submission received: 10 July 2017 / Revised: 29 September 2017 / Accepted: 30 September 2017 / Published: 9 October 2017

Abstract

:
The European Commission as well as the Polish government are promoting sustainable use of energy sources as a part of the dominating sustainable development paradigm. The development of low-emission energy sources engages the challenges of gradual depletion of coal, oil and natural gas reserves, as well as the intensification of the greenhouse effect. The energy policy should take into account development of low-emission energy technologies that contribute mostly to meeting the goals of sustainable development in three dimensions: economic, social and environmental. This study aims to assess the extent to which five low-emission energy technologies contribute to social welfare in the scope of the concept of sustainable development. Heuristic methods, including fuzzy analytic hierarchy process (FAHP) are used to resolve the multi-goal problem in order to achieve the aim of this research. Research results show that economic goal is still the most important to the development of various low-emission energy technologies in Poland, followed by the social and environmental goals. Secondly, renewable energy technologies should be utilized instead of nuclear energy to meet sustainable development policy goals. Photovoltaics, followed by biomass and biogas are perceived as the most suitable renewable energy sources. Wind on-shore and wind of-shore are on third and fourth place, respectively.

1. Introduction

Within the last decades, the exhaustion of classical fossil fuels and the mitigation of climate changes have become major challenges for governments all over the world. In Poland, this problem is particularly important because the electricity production structure is dominated by fossil fuels, with hard coal and lignite representing a major source for energy production covering 81% of the demand. The share of other energy sources is small [1]. Poland has considerable renewable energy resource utilization potential. The climatic conditions are similar to those of Germany, the leader in renewable energy deployment. In Poland, there exist, on a national level, programs for the development of RES and nuclear power, although it seems that, for various reasons, successive governments have deferred implementation of the latter.
A closer look reveals that there are, in fact, multiple sustainable development paradigm goals that Polish energy policy intends to accomplish. Several studies have pointed out that specific energy policy goals lead to the choice of specific low-emission energy sources and technologies [2,3,4]. This research aims to assess various renewable energy technologies and nuclear technology in order to select suitable low-emission energy sources that could support the accomplishment of different sustainable development policy goals in Poland.
There are many sophisticated analytical methods, in the scope of heuristic methods, dedicated to seek optimal solutions for multi-goal problems [5]. The analytic hierarchy process (AHP) introduced by Saaty is one of the most widely used techniques. However, ambiguity and uncertainty often exist among experts’ judgment with respect to the problems that they seek to address. Combination of fuzzy numbers with AHP is known as FAHP. The fuzzy set theory is used to support measuring the ambiguity and uncertainty within experts’ subjective judgments.
The organization of the remainder of this paper is as follows: Section 2 briefly illustrates the policy background and the current development of renewable energy and nuclear energy in Poland. A multi-objective framework based on related literature is constructed in Section 3 for assessing the low-emission energy sources in order to reach the goals of sustainable development in three dimensions: economic, social and environmental. The Delphi method is used to support the process of obtaining results. Section 4 presents FAHP method that in the remaining part of Section 4 is used to assess various low-emission energy technologies. Finally, Section 5 concludes and discusses research results and findings of the study.

2. Policy Background and the Current Development of Low-Emission Technologies in Poland

2.1. Renewable Energy in Poland

The basic legal act specifying the situation of the renewable energy sector in Poland and all European Union member states is the Directive 2009/28/EC of 23 April 2009 on the promotion of the use of energy from renewable sources [6]. It defines the obligatory goals with respect to the minimum volume of energy generated from renewable sources. Pursuant to its provisions, Poland is obliged to achieve a 15% share of energy production from renewable sources in 2020. Due to the structure of the Polish energy market, Poland intends to implement all of the EU guidelines described above through the thermal energy market, although a considerable portion of the described segment are individual households, for which there are currently no methods of documenting and calculating the potential use of biomass for heating purposes. In the electric energy segment large biomass co-firing installations, wind energy and, later, biogas, being the most mature technologies, will remain the preferred technologies.
The current market conditions confine the full competitiveness of alternative fuels and require dedicated support for the producers of energy from renewable sources. By 1st of July 2016, the new incentive scheme was addressed to the renewable energy sources (RES) installations while it was primarily regulated in the Act of 10 April 1997 on the Energy Law [7] and the transitional provisions of the Act of 20 February 2015 on renewable energy sources [8]. The incentive scheme was based on tradable green certificate system since 2005. In green certificate system producers of energy from renewable sources were entitled to issue tradable green certificates (TGC), which constituted proprietary rights as the object of trade. At the same time, providers of energy to the end-user were obliged to purchase the described certificates to surrender them. Otherwise, the providers of energy were obliged to make a compensatory payment in the amount specified by the energy regulatory office (ERO). The certificates might both be transferred in direct transactions and be the object of trade on the Polish Power Exchange, which is a reference point for the terms of direct transactions. Electricity producers must attain a minimum level of share of renewable energy from RES (15% [9] and 14.35% for the second half of 2016—pursuant to the amendment act of 22 July 2016. The missing 0.65% is dedicated in the form of blue certificates to agricultural biogas. The share for 2017 is set at 15.4%—green certificates and 0.6%—blue certificates [10]), and if they don’t, they must fulfil the obligation by either making up the difference by purchasing green certificates on the market, or pay a compensation fee determined by the President of the ERO.
The right to issue the certificate for each 1 MWh of the generated energy regardless of the type of technology and installed capacity resulted solely in the promotion of the cheapest solutions, being frequently out-of-date and characterized by the low risk of conducting an operational activity. At the same time, promising technologies, which have not fully matured thus far, were completely ignored. Hence, the described solution employed by the Polish legislature was contrary to the idea of promoting sustainable development. In practice, it led to excessive development of biomass co-firing in traditional commercial power industry boilers and over the past several years to the development of the wind energy sector. The advantage of the mechanism was the development of proven technologies, whereas the disadvantage was the exclusion of Poland from the sphere of innovativeness in this sector [11].
The green certificate system had worked well for some time. Due to the development of co-firing an enormous oversupply of green certificates has been created in last several years. It caused the market value of green certificates drop significantly from around 280 PLN/MWh to even 30 PLN/MWh in 2016. It resulted in reduction of profitability of co-firing plants. The RES Act also cut green certificates for co-firing by half. These two factors made co-firing unprofitable. Unfortunately, the oversupply also made RES projects of different technologies unprofitable, among them on-shore wind—the second most mature and developed renewable energy technology in Poland. An oversupply of green certificates persists. This is because the operating renewable energy plants usually work at high initial investment costs (CAPEX) and low operating costs (OPEX) and minimize the loss by working at full power. An exception is co-firing, as these installations were usually already fully depreciated.
Since the adoption of the 2009/28/EC Directive, several RES bills have appeared, but the legal risk—which in the case of the RES investment projects in Poland is the key risk factor of each investment project—has remained high. The act that was finally passed on the 20th of February 2015 introduced an auctioning system for the large providers (more than 40 kW). Choosing auction makes the investor ineligible for subvention, since two kinds of public support cannot be used together (or the auction price would be lowered). The laws from Chapter 4 of the RES Act, pertaining to the mechanisms and instruments of support for renewable energy sources, were to enter into force on the 1st of January 2016. On that day, the auctioning system for large providers was supposed to start functioning. Yet the Ministry of Energy has already passed two amendments. In December 2015 [12]—postponing the entrance of Chapter 4 of the RES Act by 6 months and the most important on the 22nd of June 2016 [13], introducing changes in the auction system striving for greater support for the production of energy from biomass and co-firing (as stable energy sources) over wind and PV which generate power intermittently. As a result, the auctioning system started functioning on the 1st of July 2016. The first auctions were organized simultaneously on the 30th of December 2016.
Auctions are divided into groups characterized by the reference to, in particular, the efficiency of an installation (instead of the type of technology). The Amending Act of 22 July 2016 introduces individual groups of RES installations for which the auctions will be held separately. Moreover, for each of the groups there will be separate auctions for installations with capacities below and above 1 MW. The aforementioned groups are as follows [14]:
  • Installations where the total installed capacity level, regardless of the source of origin, exceeds 3.504 MWh/MW per year;
  • Installations using biodegradable waste to generate electricity;
  • Installations emitting not more than 100 kg/MWh of CO2, with a total installed capacity level exceeding 3.504 MWh/MW per year;
  • Auctions for members of an energy cluster;
  • Auctions for members of an energy cooperative;
  • Installations using exclusively agricultural biogas for electricity generation;
  • Other installations.
The Minister of Energy issues secondary legislation on reference prices for each RES technology and allocating total volumes and values of electricity that may be purchased in given year in each basket.
The fixed price for electricity agreed within the auction is guaranteed for 15 years regardless of market prices, save for yearly indexation of such prices with the annual average consumer price index (CPI). The fixed volume of purchased electricity agreed within the auction for each year will be verified after each three-year settlement period. There is a set penalty for generation shortfall if generation from a RES installation falls in any 3-year settlement period below 85% of the volume offered within the auction and accruing during such period. The amount of the penalty is calculated as half the fixed auction price of the volume of undelivered energy.
Commissioning of the new RES installation covered by the auction should occur not later than within 48 months following the auction, such commitment to be secured with bank guarantee or money deposit in the amount of PLN 30/kW of the installed capacity.
Under the amendment act of 22 June 2016 subsidies for co-firing are reinstated as the reduction in support under the RES Act shall not apply to “dedicated biomass co-firing installations” where the share of electricity or heat produced from biomass, bio liquids, biogas or agricultural biogas is higher than 20% of the total amount of electricity or heat produced. The second Amendment Act therefore allows the coal industry to capitalize on co-firing, whilst also promoting certain renewables.
The Act on Windfarms of 20 May 2016 [15] (called also an “anti-windfarms” act) sets of new demands for wind power specifically aimed at restricting its development (also significantly impedes or phases out the country’s existing wind farms). The act sets out the minimum distance required between a wind power plant and residential buildings and forests. The distance is set at 10 times the height of a wind power plant (approximately 2 km) to prevent ice falls from rotor blades, which rules out 99% of available land [14]. In addition, the new definition of a wind power plant will lead to an increase in the real estate tax imposed on the owners of the plants. Wind farm operators need to obtain an operation permit every two years from the Technical Supervision Office (TSO) with the cost capped at 1 percent value of a wind turbine. Operators also need to obtain an approval for any repair or modernization of technical fixtures of a wind turbine. All this significantly increases the operation costs and together with the drop in green certificate price makes existing farms unprofitable, so massive bankruptcies are expected.
The government justifies the law with preference for stable sources of power and the dangers which would constitute windfarms e.g., the impacts on human health or the imminent threat of ice falls from rotor blades and interference in the landscape. Wind power organisations suggest the government is instead seeking to protect lossmaking coal mines run by state.
The law significantly promotes agricultural biogas sector. The act of 22 June 2016 on the amendments to the 2015 RES Law establishes separate certificates of origin (called blue certificates) awarded to agricultural biogas power plants with separate quotas for such certificates. If the price of blue certificates quoted at the Polish Power Exchange is lower than the substitute fee (set at 300.03 PLN/MWh) for the period of more than 1 month, there will be limited possibility to pay substitute fee as an alternative method of the fulfilment of the obligation to obtain and redeem certificates of origin.
The Amending Act of 22 June 2016 defines large installations as installations with a capacity equal to or exceeding 500 kW. According to the Amending Act, a mandatory energy purchase by an entity called an obliged seller is no longer applicable for such installations (except of all biogas plants). In the absence of an obligation to purchase energy from RES, many large installations may suffer from a reduction in their revenues and overall profitability [14].
It appears that the Polish government intends to reduce support for the RES industry and will most likely treat biomass installations preferentially as opposed to PVs and windfarms [14]. However, some of the aspects of the new RES regime are still to be determined by the means of secondary legislation. I will aim at allocating total volumes and values of electricity that may be purchased in given year in each basket and setting reference prices. Secondary legislation should be published before 31 August each year. Therefore, the government has the tools that allow for flexible control of the development of individual RES technologies, depending on the preferred political purposes. In fact, this is the subject of criticism from the RES sector representatives, indicating that the auction system in Poland is unpredictable, extremely complicated, subject to bureaucracy, and arbitrary in many key aspects.

2.2. Nuclear Energy in Poland

The priorities of Polish energy policy regarding nuclear power have been determined in the document entitled Energy Policy of Poland until 2030 [16], item 4—Diversification of the structure of electricity generation through the launch of nuclear power technologies. The governmental decisions of 2009 have initiated the activities aiming at implementation and development of nuclear power. However, the way from the decision to prepare the programme until the launch of the first nuclear unit is a time-consuming process. The present Polish Nuclear Power Programme (2014) shows the scope and organisational structure of the actions indispensable for the initiation of the nuclear option [17].
Since the adoption of Council of Ministers’ Resolution No. 4 on the actions to be taken to develop nuclear power engineering industry of 13 January 2009, actions preparing Poland for development of nuclear power industry have been implemented in the areas of: institutional framework enabling development of nuclear power sector; legislative framework, educating and training of human resources for nuclear power-related institutions and enterprises, informative and educational actions, research facilities, international cooperation.
According to Polish Nuclear Power Programme construction of the first unit of the first nuclear power plant will expectedly be completed by 2024. However, the first stage of Polish nuclear power programme, that included the choice of location and finalizing the contract for supply of the selected technology for the first nuclear power plant was scheduled for 31 December 2016 and was not completed. The program is already showing a significant delay. At present it is not even certain whether the first nuclear power plant in Poland will be established.

3. The Assessment Framework

3.1. Literature Review

EU Commission and Polish government are promoting sustainable use of energy resources as part of dominating sustainable development paradigm. The development of low-emission energy resources engages the challenges of gradual depletion of coal, oil and natural gas reserves, as well as the intensification of the greenhouse effect. The energy policy should take into account development of low-emission energy technologies that contribute mostly to meet the goals of sustainable development in three dimensions: economic, social and environmental. Hence, the low-emission energy technologies impacts have been identified on the basis of literature review, in particular: research papers, strategic documents, government documents at national level with reference to sustainability, reports of national and international organizations promoting sustainable development or focusing on RES development or specific energy technology. One should mention in particular studies [18,19,20,21,22,23,24,25].
Impacts have been identified also on the basis of scientific literature in the field of sustainable development [26,27,28,29,30] and particularly research papers presenting specific primary research, focusing on the problem of choosing energy technologies for the achievement of multi-goal policy objective in economic, social and environmental dimensions [31,32,33,34,35,36].
The analyzed effects in the economic, social and environmental dimensions can be divided into [37]: macroeconomic, distribution, cross-sectoral and connected with the energy system. In the following study all types of impacts were included in the research, the only eligible criterion was the significance of the impact on social wellbeing defined in the context of the sustainable development paradigm.

3.2. Identification of Environmental, Economic and Social Impacts of Low-Emission Energy Technologies with Delphi Method

The Delphi method was used to identify the criteria. It belongs to the category of heuristic methods, which differ fundamentally from quantitative methods. Heuristic methods are based on the qualitative assessment of facts, intuition, and above all, on the individual expert scheme of association. The Delphi method was first developed and applied by Dalkey and Helmer in 1963 [38]. According to Krupowicz it is devoid of the disadvantages of traditional collective expert methods such as the dominance of one or more individuality, the suggestion of the opinions of other participants in the study, the high pressure of the group on the participants, lack of responsibility for formulated opinions, unwillingness to change the initial opinion, overloading with unnecessary or unrelated information. It is characterized by the independence of expert opinion, the anonymity of experts, the multi-step nature of the procedure, the agreement and the summation of experts’ opinions [39].
The multi-step procedure is based on well-planned scheme of successive expert-led surveys. The Delphi procedure forces the majority to go, since the experts in positions other than majority are asked not only explanations but also justifications of the position. In this way, extremists are isolated, i.e., stiff persons who do not change their opinions. Repetition causes the extent of the discrepancy to narrow, leading to the agreed opinion of majority of experts.
A preliminary set of effects based on a literature review was verified by three experts in a focus study. Major changes were proposed to ensure greater simplicity and understanding of the questionnaire, but also allowed for some changes in the impacts description as well as a preliminary verification of the appropriateness of taking into account the individual impacts. Often, in the literature the effects are described selectively, sometimes at different levels of aggregation, which raises the risk of taking into account the impact repeatedly. There is also a risk of omitting relevant impacts. Therefore, the verification process and preparation of complete set of effects was a challenging task and in Author’s opinion it significantly contributes to the literature in the field.
Eight experts from the field of environmental and energy economics participated in the first round of the survey. Preliminary list of impacts along with a description of the low-emission energy technologies analyzed was sent to them. The study covered four renewable energy technologies with the highest growth potential in Poland: biomass and biogas, photovoltaic, wind on-shore and wind off-shore; and nuclear power.
In the first round of the survey, the experts were asked to describe each effect, as these are usually complex interactions, and it was important to understand how each of the effect is understood by experts before weighing and scoring (in the next phase of expert investigation, conducted by the FAHP method). The first round led to the agreed definition of impacts.
After the first round, experts’ opinions on the individual impacts were tabled. The result was a concise written statement of the ranges of convergence and discrepancy, and a summary of the arguments supporting the alternative points of view. In the second round, experts were provided with a supplemented list of impacts, along with a discussion of the discrepancies, with the suggestion that respondents agree with the opinion of majority. The second round ended the study, with the conclusion that consensus was reached on identifying the economic, social and environmental impacts of renewable and nuclear energy in Poland in order to maximize social wellbeing within the framework of the sustainable development paradigm.
Table 1 presents the final list of identified impacts in the economic, social and environmental dimension.

4. Methodology and Research Results

4.1. Fuzzy Analytic Hierarchy Process (FAHP) Method

The Analytic Hierarchy Process (AHP) is considered a heuristic method. It was developed by the American mathematician Thomas Saaty [40]. It was created in response to the lack of a simple tool to support decision makers in the process of decision making in multi-criteria problems. There was no structured, systematic approach to decision making. Priorities were often determined arbitrarily [41]. AHP method helps to make optimal choices in the case of multi-criteria decision making problems by reducing them to a series of pairwise comparisons, which are undertaken by experts. It enables a numerical measure of the validity of the analyzed features. AHP is conducted in two fundamental phases:
(1)
creating a hierarchical structure of the problem,
(2)
developing the final priorities as a result of considering criteria and alternatives.
In the first phase the structure of the problem is created. In this hierarchical model the highest level of the hierarchy is a primary objective and below it, at a lower level, there are sub-goals, called criteria. The number of criteria and sub-criteria levels usually does not exceed two. At the lowest level of the hierarchy there are possible variants of the decision, referred to as alternatives.
In the second phase, appropriate weight is assigned to each element of the hierarchical structure. The weight takes into account the opinion of the individual participants in the decision making process. Weights are obtained by creating a pairwise comparison matrix of all criteria at the selected level of the hierarchy after taking into account the position of the weights/criteria in the hierarchical structure of the problem.
Saaty proposed the comparison of pairs to be made in nine-relative rating scale. The comparison result is expressed in the descriptive way, which corresponds with the respective number from 1—denoting equal importance to 9—denoting absolute advantage [40].
Pairwise comparison matrix takes the following form:
A = [ a k i ] = [ 1 a 12 a 1 n a 21 1 a 2 n a n 1 a n 2 1 ] = [ 1 a 12 a 1 n 1 a 12 1 a 2 n 1 a 1 n 1 a 2 n 1 ]
It should be noted that the pairwise comparison matrix should be consistent, it additionally allows to verify the quality of judgments made by an expert. One of the most practical issues in the AHP methodology is that it allows for slightly non-consistent pairwise comparisons because perfect consistency of the matrix of comparisons rarely occurs in practice.
To analyze the consistency of the matrix of comparisons Saaty proposed the calculation of the consistency index (CI). The lower the consistency the value of consistency index (CI) is increasing. The consistency index takes a following form:
C I = λ max n n 1
where λ max —maximum eigenvalue, and n—number of comparison elements.
The major measure of the consistency is consistency ratio (CR). This measure is based on a comparison of the expert ratings and average value of the random pairwise comparisons. The pairwise comparisons made by experts should differ significantly from random comparisons, the consistency ratio takes the form of:
C R = C I R I
where CI—Consistency Index, RI—Random Index, the consistency index when pairwise comparisons are completely random. In the AHP the pairwise comparisons in a judgment matrix are considered to be adequately consistent if the corresponding consistency ratio (CR) is less than 10% [40].
Estimation of priorities from the pairwise comparison matrix is based on finding maximum eigenvalue of this matrix and then finding the eigenvector corresponding to that eigenvalue. The resulting eigenvector becomes vector of weights of judgment matrix enabling identification of the priorities. The literature indicates at least a few methods for obtaining weight vector, from the simplest method, based on an average, to the right-hand matrix method postulated by Saaty (for more on the methods of obtaining preferences, see [40,42]).
The AHP method is one of the most often used in the practice of the methods of multi-criteria decision-making, and as such has become a base for modifications and upgrades. One of the first adjustments already proposed by Saaty in 1996 was the inclusion of feedback into the structure of hierarchy [43]. In this way, the AHP method has become a special case of the Analytic Network Process (ANP) method, taking into account feedback connections between the various levels of the hierarchy [44]. Another important modification of AHP method is the use of fuzzy numbers for pairwise comparisons. Linguistic ratings proposed by Saaty may lead to some confusion (especially when the comparisons are made by many experts and then are aggregated), because it is difficult to distinguish between for example: “big advantage” from “huge advantage”. Therefore, instead of assigning one value to a linguistic assessment, as proposed by Saaty, the fuzzy number is assigned. This is the major characteristic of the FAHP method and key modification of AHP. The first paper taking into account the problem of fuzzy numbers in the method of AHP was published by Van Laarhoven and Pedrycz [45]. A wider review of works devoted to this approach can be found in Demirel et al. [46]. The method has been used also to assess energy technologies, i.e., [47,48,49].
In FAHP approach fuzzy pairwise comparisons are presented in the form of the fuzzy pairwise comparison matrix:
A ˜ = [ a ˜ k i ] = [ ( 1 , 1 , 1 ) ( l 12 , m 12 , u 12 ) ( l 1 n , m 1 n , u 1 n ) ( l 21 , m 21 , u 21 ) ( 1 , 1 , 1 ) ( l 2 n , m 2 n , u 2 n ) ( l n 1 , m n 1 , u n 1 ) ( l n 2 , m n 2 , u n 2 ) ( 1 , 1 , 1 ) ]
where a ˜ k i is a triangular fuzzy number of expert ratings or geometric average of expert ratings, Weights can be established on the basis of procedure proposed by Chang [50]. In the first step the value of fuzzy synthetic extent with respect to kth object (fuzzy normalized values) is defined as:
Q ˜ k = ( l k , m k , u k ) = i = 1 p ( l k i , m k i , u k i ) [ i = 1 p k = 1 p ( l k i , m k i , u k i ) ] 1 = ( i = 1 p l k i i = 1 p k = 1 p u k i , i = 1 p m k i i = 1 p k = 1 p m k i , i = 1 p u k i i = 1 p k = 1 p l k i )
then the degree of possibility is calculated as:
V ( Q ˜ k Q ˜ i ) = { 1 , dla m k m i 0 , dla l i u k l i u k ( m k u k ) ( m i l i )    b e y o n d
Next, the minimum degree of possibility of fuzzy number versus other p − 1 fuzzy numbers is calculated as:
min i ( 1 , p ) k i V ( Q ˜ k Q ˜ i ) ;   k = 1 , 2 , , p
Normalized values of the minimum degree of possibility for all fuzzy numbers stand for weights of criteria. Global weights for sub-criteria are obtained by multiplying local weights by the weight of the superior criterion.

4.2. Evaluation of Economic, Social and Environmental Effects of the Development of Low-Emission Energy Technologies with Fuzzy Analytic Hierarchy Process (FAHP)

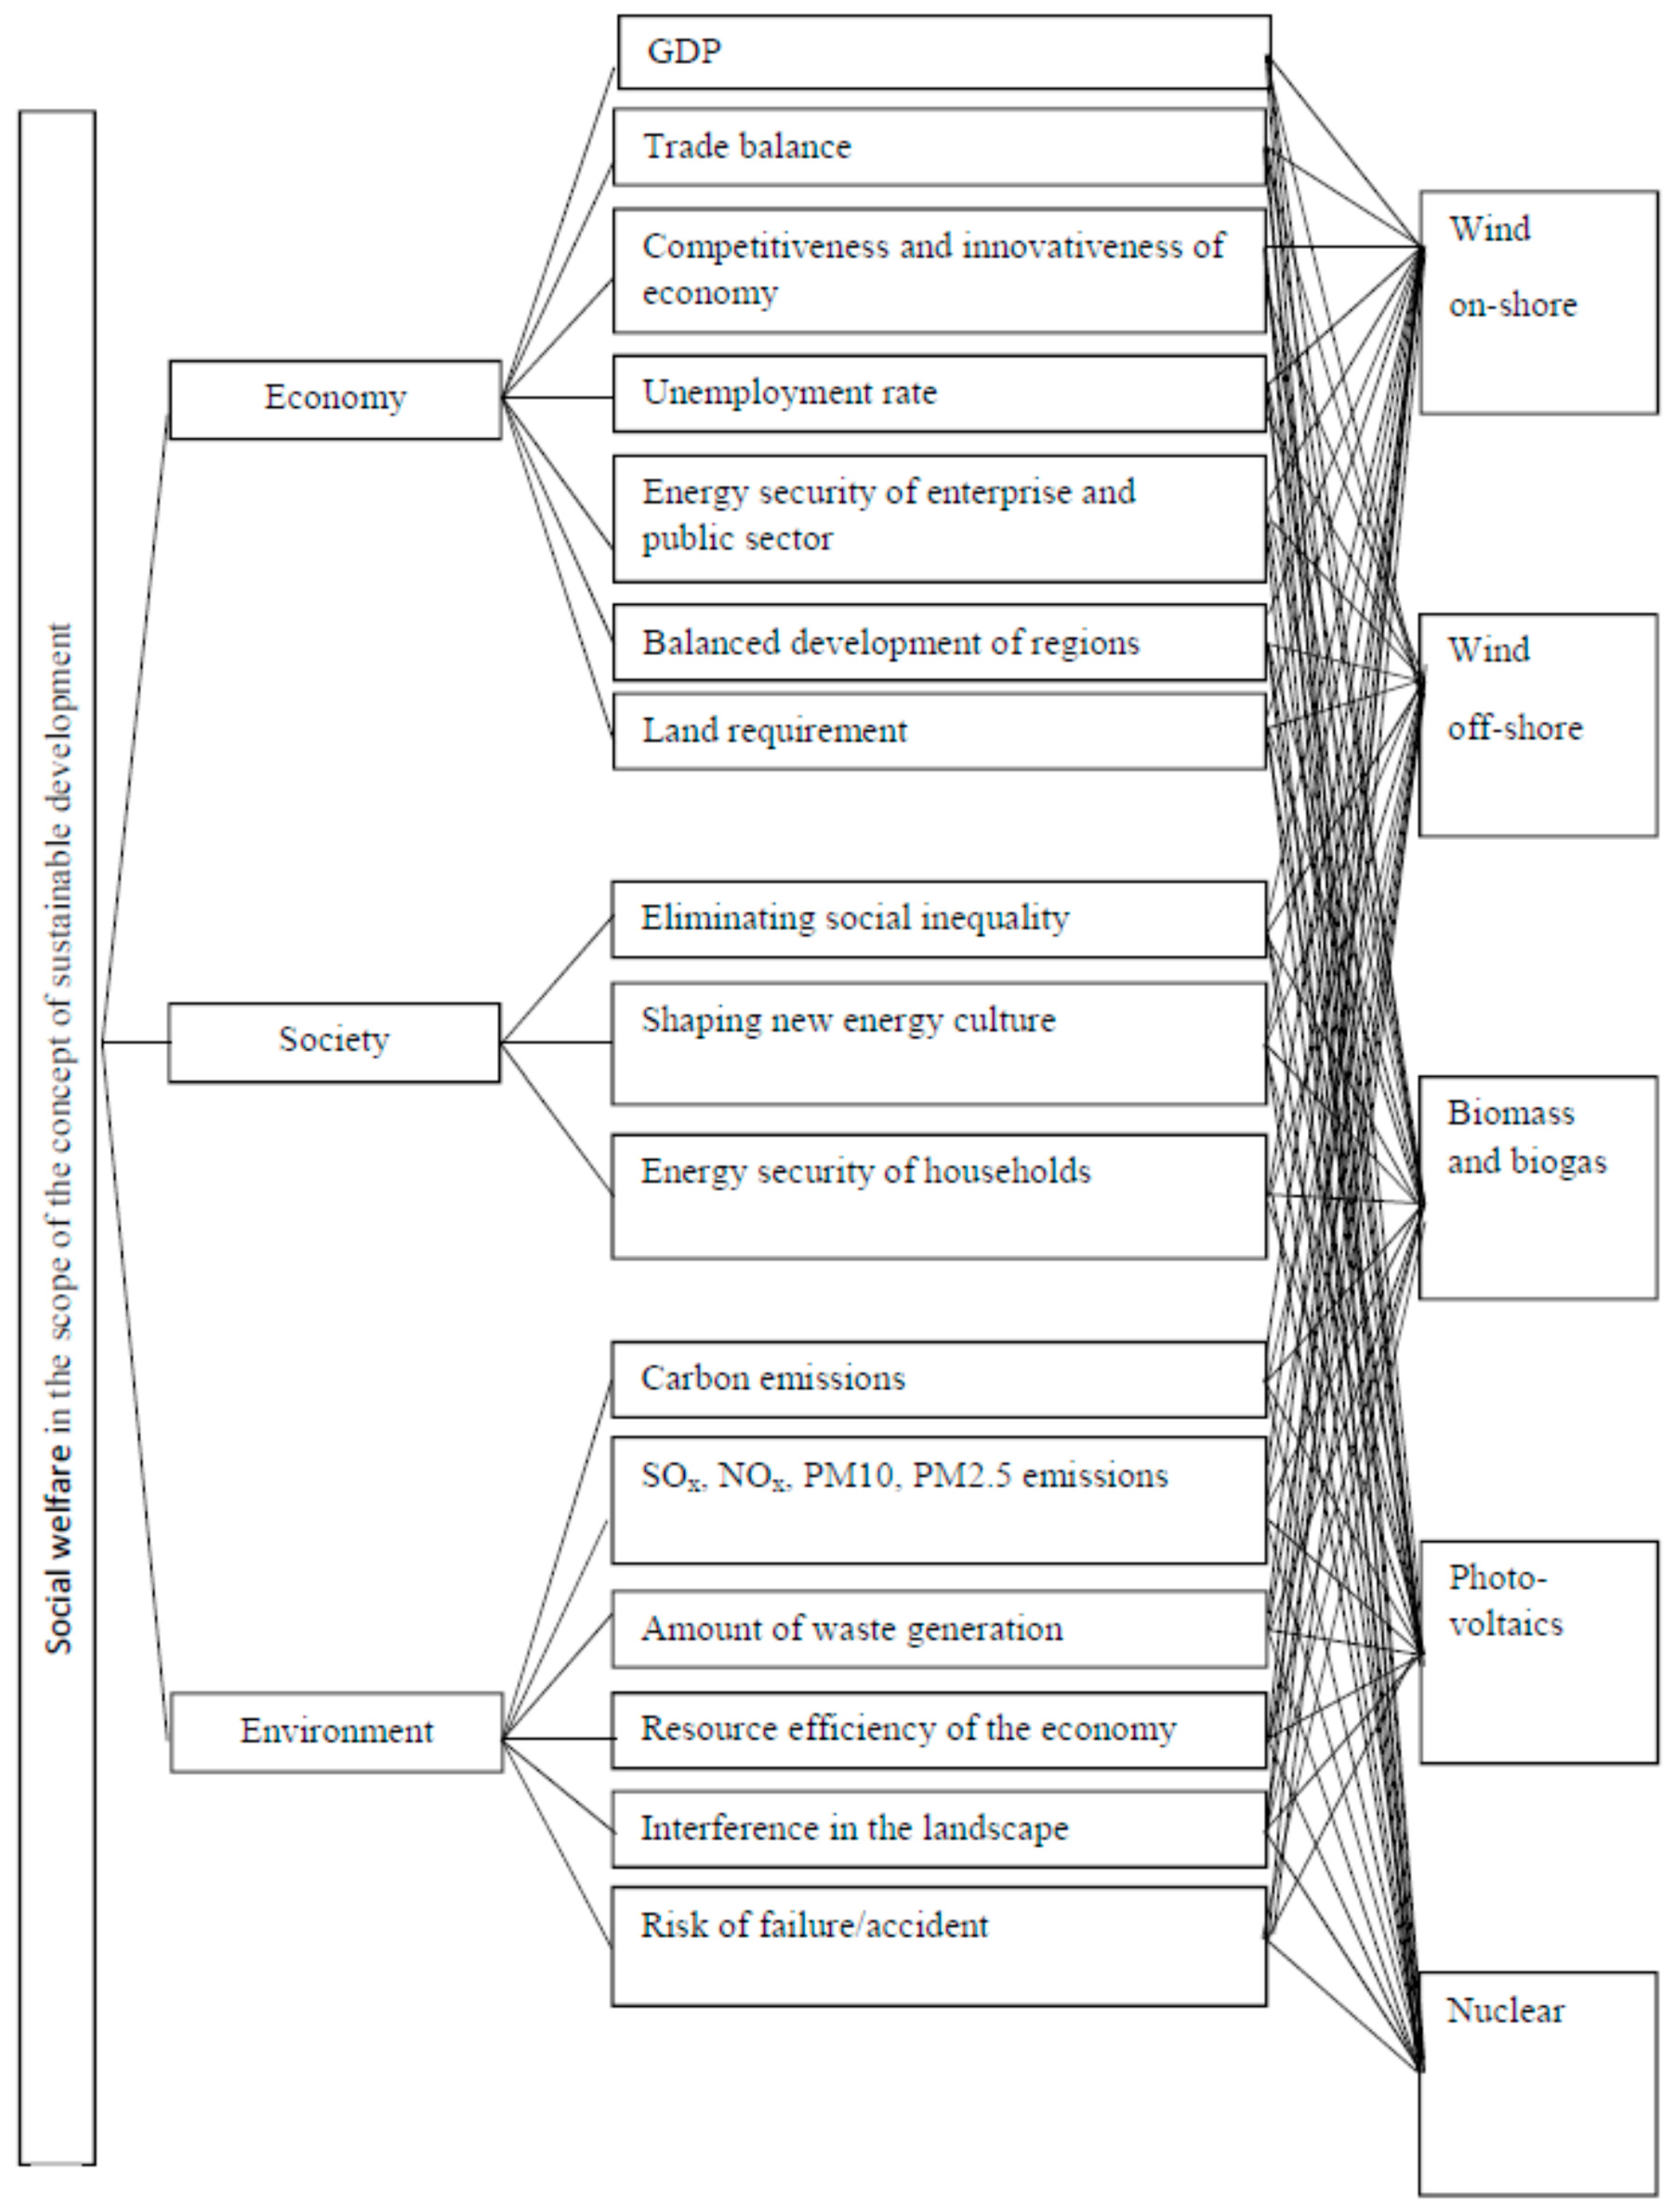
In this study the FAHP method will be used in order to realize the goal of the research stated as to determine the ranking of low-emission energy technologies in the context of their impact on social well-being within the meaning of the sustainable development paradigm. Five technologies (decision-making variants) are considered: wind on-shore, wind off-shore, solar, biomass and biogas, nuclear. There are three main criteria under the concept of sustainable development i.e., environment, economy and society. For each of the main criteria, the sub-criteria (intermediate criteria) were selected. The hierarchical assessment model of low-emission energy technologies in Poland is shown in Figure 1.
A survey was conducted on the sample of 15 experts. In the first phase, environmental economics and energy professionals were asked to fill in the given questionnaire. The FAHP method was used to determine the priorities of each criterion (objective). Due to the large number of comparisons between alternatives with respect to criteria, the method of pairwise comparisons has been abandoned with respect to peer-to-peer evaluation of particular technologies. Each technology was assessed on a scale that determines the impact of a given energy technology on a particular criterion (without reference to other technologies). This effect could be both positive and negative, and was determined on a scale from −4 to 4 (where −4 denotes maximum negative influence, 0 no effect, and 4—maximum positive influence). The scale for the impact assessment is shown in the Table 2.
The consistency coefficient was calculated for aggregated pairwise comparison matrix. In the case of pairwise comparison matrices for sub-criteria, the consistency ratios were less than 6%, while for matrix for main criteria CR slightly exceeded the arbitrarily set value of 10%. Exceeding CR maximum value was so small that it was considered that the matrix was consistent.
Estimation of weights was started by calculating the weights for the main criteria. Experts’ opinions were aggregated into one fuzzy pairwise comparison matrix for main criteria (see Table 3), then fuzzy normalized values for each main criteria Q ˜ k were calculated.
The procedure of calculating the Q ˜ k value is shown for the first main criterion (k = 1), i.e., the economy:
Q 1 l = i = 1 3 l 1 i i = 1 3 k = 1 3 u k i = 2.97 6.96 + 4.39 + 4.61 = 0.19
Q 1 m = i = 1 3 m 1 i i = 1 3 k = 1 3 m k i = 4.97 4.97 + 3.13 + 2.27 = 0.48
Q 1 u = i = 1 3 u 1 i i = 1 3 k = 1 3 l k i = 6.97 2.97 + 2.02 + 1.77 = 1.03
The remaining normalized values for the main criteria were calculated in the same way. Results are shown in Table 4.
The fuzzy normalized values from Table 3 allowed to determine the minimum value of the degree of possibility and the priorities, consequently. The ability level for each fuzzy number was calculated, followed by their minima and priorities of the main criteria (see Table 5).
The remaining priorities for sub-criteria were calculated in the same way, final results are shown in Table 6.
Experts assigned the highest priority to the criterion economy (0.42). Priorities of the criteria society and environment are close (0.304 and 0.276, respectively), although slightly higher priority was assigned to the first one.
The greatest differences in the priorities of individual sub-criteria occurred in the main criterion of economy, but these differences are still small (the highest difference between the sub-criterion: innovation and competitiveness of the economy with a priority of 0.167 and the trade balance with the priority of 0.110).
In the criterion of society, only three sub-criteria were distinguished and each was assigned with a priority slightly higher than 0.3. Within the criterion environment six sub-criteria were listed, with priorities slightly above 0.15.
At the last stage of the analysis, an attempt was made to create a ranking of energy technologies. Experts have assessed impact (on the scale from −4 to +4) of each technology on each of the sub-criteria. Experts’ ratings have been averaged and are presented in Table 7.
Analyzing the average scores assigned for each criterion, it can be noticed that technologies that contribute the most to social wellbeing through the economy criterion are biomass and biogas technologies, with the score of 11.3 points. The following technologies hold remaining positions: solar (photovoltaic) with a score of 9.9 points, wind on-shore (7.4 points), wind off-shore (5.9 points) and last place, with a significantly lower result—nuclear technology (4.4 points).
The highest score was attributed to such sub-criteria as energy security of enterprises and innovation and competitiveness of the economy. It turns out that according to experts, developing any low-emission technology, in principle, will have a significant positive impact on these sub-criteria. This seems to be in line with the intuitive understanding of these phenomena, i.e., the development of any energy technology, besides the dominant coal power industry, leads to increased energy security due to the diversification of energy sources and to increased innovation and competitiveness of the economy.
All low-emission technologies have a positive impact on GDP, trade balance and unemployment, although the impact is strongly dependent on technology. The highest positive impact on GDP is due to the development of biomass, biogas and photovoltaic technologies (2 points each), followed by wind on-shore (1.27 points) and wind off-shore (1.2 points). Nuclear technology holds the last place, with a significantly lower result of 0.73 point.
Photovoltaic technology (0.87 points) and biomass and biogas (0.8) have the highest impact on trade balance. Wind technologies are on the second place and again in the last place, with a score close to zero (0.07 point)—nuclear technology. The ranking looks the same for the next sub-criterion, which is the impact on the unemployment rate. Biomass and biogas technologies are clearly distinguished as having the highest potential for job creation. Also photovoltaic and wind on-shore have shown significant positive impact. Nuclear power occupies the last place, with a score close to zero.
With regard to the impact of balanced development of regions, biomass and biogas technologies are again in the top positions, which is intuitively understandable. The second place is taken by photovoltaics, followed by wind on-shore. Nuclear and wind off-shore have achieved close to zero score, which also seems understandable. With regard to the land occupancy, each technology, except for biomass and biogas with zero score, negative impact was appointed. In this case, the distribution of points may be surprising because the experts' highest negative impact was appointed to nuclear power, despite a clear description of the sub-criterion indicating energy technologies based on renewable energy as having a low energy yield per unit of occupied land (see Table 1). Nuclear power, on the contrary, is characterized by high energy yield per unit of occupied land. All RES technologies were generally assigned with a very small negative impact, while for nuclear power the negative impact was significantly higher.
Within the society criterion the first place with the score of 7.8 points is occupied by photovoltaics, second-biomass and biogas technologies with a score of 7.2 points, third−wind on-shore with a score of 4.9 points. Wind off-shore, with a score of 2.4 points, is significantly less important. The last place, again, belongs to nuclear power with the result of 1.07 points.
Almost the same ranking applies to each sub-criterion within this main criteria, i.e. photovoltaics, biomass and biogas technologies and wind on-shore have a significant positive effect on the elimination of social inequalities (it seems understandable given the possibility of locating investments in rural areas throughout the country), shaping a new energy culture and energy security of households. With regard to the last two sub-criteria, it seems that the development of the prosumer energy industry based on these energy technologies seems appropriate. Therefore, it is not surprising that significantly lower impact on these sub-criteria has wind off-shore and nuclear energy (lack of influence on the shaping of a new energy culture and even a slight increase in social inequalities).
Within the main criterion of: environment, the results of the experts’ survey indicate a significant, sometimes diametric, differences between the technologies in question. All technologies based on renewable energy sources have a positive impact, with wind off-shore in the first place (7.73 points), followed by photovoltaic (7.4 points) and by wind on-shore with a score of 6.1 points. Much lower but still positive impact is shown by biomass and biogas technology with a score of 3.4 points. Nuclear power has a strong negative impact with −3.1 points.
Experts have appointed the greatest positive impact within the criterion of the environment to such sub-criteria as resource efficiency, greenhouse gas emissions and emissions of other air pollutants. In principle, the development of each of the low-emission technologies will have a significant positive impact on these sub-criteria, which is obvious, and is a fundamental reason why these technologies are implemented.
Implementation of any low-emission energy technology replaces the dominant coal-fired power industry, leading to higher air quality. In regards to greenhouse gas emissions, nuclear power holds the first place, with a score of 2.5 points. Second place belongs to wind on-shore and wind off-shore (2.47 and 2.4 points respectively), followed by photovoltaics with the score of 2 points and biomass and biogas technologies, with a score of 1.53 points.
Regarding the emission of remaining air pollutants, the ranking is slightly different i.e., wind on-shore, wind off-shore and photovoltaic technologies reached the highest, similar results (2.33, 2.3 and 2.1 points respectively). Next in the ranking is nuclear power (1.67 points) and just behind—biomass and biogas with a score of 1.4 points. The last place in the ranking is unchanged, which seems reasonable, due to the presence of pollutants emission in the operational phase of the power plant, but it is not quite possible to interpret the shifts in the rest of the ranking.
The highest level of resource efficiency of the economy is achieved by the development of photovoltaics, followed by wind off-shore and wind on-shore, followed by biomass and biogas technologies. All RES technologies received more than 2 points for this factor. Last place, with a score of 1.4 points belongs to nuclear power. This ranking may be justified by that three RES technologies with the highest score do not require the use of resources in the operational phase. Biomass and biogas technology requires the use of renewable resources, and only nuclear power requires the use of non-renewable resources such as uranium. All technologies have a positive impact on the resource efficiency of the economy compared to the currently dominant coal-based power industry.
With respect to the sub-criterion: the amount of generated waste the highest positive influence is appointed to wind off-shore and wind on-shore technologies (1.4 and 1.3 points, respectively). A significantly lower positive impact is demonstrated by photovoltaics. The positive impact of biomass and biogas is very small (close to zero). Nuclear power has a high negative impact, with a score of −2.8 points. It seems that the top three places in the ranking are assigned to RES technologies perhaps because they do not generate waste in the operating phase. One may have doubts about the ranking of biomass and biogas as it allows the use of waste from agricultural and animal production (not to mention industrial waste) and the digestate of agricultural biogas plants can be used for fertilizer purposes. It appears that the high negative impact has been attributed to nuclear power, due to the generation of long-lived radioactive waste.
Experts have attributed the negative impact to the interference in the landscape of all analyzed low-emission technologies. The strongest negative impact was attributed to wind on-shore (−2.7 points), followed by nuclear power (−2.1 points). Lower but still negative impact is appointed to wind off-shore (−1.2 point), then biomass and biogas (−1 point) and at the last position-photovoltaics (−0.53 points). It seems that this ranking is consistent with the general perception of this impact (although there may be doubts about the location of nuclear power due to lack of experience in this field in Poland).
The last, analyzed sub-criterion was the risk of failure/accident. Nuclear power is located in first place with a score of −3.8 points, which means almost the maximum negative impact on the scale used (from 4 to −4 points). The second place is held by biomass and biogas with −0.73 points. Other technologies, according to experts, have positive impact and thus reduce the risk of breakdowns in the energy cycle compared to the prevailing coal power industry. The impact is not high, with average scores of 0.5 for photovoltaics, wind off-shore and wind on-shore.
The final score obtained in the main criteria of economy, society and environment shows the following ranking of low-emission technologies: first place belongs to photovoltaics (25 points), second place-biomass and biogas (22 points), third place-wind on-shore (18 points), fourth-wind off-shore (16 points) and last place-nuclear power with a surprisingly low score of 2 points.
The experts’ evaluations were weighed with respect to global priorities of sub-criteria. The synthetic value of each low-emission technology was calculated. Results are presented in Table 8. The results confirm the findings about nuclear power.
This ranking was created on the basis of classic approach, where weighted average is the synthetic variable. However, more sophisticated method, such as TOPSIS, could be used. The author has conducted additional tests using this method. It is one of the mostly used multi-criteria analysis methods [51], also used for assessment of energy technologies, for example in the recent study of Akbas and Bilgen [52]. This method was presented for the first time in the work of Hwang and Yoon [53]). It consists of creating a ranking on the basis of the distance between particular decision variant from ideal solution. Therefore, formally the ranking is created according to the following equation:
R = d i d i + d i +
where d i —Euclidean distance of decision variant from the worst solution and d i + —Euclidean distance of decision variant from the best solution.
It’s important to mention that values of all variants are primarly normalized and weighted according to previously set weights. Results of conducted TOPSIS analysis are presented in Table 9. According to expectations the ranking of technologies hasn’t change.
Regardless of the FAHP study, experts were also asked to indicate their weights for each criteria so that the weights add up to unity and to give weights to the sub-criteria within the isolated main criterion, with the weights of the sub-criteria also adding up to unity within the main criterion. These weights were averaged and are presented in Table 10.
The aim was to test the credibility of both methods (direct weighting by experts with FAHP weightings). Despite the methodological preference for the FAHP method, it encounters difficulties in practical application. It should be noted that with a large number of criteria and sub-criteria, the number of comparisons increases considerably. According to some researchers this is an obstacle to reliable use of the FAHP method. In the next step the ranking of energy technologies was constructed, taking into account the weights provided by experts (see Table 11).
With this approach the same ranking of low-emission technologies was obtained. Photovoltaics are located on the first position in the ranking, biomass and biogas—second, wind on-shore—third, fourth—wind off-shore and last place—nuclear power. This approach also reveals the gap between the use of RES for reaching the goals of sustainable development (scores from 1.177 to 1.783 for RES technologies) and nuclear energy (score of 0.5).

5. Discussion and Conclusions

The same rating of low-emission technologies was obtained on the basis of research conducted using FAHP and direct weighting by experts. This confirms the conviction that experts’ responses have been thought and coherent. It also confirms the applicability of research results in practice for the purpose of shaping energy and environmental policy in Poland. Research results show that economic goal is still the most important for the development of various low-emission energy technologies in Poland, followed by the social and environmental goals. Secondly, renewable energy technologies should be utilized instead of nuclear energy to meet sustainable development policy goals. The gap between RES technologies and nuclear one is huge. The biggest disparities between RES and nuclear technologies exist for social and environmental dimensions. Although for the criterion of economy nuclear technology also obtained the lowest score among all analyzed low-emission technologies.
These results seem to be in line with the results of referenced studies. A similar study conducted on the example of China [34] states that low nuclear-hydro power scenario is the most sustainable scenario based on the used evaluation criteria. Authors conclude that Chinese government should implement new policies aimed at promoting integrate development of wind power and solar PV. The work [30] considers low-carbon energy transition options. Referring to recent research authors conclude that nuclear power plants fail on all sustainability criteria, except for being low-carbon. Priority should be given to the development of RES [30].
The investment cost trends (CAPEX) should also be taken into account in the ranking and selection of future low-emission energy technologies. These costs have been indirectly included in the impact of utilization of low-emission energy technologies on GDP, but direct comparison of investment cost trends reinforces the validity of presented ranking. Compliance of the economic assessment (from the point of view of the society) with the financial assessment (from the investor’s point of view) of low-emission energy technologies indicates the minimization of necessary public support for the development of low-emission energy technologies (i.e., all analyzed technologies require support from the state.) It is about optimizing the scope of this support to achieve the goals of energy security, depletion of coal, oil and natural gas reserves and minimizing greenhouse gas and other air pollution emissions. In the case of nuclear power, which took last place in the both rankings, it is important to be aware of the rising trend of private construction costs [33,54,55]. This is a very unusual situation, considering the reduction in the cost of producing energy in all RES technologies (e.g., [11,33]). The study by Suna and Resch on the United Kingdom (UK) at a country level and for the EU 28 overall concludes that supporting a basket of RE technologies is more cost-effective than the planned support for the nuclear power plant at Hinkley Point C that has served as the nuclear comparator throughout the study. Average savings in support expenditures for the EU 28 as a whole are in the range of 37.1% [56].
There are three dominant reasons for the rising costs of nuclear power [33]. The first is the lack of economies of scale. This is because the largest reactors are not just replicas of their predecessors. The second one is the lack of learning effect, which can be due to several reasons. Nuclear reactors are not mass-produced, and specific conditions, such as the location based of each power plant, must be considered, which makes them unique products. Besides, often a company has participated in the construction of several reactors, it is too little on the occurrence of the learning effect. It is also pointed out that companies responsible for the construction of nuclear power plants often have no incentive to reduce costs, by contrast, making a competitive advantage of their experience and know-how. Moreover, due to the slowing down or delaying of nuclear energy development programs by individual countries, the effect of learning in the form of skilled workers has been lost. The third, and most important factor of rising costs is stricter safety regulations, which are still tightening up and the frequency of their changes, which causes the need for continuous adaptation of plans and delays in the construction of already started reactors. If the cost of nuclear power will continue to rise, it will undermine its competitiveness.

Acknowledgments

This paper was prepared as part of the research projects “Value based management of investments in renewable energy sources” [UMO-2011/01/D/HS4/05925] and “Evaluation of the environmental effects in a cost-benefit analysis of the investments in low-emission energy sources” [UMO-2011/01/B/HS4/02322], executed by the Wroclaw University of Economics and financed by the National Science Centre, Poland.

Conflicts of Interest

The author declares no conflict of interest.

References

  1. Central Statistical Office. Energy 2016; Central Statistical Office: Warsaw, Poland, 2016. [Google Scholar]
  2. Beccali, M.; Cellura, M.; Mistretta, M. Decision-making in energy planning: Application of the Electre method at regional level for the diffusion of renewable energy technology. Renew. Energy 2003, 28, 2063–2087. [Google Scholar] [CrossRef]
  3. Komor, P.; Bazilian, M. Renewable energy policy goals, programs, and technologies. Energy Policy 2005, 33, 1873–1881. [Google Scholar] [CrossRef]
  4. Onut, S.; Tuzkaya, U.R.; Saadet, N. Multiple criteria evaluation of current energy resources for Turkish manufacturing industry. Energy Convers. Manag. 2008, 49, 1480–1492. [Google Scholar] [CrossRef]
  5. Greening, L.A.; Bernow, S. Design of coordinated energy and environmental policies: Use of multi-criteria decision-making. Energy Policy 2004, 32, 721–735. [Google Scholar] [CrossRef]
  6. Directive 2009/28/EC of the European Parliament and of the Council of 23 April 2009 on the Promotion of the Use of Energy from Renewable Sources and Amending and Subsequently Repealing Directives 2001/77/EC and 2003/30/EC. Available online: http://europa.eu/legislation_summaries/energy/renewable_energy/en0009_en.htm (accessed on 2 May 2017).
  7. The Act of 10 April 1997 on Energy Law. Available online: http://isap.sejm.gov.pl/DetailsServlet?id=WDU19970540348 (accessed on 2 March 2017).
  8. The Act of 20 February 2015 on Renewable Energy Sources. Available online: http://isap.sejm.gov.pl/DetailsServlet?id=WDU20150000478 (accessed on 2 May2017).
  9. Ordinance of the Minister of Economy of 18 October 2012. Available online: http://isap.sejm.gov.pl/DetailsServlet?id=WDU20120001229 (accessed on 2 May 2017).
  10. Ordinance of the Minister of Energy of 17 October 2016. Available online: http://dziennikustaw.gov.pl/du/2016/1753/1 (accessed on 2 May 2017).
  11. Ligus, M. The analysis of competitiveness and potential of renewable energy technologies in Poland. Energy Environ. 2015, 26, 1247–1269. [Google Scholar] [CrossRef]
  12. The Act of 29 December 2015 amending the Act on Renewable Energy Sources and the Energy Law Act. Available online: http://isap.sejm.gov.pl/DetailsServlet?id=WDU20150002365+2015%2412%2431&min=1 (accessed on 4 May 2017).
  13. The Act of 22 June 2016 amending the Act on Renewable Energy Sources and some other acts. Available online: http://dziennikustaw.gov.pl/du/2016/925/1 (accessed on 5 May 2017).
  14. Terlecka, K.; Leśniak, K. Act on Windfarms and Amendments to the Act on Renewable Energy Sources. Available online: https://www.schoenherr.eu/publications/publications-detail/poland-act-on-windfarms-and-amendments-to-the-act-on-renewable-energy-sources/ (accessed on 5 May 2017).
  15. The Act of 20 May 2016 on investments in wind power plants. Available online: http://isap.sejm.gov.pl/DetailsServlet?id=WDU20160000961 (accessed on 5 May 2017).
  16. Resolution of the Council of Ministers no 202/2009 on the Polish Energy Policy until 2030. Available online: http://www.me.gov.pl/Energetyka/Polityka+energetyczna (accessed on 6 May 2017).
  17. Polish Ministry of Economy, Polish Nuclear Power Programme. 2014. Available online: http://www.me.gov.pl/Energetyka+jadrowa/Program+polskiej+energetyki+jadrowej (accessed on 7 June 2017).
  18. International Renewable Energy Agency (IRENA). Renewable Energy Benefits: Measuring the Economics. 2016. Available online: http://www.irena.org/DocumentDownloads/Publications/IRENA_Measuring-the-Economics_2016.pdf (accessed on 3 April 2017).
  19. IRENA. REthinking Energy: Accelerating the Global Energy Transformation. Available online: http://www.irena.org/DocumentDownloads/Publications/IRENA_REthinking_Energy_2017.pdf (accessed on 3 April 2017).
  20. IRENA. Renewable Energy and Jobs—Annual Review 2017. Available online: https://www.irena.org/DocumentDownloads/Publications/IRENA_RE_Jobs_Annual_Review_2017.pdf (accessed on 3 April 2017).
  21. IRENA. REthinking Energy: Renewable Energy and Climate Change. 2015. Available online: https://www.irena.org/rethinking/IRENA%20_REthinking_Energy_2nd_report_2015.pdf (accessed on 3 April 2017).
  22. IRENA. Accelerating of-Grid Renewable Energy: Key Findings and Recommendations from IOREC 2014. 2014. Available online: http://www.irena.org/DocumentDownloads/Publications/IRENA_2nd_IOREC_2015.pdf (accessed on 3 April 2017).
  23. Employment and growth effects of sustainable energies in the European Union. Available online: https://ec.europa.eu/energy/sites/ener/files/documents/EmployRES-II%20final%20report_0.pdf (accessed on 4 April 2017).
  24. UNIDO; GGGI. Global Green Growth: Clean Energy Industry Investments and Expanding Job Opportunities; Volume I: Overall Findings; UNIDO; GGGI: Vienna, Austria, 2015; Available online: https://www.unido.org/fileadmin/user_media/Services/PSD/GLOBAL_GREEN_GROWTH_REPORT_vol1_final.pdf (accessed on 4 April 2017).
  25. UNU-IHDP; UNEP. Inclusive Wealth Report 2014. Measuring Progress toward Sustainability; Cambridge University Press: Cambridge, UK, 2014; Available online: http://mgiep.unesco.org/wp-content/uploads/2014/12/IWR2014-WEB.pdf (accessed on 4 April 2017).
  26. Ryszawska, B. Zielona Gospodarka—Teoretyczne Podstawy Koncepcji i Pomiar jej Wdrażania w Unii Europejskiej; Wydawnictwo UE we Wrocławiu: Wrocław, Poland, 2013; ISBN 978-83-7695-377-9. [Google Scholar]
  27. Giannetti, B.F.; Agostinho, F.; Almeida, C.M.V.B.; Huisingh, D. A review of limitations of GDP and alternative indices to monitor human wellbeing and to manage eco-system functionality. J. Clean. Prod. 2015, 87, 11–25. [Google Scholar] [CrossRef]
  28. Pollin, R.; Garrett-Peltier, H.; Heintz, J.; Hendricks, B. Green Growth. A U.S. Program for Controlling Climate Change and Expanding Job Opportunities. 2014. Available online: http://www.peri.umass.edu/fileadmin/pdf/Green_Growth_2014/GreenGrowthReport-PERI-Sept2014.pdf (accessed on 6 April 2017).
  29. World Bank. The Changing Wealth of Nations: Measuring Sustainable Development in the New Millennium; World Bank: Washington, DC, USA, 2011; Available online: http://documents.worldbank.org/curated/en/630181468339656734/The-changing-wealth-of-nations-measuring-sustainable-development-in-the-new-millennium (accessed on 6 April 2017).
  30. Verbruggen, A.; Yurchenko, Y. Positioning nuclear power in the low-carbon electricity transition. Sustainability 2017, 9, 163. [Google Scholar] [CrossRef]
  31. Shen, Y.-C.; Lin, G.T.R.; Li, K.-P.; Yuan, B.J.C. An assessment of exploiting renewable energy sources with concerns of policy and technology. Energy Policy 2010, 38, 4604–4616. [Google Scholar] [CrossRef]
  32. Lehr, U.; Lutz, C.; Edler, D. Green Jobs? Economic impacts of renewable energy in Germany. Energy Policy 2012, 47, 358–364. [Google Scholar] [CrossRef]
  33. Lévêque, F. The Economics and Uncertainties of Nuclear Power; Cambridge University Press: Cambridge, UK, 2015; ISBN 978-1107087286. [Google Scholar]
  34. Sun, X.; Zhang, B.; Tang, X.; McLellan, B.C.; Höök, M. Sustainable energy transitions in China: Renewable options and impacts on the electricity system. Energies 2016, 9, 980. [Google Scholar] [CrossRef]
  35. Strietska-Ilina, O.; Hofmann, C.; Haro, M.D.; Jeon, S. Skills for Green Jobs: A Global View; Synthesis Report Based on 21 Country Studies; International Labour Organization: Geneva, Switzerland, 2011; Available online: http://www.ilo.org/wcmsp5/groups/public/---dgreports/---dcomm/---publ/documents/publication/wcms_159585.pdf (accessed on 7 April 2017).
  36. UK Energy Research Centre (UKERC). Low Carbon Jobs: The Evidence for Net Job Creation from Policy Support for Energy Efficiency and Renewable Energy. 2014. Available online: http://www.ukerc.ac.uk/publications/low-carbon-jobs-the-evidence-for-net-job-creation-from-policy-support-for-energy-efficiency-and-renewable-energy.html (accessed on 7 April 2017).
  37. IRENA; CEM. The Socio-Economic Benefits of Solar and Wind Energy. 2014. Available online: http://www.irena.org/DocumentDownloads/Publications/Socioeconomic_benefits_solar_wind.pdf (accessed on 7 April 2017).
  38. Dalkey, N.; Helmer, O. An experimental application of the Delphi method to the use of experts. Manag. Sci. 1963, 9, 458–467. [Google Scholar] [CrossRef]
  39. Krupowicz, J. Metody heurystyczne. In Prognozowanie Gospodarcze: Metody i Zastosowania; Cieślak, M., Ed.; Wydawnictwo Naukowe PWN: Warszawa, Poland, 2008; pp. 201–222. ISBN 978-83-01-15486-8. [Google Scholar]
  40. Saaty, T.L. The Analytic Hierarchy Process: Planning, Priority Setting, Resource Allocation; McGraw-Hill: New York, NY, USA, 1980; ISBN 0-07-054371-2. [Google Scholar]
  41. Forman, E.H.; Gass, S.I. The analytic hierarchy process—An exposition. Oper. Res. 2001, 49, 469–486. [Google Scholar] [CrossRef]
  42. Brunelli, M. Introduction to the Analytic Hierarchy Process; Springer: New York, NY, USA, 2015; ISBN 978-3-319-12502-2. [Google Scholar]
  43. Saaty, T.L. The Analytic Network Process; RWS Publications: Pittsburgh, PA, USA, 1996; ISBN 0-9620317-2-0. [Google Scholar]
  44. Trzaskalik, T. Wielokryterialne Wspomaganie Decyzji. Metody i Zastosowania; Polskie Wydawnictwo Ekonomiczne: Warsaw, Poland, 2014; ISBN 978-83-208-2118-5. [Google Scholar]
  45. Van Laarhoven, P.J.M.; Pedrycz, W. A fuzzy extension of Saaty’s priority theory. Fuzzy Set Syst. 1983, 11, 229–241. [Google Scholar] [CrossRef]
  46. Demirel, T.; Demirel, N.C.; Kahraman, C. Fuzzy analytic hierarchy process and its application. In Fuzzy Multi-Criteria Decision Making; Kahraman, C., Ed.; Springer: New York, NY, USA, 2008; pp. 53–83. ISBN 978-0-387-76813-7. [Google Scholar]
  47. Chen, H.H.; Kang, H.-Y.; Lee, A.H.I. Strategic selection of suitable projects for hybrid solar-wind power generation systems. Renew. Sustain. Energy Rev. 2010, 14, 413–421. [Google Scholar] [CrossRef]
  48. Erdogan, M.; Kaya, I. An integrated multi-criteria decision-making methodology based on type-2 fuzzy sets for selection among energy alternatives in Turkey. Iran. J. Fuzzy Syst. 2015, 12, 1–25. [Google Scholar]
  49. Ren, J.; Dong, L.; Sun, L.; Evan, G.M.; Dong, L.; Luo, X.; Sovacool, B.K. “Supply push” or “demand pull?”: Strategic recommendations for the responsible development of biofuel in China. Renew. Sustain. Energy Rev. 2015, 52, 382–392. [Google Scholar] [CrossRef]
  50. Chang, D.Y. Applications of the extent analysis method on fuzzy AHP. Eur. J. Oper. Res. 1996, 95, 649–655. [Google Scholar] [CrossRef]
  51. Behzadian, M.; Otaghsara, S.K.; Yazdani, M.; Ignatius, J. A state-of the-art survey of TOPSIS applications. Expert Syst. Appl. 2012, 39, 13051–13069. [Google Scholar] [CrossRef]
  52. Akbaş, H.; Bilgen, B. An integrated fuzzy QFD and TOPSIS methodology for choosing the ideal gas fuel at WWTPs. Energy 2017, 125, 484–497. [Google Scholar] [CrossRef]
  53. Hwang, C.-L.; Yoon, K. Multiple Attribute Decision Making: Methods and Applications. A State-of-the-Art Survey; Springer: New York, NY, USA, 1981; ISBN 978-3-642-48318-9. [Google Scholar]
  54. Ligus, M.; Wiśniewski, G.; Michałowska-Knap, K.; Arcipowska, A.; Kamińska, M.; Maciejewski, Z. Comparative Analysis of Wind Energy and Nuclear Power and Their Potential to Create Jobs; Report for Greenpeace Polska and Heinrich Boll Stiftung Warszawa, 2nd Revised Edition; Greenpeace Polska and Heinrich Boll Stiftung: Warsaw, Poland, 2012; Available online: http://www.greenpeace.org/poland/PageFiles/351920/morski-wiatr-kontra-atom.pdf (accessed on 7 July 2017).
  55. Hultman, N.E.; Koomey, J. A reactor-level analysis of busbar costs for US nuclear power plants 1970–2005. Energy Policy 2007, 35, 5630–5642. [Google Scholar] [CrossRef]
  56. Suna, D.; Resch, G. Is nuclear economical in comparison to renewables? Energy Policy 2016, 98, 199–209. [Google Scholar] [CrossRef]
Figure 1. Hierarchical assessment model of low-emission energy technologies in Poland.
Energies 10 01550 g001
Table 1. Economic, social and environmental impacts of low-emission energy technologies.
Dimensions ImpactsNo
Economic
GDP1
Trade balance2
Competitiveness and innovativeness of economy3
Unemployment rate (in case of significant imbalance in the labor market)4
Energy security of enterprise and public sector (e.g., by developing local energy systems and autoproducing energy from RES for business purposes; diversification of energy sources; impact on the fossil fuels price fluctuations; unstable energy production with some RES technologies)5
Balanced development of regions6
Land requirement (e.g., due to low efficiency, the energy produced per unit of land occupied is low for most RES technologies)7
Social
Eliminating social inequality (e.g., the deployment of distributed RES activates rural areas)8
Shaping new energy culture9
Energy security of households (as in the case of companies and, e.g., by the development of prosumer energy)10
Environmental
Carbon emissions11
SOx, NOx, PM10, PM2.5 emissions (causing negative impacts on human health, flora and fauna, materials)12
Amount of waste generation13
Resource efficiency of the economy14
Interference in the landscape15
Risk of failure/accident (e.g., major accident of nuclear reactor; environmental contamination during long-term storage of radioactive waste)16
Table 2. The scale of technology impact assessment.
Linguistic Impact AssessmentNumerical Impact Assessment
very strong positive impact4
strong positive impact3
moderate positive impact2
minor positive impact1
lack of impact0
minor negative impact−1
moderate negative impact−2
strong negative impact−3
very strong negative impact−4
Table 3. Aggregated fuzzy pairwise comparison matrix for the main criteria.
Main CriteriaEconomy SocietyEnvironment
lk1mk1uk1lk2mk2uk2lk3mk3uk3
Economy1111.522.523.520.441.442.44
Society0.280.390.661110.741.74
Environment0.410.692.260.370.581.36111
Table 4. Normalized fuzzy weights for main criteria.
Main Criteria Q ˜ k
QklQkmQku
Economy0.1856410.4789111.030173
Society0.1265510.302280.649946
Environment0.1111030.2188090.682301
Table 5. Priorities for main criteria with calculations.
klkmkuklgmgug V ( Q ˜ k Q ˜ i ) m i n V ( Q ˜ k Q ˜ i ) wi
10.1860.4791.0300.1270.3020.650110.420
economy0.1860.4791.0300.1110.2190.6821
20.1270.3020.6500.1860.4791.0300.7240.7240.304
society0.1270.3020.6500.1110.2190.6821
30.1110.2190.6820.1860.4791.0300.6560.6560.276
enviroment0.1110.2190.6820.1270.3020.6500.869
Table 6. Local and global priorities for criteria and sub-criteria.
Criteria/SubcriteriaLocal PrioritiesGlobal Priorities
Economy0.4200.420
GDP0.1460.061
Trade balance0.1100.046
Competitiveness and innovativeness of economy0.1670.070
Unemployment rate0.1420.060
Energy security of enterprise and public sector0.1660.070
Balanced development of regions0.1570.066
Land requirement0.1120.047
Society0.3040.304
Eliminating social inequality0.3660.111
Shaping new energy culture0.3080.094
Energy security of households0.3260.099
Environment0.2760.276
Carbon emissions0.1790.049
SOx, NOx, PM10, PM2.5 emissions0.1670.046
Amount of waste generation0.1710.047
Resource efficiency of the economy0.1710.047
Interference in the landscape0.1610.044
Risk of failure/accident0.1520.042
Table 7. Average scores for low-emission technologies.
CriterionEnergy Technologies
Wind On-ShoreWind Off-ShoreBiomass and BiogasPhotovoltaicNuclear
Economy7.45.86711.3339.8674.4
GDP1.2671.2002.0002.0000.733
Trade balance0.4000.5330.8000.8670.067
Competitiveness and innovativeness of economy1.7331.8001.6672.3331.867
Unemployment rate1.0000.4671.9331.2670.333
Energy security of enterprise and public sector2.2001.6672.8002.1332.600
Balanced development of regions1.1330.2672.1331.467−0.200
Land requirement−0.333−0.0670.000−0.200−1.000
Society4.8662.47.27.8011.067
Eliminating social inequality1.5330.4672.4672.267−0.200
Shaping new energy culture1.9331.4002.5332.8670.000
Energy security of households1.4000.5332.2002.6671.267
Environment6.0677.7343.47.4−3.133
Carbon emissions2.4672.4001.5332.0002.533
SOx, NOx, PM10, PM2.5 emissions2.3332.2671.4002.1331.667
Amount of waste generation1.3331.4000.0670.600−2.800
Resource efficiency of the economy2.2672.4002.1332.6671.400
Interference in the landscape−2.733−1.200−1.000−0.533−2.133
Risk of failure/accident0.4000.467−0.7330.533−3.800
TOTAL18.33316.00121.93325.0682.334
Table 8. Ranking of low-emission energy technologies on the basis of the FAHP method.
Energy TechnologyWind On-ShoreWind Off-ShoreBiomass and BiogasPhotovoltaicNuclear
Final result1.2760.9881.6271.7740.306
Ranking34215
Table 9. Ranking of low-emission energy technologies on the basis of the FAHP method with the use of TOPSIS.
Energy TechnologyWind On-ShoreWind Off-ShoreBiomass and BiogasPhotovoltaicNuclear
Final result0.6170.5180.7840.8590.163
Ranking34215
Table 10. Comparison of weights derived from the FAHP method and weights given by experts.
CriterionWeights Calculated Using the FAHP MethodWeights Provided by Experts
Local PrioritiesGlobal PrioritiesLocal PrioritiesGlobal Priorities
Economy0.4200.4200.35730.3573
GDP0.1460.0610.14670.0524
Trade balance0.1100.0460.10670.0381
Competitiveness and innovativeness of economy0.1670.0700.19330.0691
Unemployment rate0.1420.0600.10000.0357
Energy security of enterprise and public sector0.1660.0700.21330.0762
Balanced development of regions0.1570.0660.10330.0369
Land requirement0.1120.0470.13670.0488
Society0.3040.3040.25070.2507
Eliminating social inequality0.3660.1110.29330.0735
Shaping new energy culture0.3080.0940.36000.0902
Energy security of households0.3260.0990.34670.0869
Environment0.2760.2760.39070.3907
Carbon emissions0.1790.0490.23670.0925
SOx, NOx, PM10, PM2.5 emissions0.1670.0460.26330.1029
Amount of waste generation0.1710.0470.12330.0482
Resource efficiency of the economy0.1710.0470.14000.0547
Interference in the landscape0.1610.0440.13000.0508
Risk of failure/accident0.1520.0420.10670.0417
Table 11. Ranking of low-emission energy technologies with weights provided by experts.
Energy TechnologyWind On-ShoreWind Off-ShoreBiomass and BiogasPhotovoltaicNuclear
Final result1.3731.1771.5371.7830.500
Ranking34215

