Study of Anti-Sliding Stability of a Dam Foundation Based on the Fracture Flow Method with 3D Discrete Element Code


1
Key Laboratory of Ministry of Education for Geomechanics and Embankment Engineering, Hohai University, Nanjing 210098, China
2
Institute of Geotechnical Research, Hohai University, Nanjing 210098, China
3
HydroChina-ITASCA R&D Center, ITASCA Consulting Group, Hangzhou 311122, China
*
Author to whom correspondence should be addressed.
Energies 2017, 10(10), 1544; https://doi.org/10.3390/en10101544
Submission received: 25 July 2017
/
Revised: 5 September 2017
/
Accepted: 2 October 2017
/
Published: 6 October 2017
Abstract
:Fractured seepage is an important factor affecting the interface stability of rock mass. It is closely related to fracture properties and hydraulic conditions. In this study, the law of seepage in a single fracture surface based on modified cubic law is described, and the three-dimensional discrete element method is used to simulate the dam foundation structure of the Capulin San Pablo (Costa Rica) hydropower station. The effect of construction joints and developed structure on dam stability is studied, and its permeability law and sliding stability are also evaluated. It is found that the hydraulic-mechanical coupling with strength reduction method in DEM is more appropriate to use to study the seepage-related problems of fractured rock mass, which considers practical conditions, such as the roughness of and the width of fracture. The strength reduction method provides a more accurate safety factor of dam when considering the deformation coordination with bedrocks. It is an important method with which to study the stability of seepage conditions in complex structures. The discrete method also provided an effective and reasonable way of determining seepage control measures.
1. Introduction
Seepage liquid is usually regarded as external load in a dam foundation or in rock engineering. The methods of evaluating the stability of complex infiltration load and of the effect of hydraulic-mechanical coupling are major challenges in civil engineering. A discrete fractured rock mass is rich in joint surfaces when compared with a porous medium. The directionality, connectivity, openness, filling, and roughness of joints contribute to the characteristics of inhomogeneity, anisotropy, and discontinuity in fractured rock mass, and significantly influence the seepage in a fractured rock mass. The above situation should be considered to determine whether the seepage characteristics of fractured rock are in accordance with the cubic law of seepage. Incorrect uses of the porous media seepage analysis method will easily lead to unreasonable results.
Traditionally, there are usually three types of seepage calculations in the analysis of fractured rock mass (Jing, 2003) [1]: the Continuum methods, Discontinuum methods, and a Hybrid continuum/discontinuum models. The equivalent porous media model as a continuum method is typically used and developed. He et al. (2011) [2] proposed a new approach for equivalent porous media model to evaluate equivalent permeability tensors, the finite element method was used in the study of single-hole packer tests. When it comes to the computational mechanics of discontinua and hybrid method, the most widely used methods are discrete-element method (DEM) [3], discontinuum deformation analysis (DDA) [4,5], and the combined finite-discrete-element method (FEM/DEM) [6,7] etc. Based on Newton’s second law, the discrete element method can explain the displacement of the block associated with sliding, separation, and rotation by analyzing the contact force between the element and its surrounding’s contact interaction. Lorig [8] proposed that the hydraulic behavior of rock mass is mainly determined by the jointing pattern and DEM is particularly well suited to investigate the stability of discontinuous rock slopes. Besides, a three-dimensional model for rock slopes based on micromechanics was established, which accepts a general discrete fracture network that are overlaid on the lattice springs and the influence of deformation on fluid pressure is considered [9]. However, the accurate seepage process need not only reasonably numerical calculation method-discrete element method that considered the sliding, separation, and rotation of rock mass, but also need to ensure the flow of fluid in fractured rock flow reasonable, which is mainly depending on the characteristics of the fractures, such as the degree of roughness and the change in fissure width.
Many scholars have conducted an optimized study on fractured seepage network models from one-two to three-dimensional. Javadi and Sharifzadeh (2010) [10] proposed a new geometrical model for non-linear fluid flow through rough fractures based on the comparison between simulation results and developed formulation. Parashar and Reeves (2012) [11] presented an overview of the two-dimensional discrete fracture network methodology for computation of flow and provided guidelines for design of DFN algorithms. Zheng and Deng (2015) [12] used the Baecher disk model, which is a widely used 3-D discontinuity network model (3DDNM) to validate whether the trace spacings simulated obey the observed exponential distribution. Besides, Leung (2012) [13] and Liu (2015) [14] contribute to the evaluation of permeability parameters in 2D discrete fracture network. Zafarani and Detwiler, (2012) [15] introduce a new three-dimensional discrete fracture network model of flow and transport that explicitly represents aperture variability within each fracture, which allows to directly study the effects of hydrodynamic dispersion, channeling, and mixing through intersections. Guo et al. (2015) [16] used a digital technique to generate a three-dimensional fracture mesh randomly in order to provide a more accurate model for the calculation of seepage flow in fractured rock masses in terms of sample size and accuracy. In order to obtain the accurate flow in the rough fracture, a modified three-dimensional numerical model has been established (He et al. 2016) [17] to simulate the steady flow in the rough fracture considering the influence of a three-dimensional, coarse-grained fracture.
According to the geological conditions of Capulin San Pablo hydropower station in Costa Rica, the hydraulic-mechanical coupling model is established by using the discrete element method based on the seepage theory of a fractured rock mass. The effect of different structural planes on the sliding failure of the dam under the condition of checking flood water level is considered. In addition, the anti-sliding stability of the dam foundation is evaluated by the strength reduction method, and the application of fracture seepage in the stability analysis of complex dam foundation engineering is discussed.
2. Methodology
2.1. Seepage in a Single Fracture
The flow of a fluid in a single fracture is usually described by the Navier-Stokes equation, which is based on momentum and mass conservation. The equation assumes that the fluid through the fracture is a stable laminar flow with a constant density and viscosity, and, moreover, that the fracture wall is impermeable. The vector form of the Navier-Stokes equation is represented as
where ρ is the fluid density (kg/m3), μ the fluid viscosity (N·s/m2), the fluid velocity vector (m/s), and the hydrodynamic pressure (Pa).
However, the Navier-Stokes equations are difficult to solve using nonlinear partial differential equations. Therefore, a simplified treatment is usually used; namely, the local cubic law (LCL) that approximates a three-dimensional flow field into a two-dimensional flow field (zero velocity in the z direction) by the Stokes equation. The fracture surface is assumed to be rough, and the viscous force in the flow field plays an important role. The formula for the local cubic law is as follows:
where b (m) is the local aperture parallel to the z axis, γ the bulk density (Pa), μ the fluid viscosity (N·s/m2), and H (x, y) the average hydraulic head (m).
The two-dimensional flow field of the LCL was approximated as a one-dimensional flow field in cubic law. The fracture surface is assumed to be a pair of parallel plates separated by a certain distance. Rock mass is assumed to be impermeable and seepage only occurs in the fracture surface. It is considered that the seepage rate of a single fracture is proportional to the third power of the fracture opening:
where Q is the single wide flow rate (m3/s), γ the bulk density(Pa), W the crack width(m), μ the dynamic viscous coefficient (N·s/m2), b the local aperture opening parallel to the z axis(m), and Hi − Ho/L is the hydraulic gradient.
Engelder, Scholz, Raven, and some others proved through experiments that the cubic law is only suitable to describe a single fracture with a smooth wall, large opening, and no filling of the fracture. Tsang (1987) [18] pointed out that the infiltration in the fracture is actually a trench flow rather than a laminar flow because of the change in the fracture aperture size and the existence of nonconforming regions. Gudmundsson (2000) [19] proposed that the fracture aperture depends not only on the associated stress field, but also on its controlling dimension, thus realistic models applied to fluid flow in rock fractures should take it into consideration. In order to consider the effects of fracture roughness and aperture variation on permeability, Witherspoon (1983) [20] introduced the concept of the hydraulic conducting aperture and formed the generalized flow law as follows:
where f is the joint roughness coefficient, C is a constant depending on the flow geometry and fluid properties. If n is taken as 3, Equation (5) degenerates into the cubic law. The hydraulic conducting aperture bh (μm) and the mechanical conducting aperture b (μm) have the following relationship:
Barton and Bandis (1985) [21] proposed an empirical formula based on based on a constitutive model relating, mechanical aperture bE (μm), the theoretical smooth wall conducting aperture be (μm), and joint roughness coefficient (JRC). The conductivity in units of length squared kH (m2) can be estimated based on conversion from the bE to be, which is nonlinear with be.
Barton’s model has a higher degree of agreement with the test results than some linear relationships (Rutqvist, 1996) [22]. Most experiments show that when the opening degree is reduced to a certain extent, the cubic law fails, and in this case the generalized cubic law (n = 3, f ≠ 1) is still applicable. When the aperture size continues to decrease, the generalized cubic law is invalid. In this case, the generalized flow law should be adopted.
Detournay (1980) [23] has proposed a relation between the hydraulic aperture, uh (μm), and the joint deformation, △um (μm):
where f is a correction factor that reflects the influence of the roughness on the tortuosity of the flow, um is defined as the average distance between the joint surfaces, and um0 is the initial aperture. This relation permits a more general fitting of the “cubic law” to the experimental results. Assuming the following dependence of the joint conductivity (kH) on hydraulic aperture, Alvarez et al. (1995) [24] reanalyzed some previously published data on joint conductivity, and have confirmed the validity of the “modified cubic law” (MCL) as follows:
The MCL provides an approach for accurately calculating the hydraulic properties and local vertically integrated flow fields for rough and tortuous fractures. When it comes to the analysis of multifractured rock-mass seepage, mature three-dimensional, discrete element analysis software can deal with it well based on the MCL. On this basis, we discuss the anti-sliding stability of the dam foundation because it is suitable for integration with, and the improvement of, fracture network models.
2.2. Numerical Simulation Method and Verification
The presumptions made in simulating the seepage flow of a fractured rock mass are as follows: (a) The structural plane is permeable and the rock mass is impermeable; (b) structural plane seepage obeys the cubic law; and, (c) the hydraulic-mechanical coupling on the structural plane is considered, and the seepage rate of the structural plane under different stress conditions will change with the fracture width.
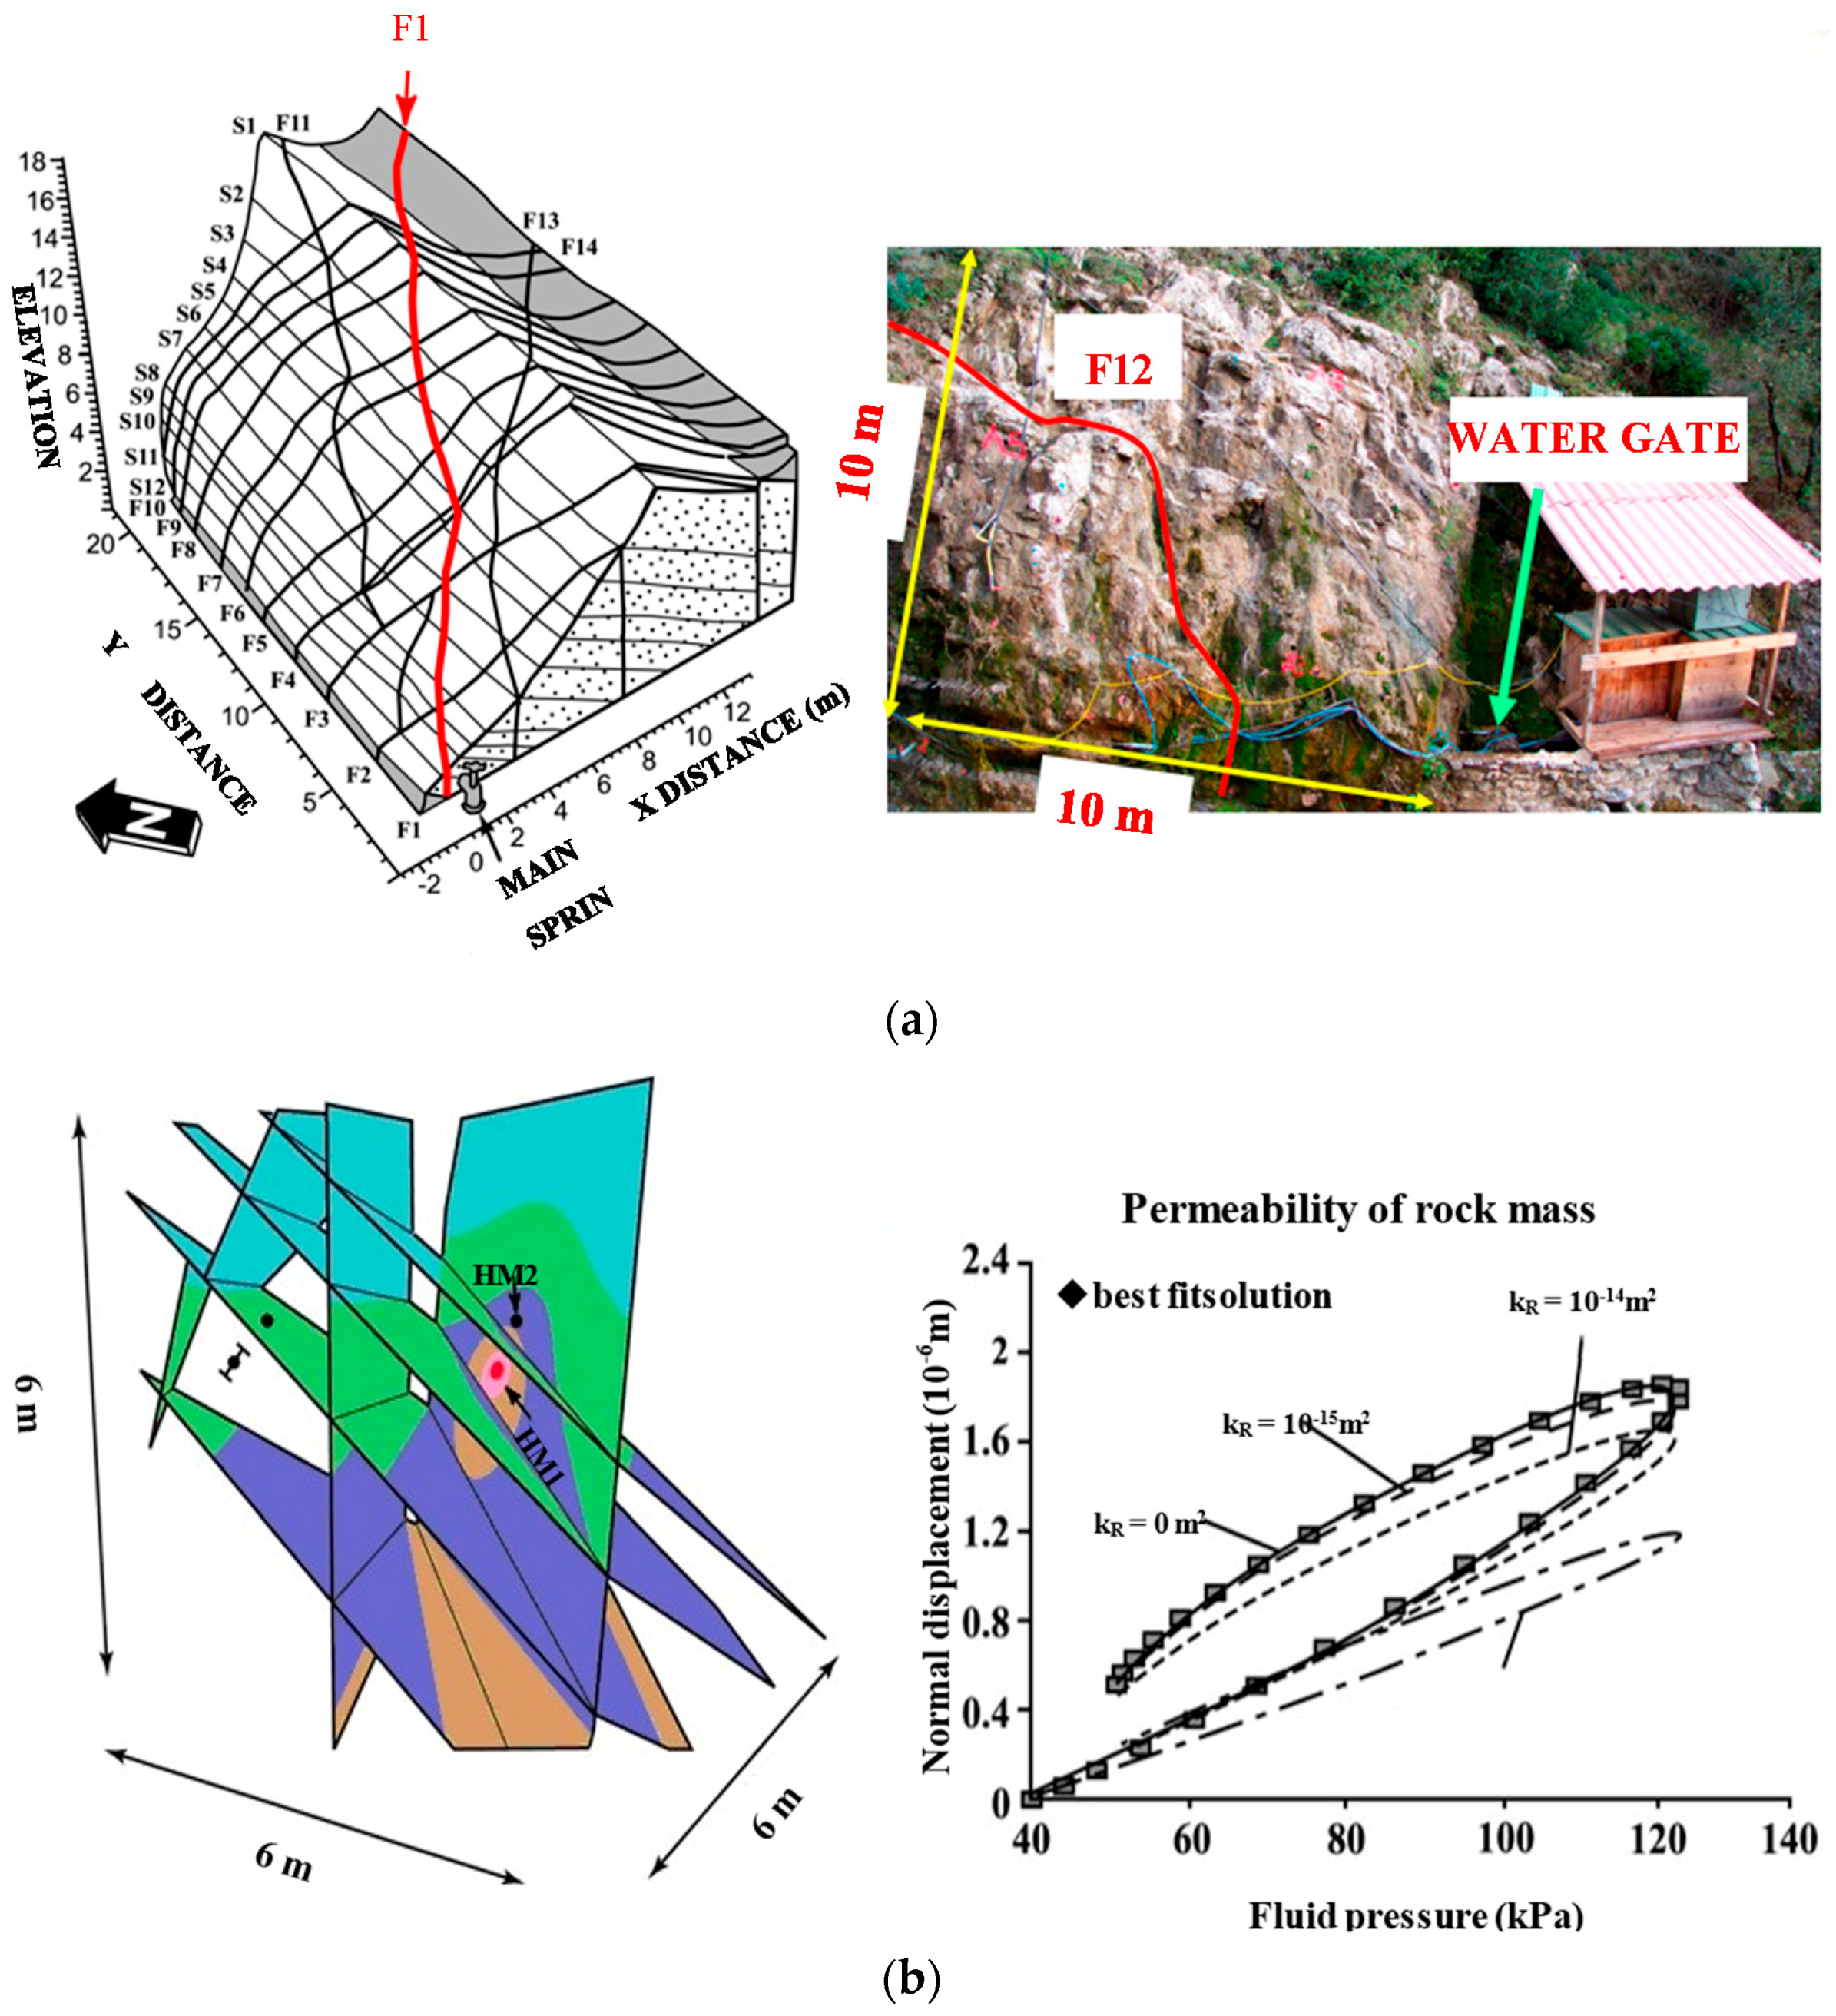
Cappa (2005) [25] conducted a series of in situ confirmatory tests of fracture seepage in the Southern French Alps. The site consists of impermeable marl at the bottom and upper 15 m accumulation of fractured limestone, as shown in Figure 1a. The spring water stored by the fault appears to be perpendicular to the nonpermeable fault. A 10 m thick layer of waterproof concrete was installed on the surface to avoid water leakage at the point of discontinuity, and thus the site can be regarded as a 30 × 30 m2 natural reservoir. Water pressure can be controlled manually by a sluice, and is maintained at a level 10 m above the sluice when the sluice is closed; the stored water will flow out naturally when the sluice is opened.
Piezometers were arranged densely in the test area, and six sets of stress-strain measurements were acquired at three discontinuous measuring points. The water injection test of a fault (designated F12) was carried out and the variation of its width during the water-filling process was measured. The hydraulic and mechanical properties of the main fault structures are shown in Table 1.
The hydraulic-mechanical coupling of a fractured rock mass is complex, and it is difficult to obtain accurate solutions for it. Moreover, the development of computer numerical methods provides an important method of hydraulic coupling analysis. The in situ test was simulated by three-dimensional, discrete element software, and the relationship between fluid pressure and normal displacement is shown in Figure 1b.
The results show that the fracture width and permeability increases with an increasing water pressure in the fracture surface, while the fracture width and permeability decreases with decreasing water pressure. The change of water pressure will lead to the change of the fracture width in the process of fracture seepage. The change of the fracture width will also lead to a significant change in permeability, since the fracture surface permeability and aperture width have a cubic power relationship. Based on the verifying examples shown in the figure, the discrete element method can accurately simulate the physical mechanics phenomena in fracture seepage.
2.3. Hydraulic-Mechanical Coupling with Strength Reduction Method in DEM
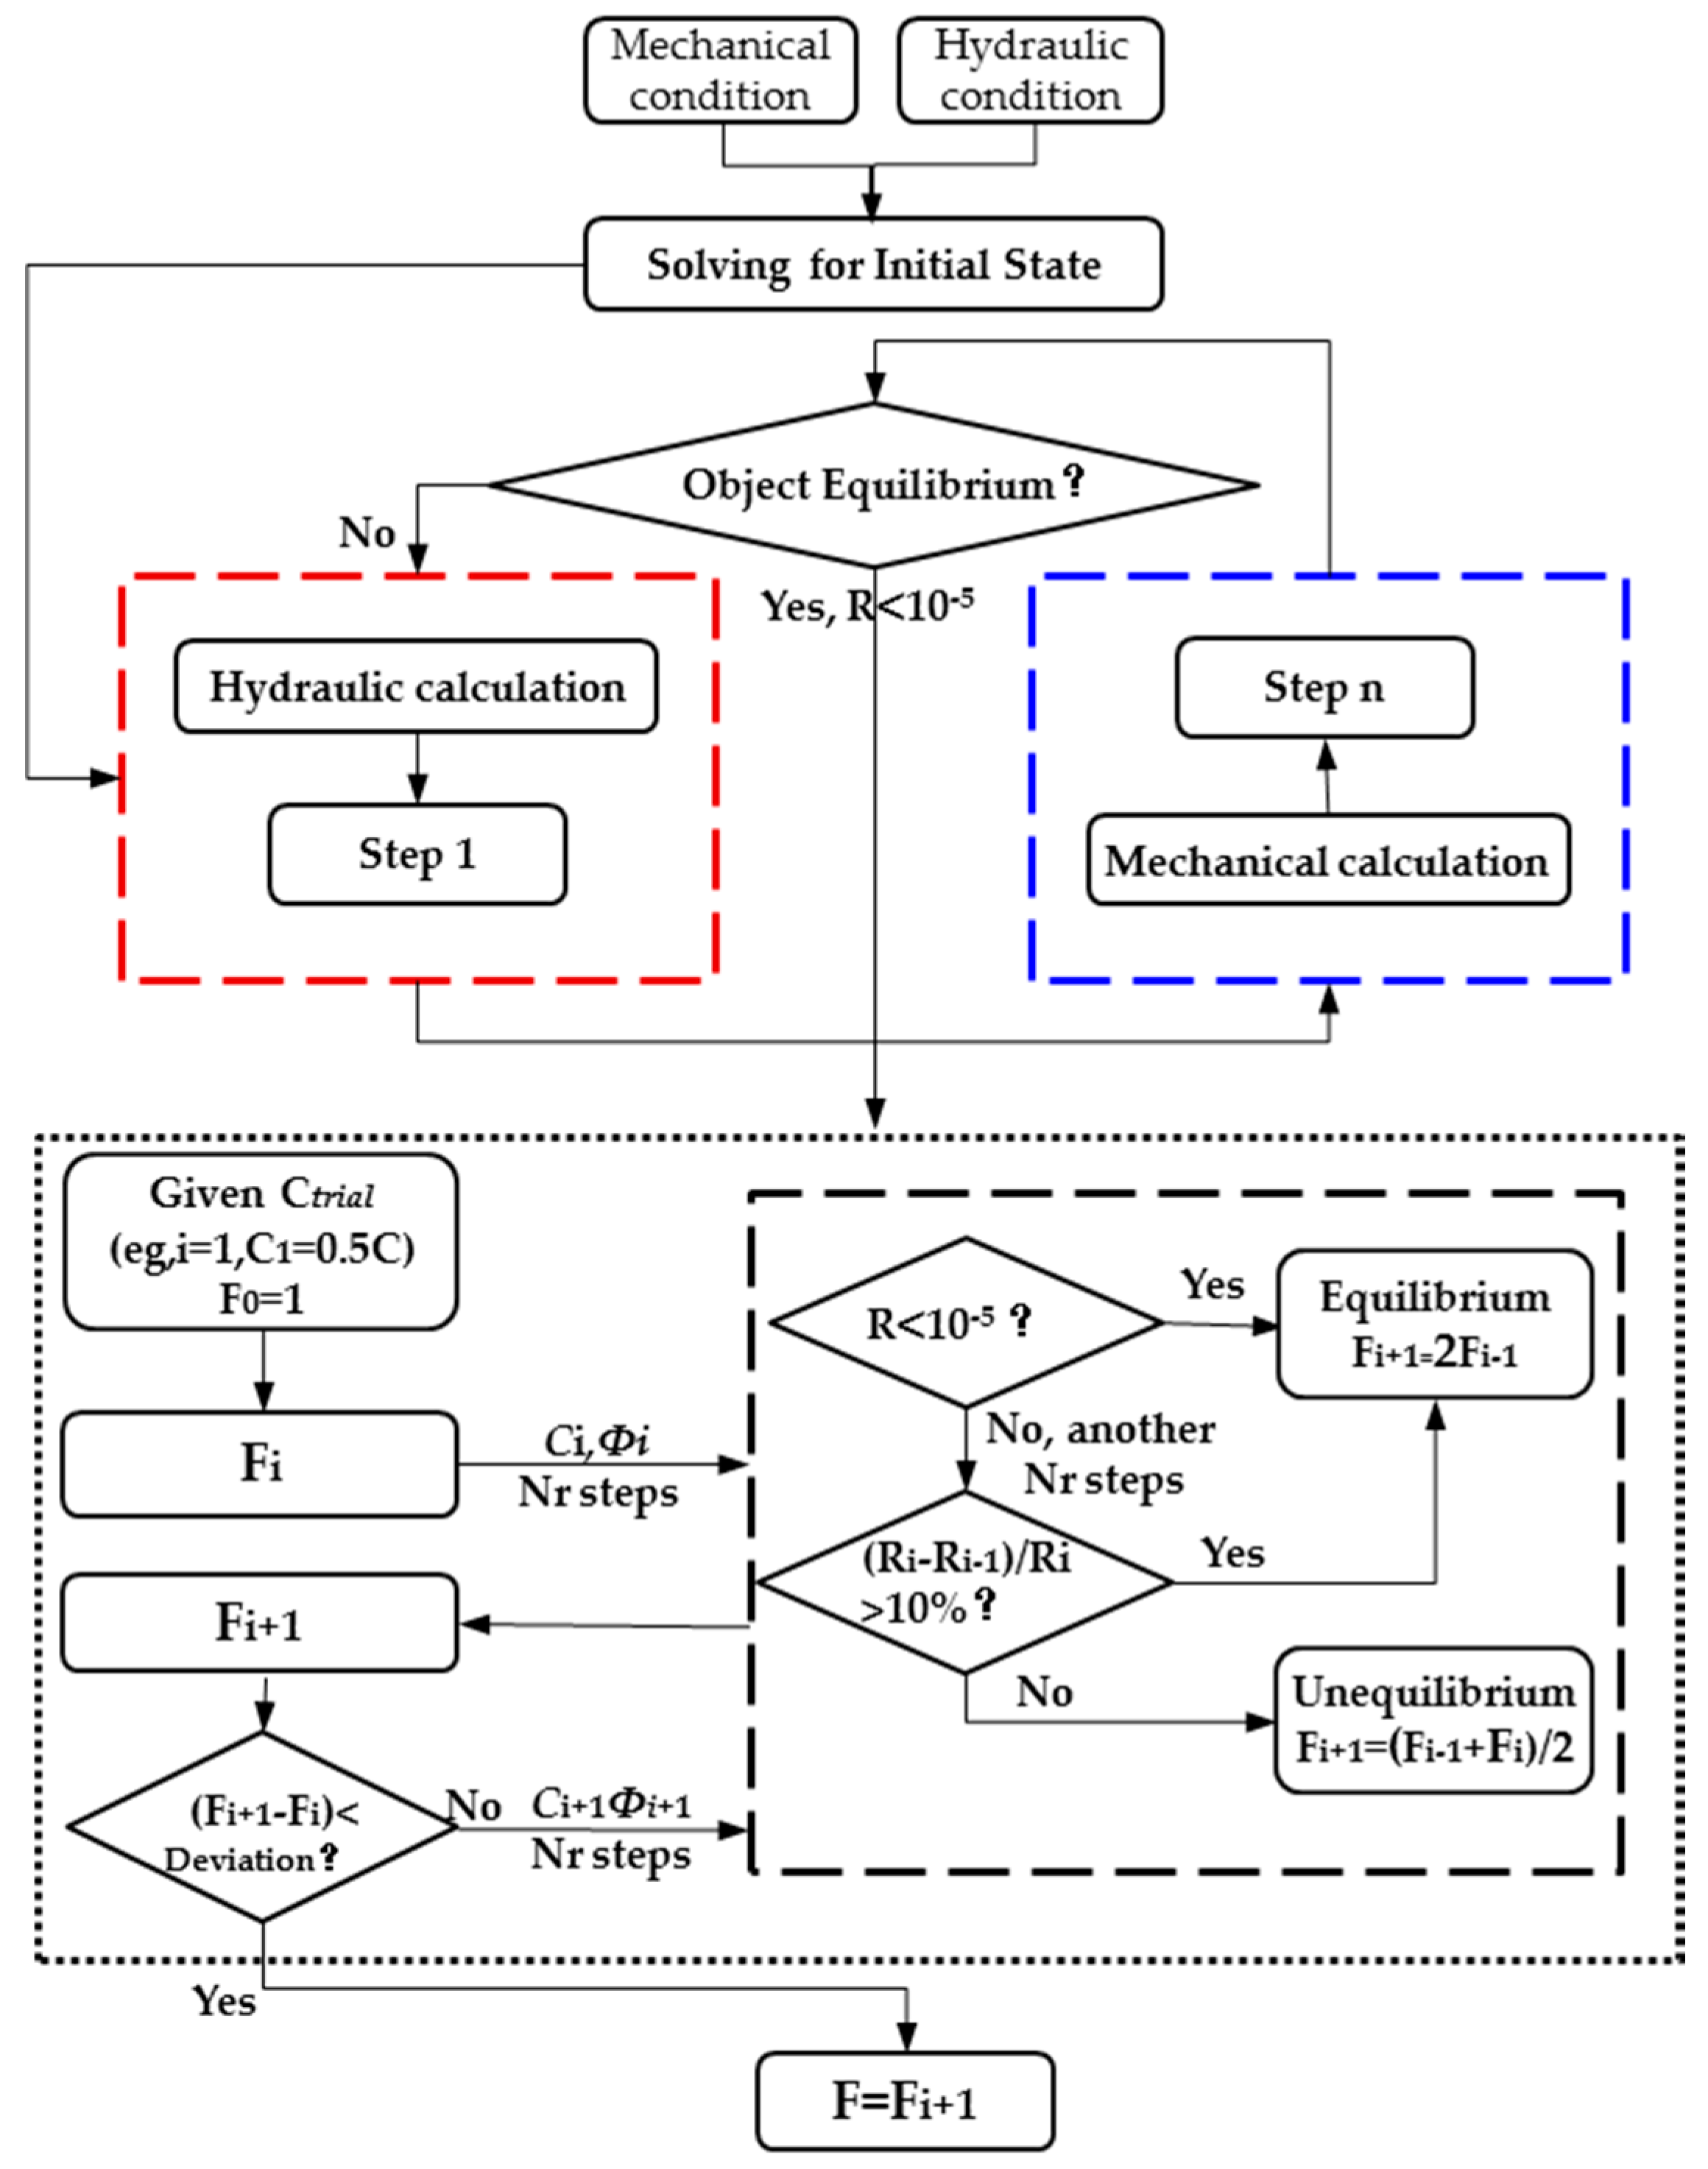
Strength reduction method is typically applied in safety factor (F) calculations by progressively reducing the shear strength of the rock material to bring the slope to a state of limiting equilibrium (situation that actual strength state (τa) that corresponds to the shear strength (τs)). An updated trial material parameter derived through the strength parameter was divided by the strength reduction coefficient Ftrial. The two strength reduction coefficients of the research object are in equilibrium state, and the non-equilibrium state can be obtained, respectively, by the reduction of the parameters. The safety factor was calculated using the “bracketing approach” (the least squares method), which is similar to the method proposed by Dawson (1999) [26]. The strength reduction coefficient at the time when the system in the limit equilibrium state and satisfy the deviation requirement is the safety factor. Thereby, the strength parameters Ctrial and Фtrial were calculated by:
Besides, the way to determine the stability state of the research object during the strength reduction process by the unbalanced force ratio in Figure 2. The system in continuous plastic flow state means that there is the unbalanced force still in the system, causing the increasing displacement, which also makes it possible to get the safety factor by analyses of the changes of macroscopic displacement.
In the analysis of fractured rock mass flow problems or the stability of hydraulic structures, taking into account the seepage effect will be closer to the reality, moreover, it is of great significance considering the tortuosity and roughness of the fracture that improves seepage model. On this basis, we summarized the general process of analyzing these problems taking into account the hydraulic-mechanical coupling based on the strength reduction method as follows as Figure 2.
3. Analytical Method of Seepage in Dam Foundation
3.1. Dam Foundation Model
The Capulin San Pablo hydropower station is located on the Tarcoles River in Costa Rica. It mainly includes retaining structures, water discharge structures, a left bank water conveyance system, and a left bank ground workshop. The retaining structure is a roller-compacted-concrete gravity dam comprised of nine dam sections, with a crest elevation of 196.50 m, a maximum dam height of 48.5 m, a crest width of 7.4 m, and a dam axis length of 165.5 m. The exposed strata in the dam site is mainly composed of volcanic breccias as well quaternary residual slope gravel soil, collapse slope gravel, and stone with a small amount of clay. The lower slope of the riverbed is distributed with a gently inclined clayey tuff, the poor character of, which will affect the stability of the dam. In the foundation of the dam, weak structural planes, such as the slopes of the gentle dip faults (designated F11, F12, F2, and F3 and listed in Table 1) are widely developed. Specific rock mass parameters and dam structure parameters are shown in Table 2 and Table 3, respectively.
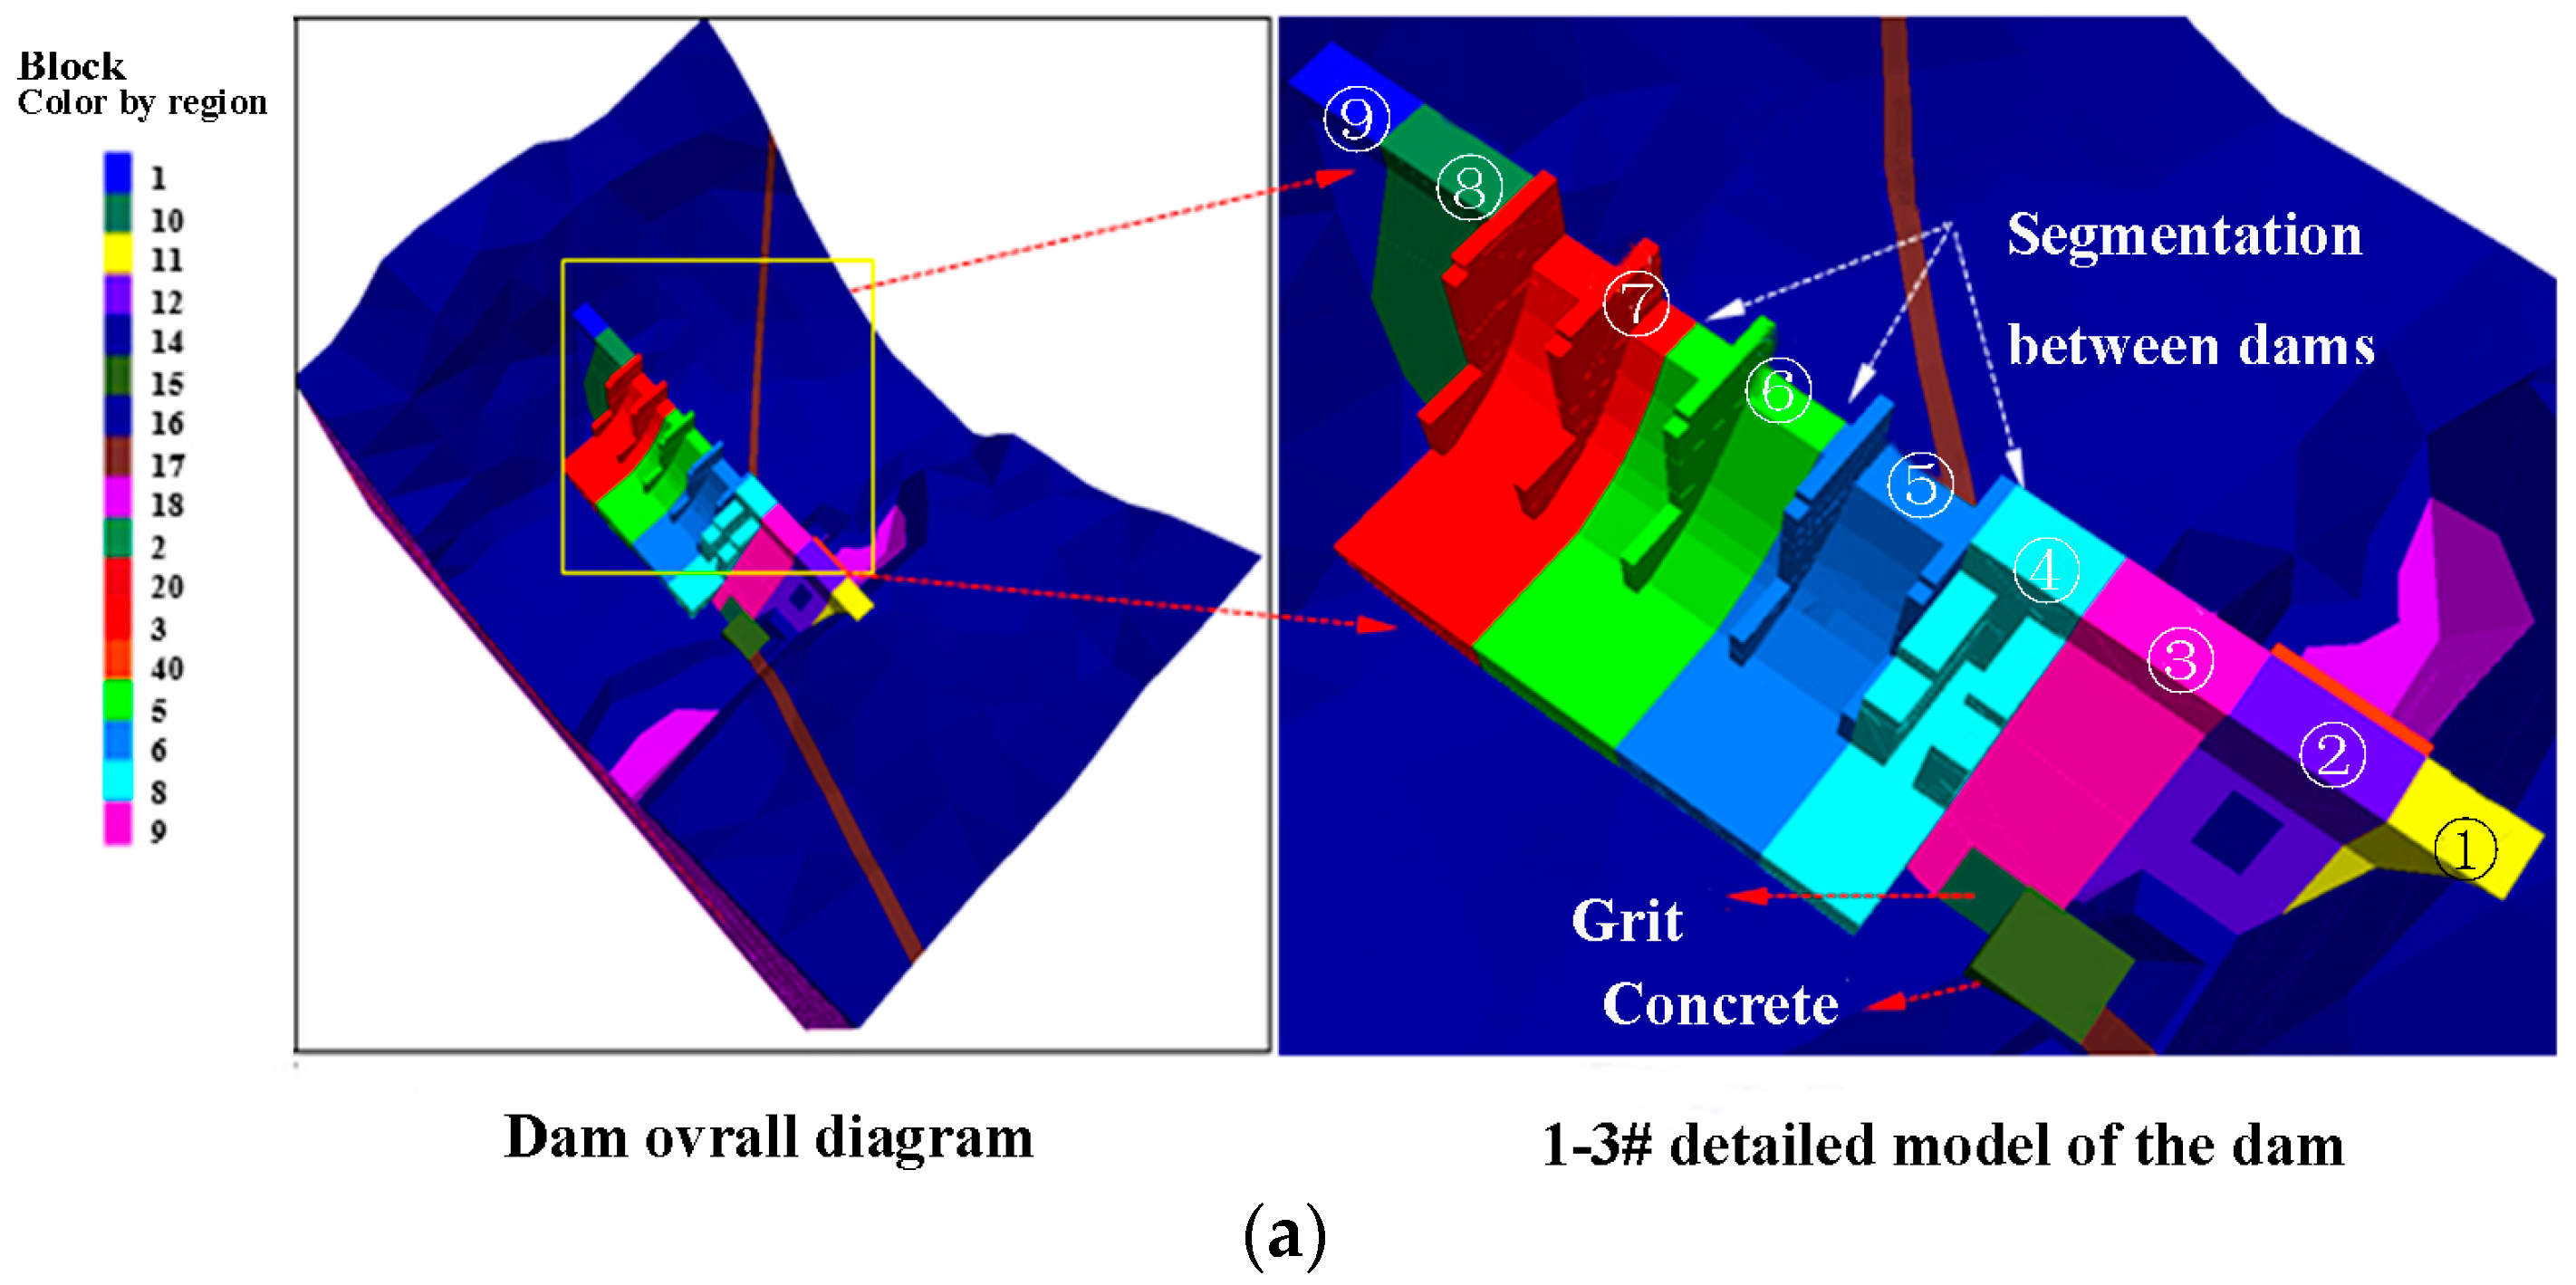
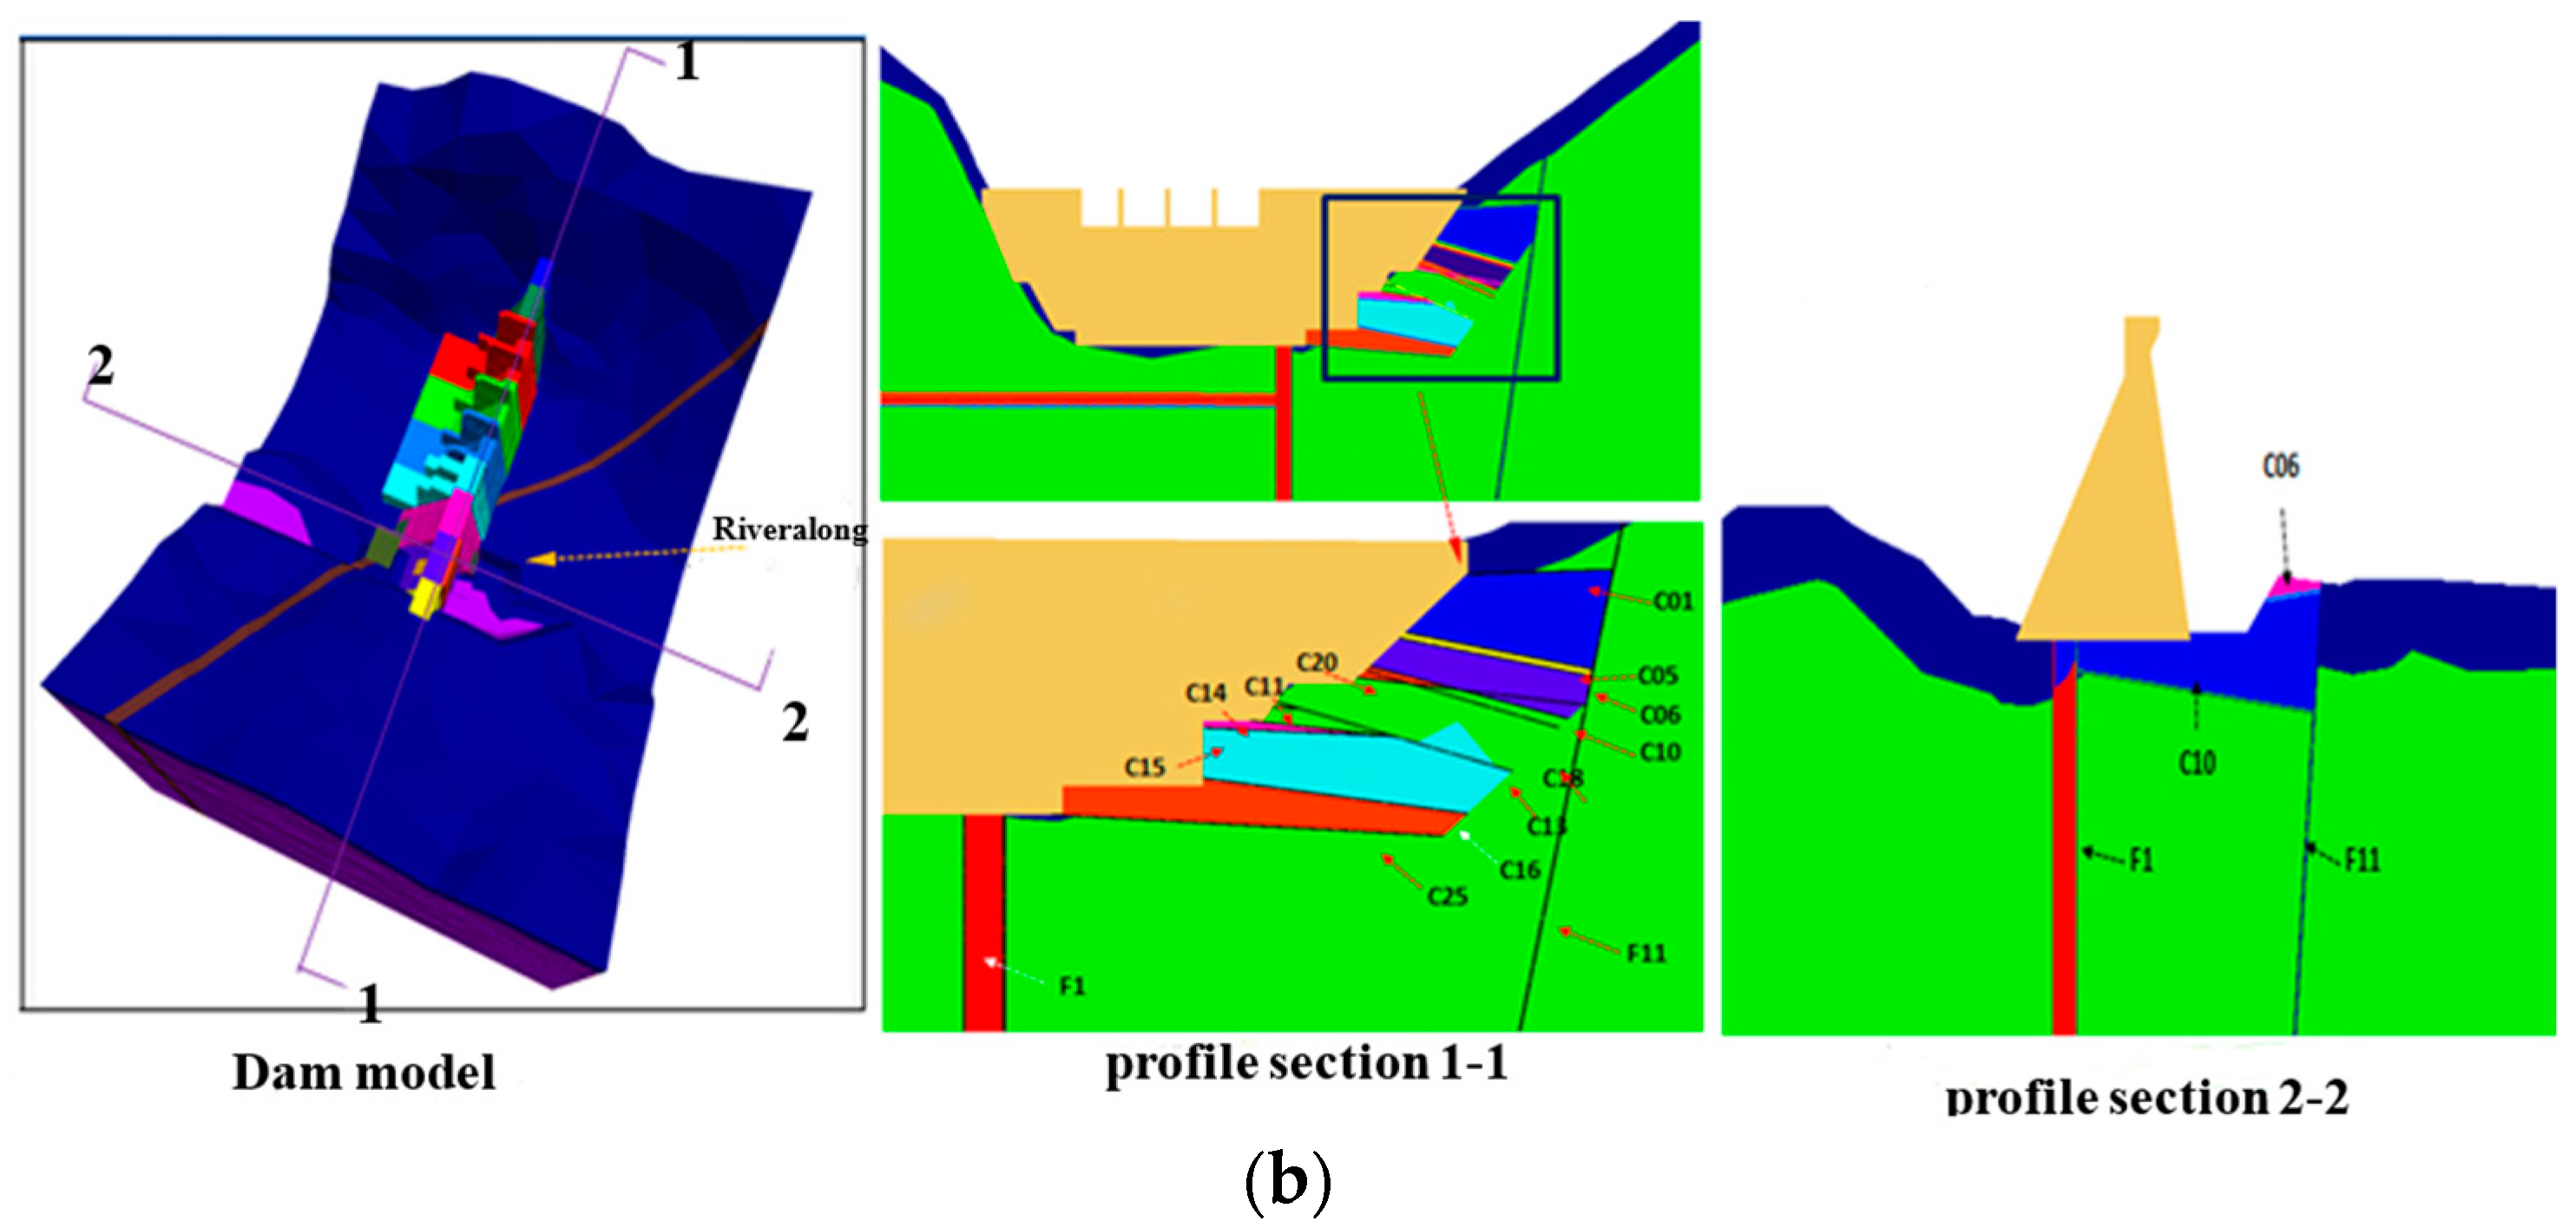
A dam model was built using the discrete element method, as shown in Figure 3a, a Mohr-Coulomb constitutive model was adopted for the rock mass, and the structural plane was constructed using a Coulomb-slip constitutive model. The Capulin San Pablo hydropower station dam foundation is perpendicular to the river cross section (1-1 section) and the river cross section (2-2 section), as shown in Figure 3b. The main structural plane of the dam foundation and the segregation characteristics between the dam sections are shown in Figure 4. The model of the structural stability of the dam sections 1–3 is simulated in detail based on the developed structural plane of dam sections 1–3 by taking into account rock classes III1B, III 2B, IV2c, and V with other rock layers and structural faces C01, C05, C06, C10, and C18 with other structural effects. The monitoring points on the upper and lower dam and on both sides of the UG7 upper and lower disc layouts are shown in Figure 5.
3.2. Hydraulic-Mechanical Coupling Calculation
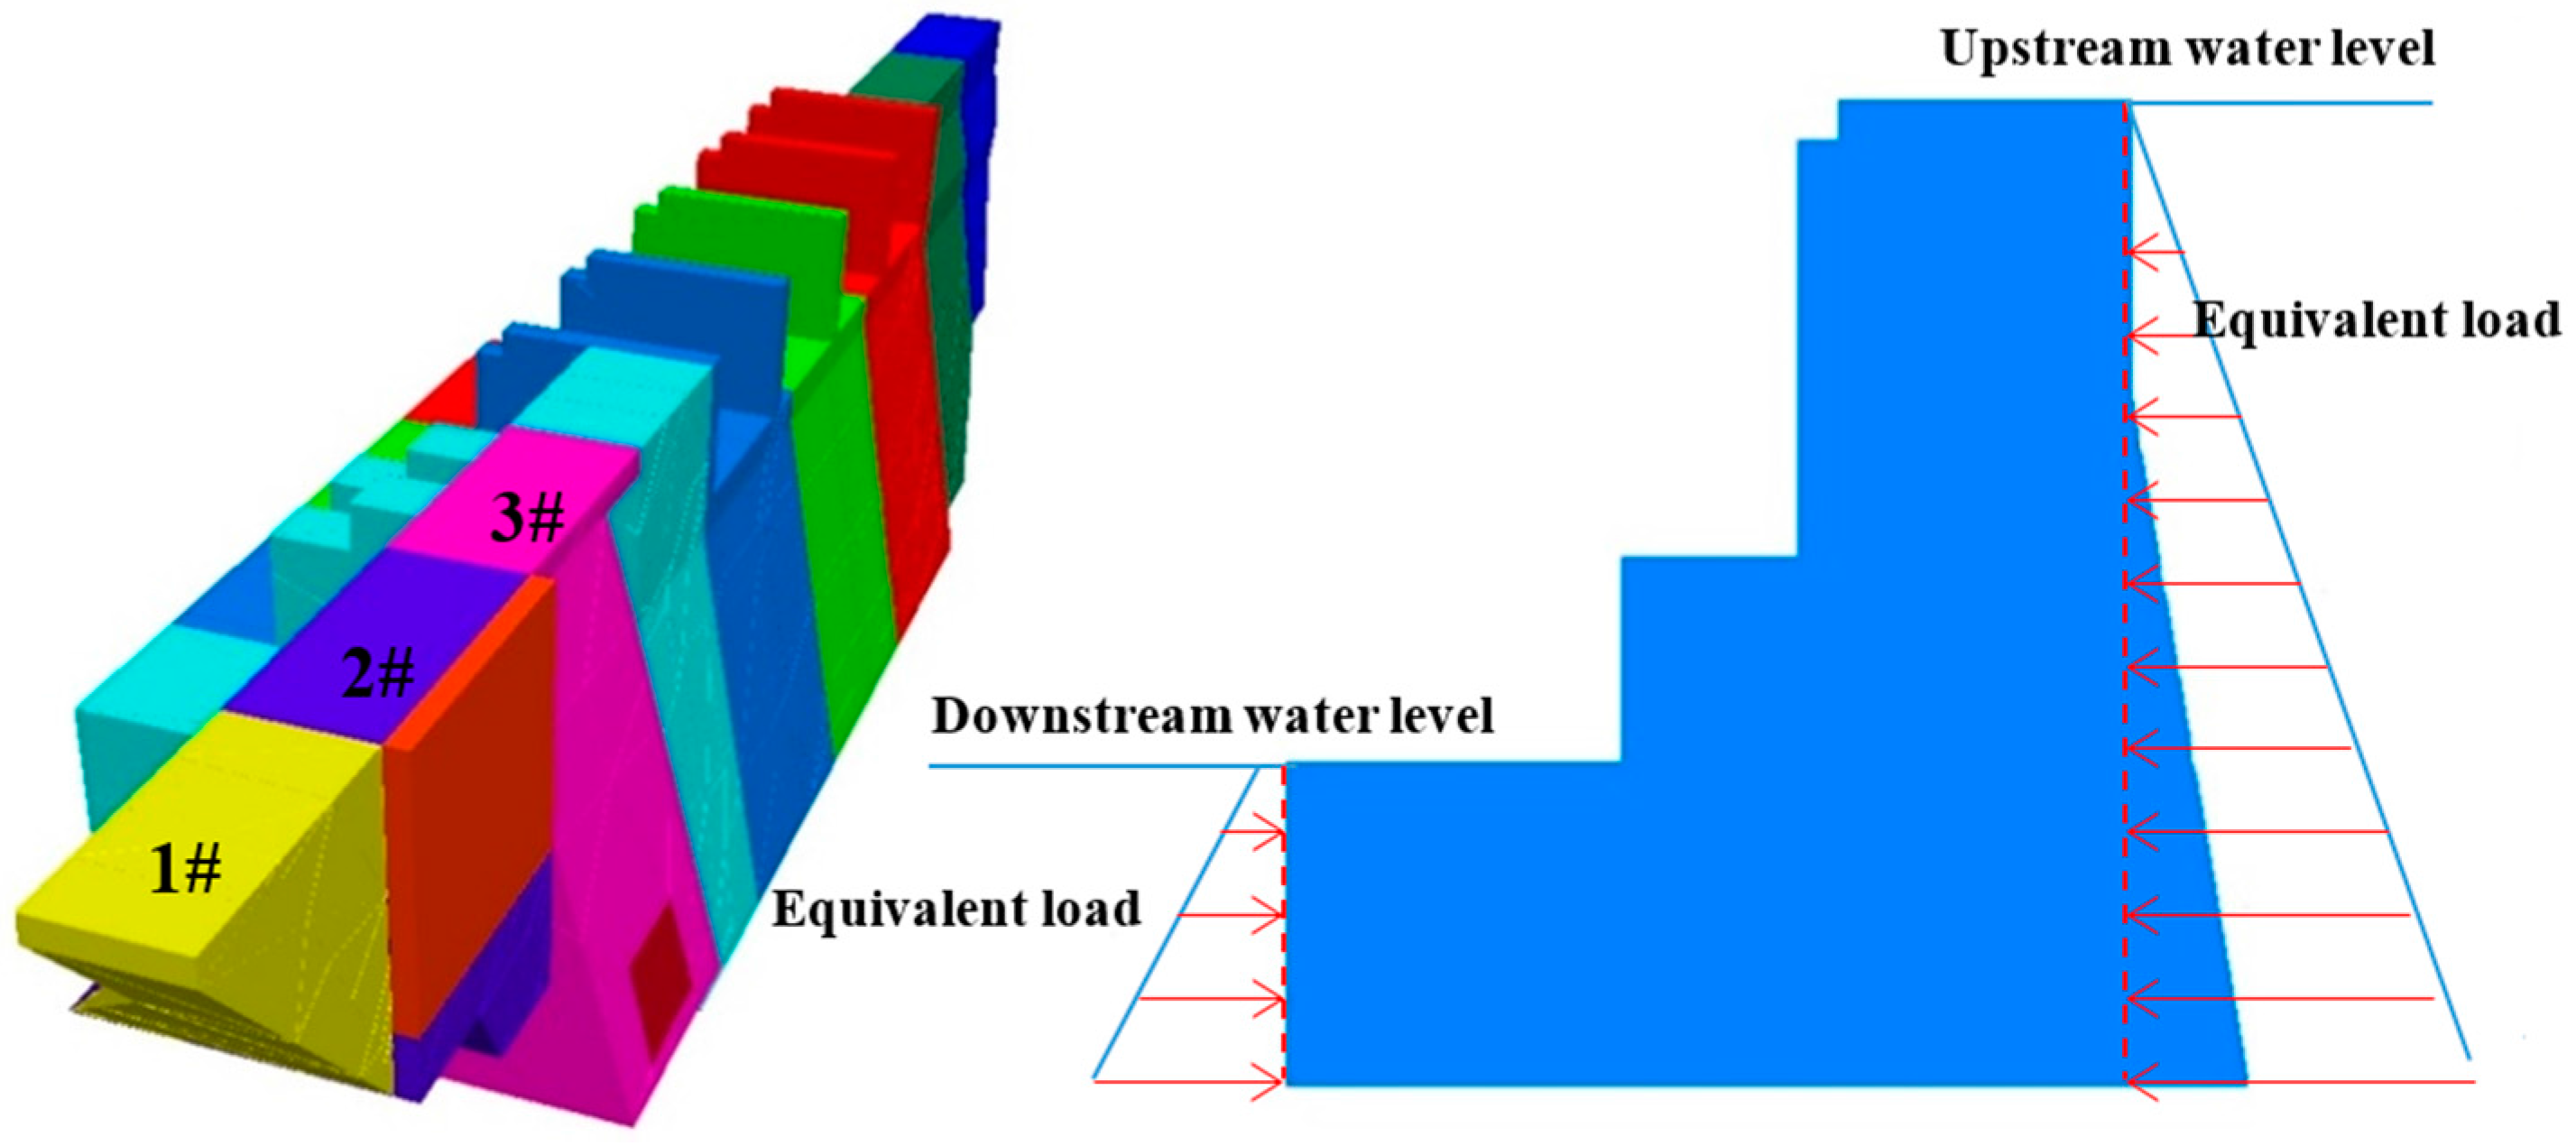
After the preparation of initial material parameters, the mechanical, structural parameters of aimed research object, and the required fluid material parameters (including density, cohesion, bulk modulus, and joint hydraulic parameters, and the in situ stress and pore pressure), the model boundary pore pressure and pore pressure gradient were set as shown in Figure 6, namely P = ρgh.
For the mechanical calculation, the model was calculated to equilibrium considering the weight and the water level force of the upstream and downstream dams (the surface force distribution is shown in Figure 6). For hydraulic calculations, the fracture seepage analysis of the dam foundation was carried out considering the influence of grouting. The fissure water pressure of the structural planes under the working condition of flood level was then obtained. The calculation proceeded until the model reached the equilibrium state, during which time the fracture surface water pressure on the structure remained at a fixed value.
Then, the parameters of the dam and bedrock structural plane was reduced to obtain the safety factor under different working condition. The normal stress of the structural plane is considered in the model. The displacement of the monitoring points during the reduction process is recorded, and the safety factor of the dam is expressed according to the corresponding strength reduction coefficient when the displacement is suddenly changed.
3.3. Numerical Results Analysis about Dam Deformation
In flood level conditions, the monitoring point (dam body and points A and B of UG7) deformation curve with the strength reduction coefficient of the relationship is shown in Figure 7. Deformation characteristics shown in the figure indicate that the dam body and bedrock remain stable when the strength reduction factor is 2.80. However, the deformation of the monitoring point of the rock mass and the structural plane have dramatic changes when the strength reduction coefficient is 3.00. Therefore, it can be ascertained that the overall safety factor of the dam foundation is 3.00. It can also be seen from the calculation results that the deformation characteristics of monitoring points A and B in UG7 are basically consistent with the deformation characteristics of the dam monitoring points. The displacement distribution characteristics of the dam deformation under different strength reduction factors are shown in Figure 8a. It can be seen from the figure that, when the strength reduction coefficient is 2.00, 2.80, and 3.00, the deformations of the entire dam are in ranges 10–20, 50–60, and 90–105 mm, respectively.
With an increasing reduction coefficient, the deformation characteristics of the rock mass near the top of dam sections 4–7 and UG7 first appear with the deformation’s continuous expansion. The deformation of the entire dam foundation tends to be destroyed and destabilized from the lower level. It not only can be concluded that the shear failure is most likely to occur in dam sections 4–7 due to the influence of the UG7 clay tuff weak rock strata, but also that section 3 of the dam is easy to slide along the joint between sections 2 and 3.The dam foundation deformation and 1-1 dam base profile deformation distribution are shown in Figure 8b when strength reduction coefficient is 3.0.
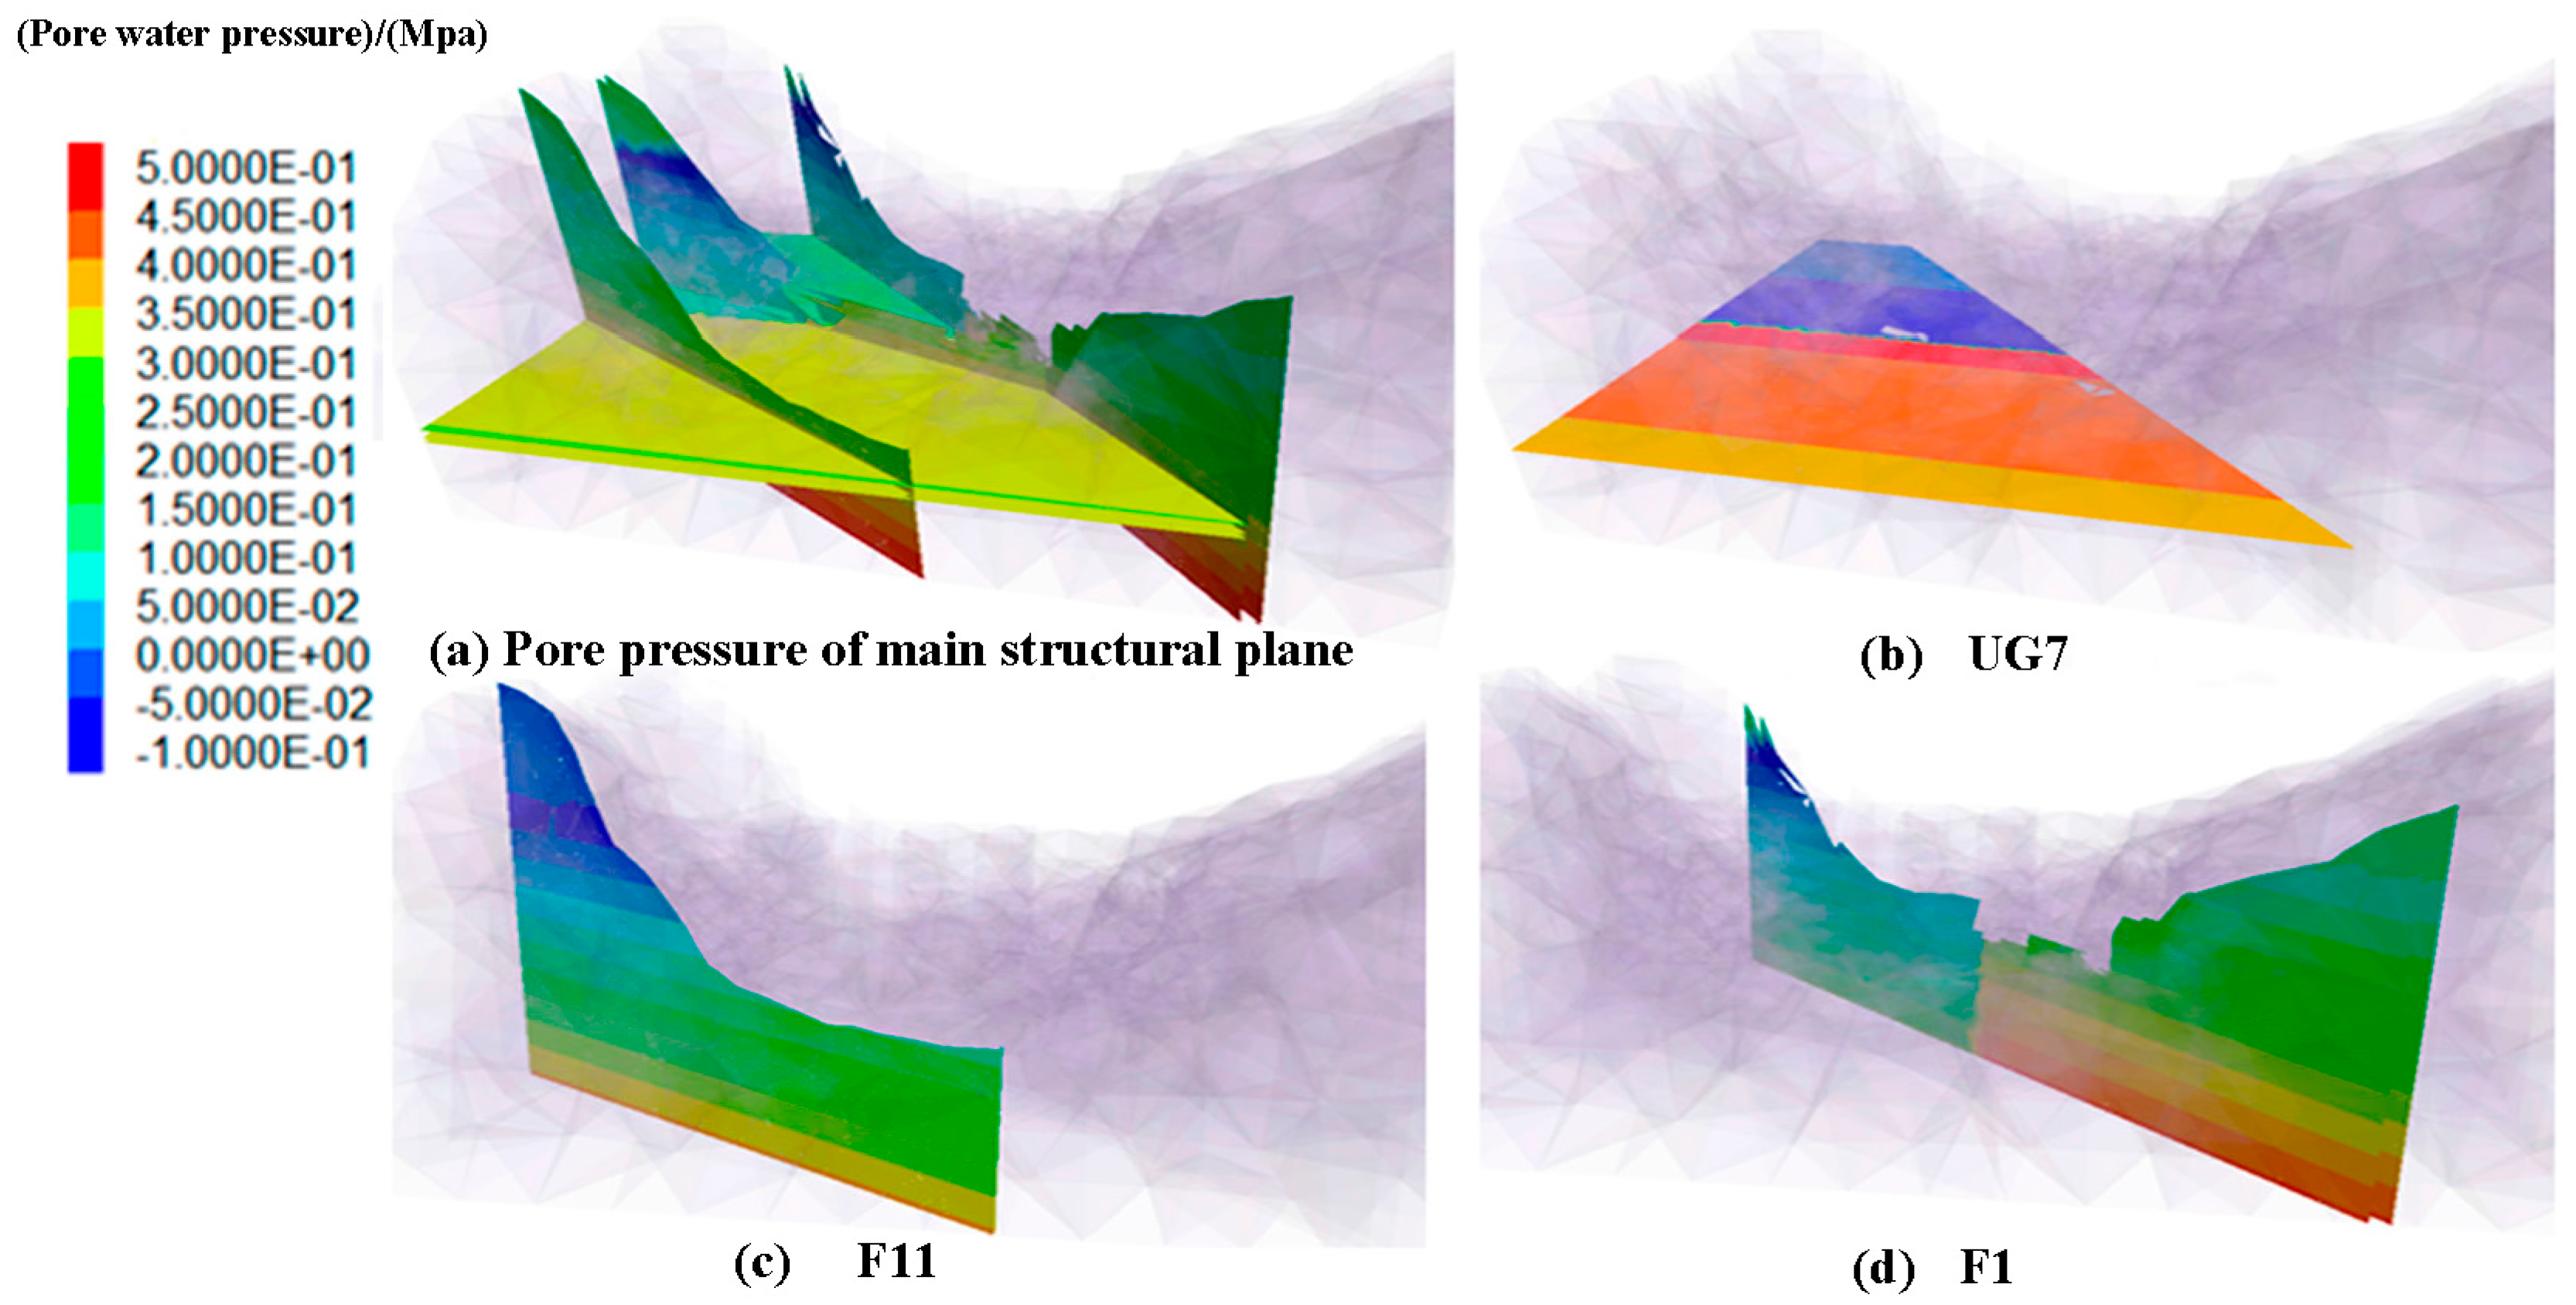
The distribution of water pressure on the main structural surface under flood conditions is shown in Figure 9. Under the given seepage boundary condition, the distribution of fissure pressure in all structural planes is obtained after seepage calculation. The water head of the upstream side is higher and the fissure water pressure is 0.588 MPa.
4. Discussion
The Chinese standard entitled “Design Code for Concrete Gravity Dam [27]” stipulates that the safety factor needs to exceed 3.0 under basic load combination conditions when the strength of the rock mass and the structural plane is evaluated by the shear strength. In other countries, the design of anti-sliding stability of dam foundation is mainly referred to in Reclamation Bureau Report No. REC-ERC-74-10 [28]. This report states that the safety factor for normal load should be greater than 4.0, that the accident load should be greater than 2.7, and that the extreme load combination should be greater than 1.3.
Under flood conditions, the safety factor of the deep anti-sliding stability of the Capulin San Pablo dam basically meets the Chinese standard, but it does not meet the U. S. Bureau of Reclamation standard due to the fact that the security margin is very small. It is necessary to adopt more reliable measures, such as local replacement treatment, to increase the overall anti-sliding stability of the dam in order to meet the design standards in consideration of UG7, which is the most important factor affecting the stability of the dam foundation. In addition, the increase in uplift pressure of the dam foundation is caused by the increase of fissure water pressure in the structural plane, which is the main factor affecting the stability of the dam foundation, and certain grouting measures may be considered to deal with it.
The traditional method of slope stability analysis is the limit analysis and the limit equilibrium method. The limit analysis method is based on the upper- and lower-bound theorems for the development of plasticity theory (Davis and Selvadurai, 2002) [29]. These theorems strictly limit the failure condition to a fully plastic material, and obeys the associated flow criteria, and a conservative estimate is thus given when calculating the safety factor. The limit equilibrium method needs to assume the shape and position of the slip surface. Although the limit equilibrium method adopts the upper-bound criterion of limit analysis, it is difficult to obtain the sliding surface of the rock and stable safety factor due to the fact that the upper-bound criterion’s accuracy requirements are not satisfied. In the hybrid model, the discrete network model and the continuous medium model are used to simulate primary and secondary fracture, respectively. This model comes closer to simulating the real rock mass by combining the strengths of the two models. There is no doubt that the hybrid model is closer to reality under the condition of understanding the distribution of rock fissures. Wei and Hudson (1993–1998) [30] established the hybrid model according to the discrete element and finite element methods in the near and far fields. Furthermore, they simulated the coupling behavior of the fractured rock mass, and the model is validated in the hydraulic-mechanical coupling analysis of the gravity dam foundation. However, further research is needed because of the difficulty of model building and the small sample size.
For the stability analysis of rock mass controlled by structural plane under hydraulic-mechanical interaction, the strength reduction method based on DEM in analysis of complex rock mass seepage is optimized as follows:
- (a)
- The discrete element method can fully reflect the deformation character caused by the difference between dam foundation rock parameters and structural plane parameters, which may affect the safety factor of local dam sections.
- (b)
- The strength reduction method in combination with the hydraulic-mechanical analysis produces an efficient solution that can express the continuous motion in the model, even in an unstable system.
- (c)
- The strength reduction method, based on the discrete element method, can automatically search for the minimum safety factor and the corresponding failure modes under the actual combination of structural planes, which is closer to a real-world situation.
A discrete fracture network can accurately reflect the seepage performance of a rock mass under the coupling of hydraulic-mechanical in fractured rock mass. However, when confronted with a large number of stochastic structures, the complicated process is difficult to evaluate. In this paper, it was assumed that the rock mass medium is impermeable and all of the fluid flows in the main control structure are suitable for the seepage model of the Capulin San Pablo dam. It is necessary to determine whether the hypothesis is satisfied if this method is used for stability analysis of other research objects.
The analysis of the stability of the dam based on the seepage of the fracture and using the strength reduction method can better and more comprehensively consider various factors. The safety factor of the dam obtained can be used to evaluate the anti-sliding stability of the dam and the stability analysis of the dam foundation slope. It can also provide the numerical simulation basis for effective and reasonable seepage control measures aimed at the weak parts of dam foundations.
5. Conclusions
A three-dimensional dam body model was built to reflect the dam shape and structures in dam and rock mass with discrete element software, designated the 3DEC model. The characteristics and applicable conditions of different seepage models were studied, and the safety factor of the dam was obtained using the strength reduction method. Finally, the stability of the dam foundation under seepage conditions was discussed. Several conclusions were reached, as follows:
- (a)
- The modified cubic law considered the tortuosity and roughness of the fracture that improves fracture network models, which provided an approach for accurately calculating hydraulic properties and made the analysis method of fractured rock mass more applicable.
- (b)
- The discrete element method was used to analyze the hydraulic-mechanical coupling problem in a fractured rock mass, and it was deemed suitable for analyzing such a problem. The results of analysis were more reasonable and were found to be closer to the actual problems in a fractured rock mass.
- (c)
- The strength reduction method based on the discrete element method has the advantage that it can be used to analyze the stability of the complex dam-foundation system. It can automatically search for the minimum safety factor and the failure mode under the condition of a combination of structural planes. This method can produce results more in line with the true state of dam foundation damage and is also suitable for the analysis of hydraulic-mechanical intersection failure under the action of a complex fractured system.
Acknowledgments
This work was supported by The National Basic Research Program of China (973 Program) (Grant No. 2015CB057903), the National Natural Science Foundation of China (Grant No. 51679071 and Grant No. 51309089), the Fundamental Research Funds for the Central Universities (Grant No. 2017B20614).
Author Contributions
Chong Shi (conception and design of this study), Weijiang Chu, Junliang Shen and Wenkun Yang, (Data collection, model building, model calculation and analysis), Wenkun Yang and Yang Kong (draft the first the paper came out with the manuscript). All authors reviewed the manuscript.
Conflicts of Interest
The authors declare no conflict of interest.
References
- Jing, L. A review of techniques, advances and outstanding issues in numerical modelling for rock mechanics and rock engineering. Int. J. Rock Mech. Min Sci. 2003, 40, 283–353. [Google Scholar] [CrossRef]
- He, J.; Chen, S.H.; Shahrour, I. Back Analysis of Equivalent Permeability Tensor for Fractured Rock Masses from Packer Tests. Rock Mech. Rock Eng. 2011, 44, 491. [Google Scholar] [CrossRef]
- Cundall, P.A. A computer model for simulating progressive large scale movements in blocky rock systems. Int. Soc. Rock Mech. 1971, 2, 129–136. [Google Scholar]
- Shi, G.H. Discontinuous Deformation Analysis—A New Model for the Statics and Dynamics of Block Systems. Ph.D. Thesis, University of California, Berkeley, CA, USA, 1988. [Google Scholar]
- Shi, G.H. Block System Modeling by Discontinuous Deformation Analysis; Computation Mechanics Publications: Southampton, UK, 1993. [Google Scholar]
- Munjiza, A.; Owen, D.R.J.; Bicanic, N. A. combined finite-discrete element method in transient dynamics of fracturing solids. Eng. Comput. 1995, 12, 145–174. [Google Scholar] [CrossRef]
- Rougier, E.; Bradley, C.R.; Broom, S.T. The Combined Finite-Discrete Element Method applied to the Study of Rock Fracturing Behavior in 3D. Proceeding of the Conference 45th US Rock Mechanics/Geomechanics Symposium, San Francisco, CA, USA, 26–29 June 2011. [Google Scholar]
- Lorig, L.J.; Hart, R.D.; Cundall, P.A. Slope Stability Analysis of Jointed Rock Using Distinct Element Method. Transp. Res. Rec. 1991, 1330, 1–9. [Google Scholar]
- Lorig, L.J.; Cundall, P.A.; Damjanac, B. A Three-Dimensional Model for Rock Slopes Based on Micromechanics. Proceeding of the 44th U.S. Rock Mechanics Symposium and 5th U.S.-Canada Rock Mechanics Symposium, Salt Lake City, UT, USA, 27–30 June 2010. [Google Scholar]
- Javadi, M.; Sharifzadeh, M.; Shahriar, K. A new geometrical model for non-linear fluid flow through rough fractures. J. Hydrol. 2010, 389, 18–30. [Google Scholar] [CrossRef]
- Parashar, R.; Reeves, D.M. On iterative techniques for computing flow in large two-dimensional discrete fracture networks. J. Comput. Appl. Math. 2012, 236, 4712–4724. [Google Scholar] [CrossRef]
- Zheng, J.; Deng, J.; Zhang, G. Validation of Monte Carlo simulation for discontinuity locations in space. Comput. Geotech. 2015, 67, 103–109. [Google Scholar] [CrossRef]
- Leung, C.T.; Zimmerman, R.W. Estimating the hydraulic conductivity of two-dimensional fracture networks. Transp. Porous Media 2012, 93, 777–797. [Google Scholar] [CrossRef]
- Liu, R.; Jiang, Y.; Li, B.; Wang, X. A fractal model for characterizing fluid flow in fractured rock masses based on randomly distributed rock fracture networks. Comput. Geotech. 2015, 65, 45–55. [Google Scholar] [CrossRef]
- Zafarani, A.; Detwiler, R.L. Solute Transport in Three-Dimensional Variable-Aperture Discrete Fracture Networks. AGU Fall Meet. Abstr. 2012, 1, 4. [Google Scholar]
- Guo, L.; Li, X.; Zhou, Y.; Zhang, Y. Generation and verification of three-dimensional network of fractured rock masses stochastic discontinuities based on digitalization. Environ. Earth Sci. 2015, 73, 7075–7088. [Google Scholar] [CrossRef]
- He, G.; Wang, E.; Liu, X. Modified governing equation and numerical simulation of seepage flow in a single fracture with three-dimensional roughness. Arab. J. Geosci. 2016, 9, 1–20. [Google Scholar] [CrossRef]
- Tsang, Y.W.; Tsang, C.F. Channel model of flow through fractured media. Water Resour. Res. 1987, 23, 467–479. [Google Scholar] [CrossRef]
- Gudmundsson, A. Fracture dimensions, displacements and fluid transport. J. Struct. Geol. 2000, 22, 1221–1231. [Google Scholar] [CrossRef]
- Tsang, Y.W.; Witherspoon, P.A. The dependence of fracture mechanical and fluid flow properties on fracture roughness and sample size. J. Geophys. Res. 1983, 88, 2359–2366. [Google Scholar] [CrossRef]
- Barton, N.; Bandis, S.; Bakhtar, K. Strength deformationed conductivity coupling of rock joints. Int. J. Rock Mech. Min. Sci. Geomech. Abstr. 1985, 22, 121–140. [Google Scholar] [CrossRef]
- Rutqvist, J. Determination of hydraulic normal stiffness of fractures in hard rock from well testing. Int. J. Rock Mech. Min. Sci. Geomech. Abstr. 1995, 32, 513–523. [Google Scholar] [CrossRef]
- Detournay, E. Hydraulic Conductivity of Closed Rock Fracture: An Experimental and Analytical Study. In Proceedings of the 13th Canadian Rock Mechanics Symposium, Toronto, Canada, 28–29 May 1980; pp. 168–173. [Google Scholar]
- Alvarez, T.A.; Cording, E.J.; Mikhail, A. Hydromechanical Behavior of Rock Joints: A Re-interpretation of Published Experiments. In Proceedings of the 35th U.S. Symposium, University of Nevada, Reno, NV, USA, 5–7 June 1995; pp. 665–671. [Google Scholar]
- Cappaa, F.; Guglielmi, Y. Hydromechanical interactions in a fractured carbonate reservoir inferred from hydraulic and mechanical measurements. Int. J. Rock Mech. Min. Sci. 2005, 42, 287–306. [Google Scholar] [CrossRef]
- Dawson, E.M.; Roth, W.H. Slope stability analysis by strength reduction. Geotechnique 1999, 49, 835–840. [Google Scholar] [CrossRef]
- NB/T 35026-2014. Design Code for Concrete Gravity Dam; Beijing China Electric Power Press: Beijing, China, 2014. [Google Scholar]
- Brandon, J.R. U S Bureau of Reclamation Report REC-ERC-74-10; Engineering and Research Center, U S Bureau of Reclamation: Denver, CO, USA, 1974.
- Davis, R.O.; Selvadurai, A.P.S. Plasticity and Geomechanics; Cambridge University Press: Cambridge, UK, 2002; Volume 48, pp. 149–151. [Google Scholar]
- Wei, L.; Hudson, J.A. A hybrid discrete-continuum approach to model hydro-mechanical behaviour of jointed rocks. Eng. Geol. 1998, 49, 317–325. [Google Scholar] [CrossRef]
Figure 1.
In situ verification test of fracture seepage (a) Seepage-stress coupling test site (France); (b) 3DEC simulation results
Figure 1.
In situ verification test of fracture seepage (a) Seepage-stress coupling test site (France); (b) 3DEC simulation results

Figure 2.
The solution process of safety factor in hydraulic-mechanical coupling with strength reduction method in the discrete-element method (DEM). n, the number of mechanical step per each fluid step and the number of fluid step per each mechanical step can be set by the users. R, the unbalanced force ratio (10−5 by default): The ratio of unbalanced force to the mean absolute value of force exerted by each surrounding zone, the unbalanced force is the net force acting on a grid point. Nr, characteristic response time, a representative number of steps (maximum limit of 50,000) that characterizes the response time of the system.

Figure 3.
(a) Three-dimensional (3D) model of dam at Capulin San Pablo power station (b) Model profile of the Capulin San Pablo dam.
Figure 3.
(a) Three-dimensional (3D) model of dam at Capulin San Pablo power station (b) Model profile of the Capulin San Pablo dam.


Figure 4.
Concrete-rock interface and the seams between Capulin San Pablo dam sections.
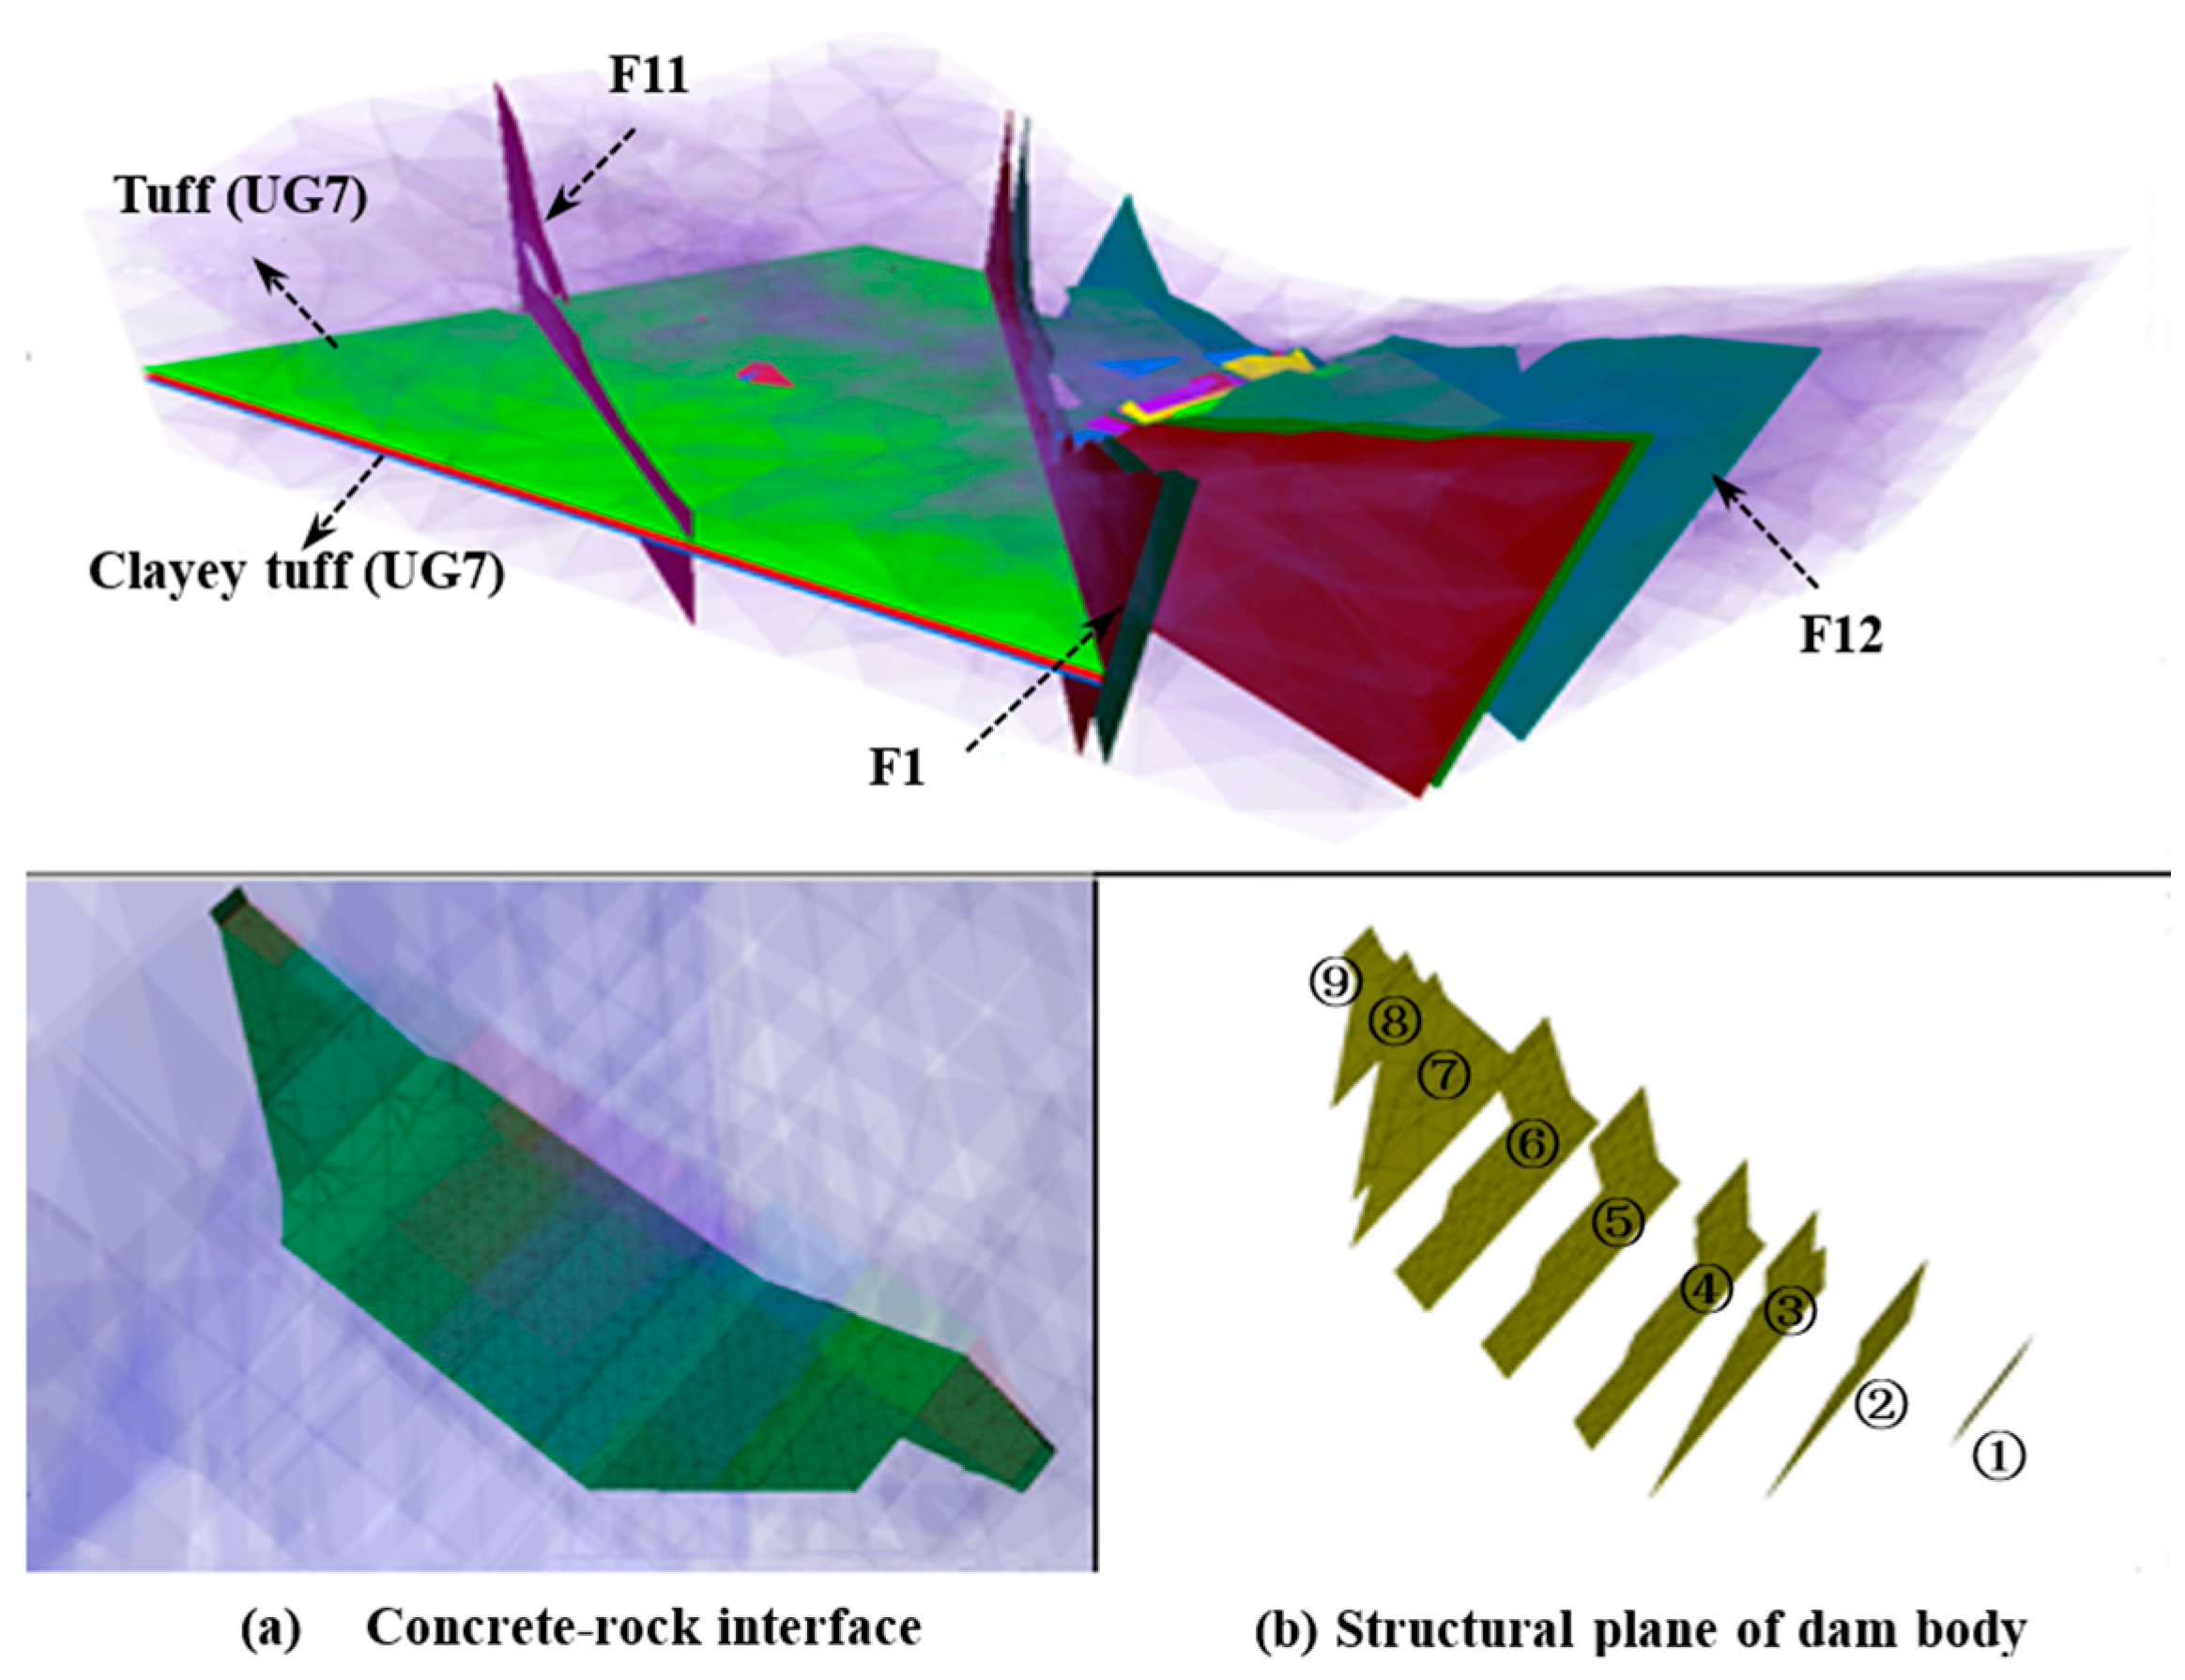
Figure 5.
Layout diagrams of upstream and downstream Capulin San Pablo dam sites and monitoring points A and B.
Figure 5.
Layout diagrams of upstream and downstream Capulin San Pablo dam sites and monitoring points A and B.
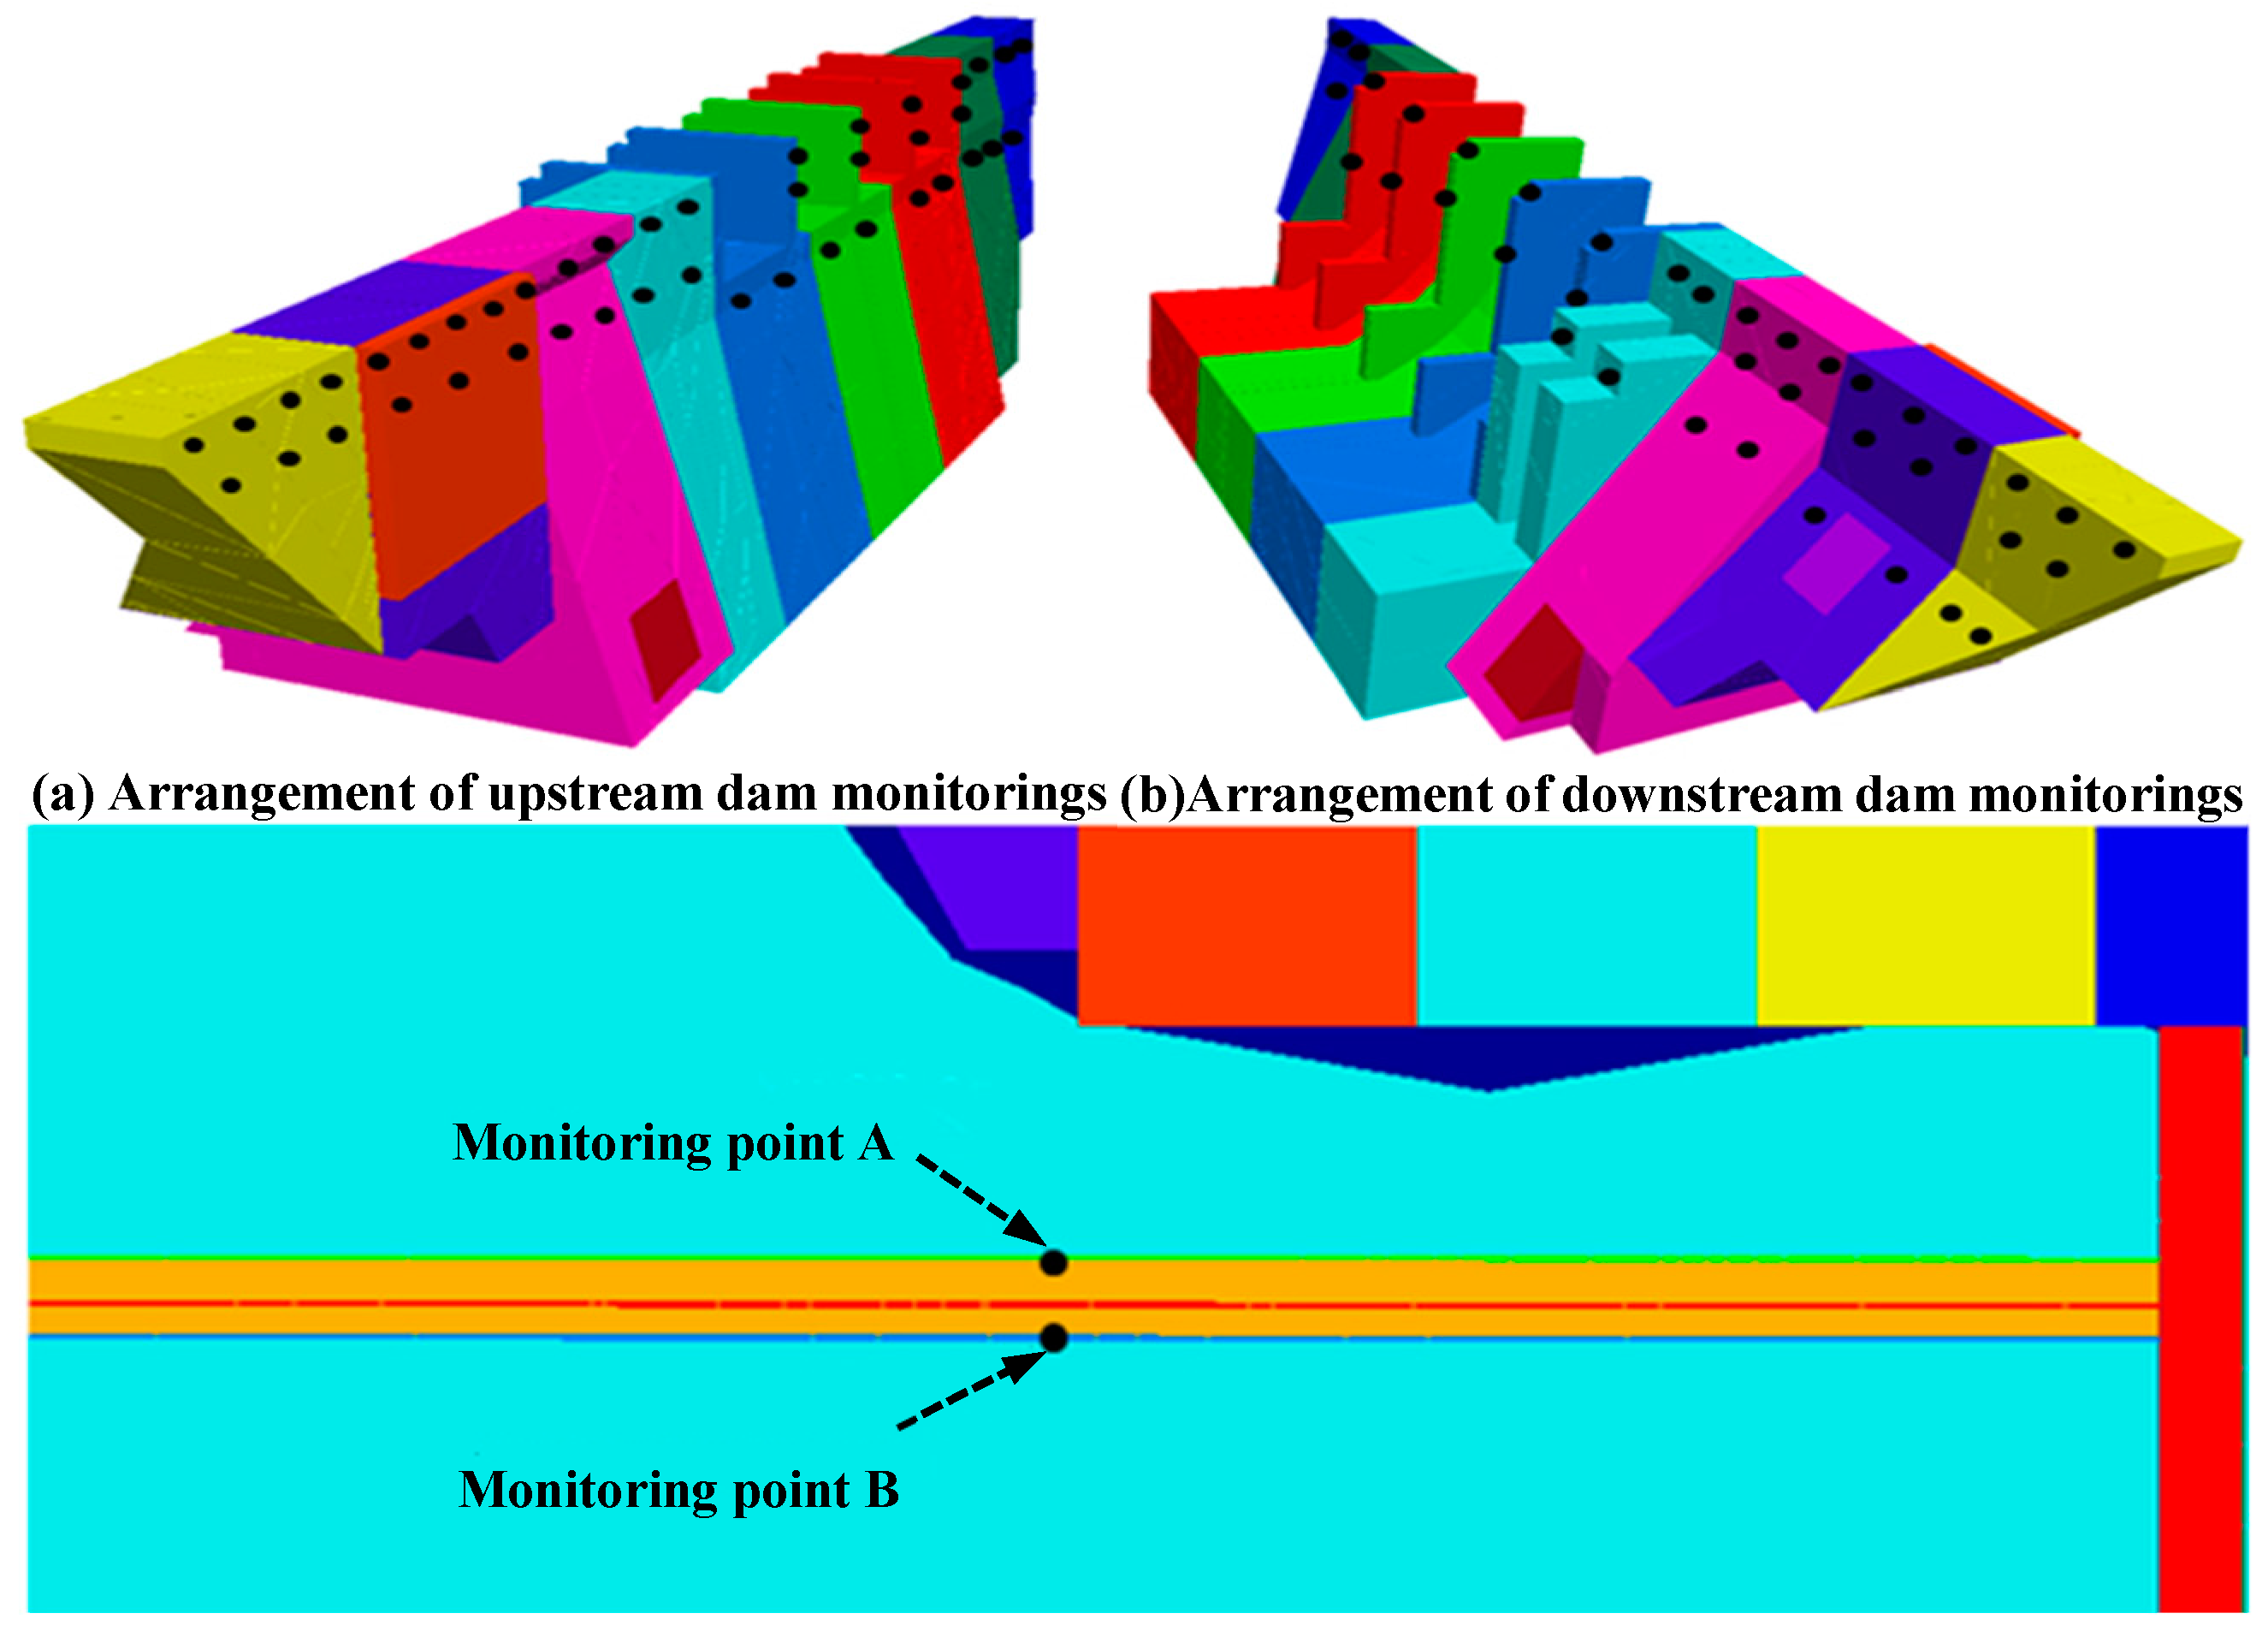
Figure 6.
Schematic of the hydrostatic pressure on the upstream and downstream Capulin San Pablo dams.
Figure 6.
Schematic of the hydrostatic pressure on the upstream and downstream Capulin San Pablo dams.

Figure 7.
(a) Deformation curve of dam monitoring points (Examples monitoring points in Figure 5a); (b) Deformation curve of dam monitoring point A, B (UG7).
Figure 7.
(a) Deformation curve of dam monitoring points (Examples monitoring points in Figure 5a); (b) Deformation curve of dam monitoring point A, B (UG7).
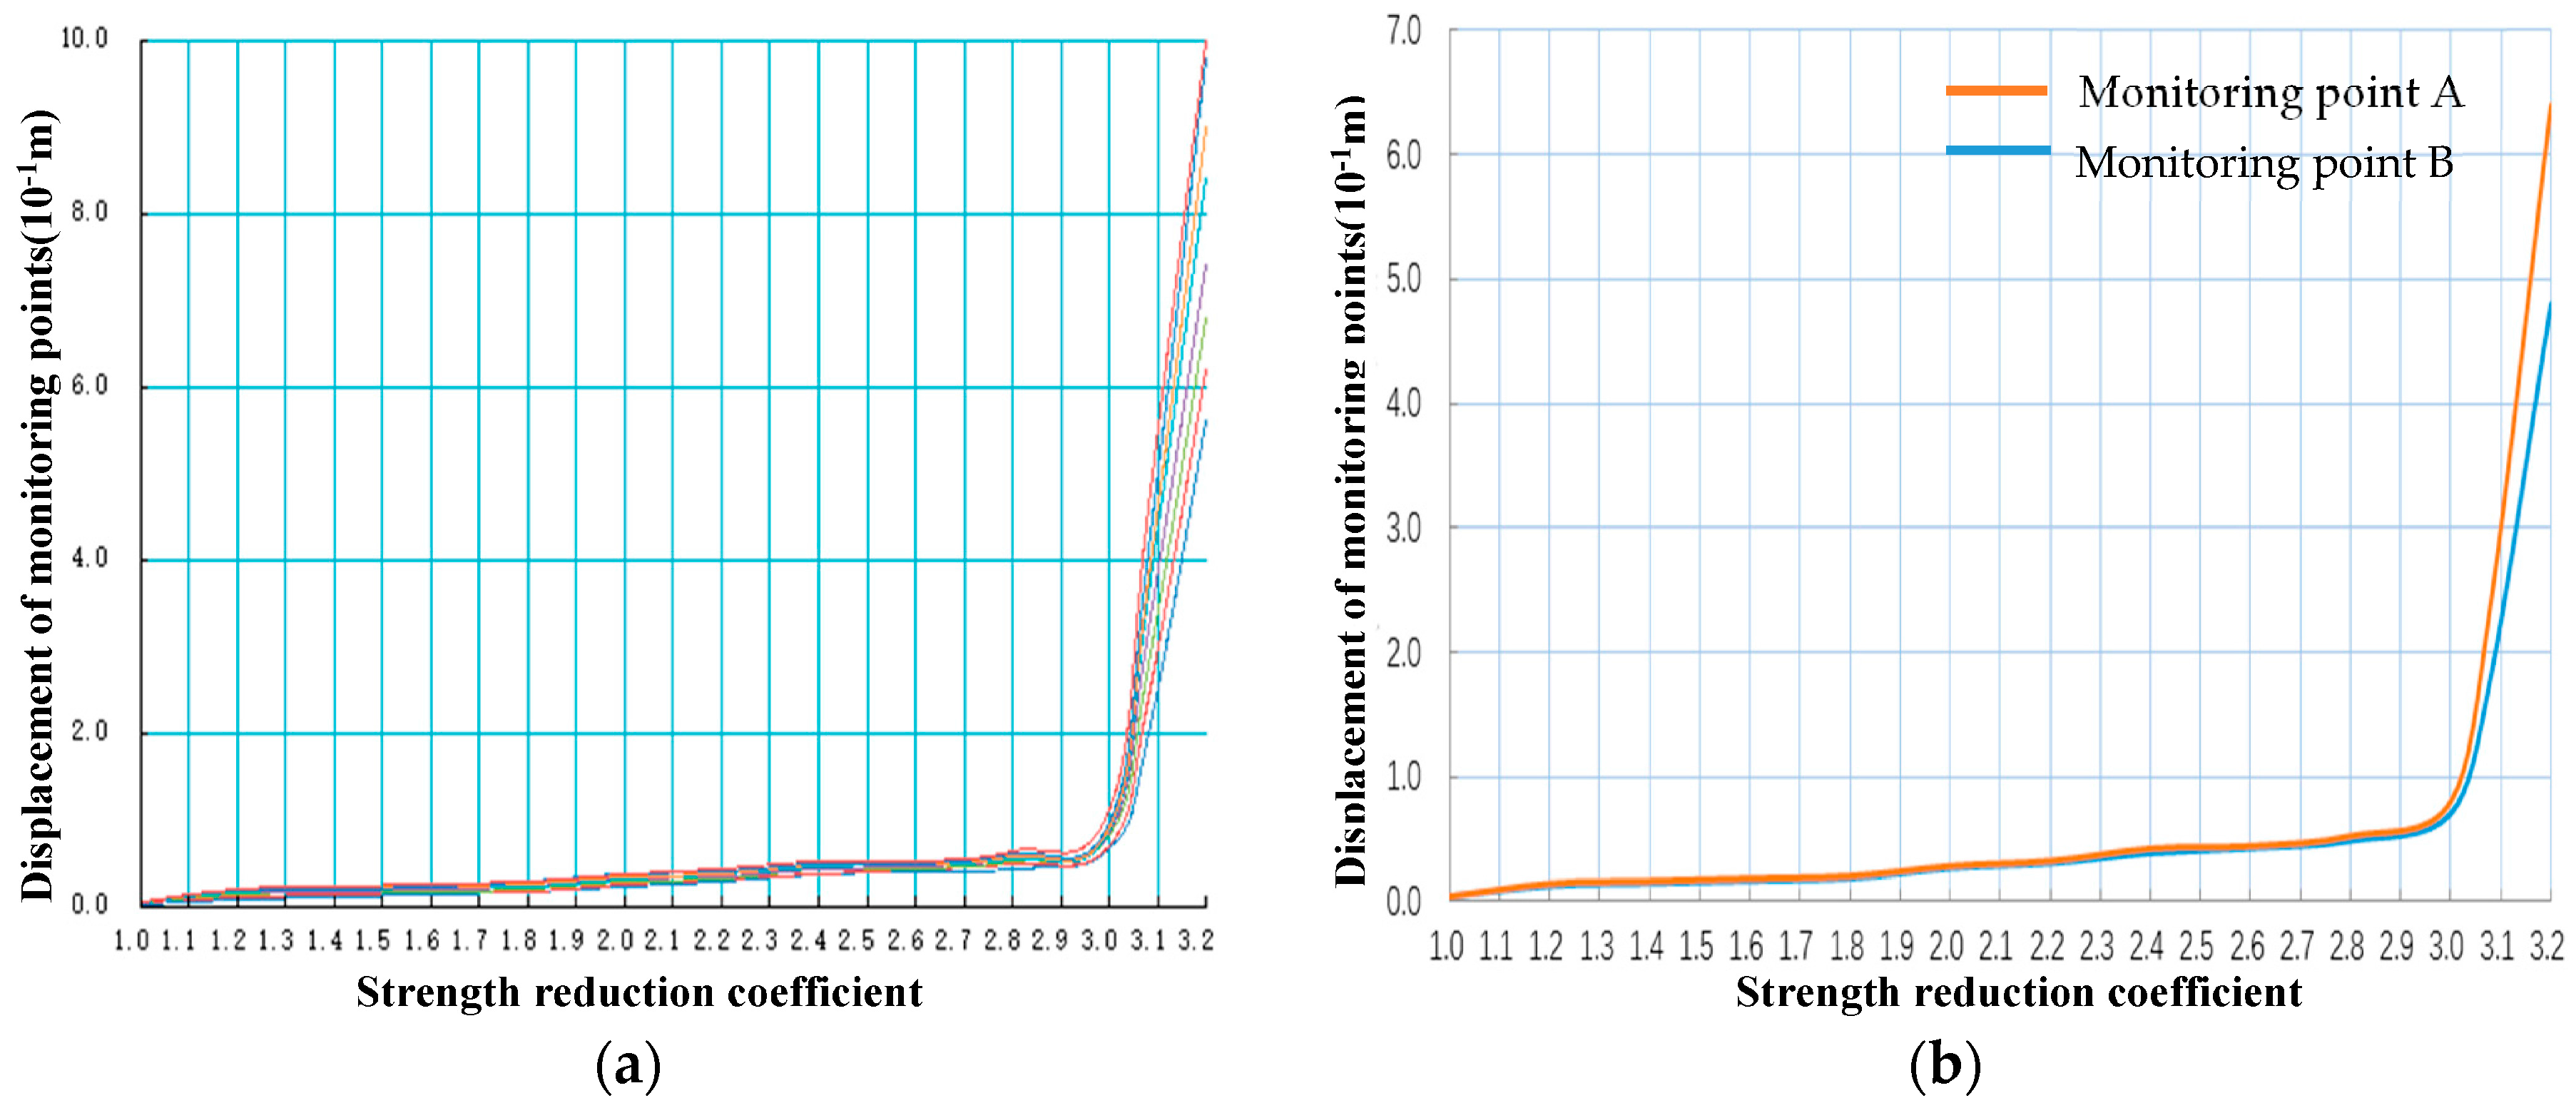
Figure 8.
(a) Distribution characteristics of deformation of dam body with displacement during flood stage (b) Deformation distribution of dam foundation and section 1-1 (strength reduction is 3.00).
Figure 8.
(a) Distribution characteristics of deformation of dam body with displacement during flood stage (b) Deformation distribution of dam foundation and section 1-1 (strength reduction is 3.00).
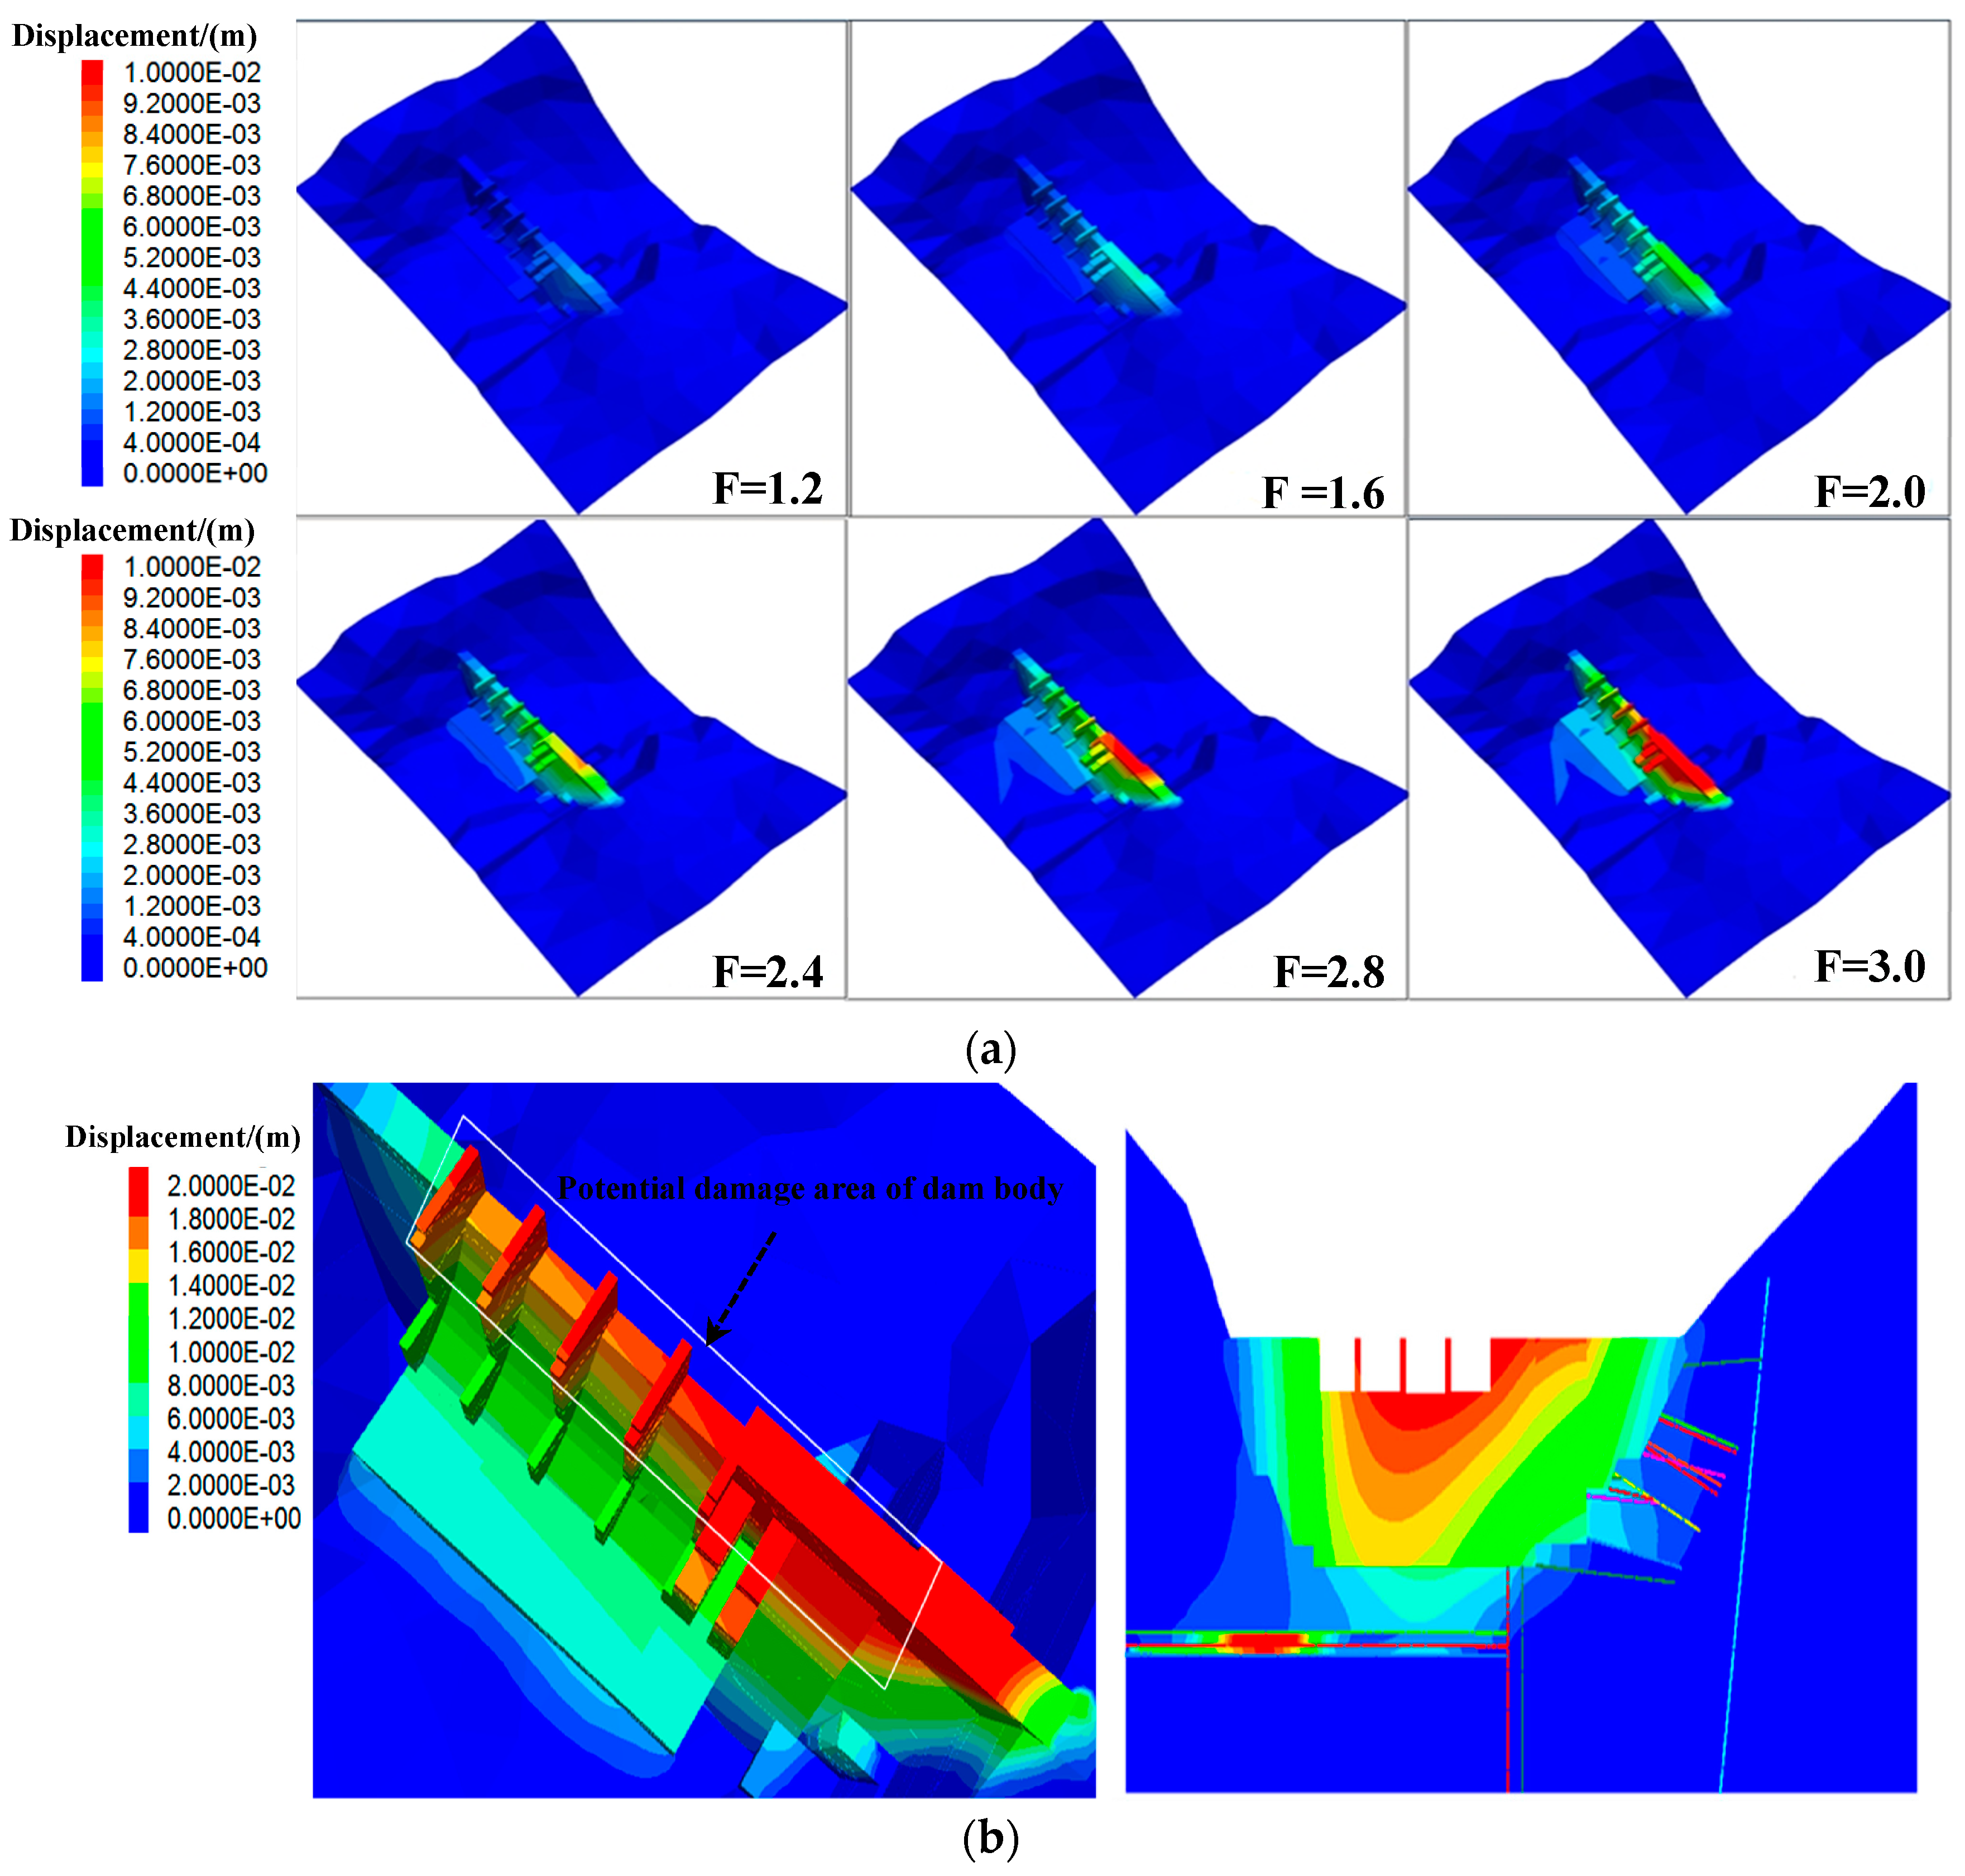
Figure 9.
Flood water pressure on the main structural surface of the dam foundation in flood water condition.
Figure 9.
Flood water pressure on the main structural surface of the dam foundation in flood water condition.

Table 1.
Hydraulic and mechanical properties of the main discontinuities in French Alps test area [25].
Table 1.
Hydraulic and mechanical properties of the main discontinuities in French Alps test area [25].
| Measuring Point | Discontinuous Types | Hydraulic Parameters | Mechanical Parameters | |||
|---|---|---|---|---|---|---|
| Hydraulic Conductivity/(m·s−1) | Storativity | Measured Hydraulic Aperture/(m) | Initial Normal Stiffness/(GPa·m−1) | Initial Normal Stress/(Pa) | ||
| 1 | Fault F2 | 5.7 × 10⁻⁵ | 0.7 × 10⁻⁸ | 2.6 × 10⁻⁴ | 132 | 1.99 × 10⁵ |
| 2 | Fault F12 | - | - | - | 66 | 5.79 × 10⁴ |
| 3 | Bedding plane S2 | - | - | - | 20 | - |
| 4 | Fault F11 | 2.3 × 10⁻⁴ | 2..6 × 10−8 | 5.3 × 10⁻⁴ | 1.4 | 5.1 × 10⁴ |
| 5 | Fault F11 | 1.9 × 10⁻⁴ | 1.9 × 10⁻⁸ | 4.8 × 10⁻⁴ | 7.2 | 1.58 × 10⁵ |
| 6 | Bedding plane S2 | 7.6 × 10⁻⁶ | 3.4 × 10⁻¹¹ | 9.6 × 10⁻⁵ | 20 | - |
| 8 | Bedding plane S2 | 3..8 × 10−6 | 2.1 × 10⁻¹¹ | 6.8 × 10⁻⁵ | 20 | - |
| 9a | Bedding plane S2 | 3.2 × 10⁻⁶ | 1.8 × 10⁻¹¹ | 6.2 × 10⁻⁵ | 20 | - |
| 9b | Bedding plane S3 | 9.0 × 10⁻⁷ | 0.5 × 10⁻¹¹ | 3.3 × 10⁻⁵ | 20 | - |
| 10 | Fault F2 | 2.0 × 10⁻⁴ | 3.0 × 10⁻¹¹ | 4.9 × 10⁻⁴ | - | - |
Table 2.
Mechanical parameters of different rock mass classification regarding capulin San Pablo dam.
Table 2.
Mechanical parameters of different rock mass classification regarding capulin San Pablo dam.
| Rock Mass Quality Classification | Bulk Density | Shear Strength of Rock Mass | Shear Strength of Concrete/Rock | Deformation Modulus | Allowable Bearing Capacity | Poisson Ratio | ||
|---|---|---|---|---|---|---|---|---|
| γ/(KN/m3) | f′ | c′/(MPa) | f′ | c′/(MPa) | /(GPa) | /(MPa) | ||
| III1B | 24.5 | 1.0 | 0.90 | 1.00 | 0.90 | 6.50 | 4.50 | 0.23 |
| III2B | 23.5 | 0.85 | 0.70 | 0.95 | 0.75 | 5.50 | 3.50 | 0.26 |
| IV1B | 22.5 | 0.75 | 0.45 | 0.80 | 0.45 | 3.50 | 2.50 | 0.29 |
| IV2B | 22.0 | 0.55 | 0.35 | 0.70 | 0.34 | 2.50 | 2.00 | 0.33 |
| IIIc | 21.5 | 0.60 | 0.55 | 0.70 | 0.60 | 2.0 | 1.50 | 0.33 |
| IV1c | 20.5 | 0.55 | 0.35 | 0.55 | 0.35 | 1.40 | 1.30 | 0.35 |
| IV2c | 20.0 | 0.50 | 0.26 | 0.45 | 0.25 | 1.10 | 0.90 | 0.37 |
| V | 18.0 | 0.40 | 0.13 | 0.40 | 0.10 | 0.40 | 0.60 * 0.40 * | 0.39 |
Note:0.60 *strong weathering; 0.40 *completely weathered.
Table 3.
Parameters of Structural plane.
| Number of Structural Plane | Shear Strength | |
|---|---|---|
| f′ | c′/(MPa) | |
| F1, F12, F13, C15,C30 | 0.40 | 0.06 |
| C13 | 0.30 | 0.05 |
| C16 | 0.35 | 0.07 |
| C12 | 0.30 | 0.04 |
| C07, C09, C10, C17, C18, C19 | 0.24 | 0.02 |
| C01, C03, C04, C11, C14 | 0.17 | 0.001 |
| C05, C06, C25 | 0.23 | 0.02 |
| C20 | 0.36 | 0.08 |
| Segment between the dam sections | 0.33 | - |
| Interface between concrete dam and bedrock | 0.95 | 0.74 |
© 2017 by the authors. Licensee MDPI, Basel, Switzerland. This article is an open access article distributed under the terms and conditions of the Creative Commons Attribution (CC BY) license (http://creativecommons.org/licenses/by/4.0/).
Share and Cite
MDPI and ACS Style
Shi, C.; Yang, W.; Chu, W.; Shen, J.; Kong, Y. Study of Anti-Sliding Stability of a Dam Foundation Based on the Fracture Flow Method with 3D Discrete Element Code. Energies 2017, 10, 1544. https://doi.org/10.3390/en10101544
AMA Style
Shi C, Yang W, Chu W, Shen J, Kong Y. Study of Anti-Sliding Stability of a Dam Foundation Based on the Fracture Flow Method with 3D Discrete Element Code. Energies. 2017; 10(10):1544. https://doi.org/10.3390/en10101544
Chicago/Turabian StyleShi, Chong, Wenkun Yang, Weijiang Chu, Junliang Shen, and Yang Kong. 2017. "Study of Anti-Sliding Stability of a Dam Foundation Based on the Fracture Flow Method with 3D Discrete Element Code" Energies 10, no. 10: 1544. https://doi.org/10.3390/en10101544
Note that from the first issue of 2016, this journal uses article numbers instead of page numbers. See further details here.