1. Introduction
An oil-impregnated transformer is commonly considered as one of the most crucial pieces of equipment in the electric power transmission and distribution systems [
1,
2,
3]. Unfortunately, it is a fact that the electrical and mechanical properties of the transformer oil-paper insulation system become aging gradually due to the combination stresses of the mechanical vibration, thermal, electrical, oxygen, water and other factors, in the long-term service process [
4,
5,
6,
7,
8]. Historically, the applications of oil sample analysis (OSA) in terms of equilibrium relationships between insulating oil and cellulose insulation, dissolved gas analysis (DGA), dielectric loss factor (DLF) and insulation resistance (IR) have been commonly used for performing non-destructive condition monitoring of transformer insulation [
9,
10,
11,
12]. However, the OSA technique only presents limited knowledge about the aging status of transformer solid insulation. In addition, results obtained using IR and DLF measurements may not diagnose the transformer insulation effectively [
13]. With regard to the DGA technique, the interpretation of DGA results is often very difficult due to the gas fluctuation and migration between mineral oil and cellulose paper [
14,
15,
16].
In order to predict the transformer insulation conditions nondestructively and reliably, a large amount of insulation information of transformers needs to be provided. Therefore, the development of dielectric response diagnostic techniques, for instance, polarization and depolarization current (PDC) [
17,
18], recovery voltage measurement (RVM) [
19,
20,
21] and frequency domain spectroscopy (FDS) [
22,
23,
24,
25] has greatly been promoted in the past several years.
The interfacial polarization spectrum obtained from the RVM, the polarization and depolarization currents obtained from the PDC measurement and the dielectric loss factor spectrum obtained from FDS measurement are believed to be related to the aging status and moisture content of transformer oil-paper insulation system. However, it is complicated to predict the actual state of the insulation and perform the estimation of transformer performance by using any one type of dielectric response measurement data. Meanwhile experienced artificial intelligent algorithm (AIA) will be necessary. To employ a reliable AIA technique in transformer insulation condition prediction is believed to be a good alternative approach. The application of AIA for insulation diagnosis of the transformer oil-paper insulation system has already been reported by some researchers [
26,
27,
28,
29]. These AIA techniques are based on the principle of the transmission of human expert knowledge into the system and using it with the same results as consulting the human experts.
Authors in [
13] reported that an expert system (ES) was used for determining the condition of the oil-paper insulation. The performance of the ES as an in-built routine is capable of estimating the value of oil-moisture content at any specific temperature. Unfortunately, the oil-moisture content at 38 °C obtained from this value of paper moisture content may give rise to misleading conclusions due to the fact that the equilibrium curve is unreliable. Saha and Purkait [
2] reported an ES tool for transformer insulation condition assessment based upon the RVM and PDC techniques. However, the database should be strengthened due to the data insufficiency of RVM and PDC in field. Otherwise, the performance of the ES as an in-built routine capable of estimating the value of oil moisture content at any specific temperature may be affected. Sarkar et al. [
30] reported a method to combine the PDC and RVM data to obtain optimized insulation models of a number of in-situ power transformers and these optimized insulation models are then used to obtain the relationship of moisture content between oil and paper. The authors believe that the oil-moisture content can be obtained from the values of branch capacitance on the lowest time constant branch in Debye model. Unfortunately, the oil-moisture content is unreliable because of the insulation geometry dependent in branch capacitance. In addition, due to the temperature dependent of central time constant (CTC), the oil-moisture content obtained from the CTC technique is also unreliable. Authors in [
31] proposed a support vector machine (SVM) algorithm to provide an effective tool for quantifying the insulation condition of transformers based on PDC measurement. The SVM algorithm used the parameters of resistance and capacitance with the smallest time constant branches and the largest time constant branches as the difference features for insulation liquid and insulation paper, respectively. These parameters were calculated from the measured PDC data. However, quantifying the insulation conditions of transformers is very difficult due to the insulation geometry dependent in branch resistances and capacitances.
The insulation system of a transformer is a typical complex system (i.e., a grey system [
32] defined as GRA). The GRA technique is an analysis of the geometric proximity between different discrete sequences of systems. The basic concept of GRA is based on the similarity of the geometry of sequence curves [
33,
34,
35]. Generally, the closer the curves, the bigger the associated degree between the corresponding sequences. If the two relative changes in the development process are basically consistent, their relevance is great; on the contrary, their correlation is small.
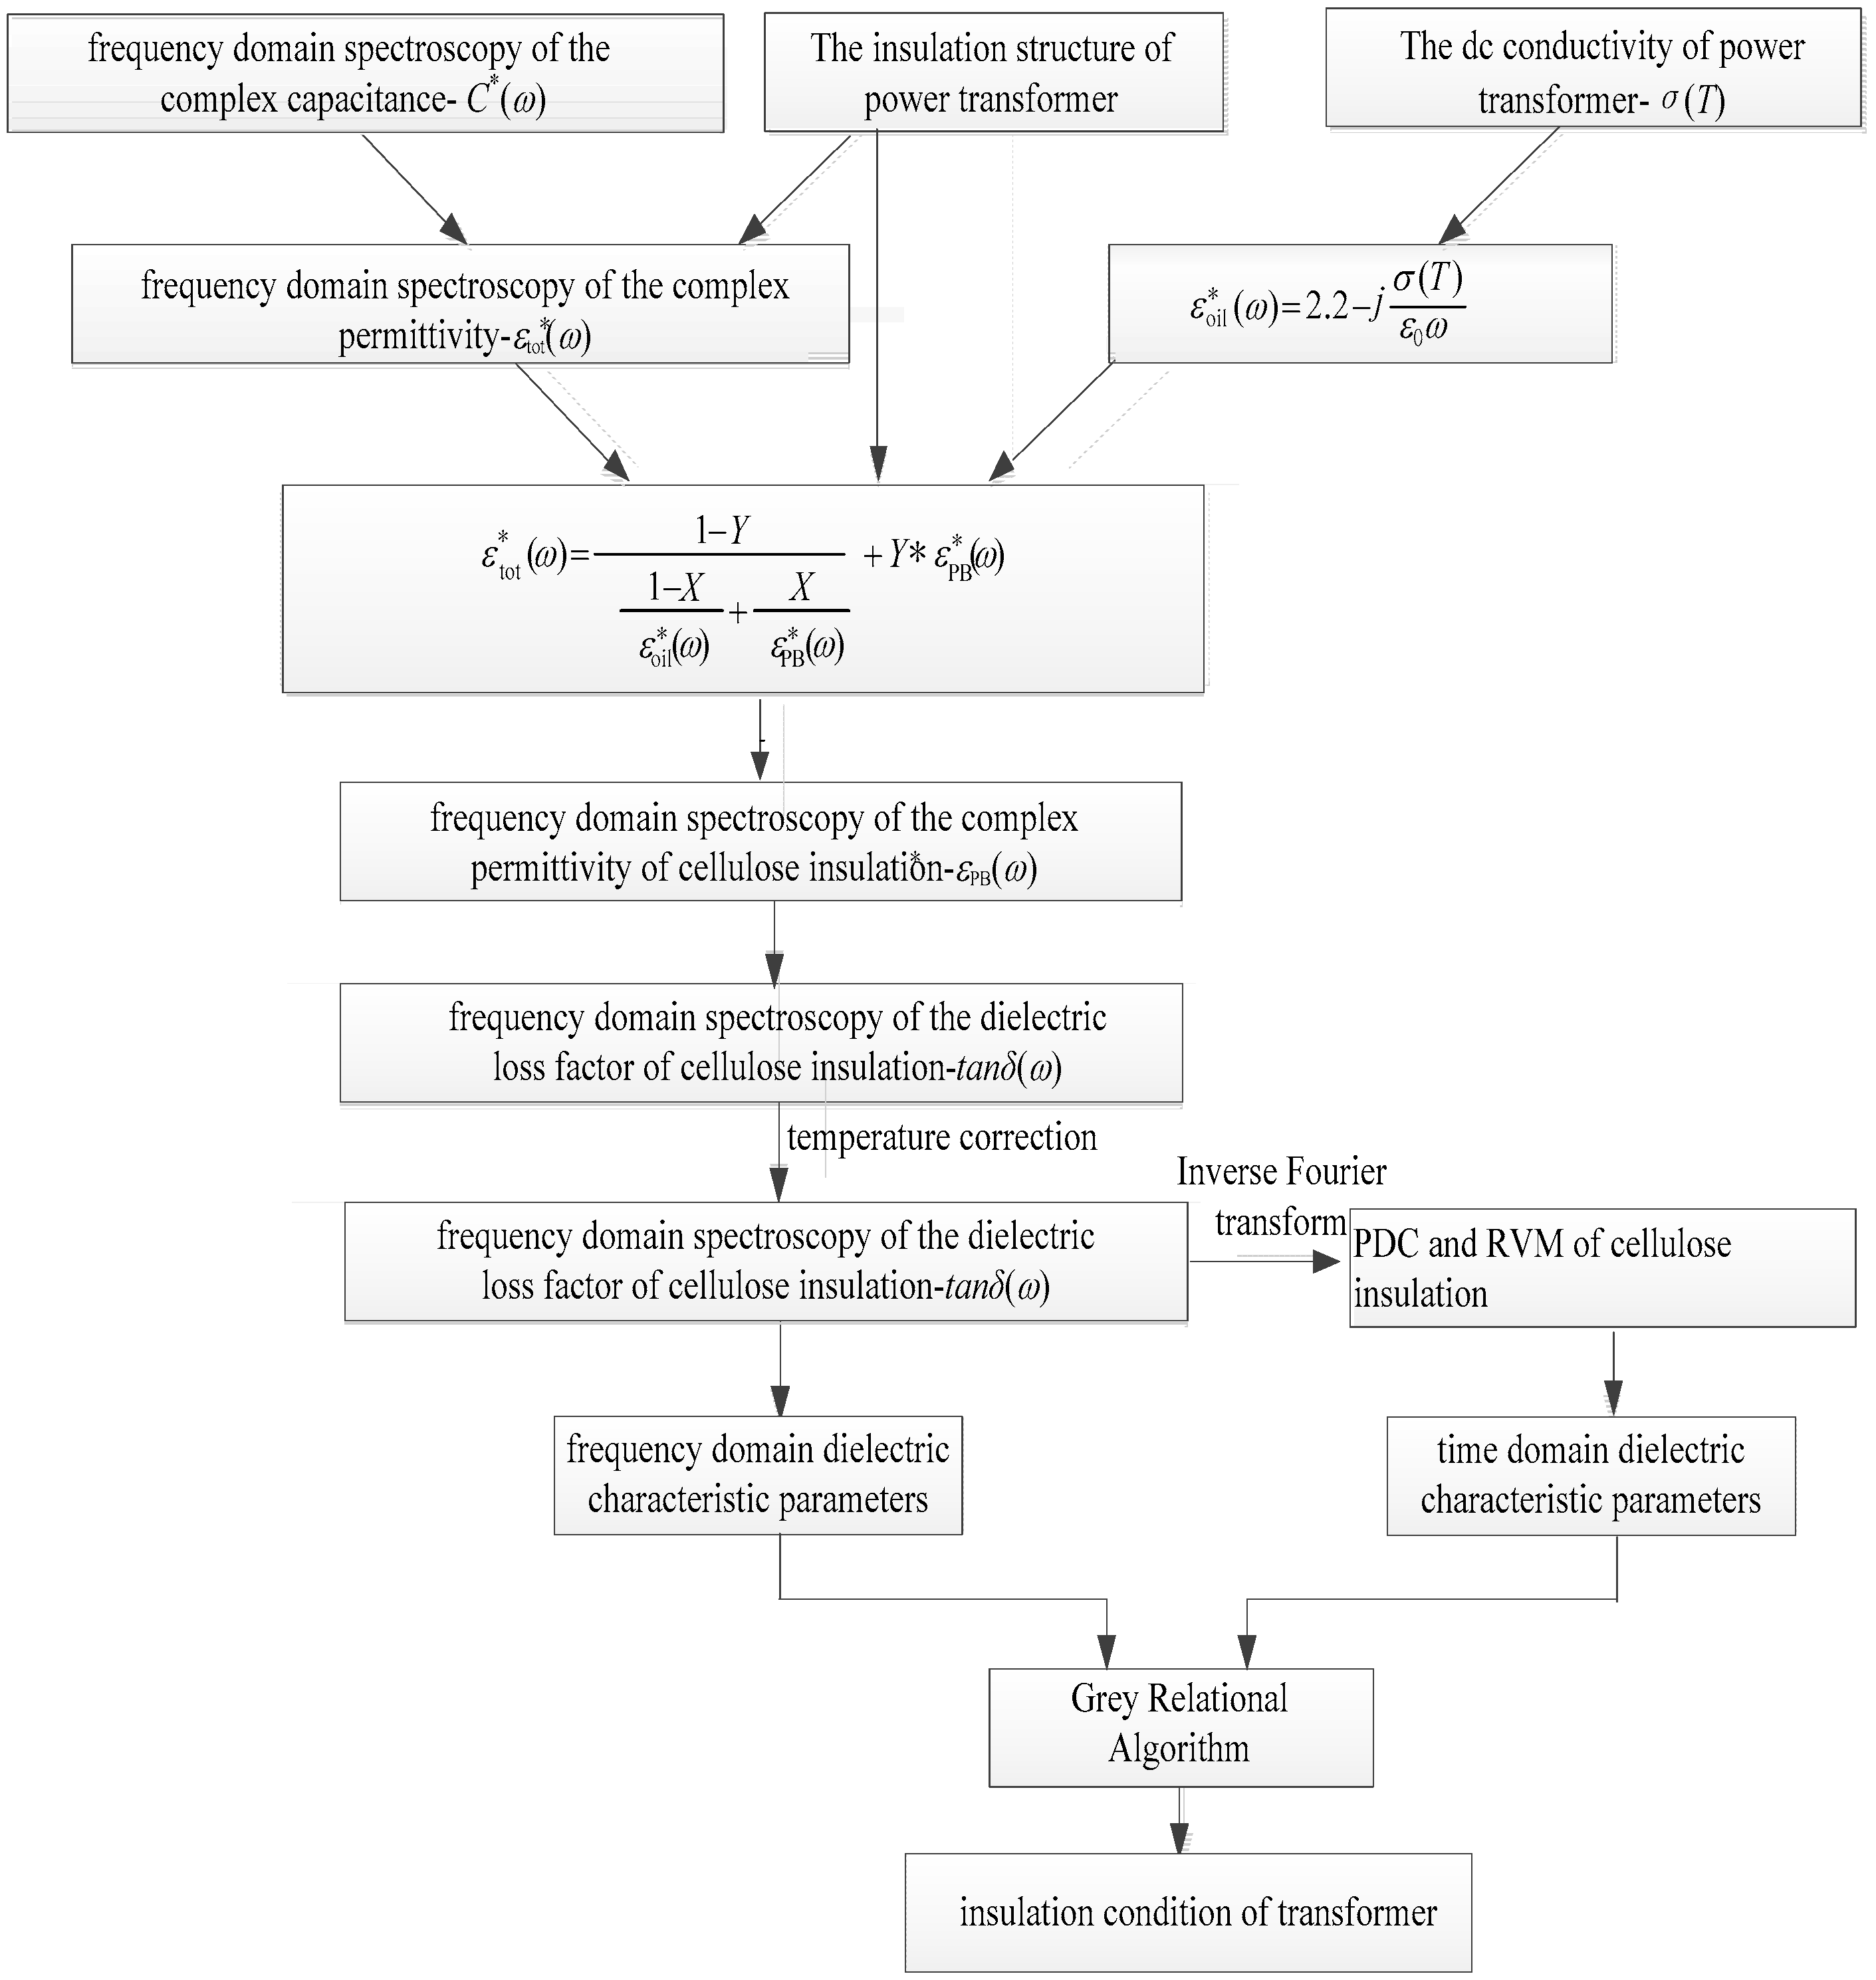
The aim of this paper is to investigate GRA technique for insulation condition assessment of transformers based upon comparative calculations of insulation condition sensitive parameters derived from conventional dielectric response measurement data. The proposed GRA technique aims at obtaining reliable and quick decision on insulation condition prediction using the PDC, RVM and FDS data, which can provide valuable information for the arrangement of transformer maintenance schemes. In this study, oil-impregnated pressboards with different thermal aging degrees and moisture contents are firstly prepared under well-controlled laboratory conditions. Then, the physical and chemical parameters and the PDC, RVM and FDS of the pressboard samples are tested and analyzed. After that, the key idea of the GRA technique and the extraction method of insulation condition sensitive parameters are also presented. Finally, the GRA technique is applied to both the laboratory samples and the field transformers to demonstrate that it can provide reliable and effective insulation diagnosis.
2. Preparation of Experimental Samples
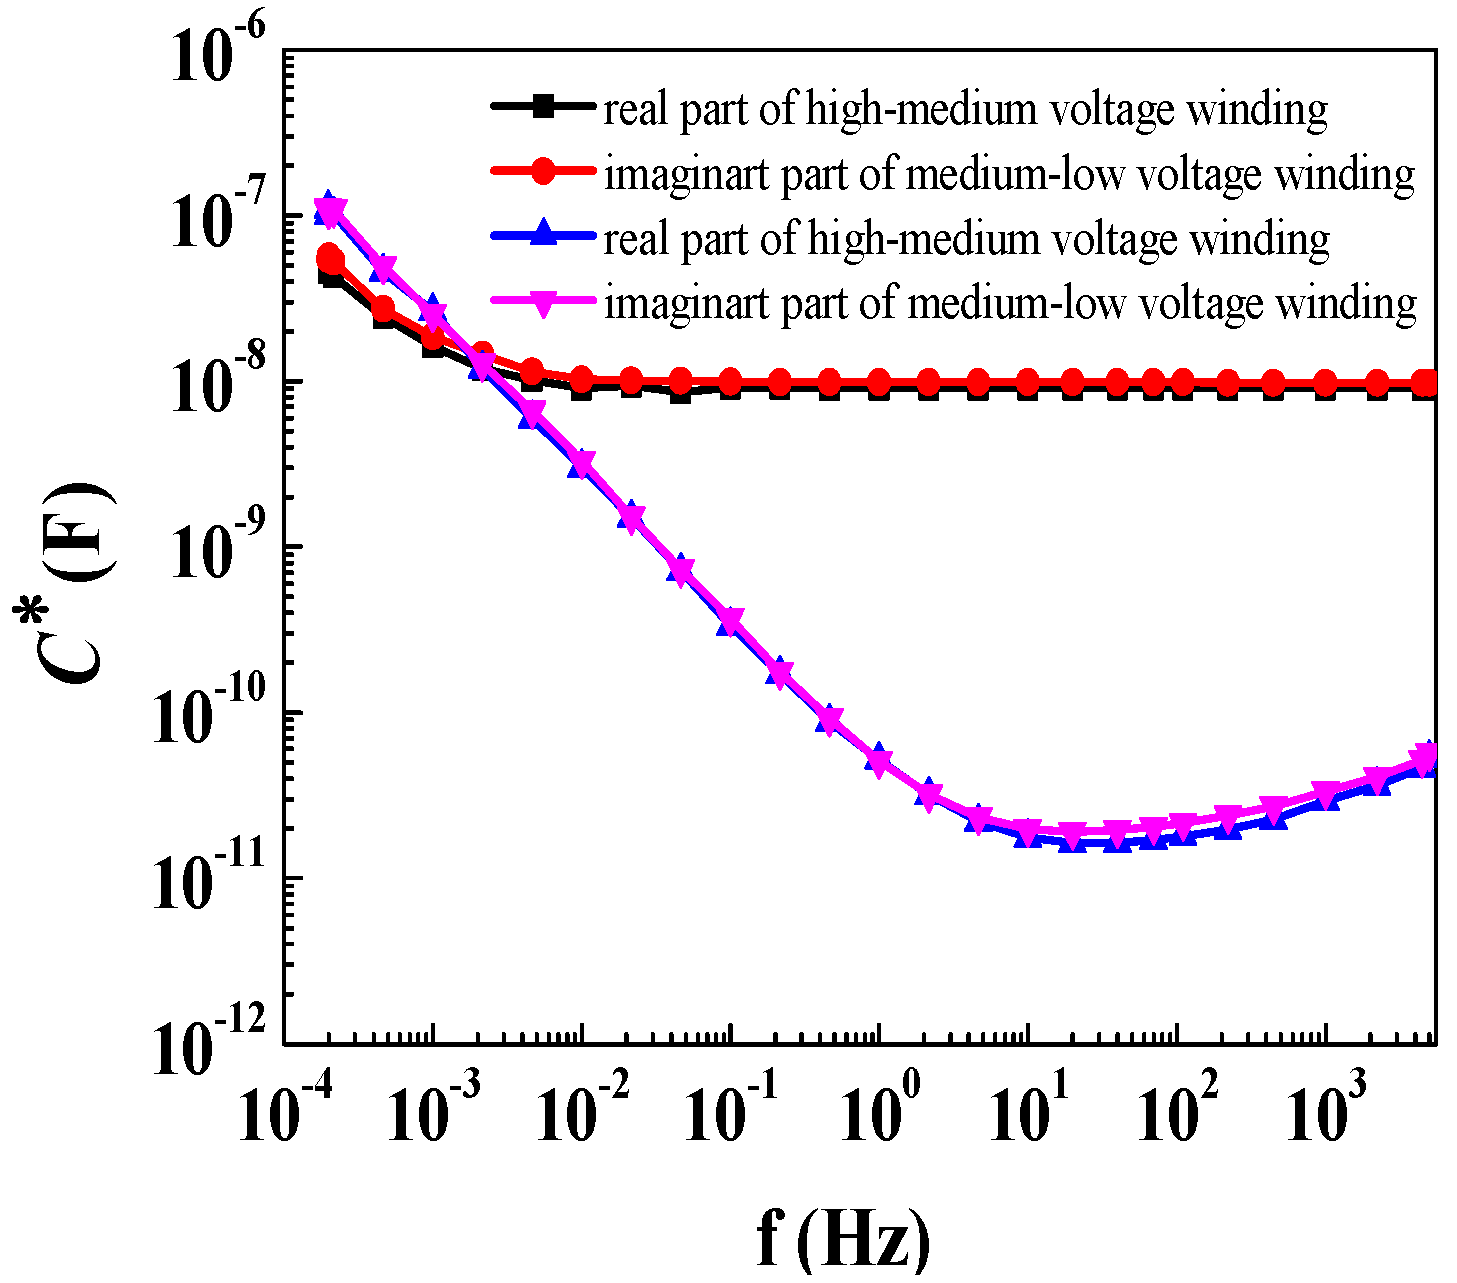
In order to obtain insulation condition sensitive information derived from conventional dielectric response measurement data such as PDC, RVM and FDS in laboratory, it must prepare experimental pressboard samples. The test materials utilized for our experimental activities are Karamay No. 25 naphthenic mineral oil and conventional cellulose pressboards with the diameter of 80 mm and thicknesses of 2 mm. These commercial grade mineral oil specimens have very good electrical and physicochemical properties, which perfectly satisfy ASTM D3487-2000(II). We employ a three-electrode test apparatus to perform the PDC and FDS measurements of oil-impregnated cellulose samples. This test instrument contains three electrodes manufactured with brass material (a voltage electrode, a measuring electrode and a guard electrode). The oil-impregnated cellulose samples are placed in the three-electrode test cell filled with dried and degassed insulation oil and fixed by a spring. Before testing of PDC and FDS, the three-electrode test cell was placed in a constant humidity and temperature chamber to insure temperature equalization between pressboard samples and insulation oil. The PDC and FDS measurements are executed with DIRANA (Chinese version, OMICRON electronics GmbH, Klaus, Austria) made by the widely known corporation in Austria. This test equipment is directly connected to the three-electrode test cell located in the chamber.
2.1. Preprocessing Activities of Pressboard Samples
In order to control the initial moisture content and reliably prepare oil-impregnated pressboard samples with different moisture contents and aging degrees, it is necessary to preprocess the pressboard samples. The detailed preprocessing activities are as follows. Firstly, the pressboard samples are dried in a vacuum tank at 105 °C/50 Pa for 48 h. Secondly, the dried and degassed insulation oil is heated to 40 °C/50 Pa. Then, these dried mineral oil and pressboard samples are placed into the vacuum tank with vacuum impregnation for 48 h. Finally, the oil-impregnated pressboards are randomly sampled to determine the initial moisture content by using a Karl Fischer titration method according to IEC 60814. The three measurement objects of oil-impregnated pressboards are the center, edge and the middle part between the center and edge of the oil-impregnated pressboards. Each measurement part is repeatedly measured three times in the same procedure to eliminate measuring errors caused by a personal factor. From the measurement results, the amount of initial moisture content in oil-impregnated pressboard is 1.11%.
2.2. Preparation of Pressboard Samples with Different Aging Degrees
In this study, the accelerated thermal aging experiments of samples are implemented to prepare the oil-impregnated pressboards with different aging status. Firstly, the insulation oil and oil-impregnated pressboard samples preprocessed in
Section 2.1 are taken out from the vacuum chamber and then placed into five thermal aging cans named as No. 1, No. 2, No. 3, No. 4 and No. 5, respectively. Secondly, the can of No. 1 is used to conserve unaged samples and the other four are vacuumed and filled up with both pure nitrogen and a given amount of coppers. Thirdly, the four cans are placed into an aging oven to perform an accelerated thermal experiment at 130 °C. Then, the four cans (aged for 8 days, 21 days, 32 days and 42 days, respectively) are conserved successively for 48 h at room temperature and after that the pressboard samples are taken out of the cans. Finally, the pressboard samples with five aging conditions are measured for obtaining the physicochemical parameters in laboratory.
2.3. Preparation of Pressboard Samples with Different Moisture Contents
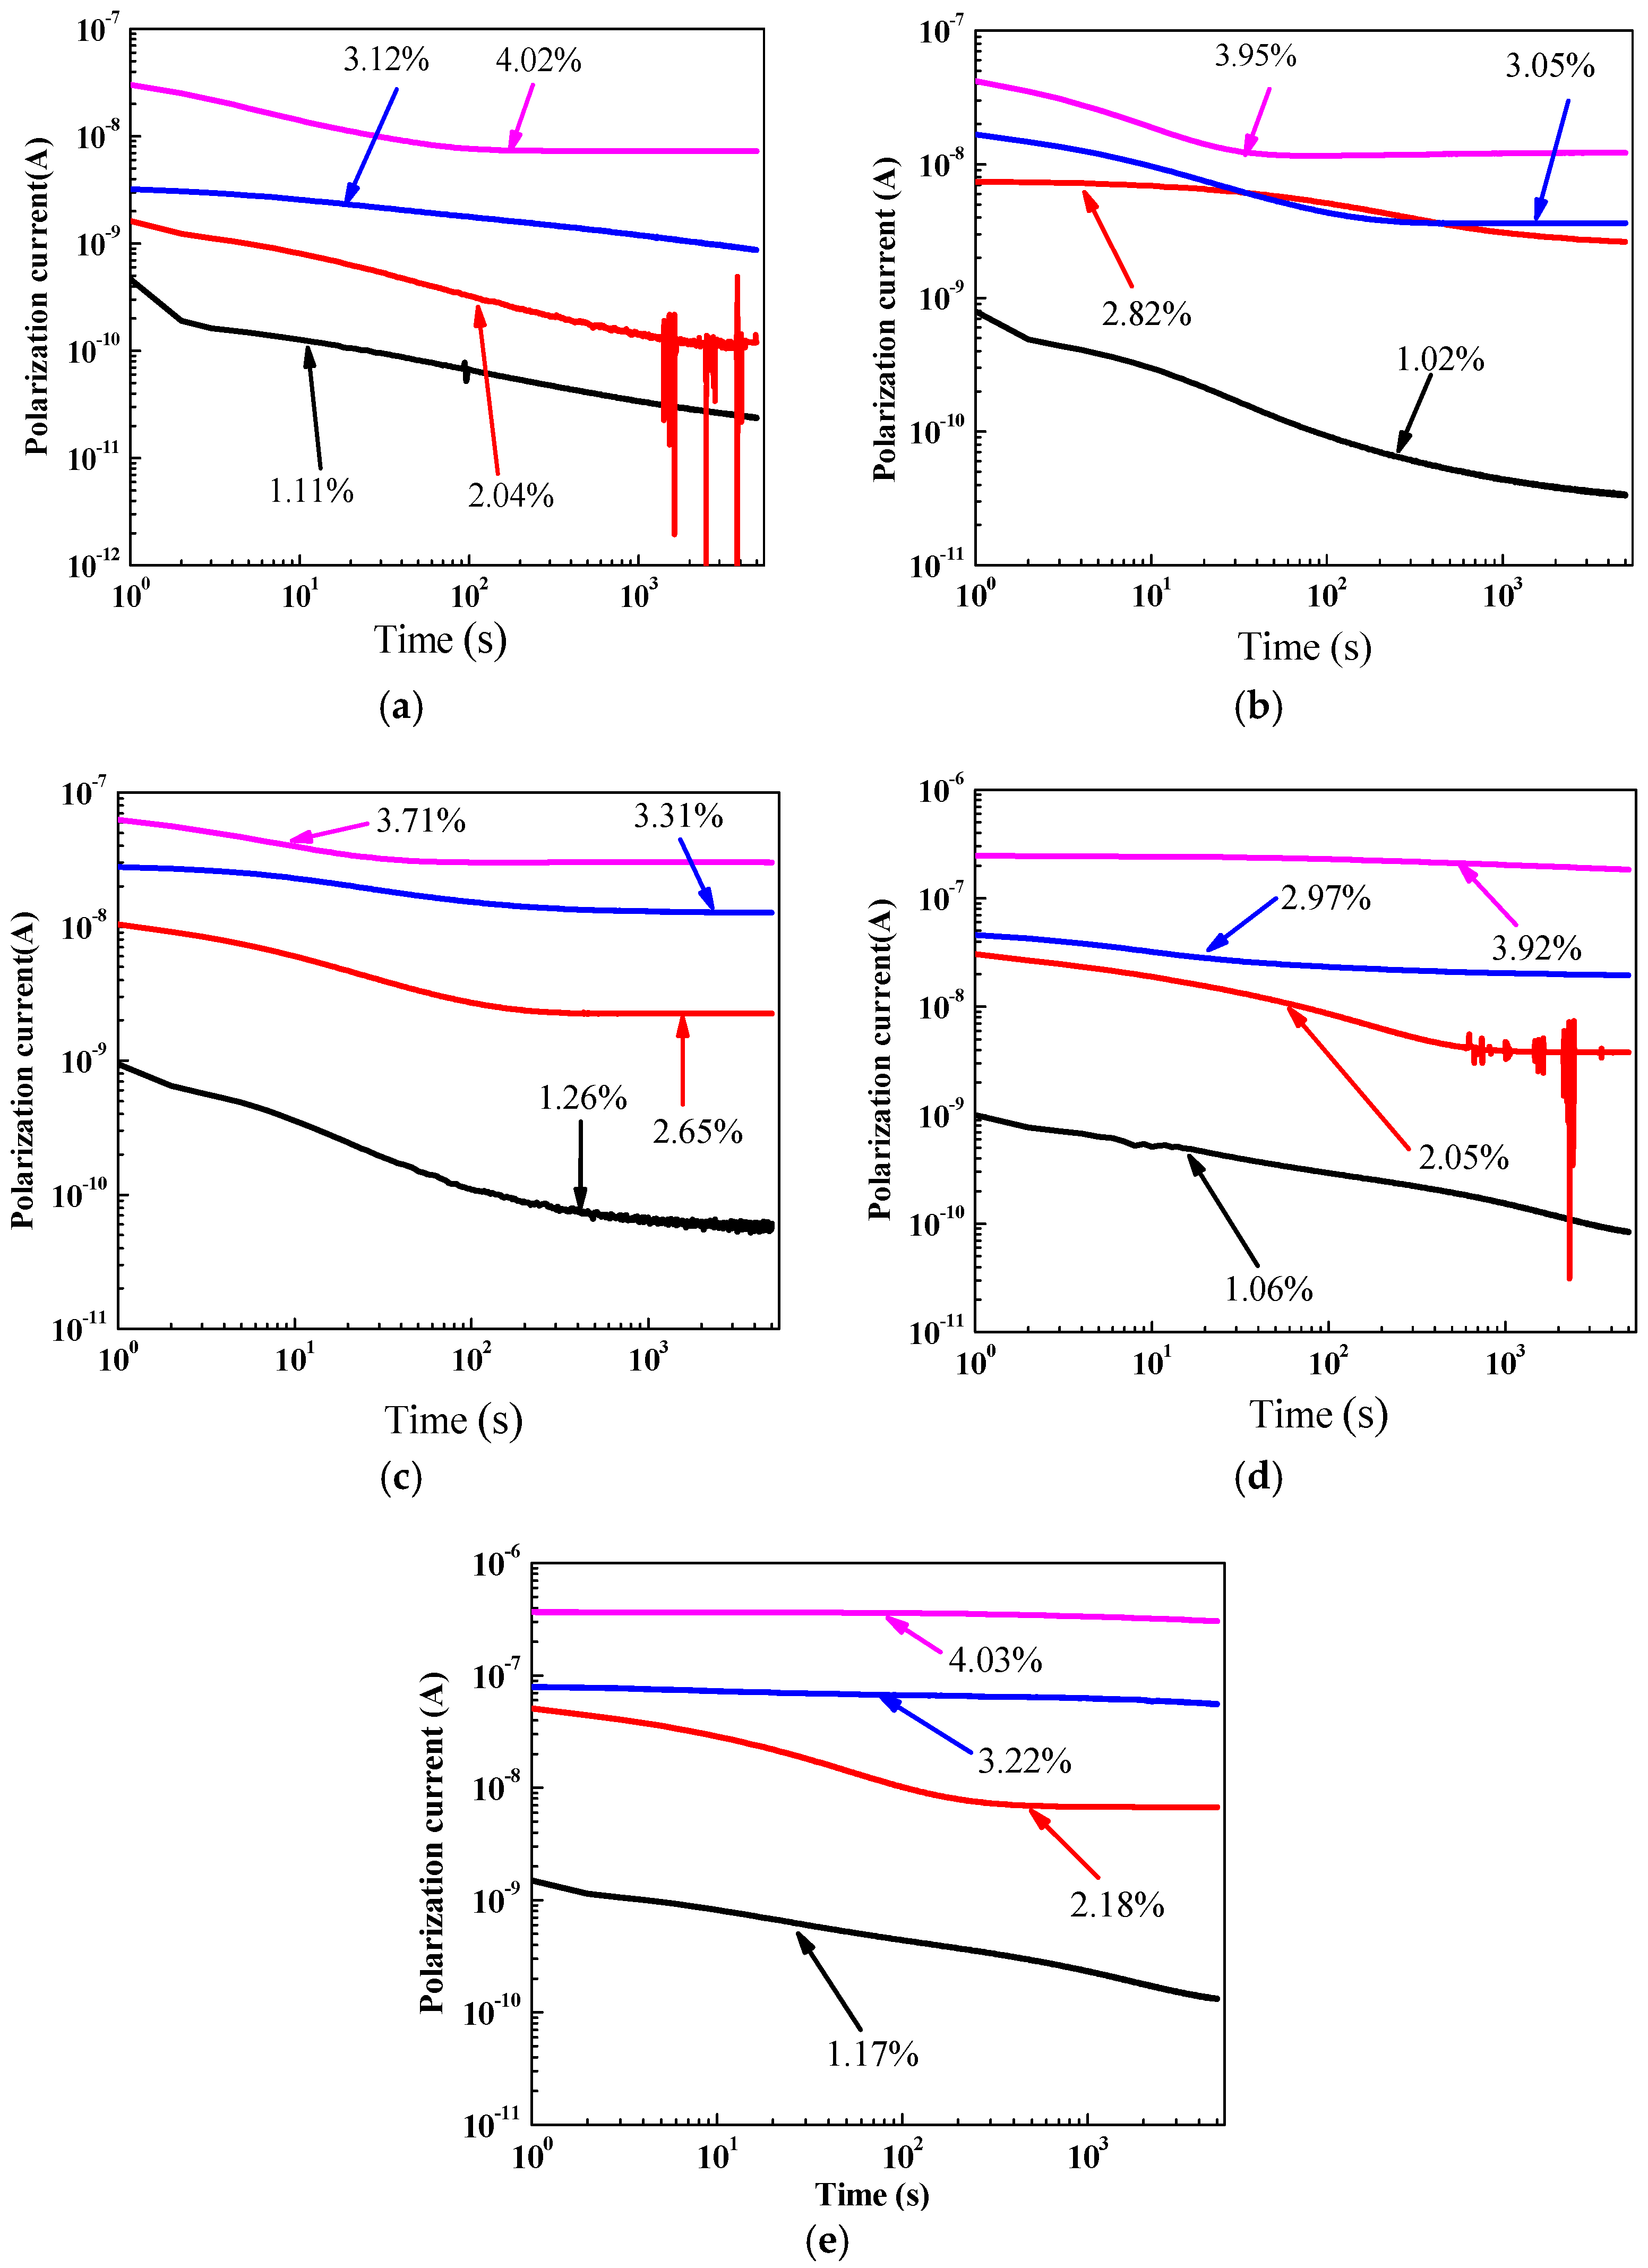
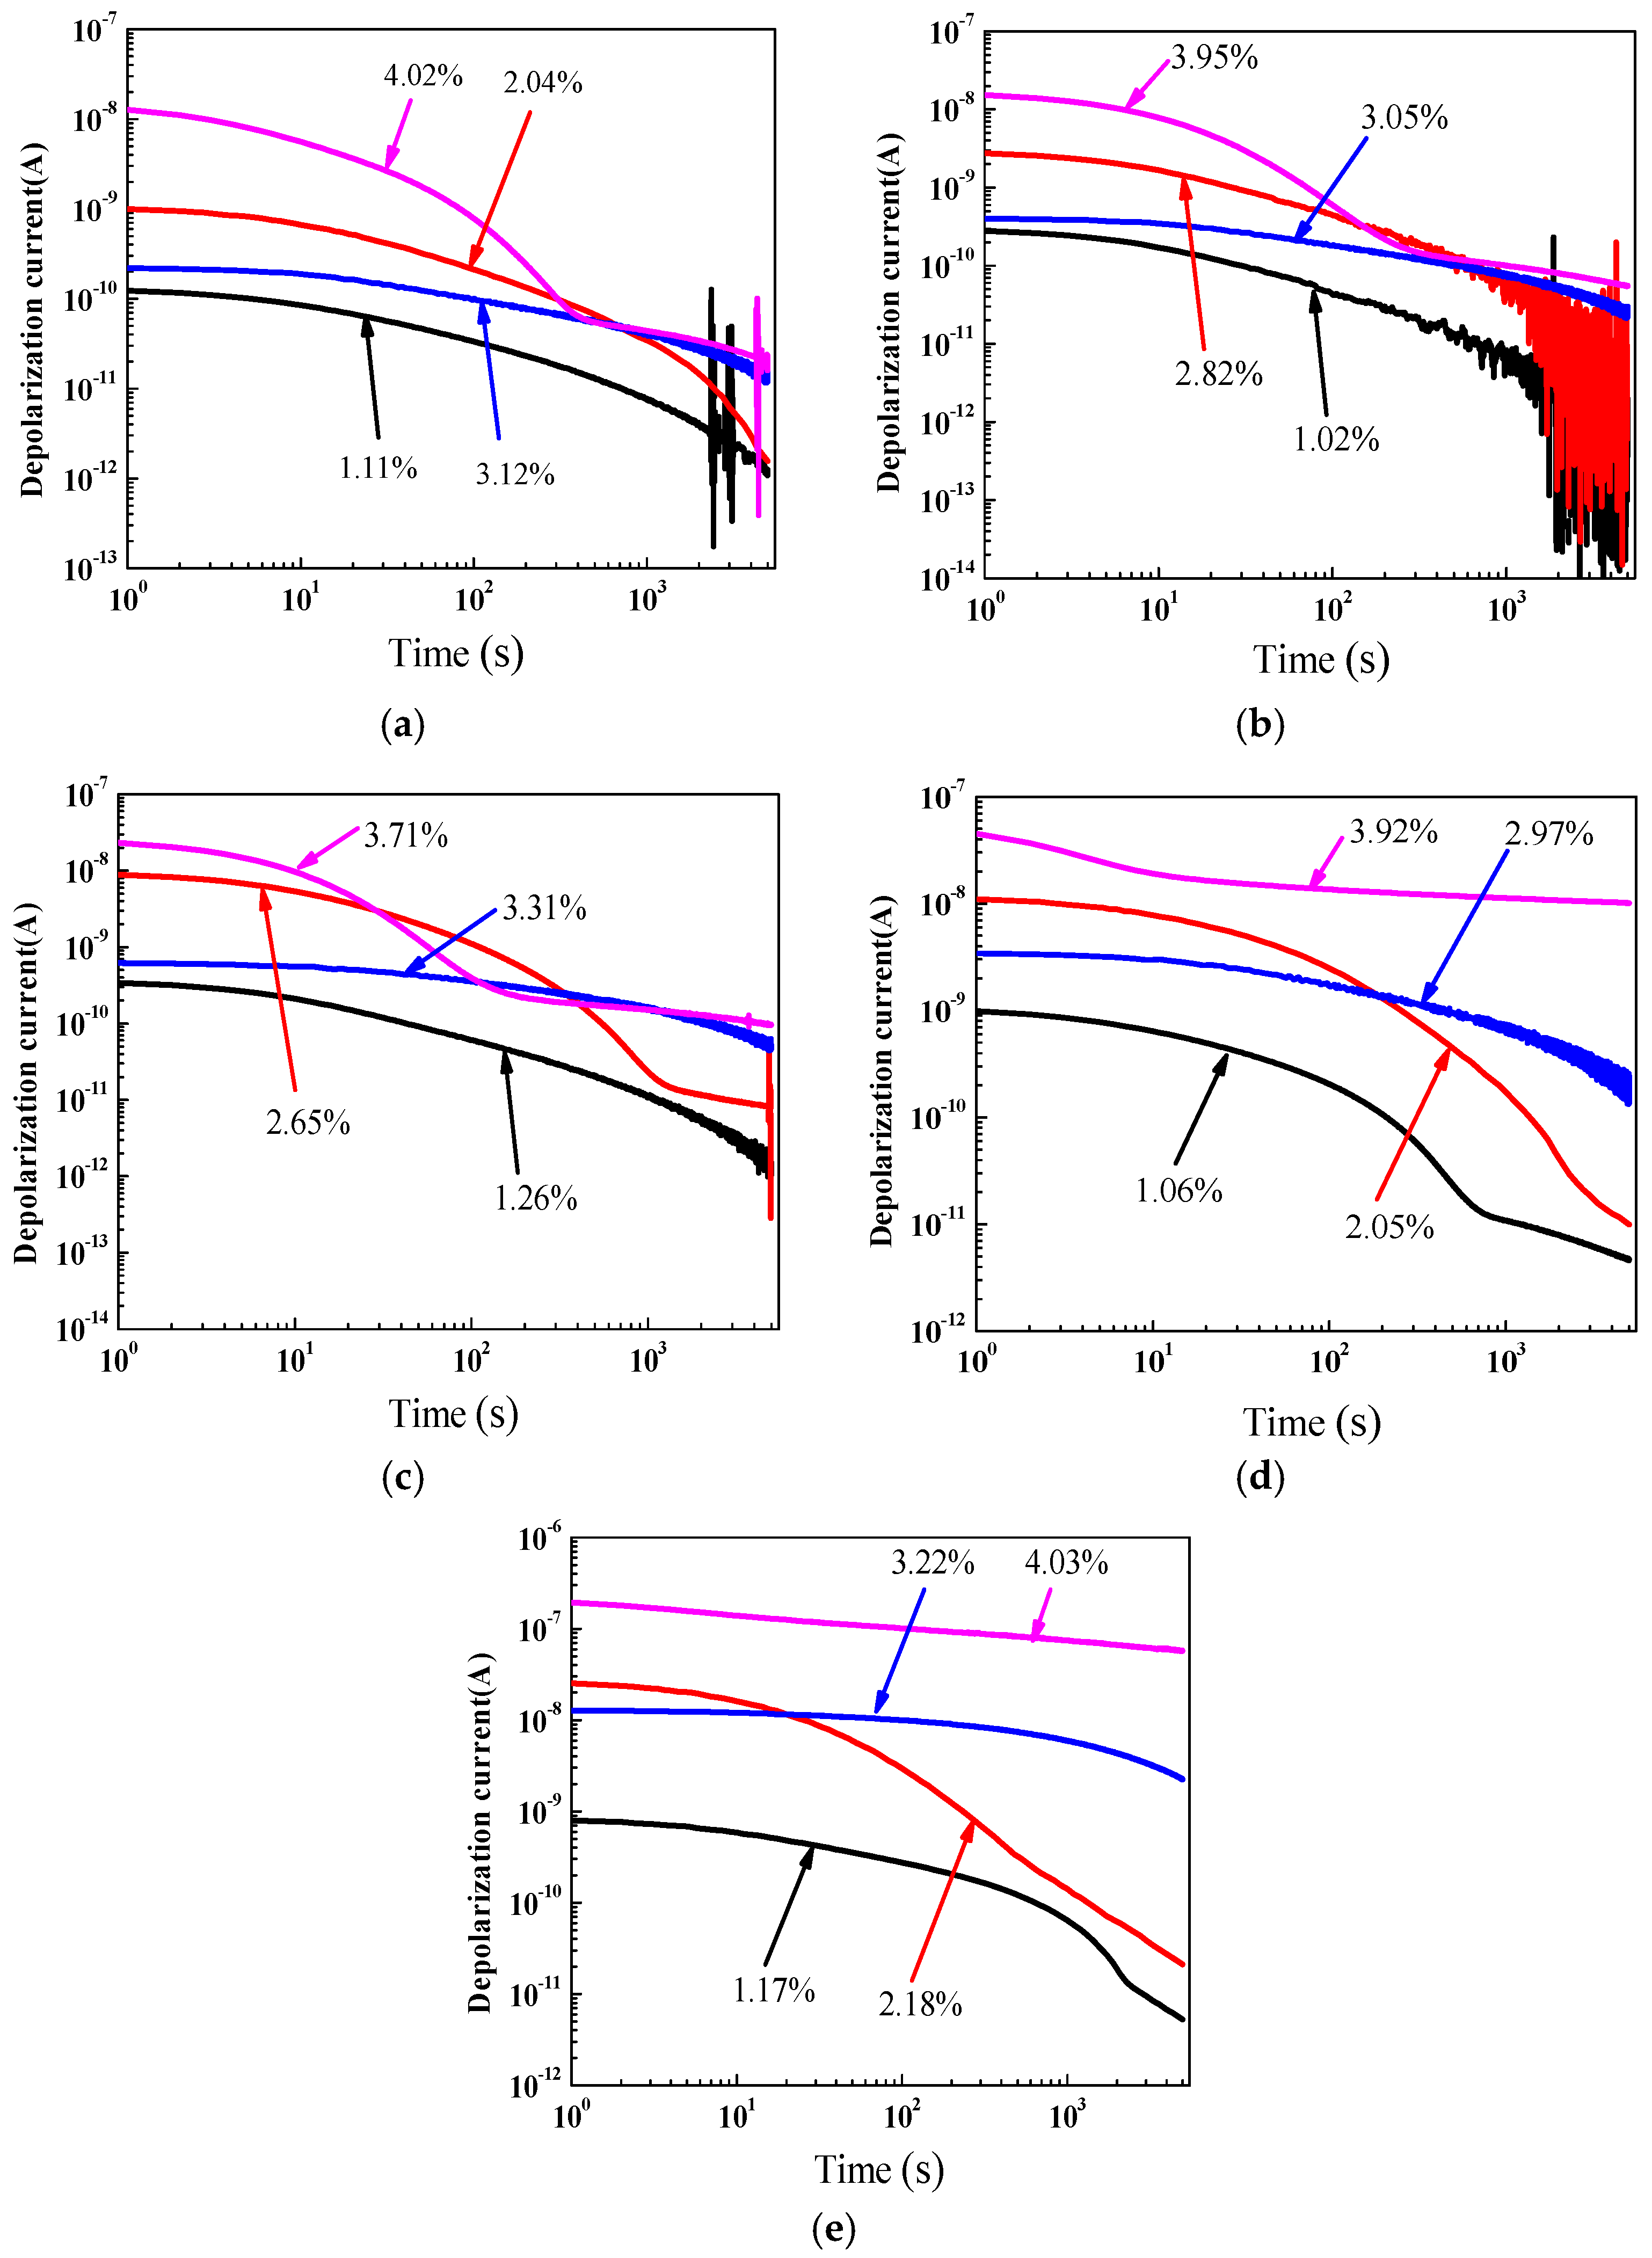
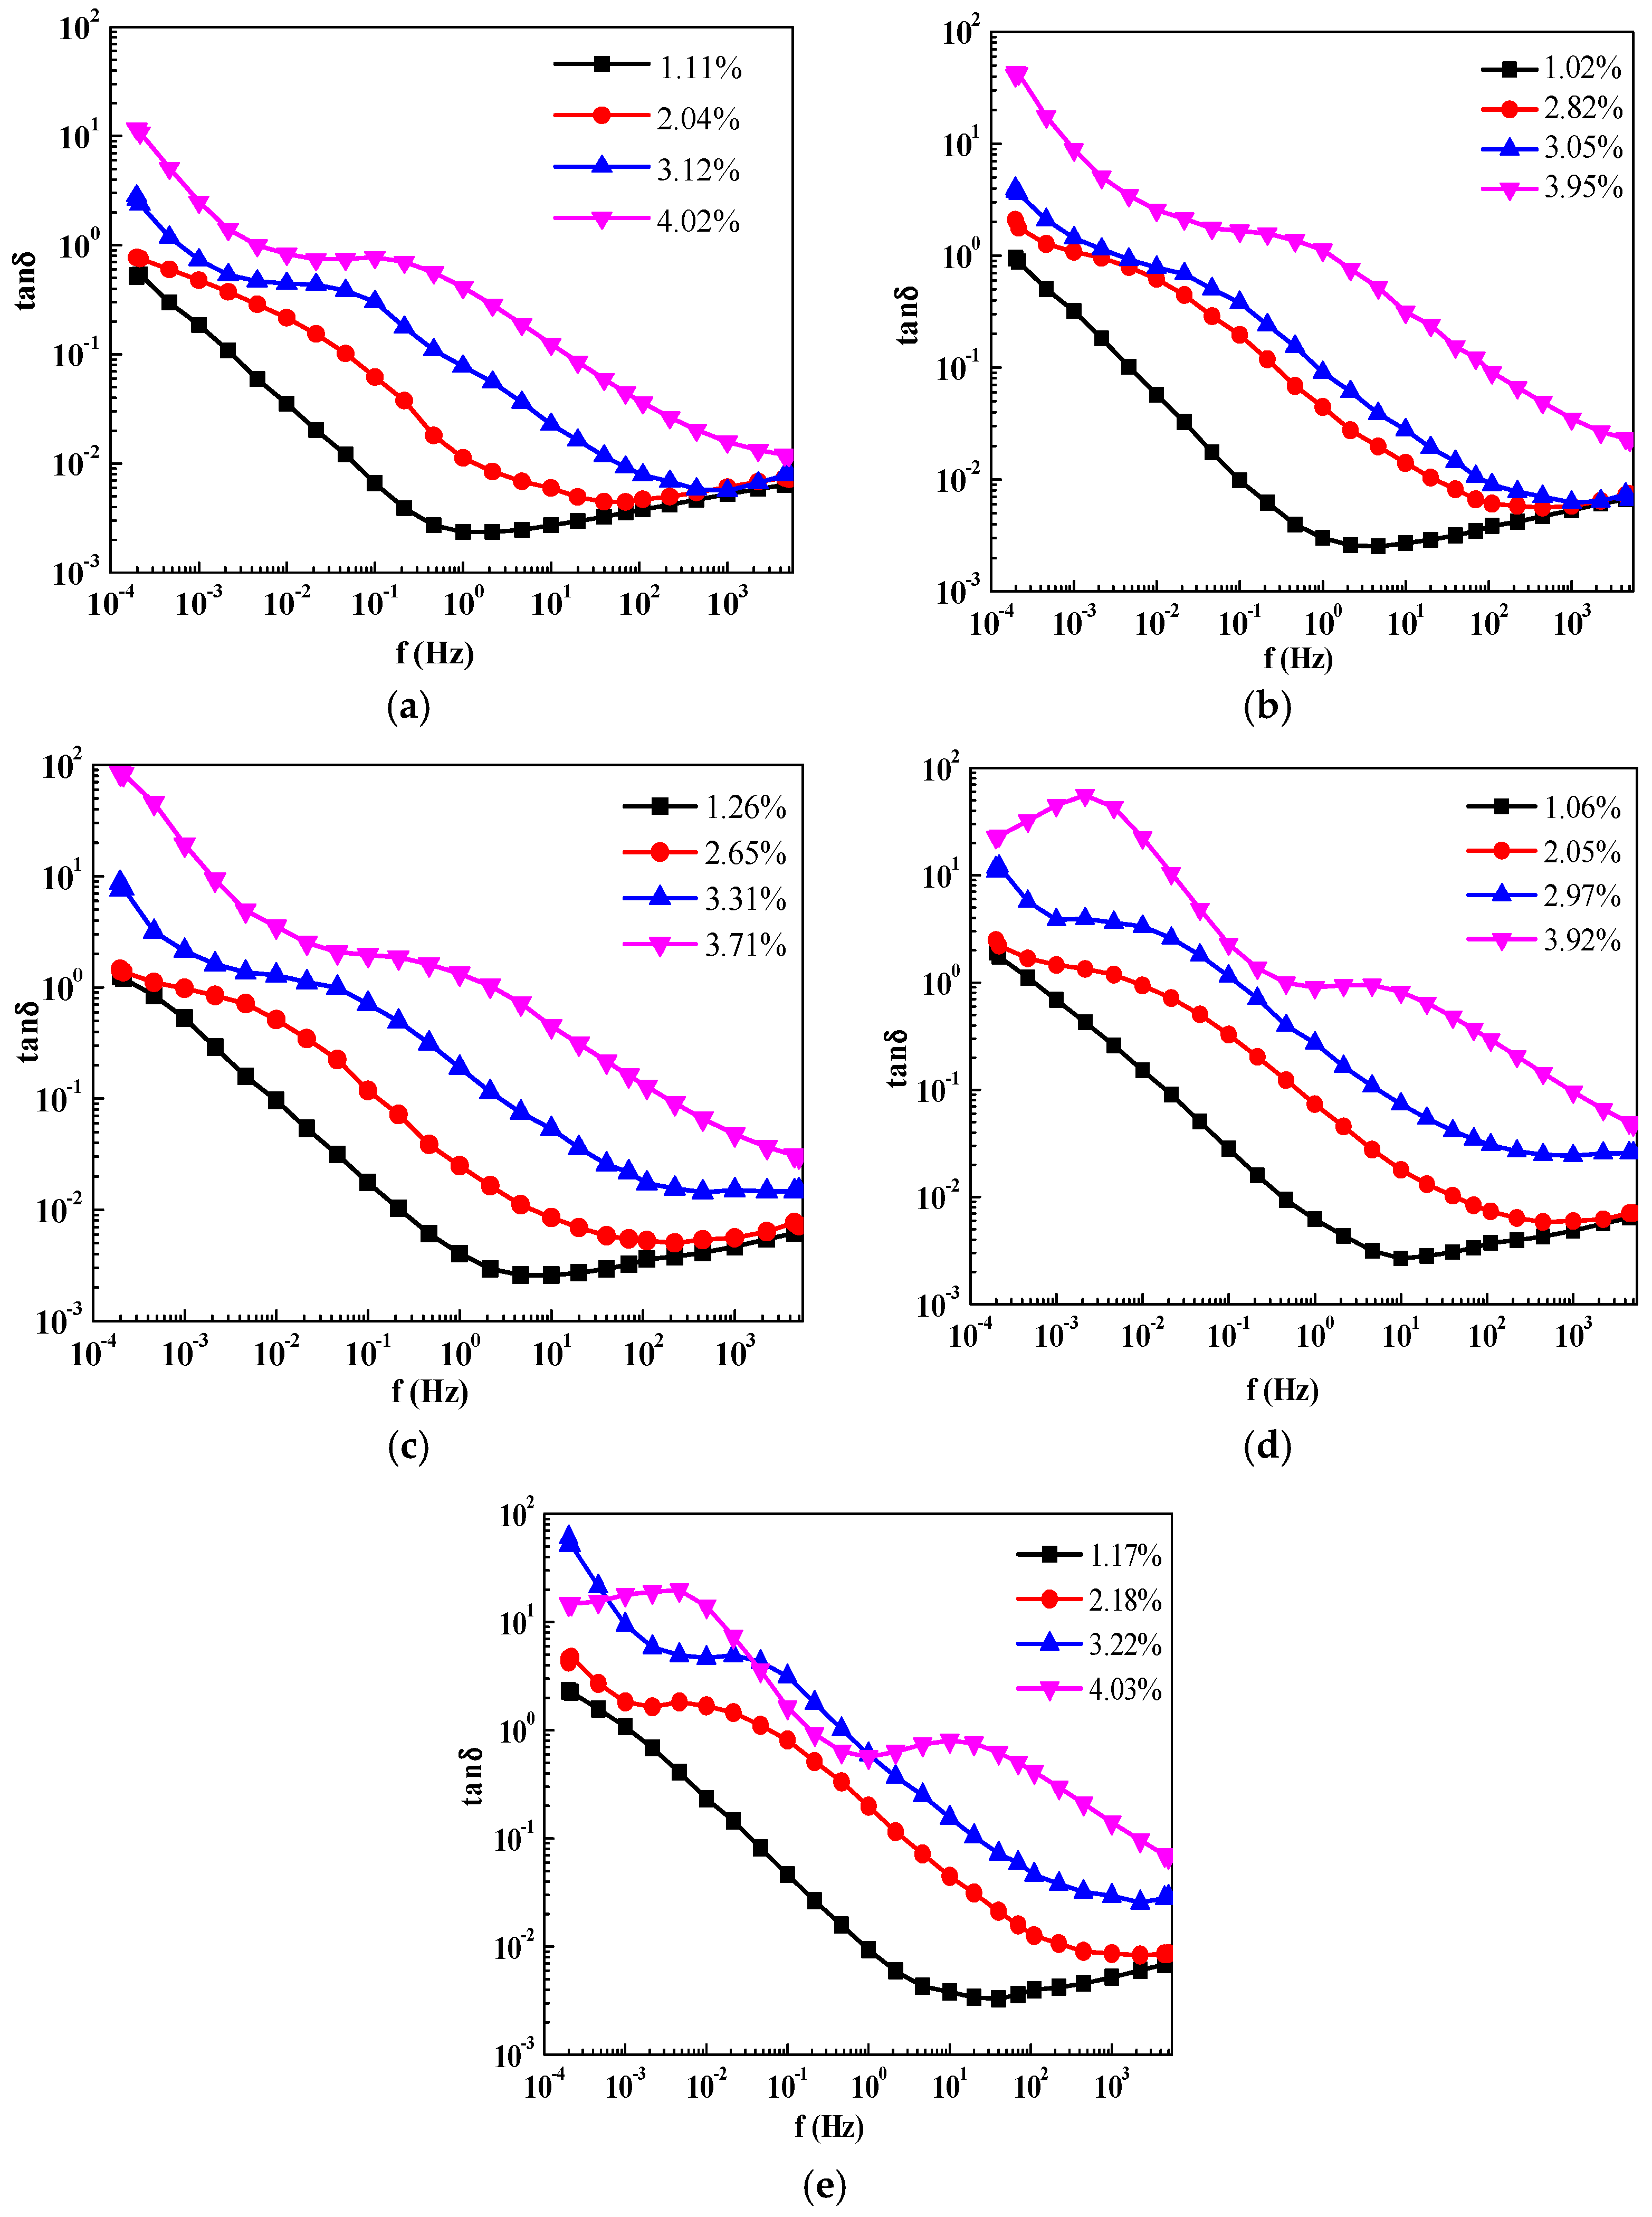
The pressboard samples with same aging degrees will also lead to different dielectric response test results due to different moisture contents. Therefore, the moisture absorption experiment of pressboard samples with same aging degrees is performed to prepare four different expected moisture content levels (1%, 2%, 3% and 4%), which serves our studies on influences of the moisture contents on the PDC and FDS results. The moisture absorption experiment is implemented at the following steps. In each test, three pieces of pressboards are taken from the samples at the corresponding aging stages. The insulation oil on the surface of the pressboards is cleaned for easy absorption of moisture. Then, the pressboards are placed on the precise electronic balance to record the initial weights. The required weights of the samples after absorbing the target moisture are calculated. After reaching target weights, the pressboards are rapidly put in the three-electrode test cell and stood for 48 h under 45 °C.
5. Selection of Standard Insulation State Model and Standard State Vector Model
It is an accepted fact that there is no accurate standard to define the aging condition and dampness degree of transformer oil-paper insulation system. In this paper, the dampness degree is defined as: dry (moisture content < 1.5%), wet (1.5% ≤ moisture content < 2.5%) and serious wet (moisture content ≥ 2.5%) in accordance with the Prevent Test Code for Electric Power Equipment of China (DT/L 596-2005) while the aging degree is defined as: good (DP ≥ 800), aging (400 < DP < 800) and serious aging (0 < DP ≤ 400) in accordance with the Guide for the Diagnosis of Insulation Aging in Oil-immersed Power Transformer of China (DL/T 984-2005).
Table 2 presents the standard insulation state model of oil-paper insulation system.
According to the analysis of
Section 4.2, the oil conductivity (
σoil), paper conductivity (
σpaper), insulation resistance (
R60sec), maximum value of RVM (
Urmax), CTC value of RVM (
tcdom), dielectric dissipation factor at
f = 10
−1 (
tan δf=10−1), dielectric dissipation factor at
f = 10
0 (
tan δf=100) and dielectric dissipation factor at
f = 10
1 (
tan δf=101) can be used to represent the insulation condition of transformer oil-paper insulation. Therefore, the eight selected parameters can be utilized for performing the standard insulation state vector model, which can be written as:
It should be mentioned here that the oil-impregnated pressboards of four moisture gradients are tested in this paper. According to
Table 2, the pressboards of expected moisture levels (3% and 4%) are assigned to “serious wet” while the pressboards of aging 0 day and 8 days are assigned to the “good”. In this study, the insulation condition sensitive parameters with the combination of expected moisture levels (1%, 2% and 4%) and expected aging levels (0 day, 21 days and 42 days) are used to establish the standard state vector model of pressboards, which is shown in
Table 3.
7. Conclusions
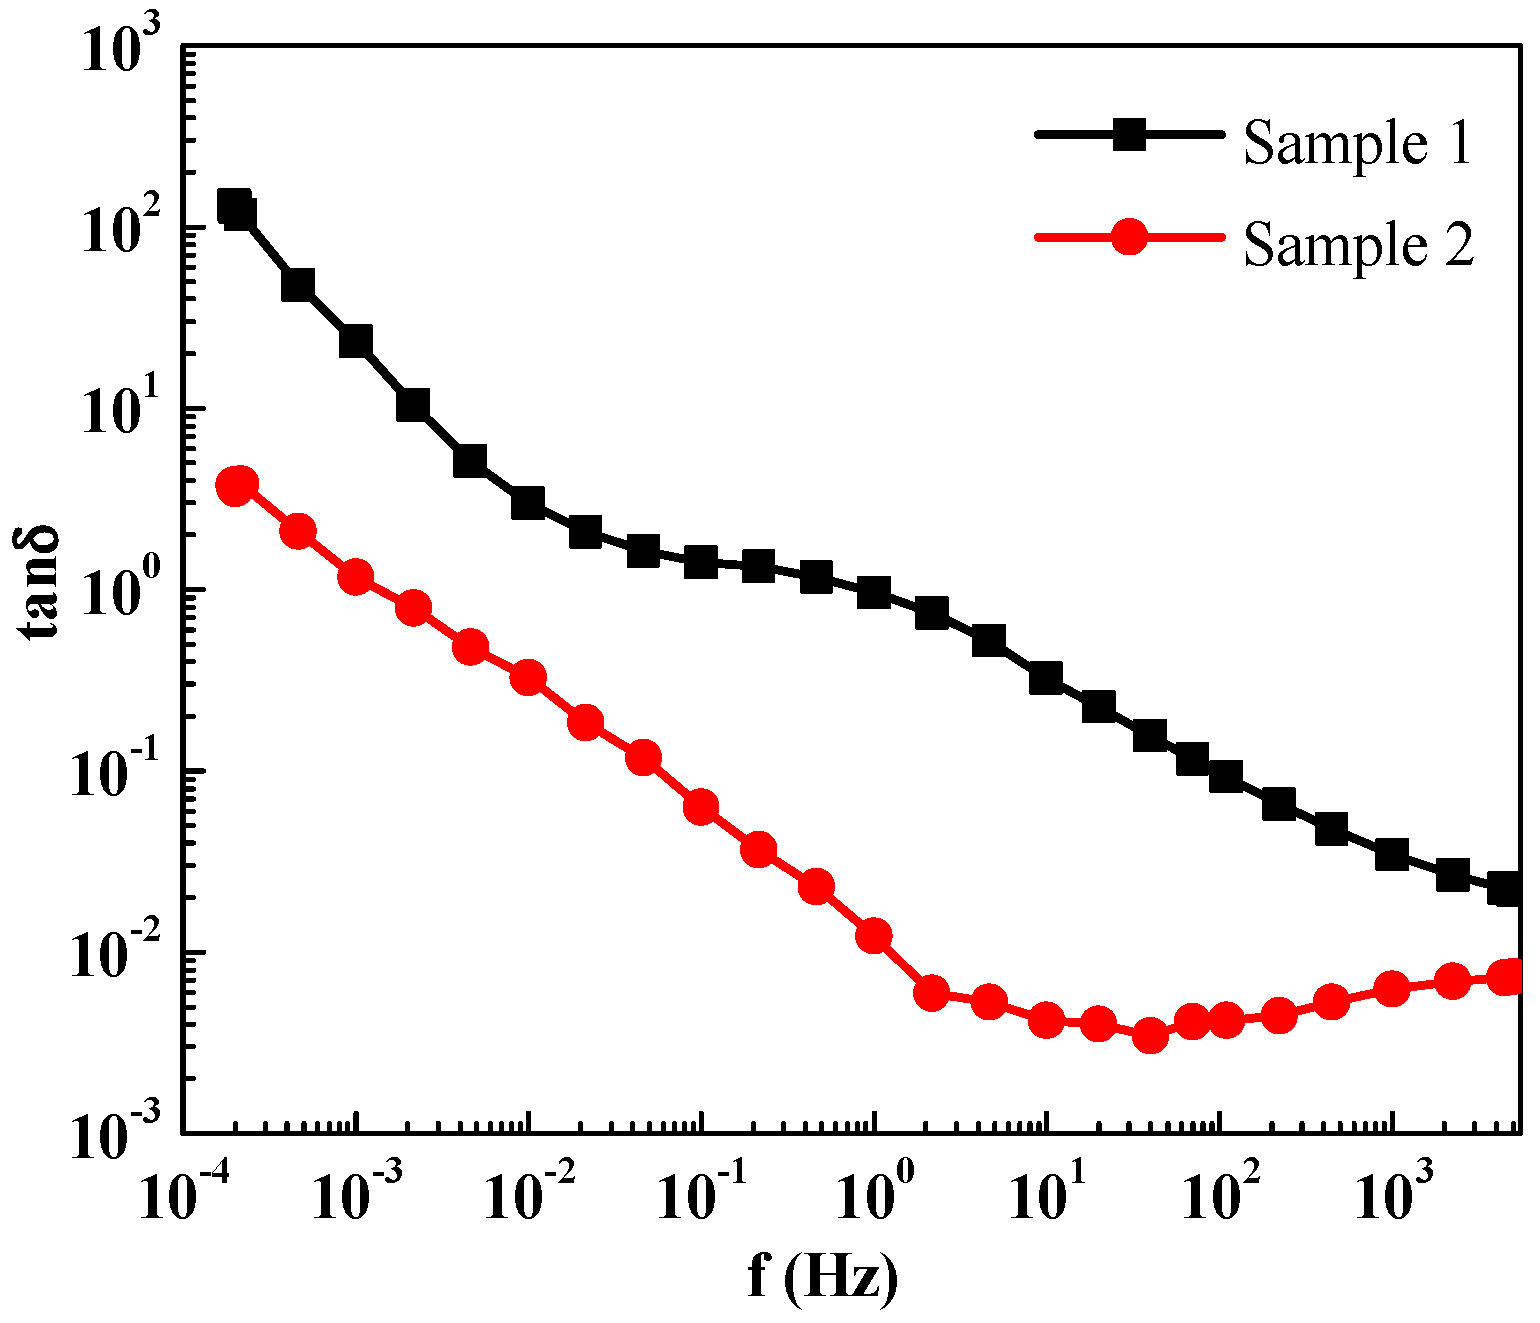
This paper investigates GRA technique for insulation condition assessment of power transformers based upon conventional dielectric response measurement such as PDC, RVM and FDS. By means of FDS measurement and fitting curve method in PDC data, the insulation condition sensitive parameters from these data are extracted and then used to perform the grey relational calculation to predict the transformer insulation condition.
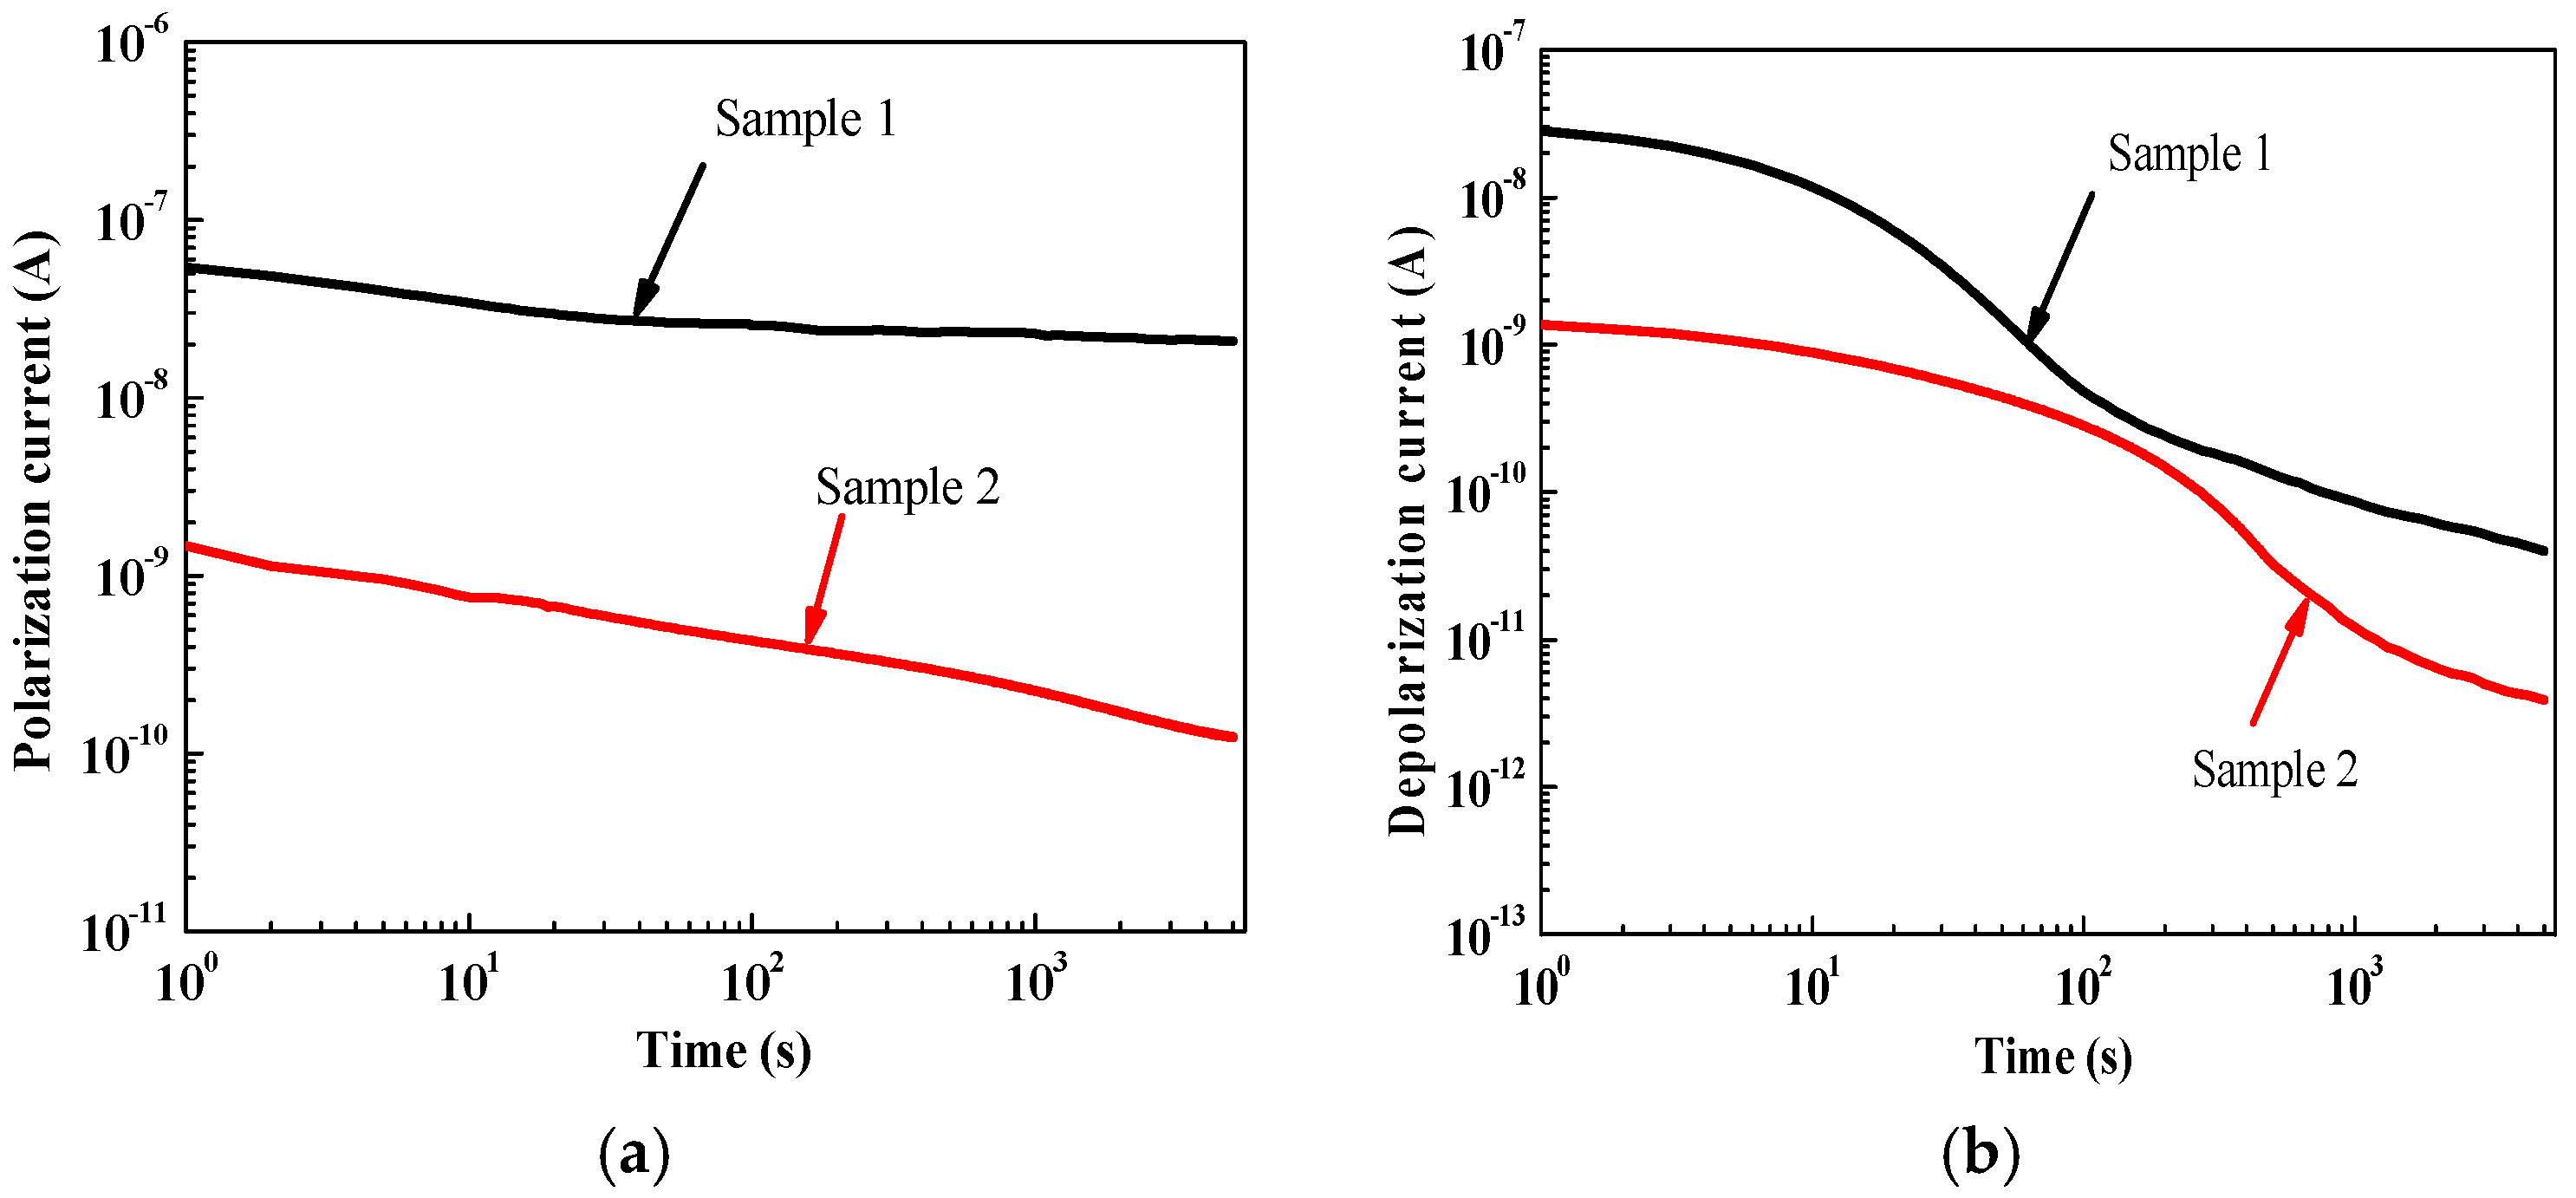
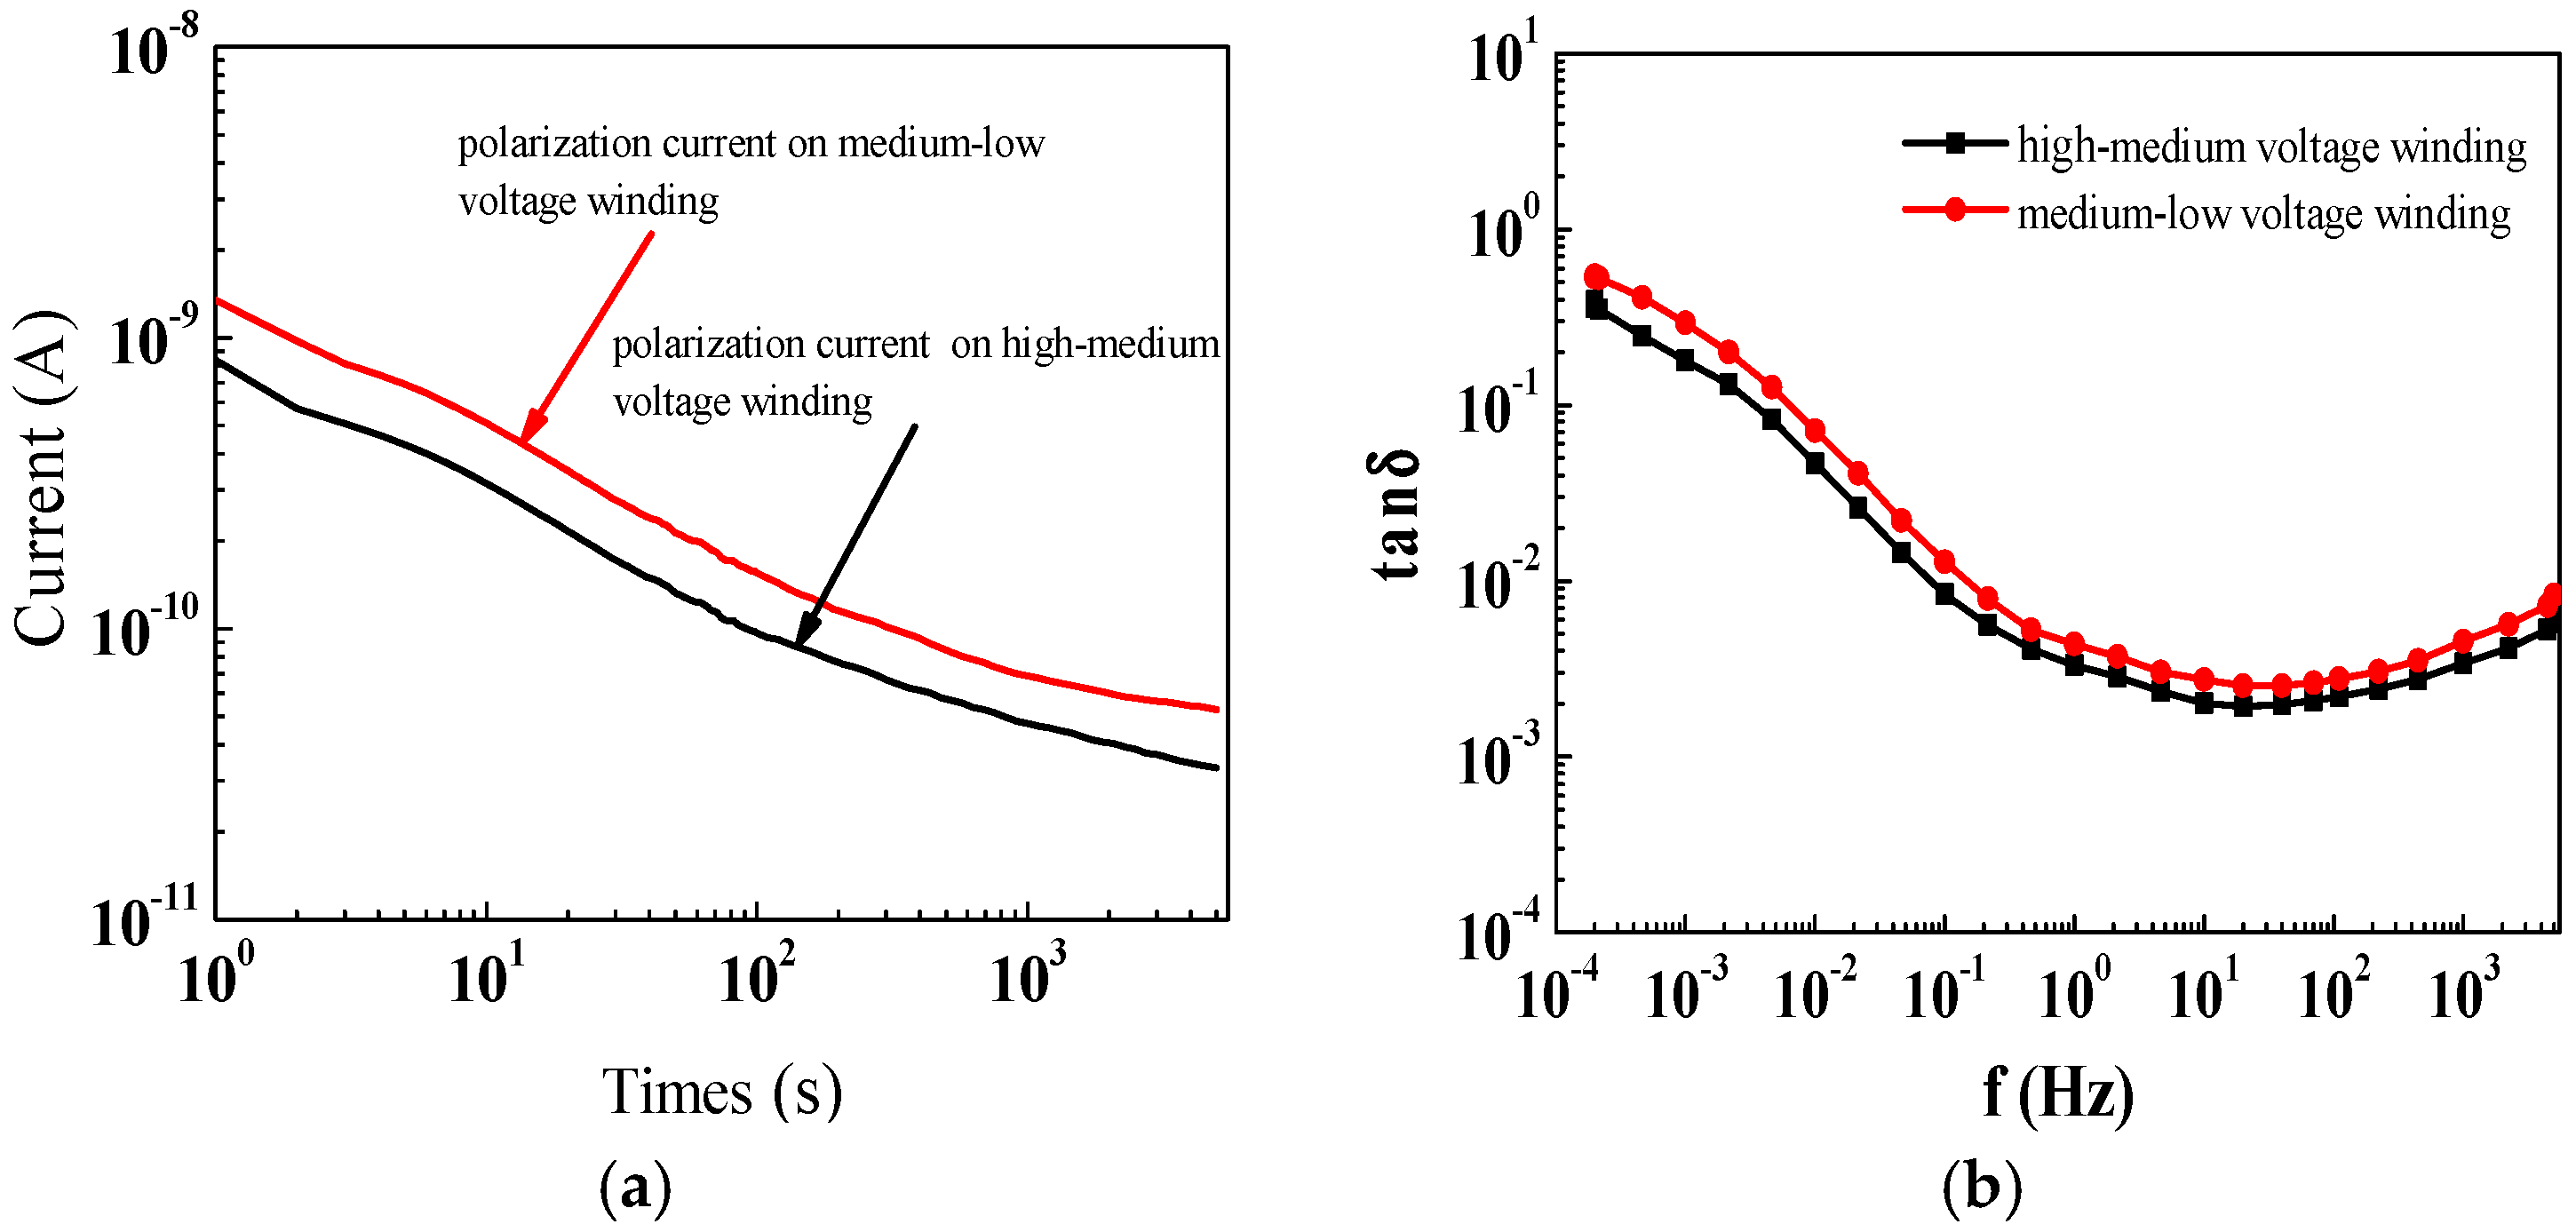
For two laboratory pressboard samples, according to GRA we draw the evaluation result that Sample 1 is the condition with aging and serious wet while Sample 2 is the condition with serious aging and dry, which are in agreement with the tested results by moisture contents and DP values. In addition, a power transformer in service is employed to verify the GRA analysis based upon conventional dielectric response measurement. A flow chart of evaluation procedure is proposed as an effective tool for transformer insulation diagnosis. According to analysis of
Section 6.2, the aging degrees and moisture contents of the transformer insulation are perfectly in agreement with the standard insulation state defined in
Table 2. Thus, the laboratory samples and a power transformer of unknown state preliminarily demonstrate that the GRA technique can provide reliable and effective diagnosis of transformer insulation.


