Application of the Sensor Selection Approach in Polymer Electrolyte Membrane Fuel Cell Prognostics and Health Management


Department of Aeronautical and Automotive Engineering, Loughborough University, Loughborough LE11 3RX, UK
*
Author to whom correspondence should be addressed.
Energies 2017, 10(10), 1511; https://doi.org/10.3390/en10101511
Submission received: 24 July 2017
/
Revised: 8 September 2017
/
Accepted: 14 September 2017
/
Published: 29 September 2017
(This article belongs to the Special Issue Polymer Electrolyte Membrane Fuel Cells 2017)
Abstract
:In this paper, the sensor selection approach is investigated with the aim of using fewer sensors to provide reliable fuel cell diagnostic and prognostic results. The sensitivity of sensors is firstly calculated with a developed fuel cell model. With sensor sensitivities to different fuel cell failure modes, the available sensors can be ranked. A sensor selection algorithm is used in the analysis, which considers both sensor sensitivity to fuel cell performance and resistance to noise. The performance of the selected sensors in polymer electrolyte membrane (PEM) fuel cell prognostics is also evaluated with an adaptive neuro-fuzzy inference system (ANFIS), and results show that the fuel cell voltage can be predicted with good quality using the selected sensors. Furthermore, a fuel cell test is performed to investigate the effectiveness of selected sensors in fuel cell fault diagnosis. From the results, different fuel cell states can be distinguished with good quality using the selected sensors.
1. Introduction
Due to characteristics such as zero-emissions and high efficiency, fuel cell technology has been engineered for a range of applications, including automotive, stationary power stations, and consumer devices.
However, the fuel cell reliability and durability are still two main barriers for its wider application, which leads to a series of studies on fuel cell prognostics and health management (PHM). From previous studies [1,2,3], PHM analysis requires several stages, including data collection, data processing, condition monitoring, diagnostics, prognostics, and decision support. From a literature review, it is observed that most fuel cell PHM studies focus on the diagnostic stage, which can be loosely divided into two groups: model-based methods and data-driven techniques. Although several studies employ a model-based method for fuel cell diagnostics, i.e., developing a fuel cell model, and identifying fuel cell faults from residuals between model outputs and actual measurements [4,5,6,7,8], there are complexities in developing an accurate fuel cell model containing complete sets of failure modes. Data-driven approaches are more widely used for fuel cell diagnostics, that is, extracting the features by applying signal processing techniques to the sensor data, and discriminating fuel cell faults with extracted features [9,10,11,12,13]. Compared to fuel cell diagnostics, fewer studies have been devoted to fuel cell prognostics, and among these studies, training data from a fuel cell system is required to generate the input–output relationship of the fuel cell model for the prediction of future performance [14,15,16,17,18].
It can be concluded from the literature review that with commonly used fuel cell diagnostic and prognostic approaches, the performance relies largely on the quality of the fuel cell sensor measurements. Considering the fact that sensors may express different sensitivities to fuel cell performance change, and environment/measurement noise is usually contained in the collected measurements, more sensor measurements may not provide better performance, thus it is necessary to find the optimal sensors providing reliable results with the minimum computation cost. From a literature review, several sensor selection approaches have been applied in different systems [19,20,21,22], but their applications in fuel cell system PHM have not been fully investigated.
In this paper, sensor selection approaches are applied to find optimal sensors for fuel cell diagnostics and prognostics, and the performance of these optimal sensors in fault diagnosis and prognosis is evaluated using test data from a polymer electrolyte membrane (PEM) fuel cell system. Section 2 presents the developed fuel cell model and validates its performance in representing fuel cell behavior. Based on the model, the sensitivity matrix relating sensor measurements and model parameters is generated. In Section 3, several sensor selection approaches are used to find optimal sensors based on their sensitivity, and the performance of selected sensors in predicting fuel cell performance is evaluated using an adaptive neuro-fuzzy inference system (ANFIS). Section 4 further evaluates the performance of optimal sensors in identifying fuel cell faults, with test data from a practical fuel cell system. From the findings, conclusions are given in Section 5.
2. Development of PEM Fuel Cell Model and Generation of Sensitivity Matrix
2.1. Development of PEM Fuel Cell Model
In this study, sensitivity analysis is used for the sensor selection algorithms, to determine the relationship between sensor outputs and fuel cell failure modes. However, determination of such a relationship using experimental analysis will be very difficult, time-consuming and expensive, as various fuel cell failure modes should be created. Therefore, numerical analysis is taken herein to perform the sensitivity analysis, where a fuel cell model is developed, and model parameters are selected to represent fuel cell failure modes based on the fuel cell failure mechanisms (since different fuel cell failure modes can affect various model parameters and thus the fuel cell performance). With this method, the sensor sensitivities to various fuel cell failure modes can be obtained without complex experimental analysis. Moreover, as sensor sensitivity is obtained by calculating the variation in sensor measurements due to the unit change of model parameter, the results can be used in different fuel cell systems at various operating conditions.
Figure 1 depicts the block diagram of the developed fuel cell model. It can be seen that four modules are used in the fuel cell model to express various behavior of the fuel cell, including anode and cathode mass flow modules determining the flow, pressure, and mass of reactant gases at the anode and cathode sides; the membrane hydration module calculating the membrane resistance and water across the membrane; the stack temperature module updating stack temperature using the first law of thermodynamics; and the stack voltage module determining stack voltage based on results from the other three modules. More details about the developed fuel cell model can be found in previous studies [18,23,24]. From the model, the fuel cell stack voltage can be calculated as:
where is the single cell voltage, is the reversible voltage, , , are the activation loss, fuel crossover loss, mass transport loss, and Ohmic loss, respectively, which can be obtained in different modules in the developed model.
The performance of the developed fuel cell model is evaluated with test data from the fuel cell system in a previous study [24]. With the fuel cell parameters listed in Table 1, the fuel cell model can be developed, and by determining the model parameters, including internal and exchange current densities, mass transport coefficients, membrane resistance, etc., the losses in Equation (1) can be calculated, and fuel cell voltage can then be determined with Equation (1). With this procedure, the polarization curves from the model can be obtained and compared with that from the test; the results are shown in Figure 2.
It can be observed from Figure 2 that the polarization curves from the tested fuel cell can be simulated using the developed model with good quality; the difference of the polarization curve results between simulated and test data is less than 1%.
2.2. Generation of Sensitivity Matrix
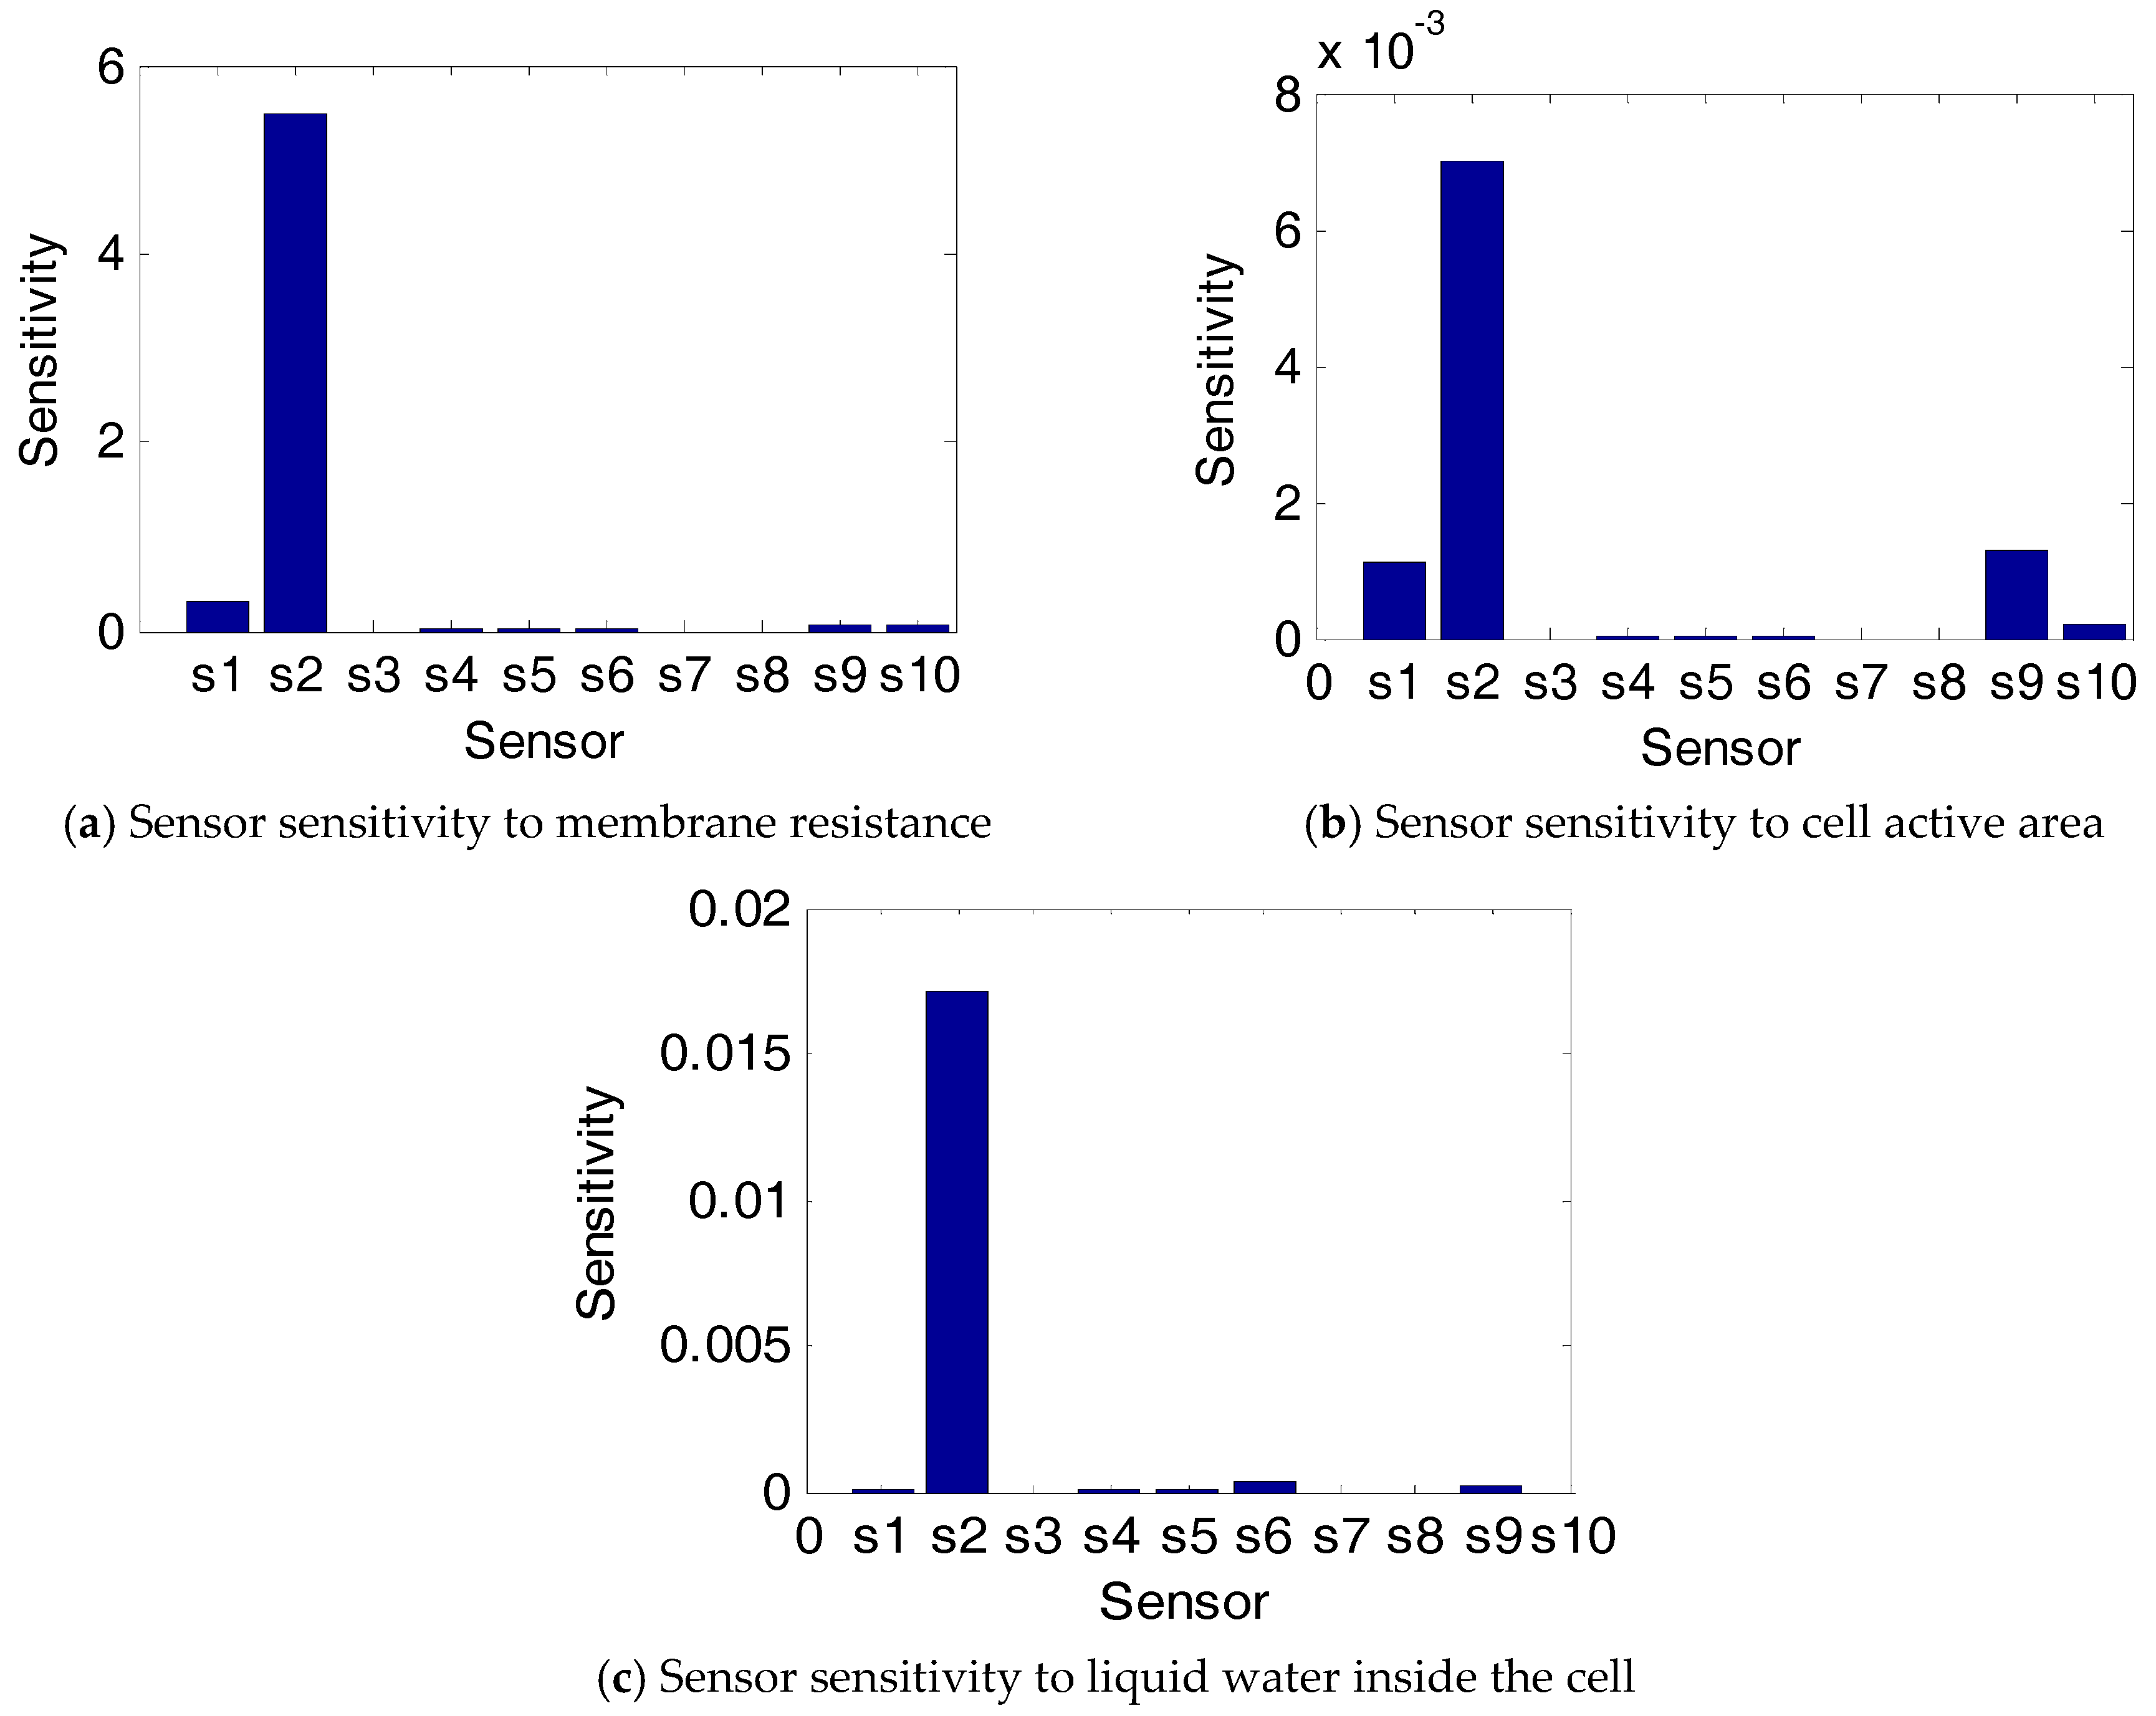
With the developed fuel cell model, the sensor sensitivity to fuel cell performance can be determined. For this purpose, several model parameters critical to the fuel cell performance are selected based on previous studies of fuel cell failure modes and corresponding failure mechanisms [25,26,27]. From the results, three model parameters are determined, including membrane resistance, electrochemical surface area (ECSA), and liquid water inside the fuel cell; the variation in these parameters will cause different fuel cell failure modes.
With determined model parameters, the corresponding sensor sensitivity can be calculated. In the analysis, a unit change (1%) is applied to the model parameters, and the variations in fuel cell responses (sensor measurements) can be obtained, which can be expressed with Equation (2).
where P is the selected model parameter, R is the sensor output, 1 and 2 represent values before and after applying the certain change, is the sensor sensitivity for the model parameter.
It should be noted that multiple fuel cell failure effect is not considered herein, thus in each case, only one health parameter is to be changed.
With Equation (1), sensor sensitivities to various fuel cell parameters can be determined. Table 2 lists the sensors used in the analysis, while Figure 3 depicts the sensor sensitivities to different fuel cell parameters.
It can be seen from Figure 3 that several sensors, such as anode inlet flow, compressor temperature, and coolant inlet flow, have zero sensitivities to the model parameters, indicating that the variation of fuel cell performance due to these parameters cannot change these sensor measurements. Therefore, these sensors should not be used in fuel cell diagnosis and prognosis.
3. Sensor Selection Algorithm and Its Performance in PEM Fuel Cell Performance Prediction
From results in Section 2, the sensors can be ranked based on their sensitivities, and the sensor selection method proposed in [18] is used herein to find optimal sensors. Its performance in predicting fuel cell performance will be investigated using test data from a PEM fuel cell system.
The proposed sensor selection approach in [18] considers both sensor sensitivity and sensor resistance to measurement noise, thus the selected sensors should be more sensitive to the fuel cell performance change and more resistant to the measurement noise. This selection can be made based on Equation (3).
where S is the sensitivity matrix, is the variation in sensor measurements, and is the perturbations in health parameters.
In the selection process, all possible sensor set combinations are considered, and the noise resistance of each sensor set, i.e., in Equation (3), is evaluated as follows. Random noise is generated (1% of the sensor measurement is used herein) and applied to the studied sensor set, the corresponding fuel cell parameter variations can be calculated using Equation (3). This process is then repeated a certain number of times (10 in this study), and the standard deviation of each fuel cell parameter can be calculated and used to form the index SD below.
where p represents the number of fuel cell parameters, and the overall error can be used to evaluate the noise resistance (NR) of the selected sensor set.
From the above analysis, one sensor set with the best noise resistance is selected from each sensor set size, and the results are listed in Table 3.
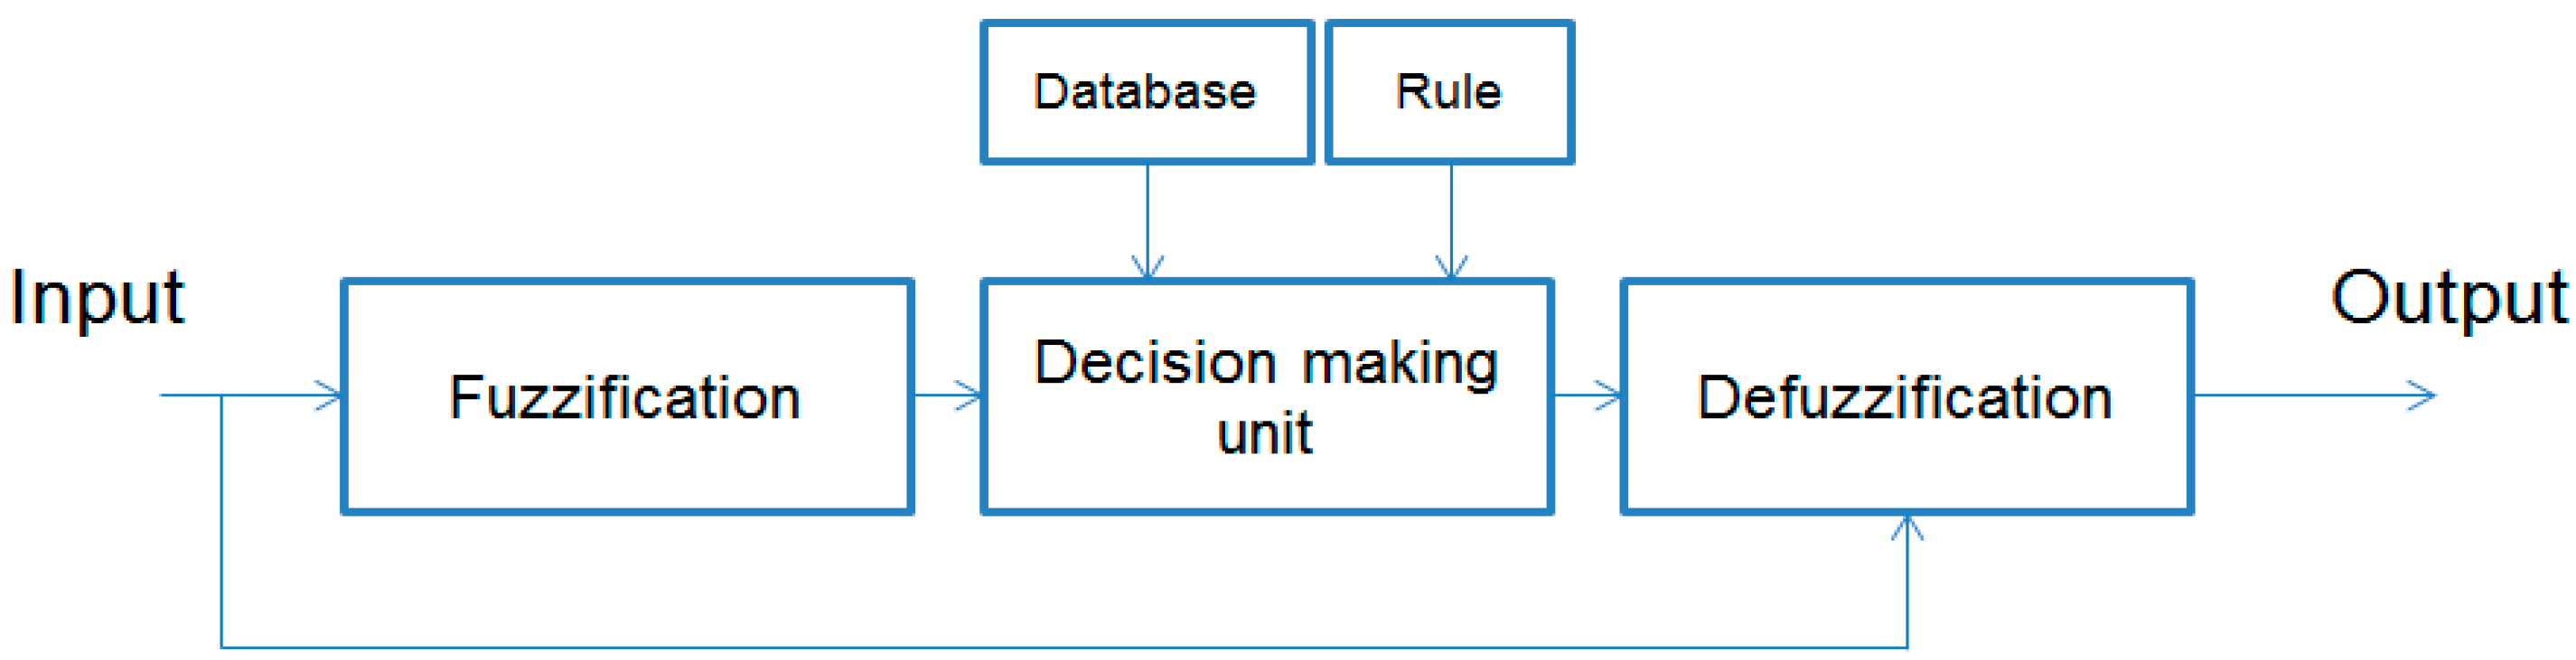
In the study, the adaptive neuro-fuzzy inference system (ANFIS) is used to evaluate the performance of selected sensors, and its general structure is shown in Figure 4. More details about ANFIS can be found in previous research [14,15,17].
In the analysis, the inputs of the ANFIS are the measurements from selected sensors, and the output is the fuel cell voltage. As ANFIS is the multi-step prediction algorithm, the training data must be used for the prediction. In this study, the first two-thirds of the data samples are used to train the ANFIS system, while the last one-third of the data samples are used to validate the performance of selected sensors. It should be mentioned that the PEM fuel cell data from IEEE 2014 data challenge [28] is used herein for searching the optimal sensors, which includes a total of 16 sensors collected from the fuel cell system, including fuel cell voltage, current, inlet and outlet flow/temperature at anode/cathode, etc.
In the evaluation analysis, the size of the sensor set is increased gradually based on Table 3, and the optimal sensors can be determined when further improvement cannot be observed with increase of sensor set size.
Figure 5 evaluates the performance of sensor sets in Table 3, in terms of mean prediction error and computational time. It can be seen clearly that sensor set 3 (contains three sensors listed in Table 3) can represent the fuel cell performance accurately with reasonable computational time. Figure 6 depicts the prediction results using selected sensors. It can be seen that with selected sensors, reliable prediction can be made after the proper training.
4. Performance of Selected Sensors in PEM Fuel Cell Fault Diagnosis
4.1. Description of PEM Fuel Cell Test
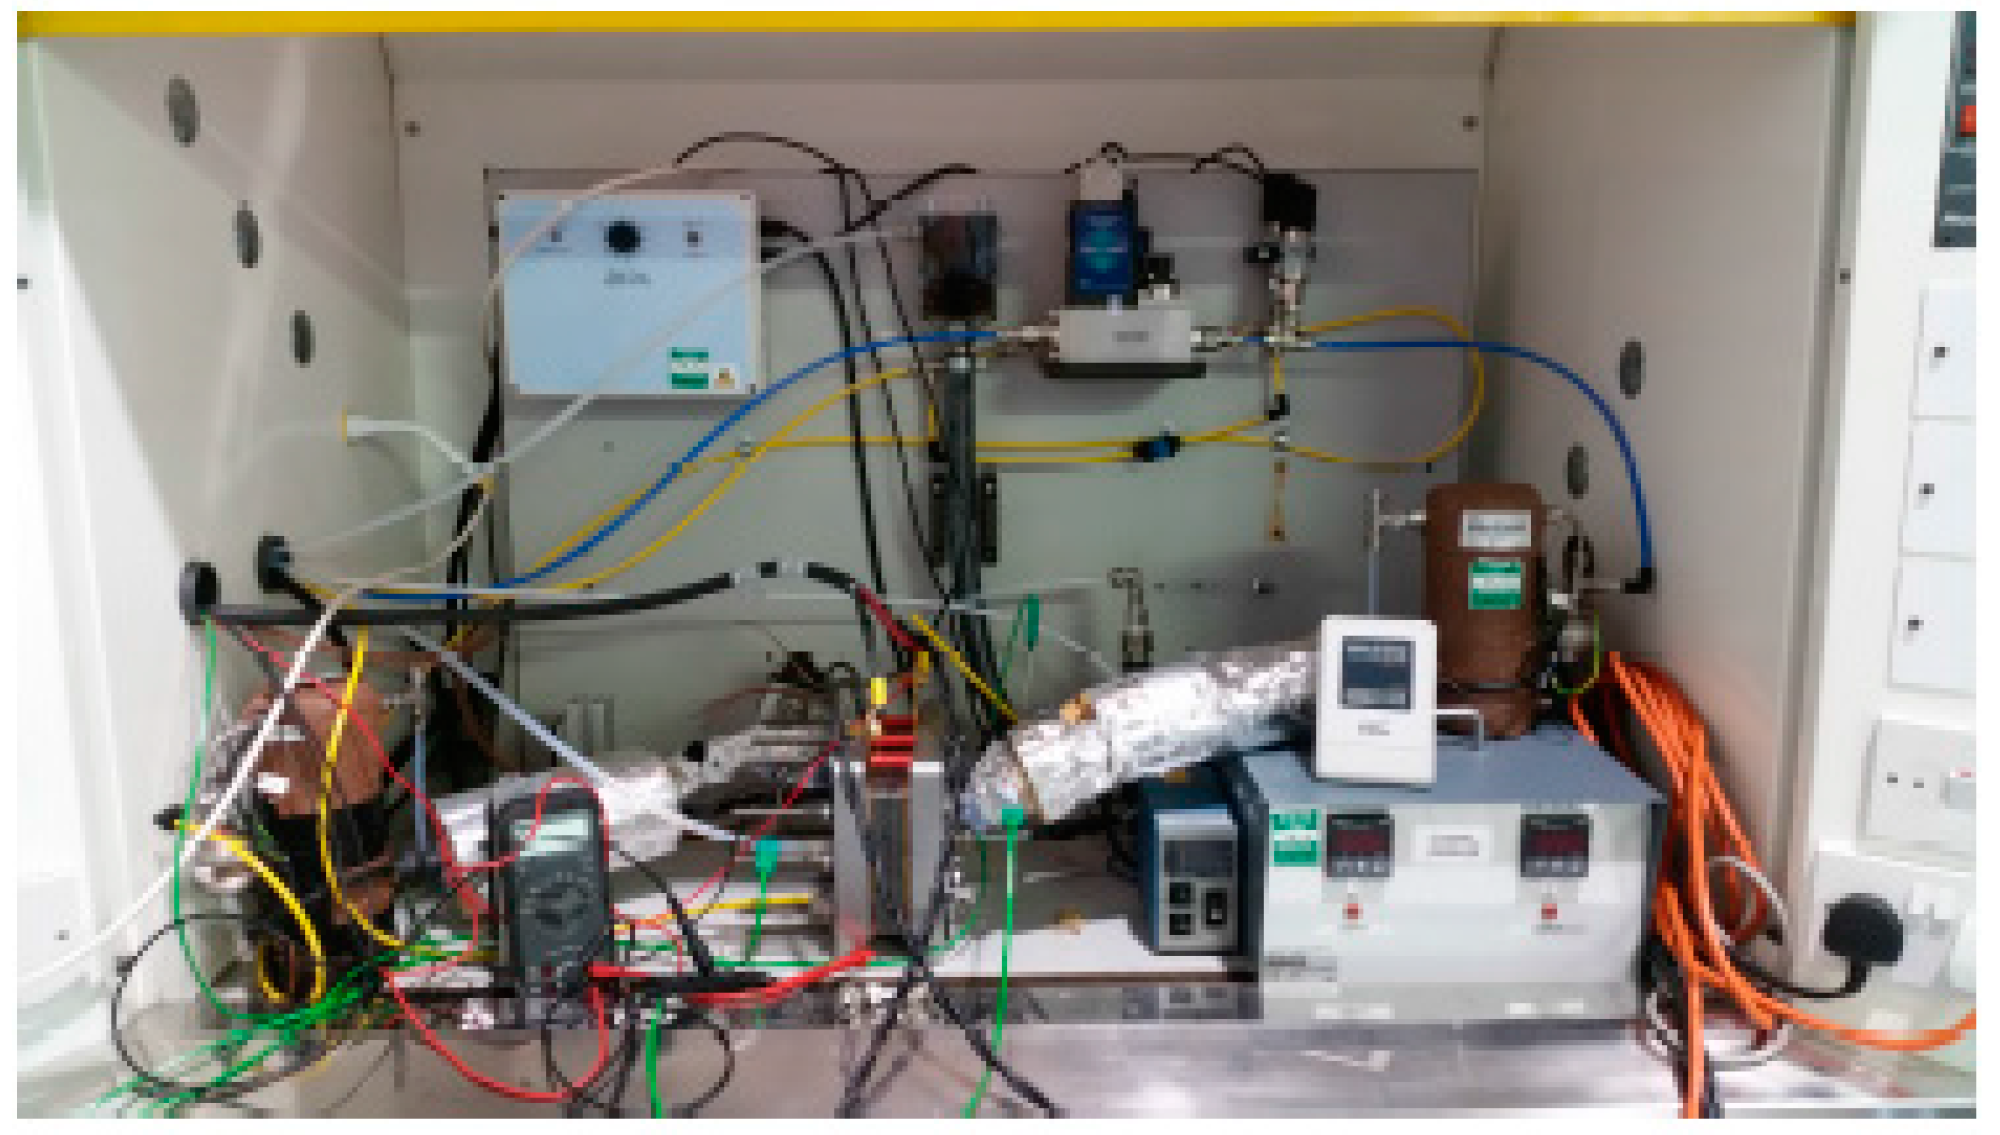
In this section, a PEM fuel cell test will be designed to investigate the performance of selected optimal sensors in identifying fuel cell faults. For this purpose, a test rig with capability of 80 W is used, which contains a fuel cell stack, air and hydrogen supply systems, and a cooling system, which is depicted in Figure 7.
In the study, a cell with active area of 100 is used, which is manufactured by Pragma Industries using the same materials and technologies as commercial PEM fuel cells, such as Nafion polymer electrolyte membrane, platinum nano-particle catalyst, carbon diffusion materials, silicone sealing gaskets, and graphite flow field plates. Table 4 lists the technical details of the PEM fuel cell test and Table 5 lists the sensors used in the test for the following analysis.
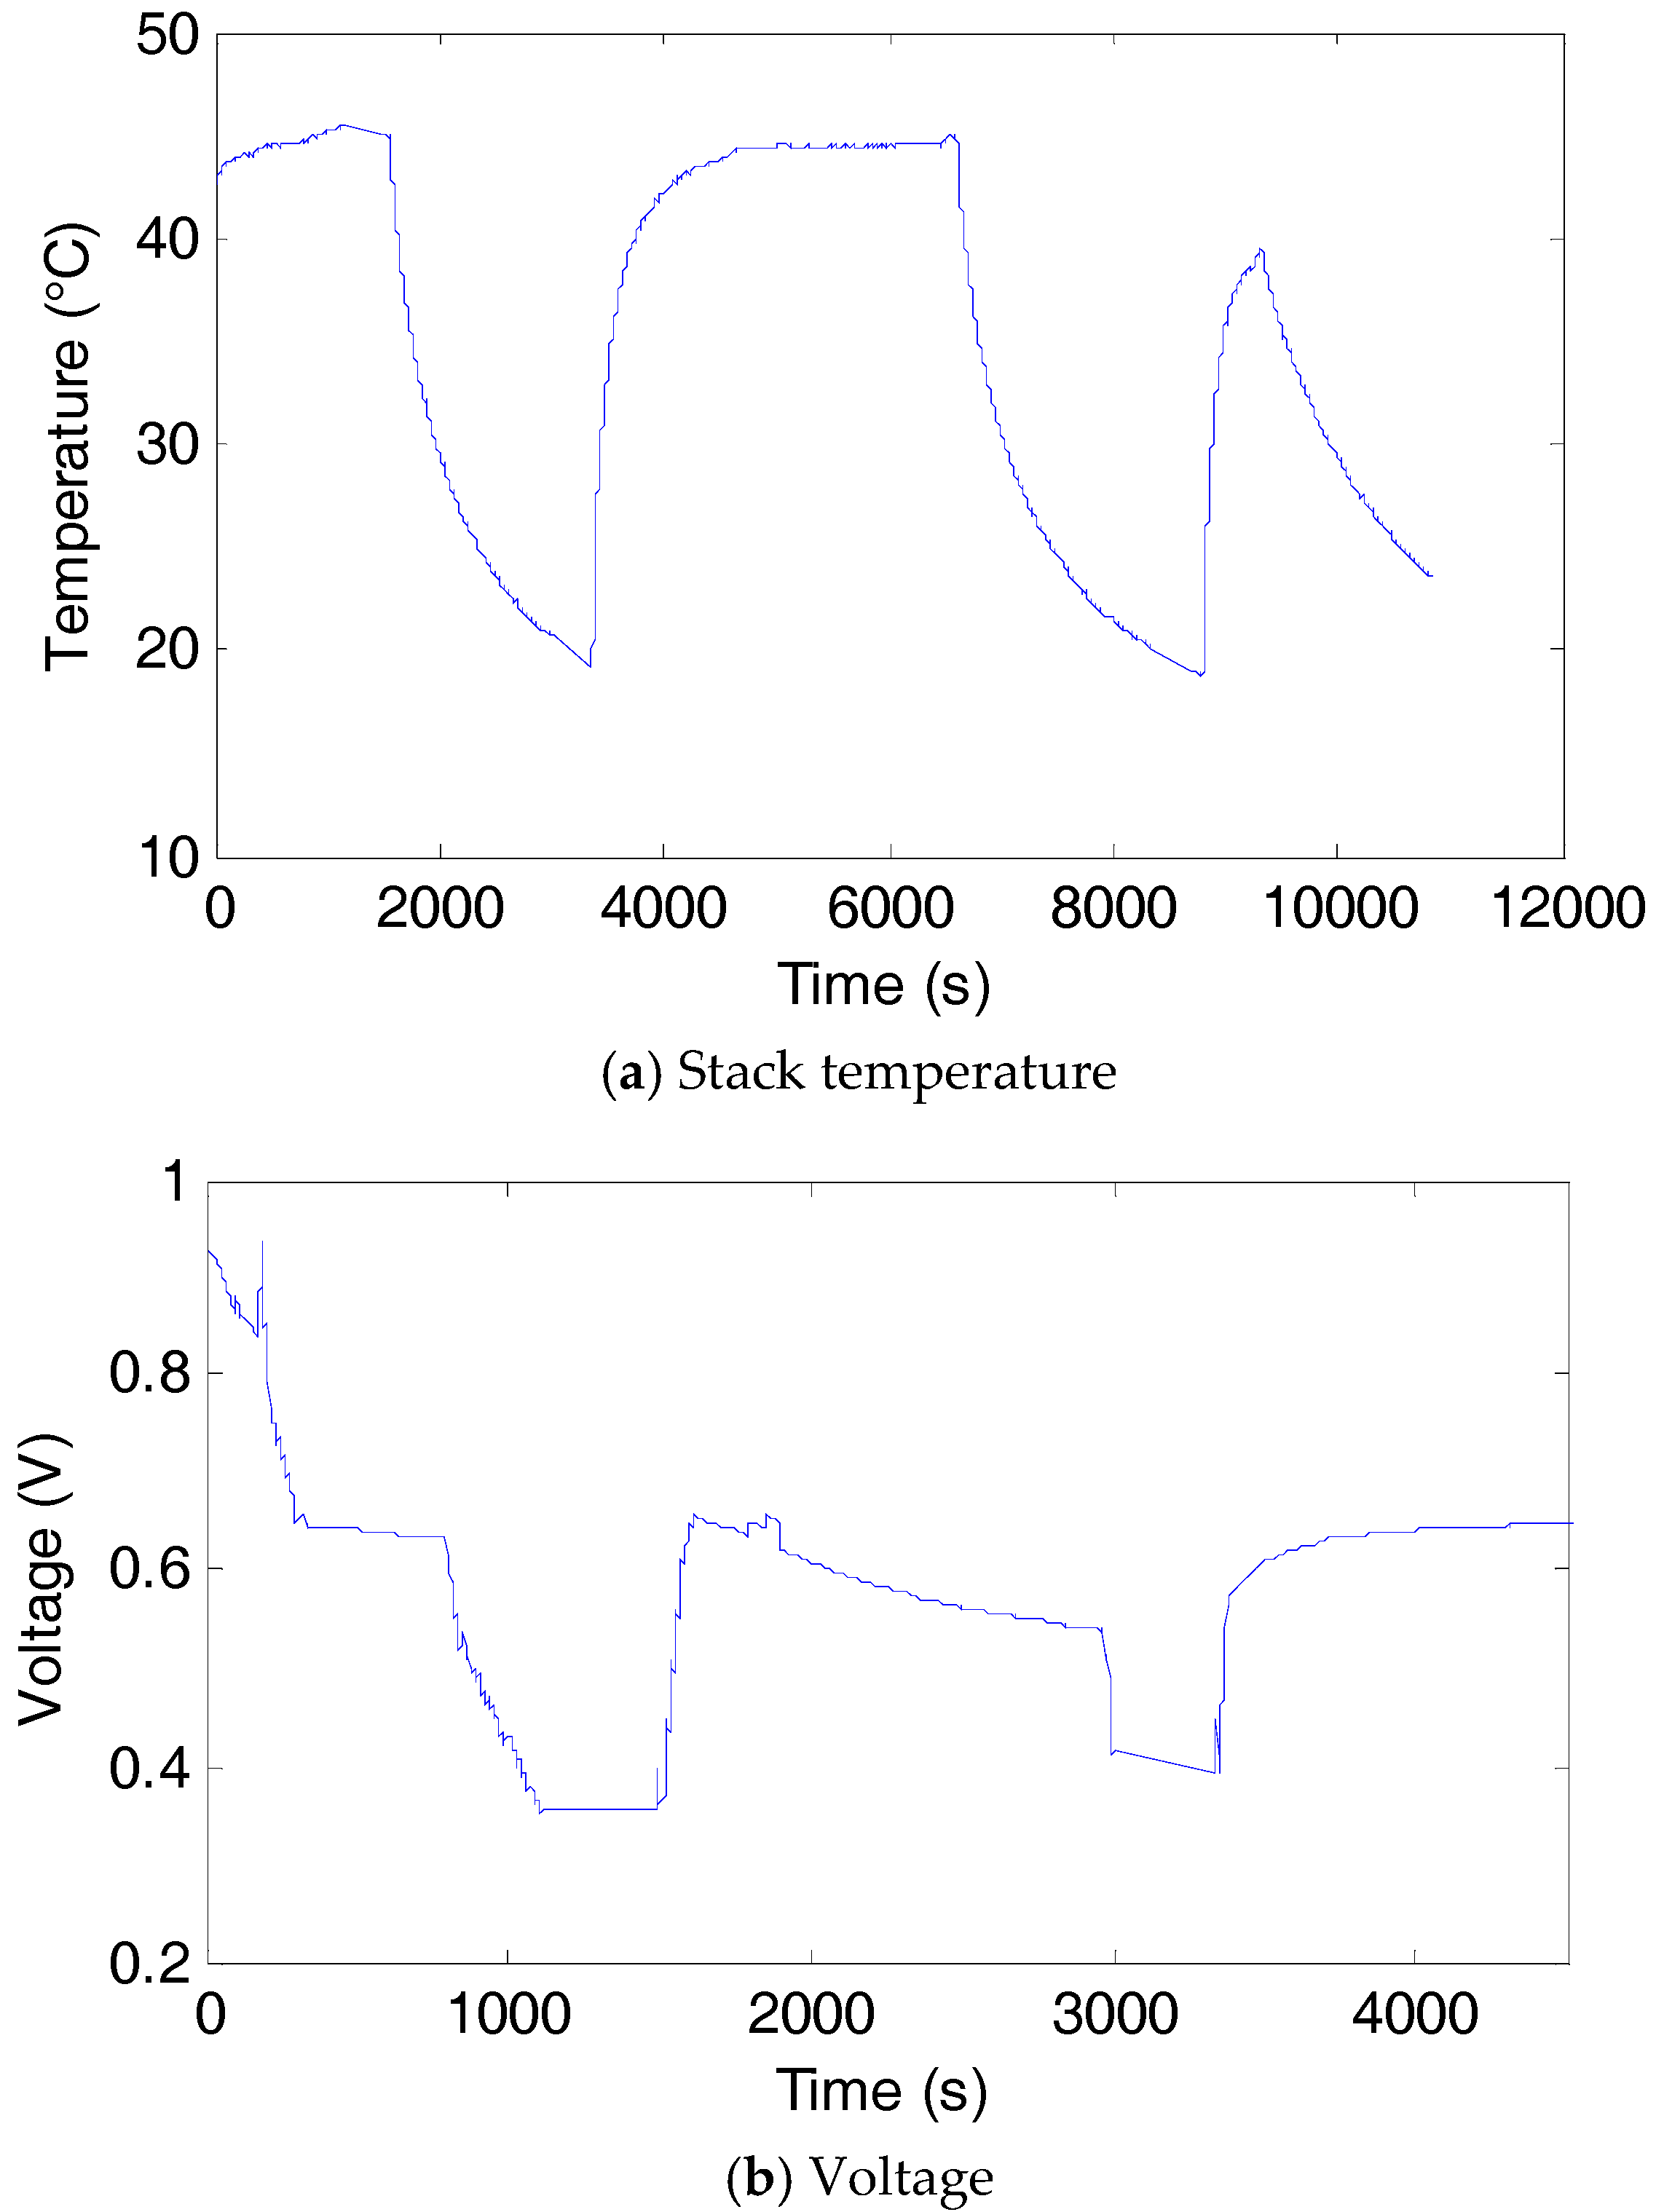
As the PEM fuel cell test is used to investigate the performance of the selected sensor in fault diagnosis, fuel cell fault should be “activated” during the test. Fuel cell flooding is selected in the current study, as water management is extremely important in the PEM fuel cell normal operation, and fuel cell flooding can cause fast degradation to the system performance [29]. During the test, the PEM fuel cell stack is firstly operated at the nominal operating condition, then the stack temperature is reduced gradually to accelerate the liquid water accumulation and thus flooding, which can be confirmed with a clear fuel cell voltage drop. Finally, the temperature is increased to remove the flooding effect and recover the fuel cell performance. Figure 8 illustrates this procedure with load current density and fuel cell stack voltage, where the periods between about 1000 and 1400 s, and 3000 and 3300 s are the time when the polarization curve is collected. It should be mentioned that the fuel cell voltage drop at the beginning of the test is due to the instability of the fuel cell system; after the certain time (about 300 s in the test), the fuel cell system reaches the stable operation stage.
Moreover, the performance of the developed model shown in Figure 1 in simulating fuel cell performance under the flooding scenario is illustrated. It is known that with fuel cell flooding, the accumulated liquid water will block the catalyst layer, gas diffusion layer and flow channel; this can be simulated with the developed model by increasing the mass transport coefficients, which can increase the mass transport loss in Equation (1). Figure 9 depicts the comparison of the polarization curves from the test and the developed model. It can be seen that by updating the model parameters (mass transport coefficients herein), the developed model can simulate the fuel cell performance in the flooding scenario with good quality.
In the next section, the performance of optimal sensors in fuel cell fault diagnosis will be investigated using data-driven approaches, and the results will be compared with those using all available sensors.
4.2. PEM Fuel Cell Fault Diagnosis
Since sensor measurements collected from the PEM fuel cell system are used for the fault diagnosis, data-driven diagnostic approaches are used in the study. Due to the collection of information from multiple sensors, kernel principal component analysis (KPCA) is used to reduce the dimension of collected dataset. Compared to principal component analysis (PCA), KPCA can give better performance in nonlinear systems [30]. Wavelet packet transform is then applied to extract the wavelet coefficients and generate features, and singular value decomposition (SVD) is utilized to determine the features containing the most useful information for the state classification. More details about these approaches can be found in previous studies [13,31]. Figure 10 depicts the flowchart of data-driven approaches used herein.
The diagnostic performance using all available sensors listed in Table 5 is firstly investigated; as the purpose of the analysis is to identify the fuel cell flooding, only the test data at higher load current density is studied, i.e., the fuel cell system operates under the steady state condition. In the analysis, each sensor measurement is divided into segments with 700 sample points, which corresponds to about 3 min operation. The selection of 700 sample points is based on the degradation rate from the flooding (0.39 V/h); 3 min operation in the flooding state can cause a voltage drop of about 0.019 V, which cannot lead to significant performance degradation and can thus be regarded as the early/medium stage fault. Moreover, three states are defined in the study: voltage drop less than 5% is defined as normal state, voltage drop between 5% and 10% is defined as transition state, while voltage drop larger than 10% is defined as flooding state.
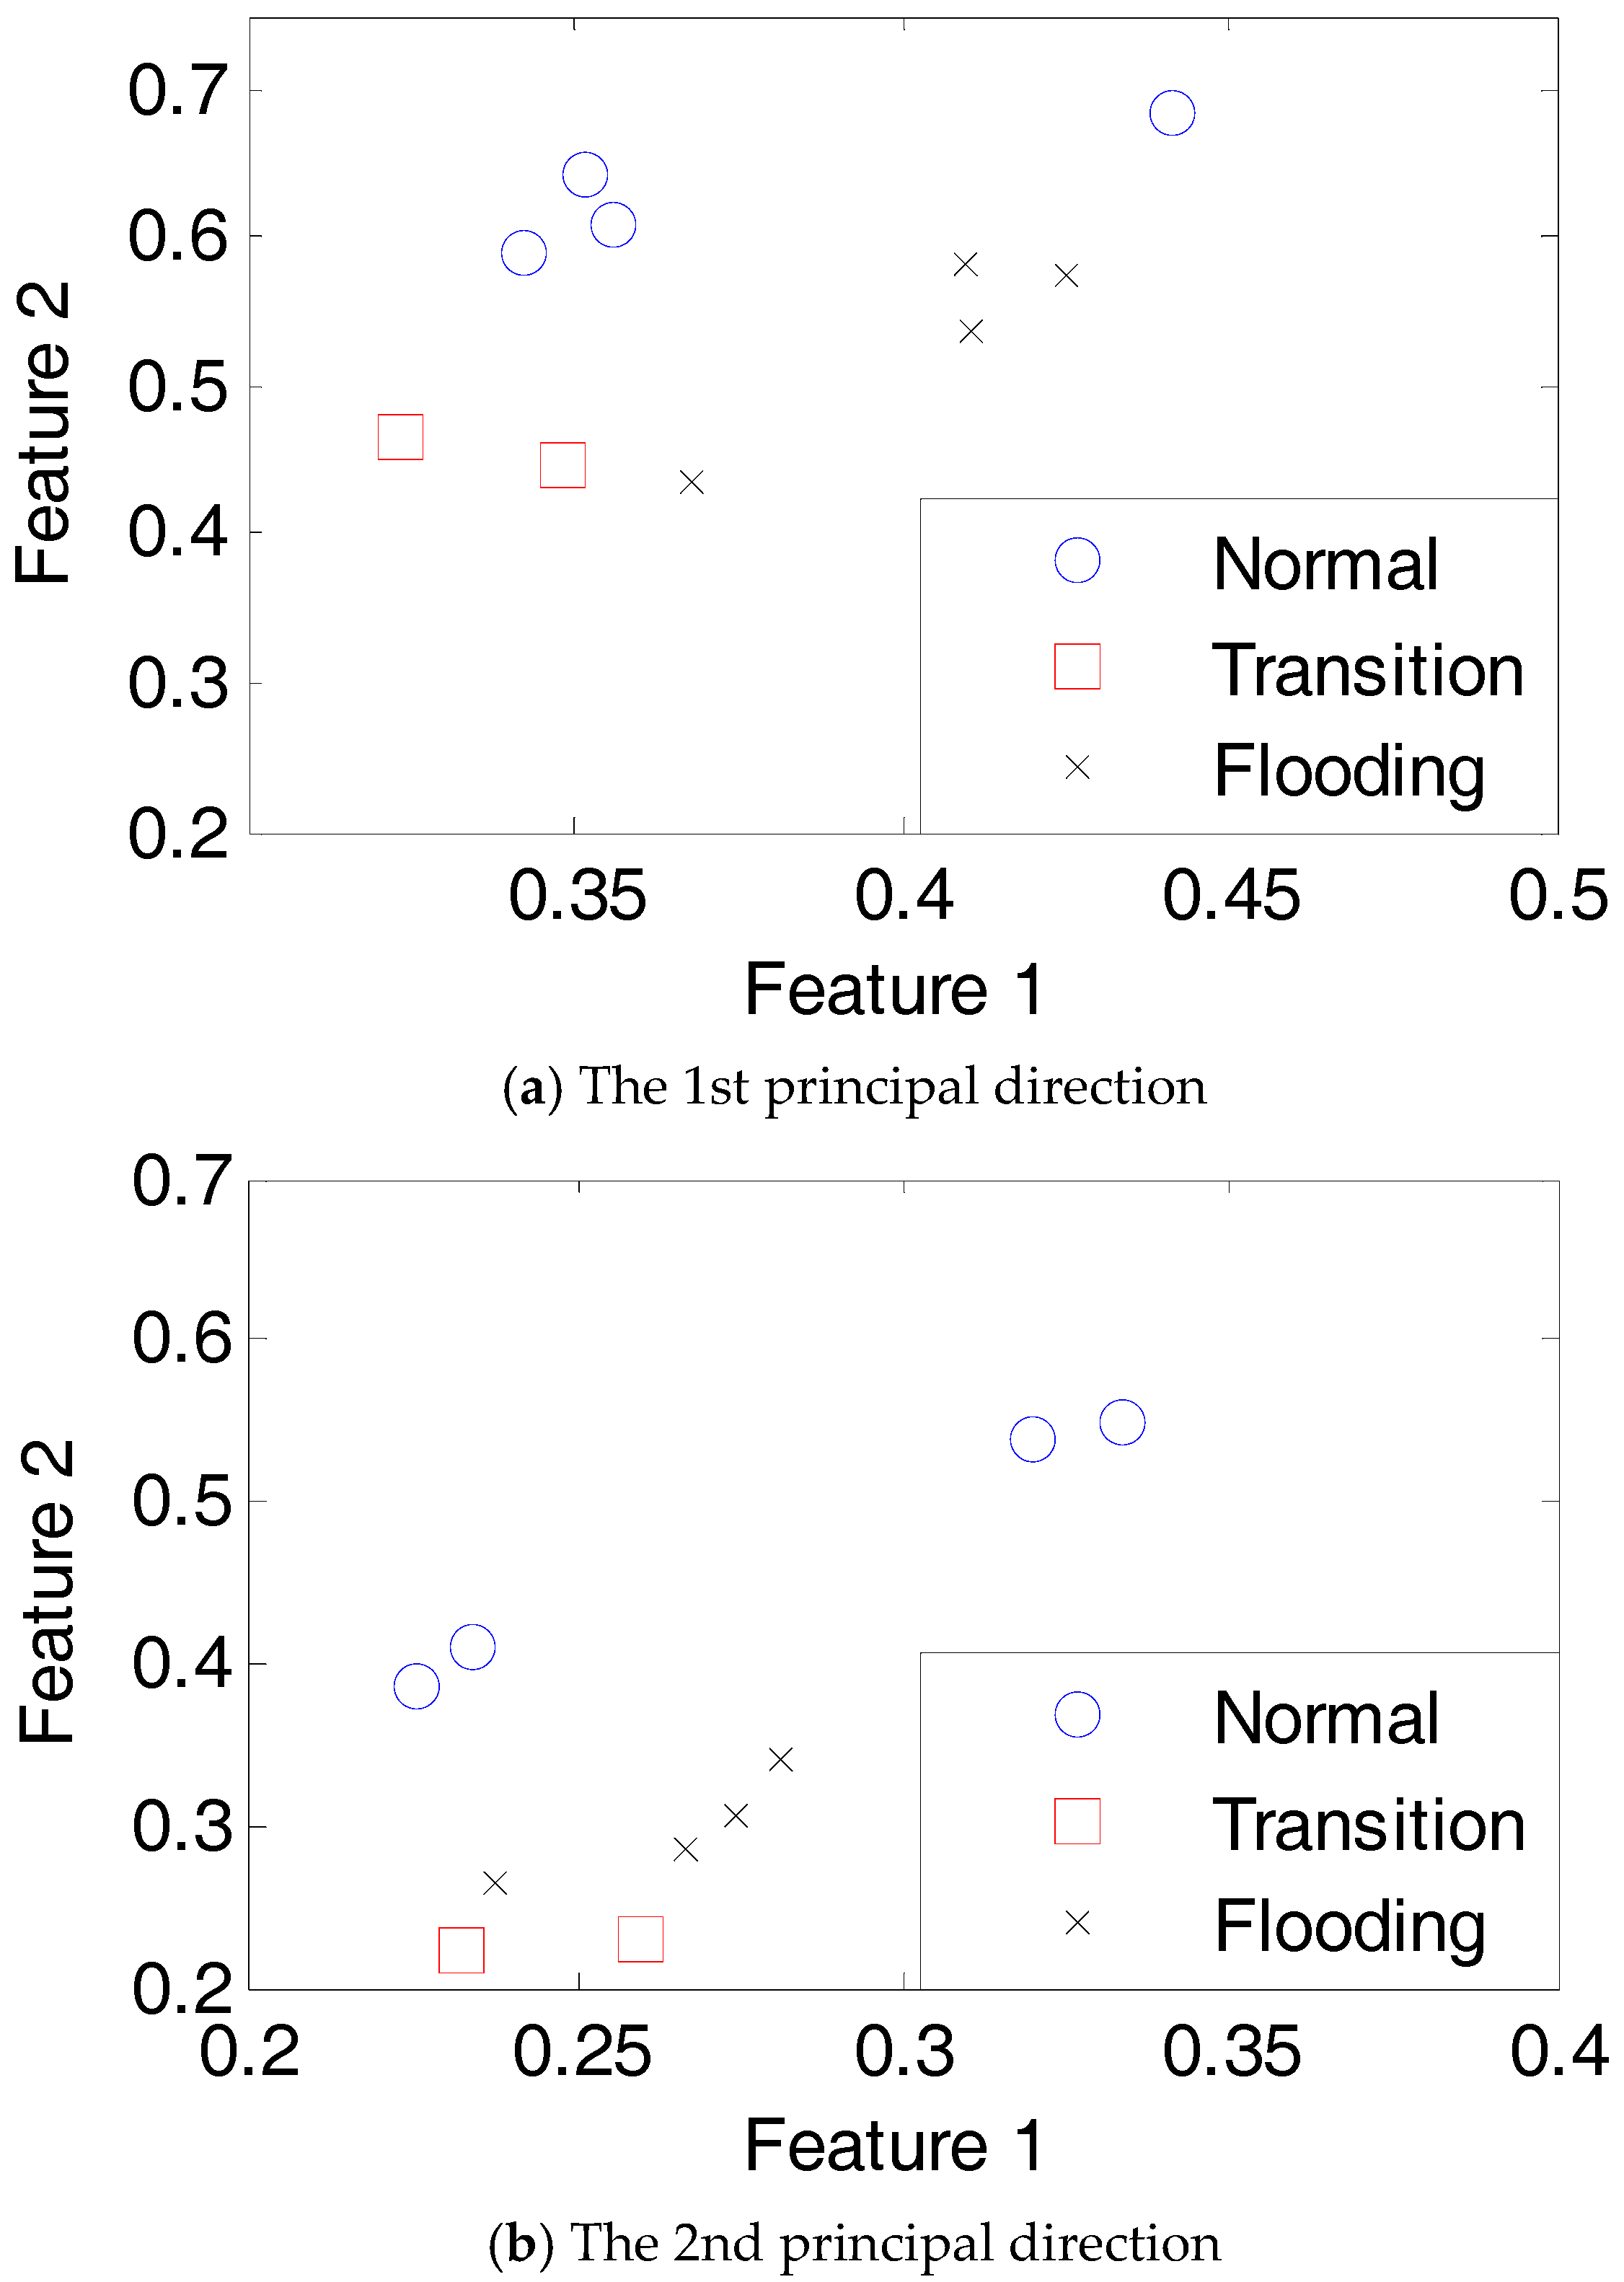
The data-driven diagnostic procedure shown in Figure 10 is applied to the dataset containing all available sensors, and the diagnostic results are shown in Figure 11. It should be noted that with KPCA, the original dataset is projected to the first two principal directions, thus the diagnostic results of these two principal directions can be obtained.
It can be seen from the above figure that using all available sensors, the three states cannot be classified clearly, and the test data samples representing normal and flooding states do not cluster together, indicating that more sensor information may not provide better diagnostic performance; this further highlights the necessity of using selected sensors for reliable fault diagnosis.
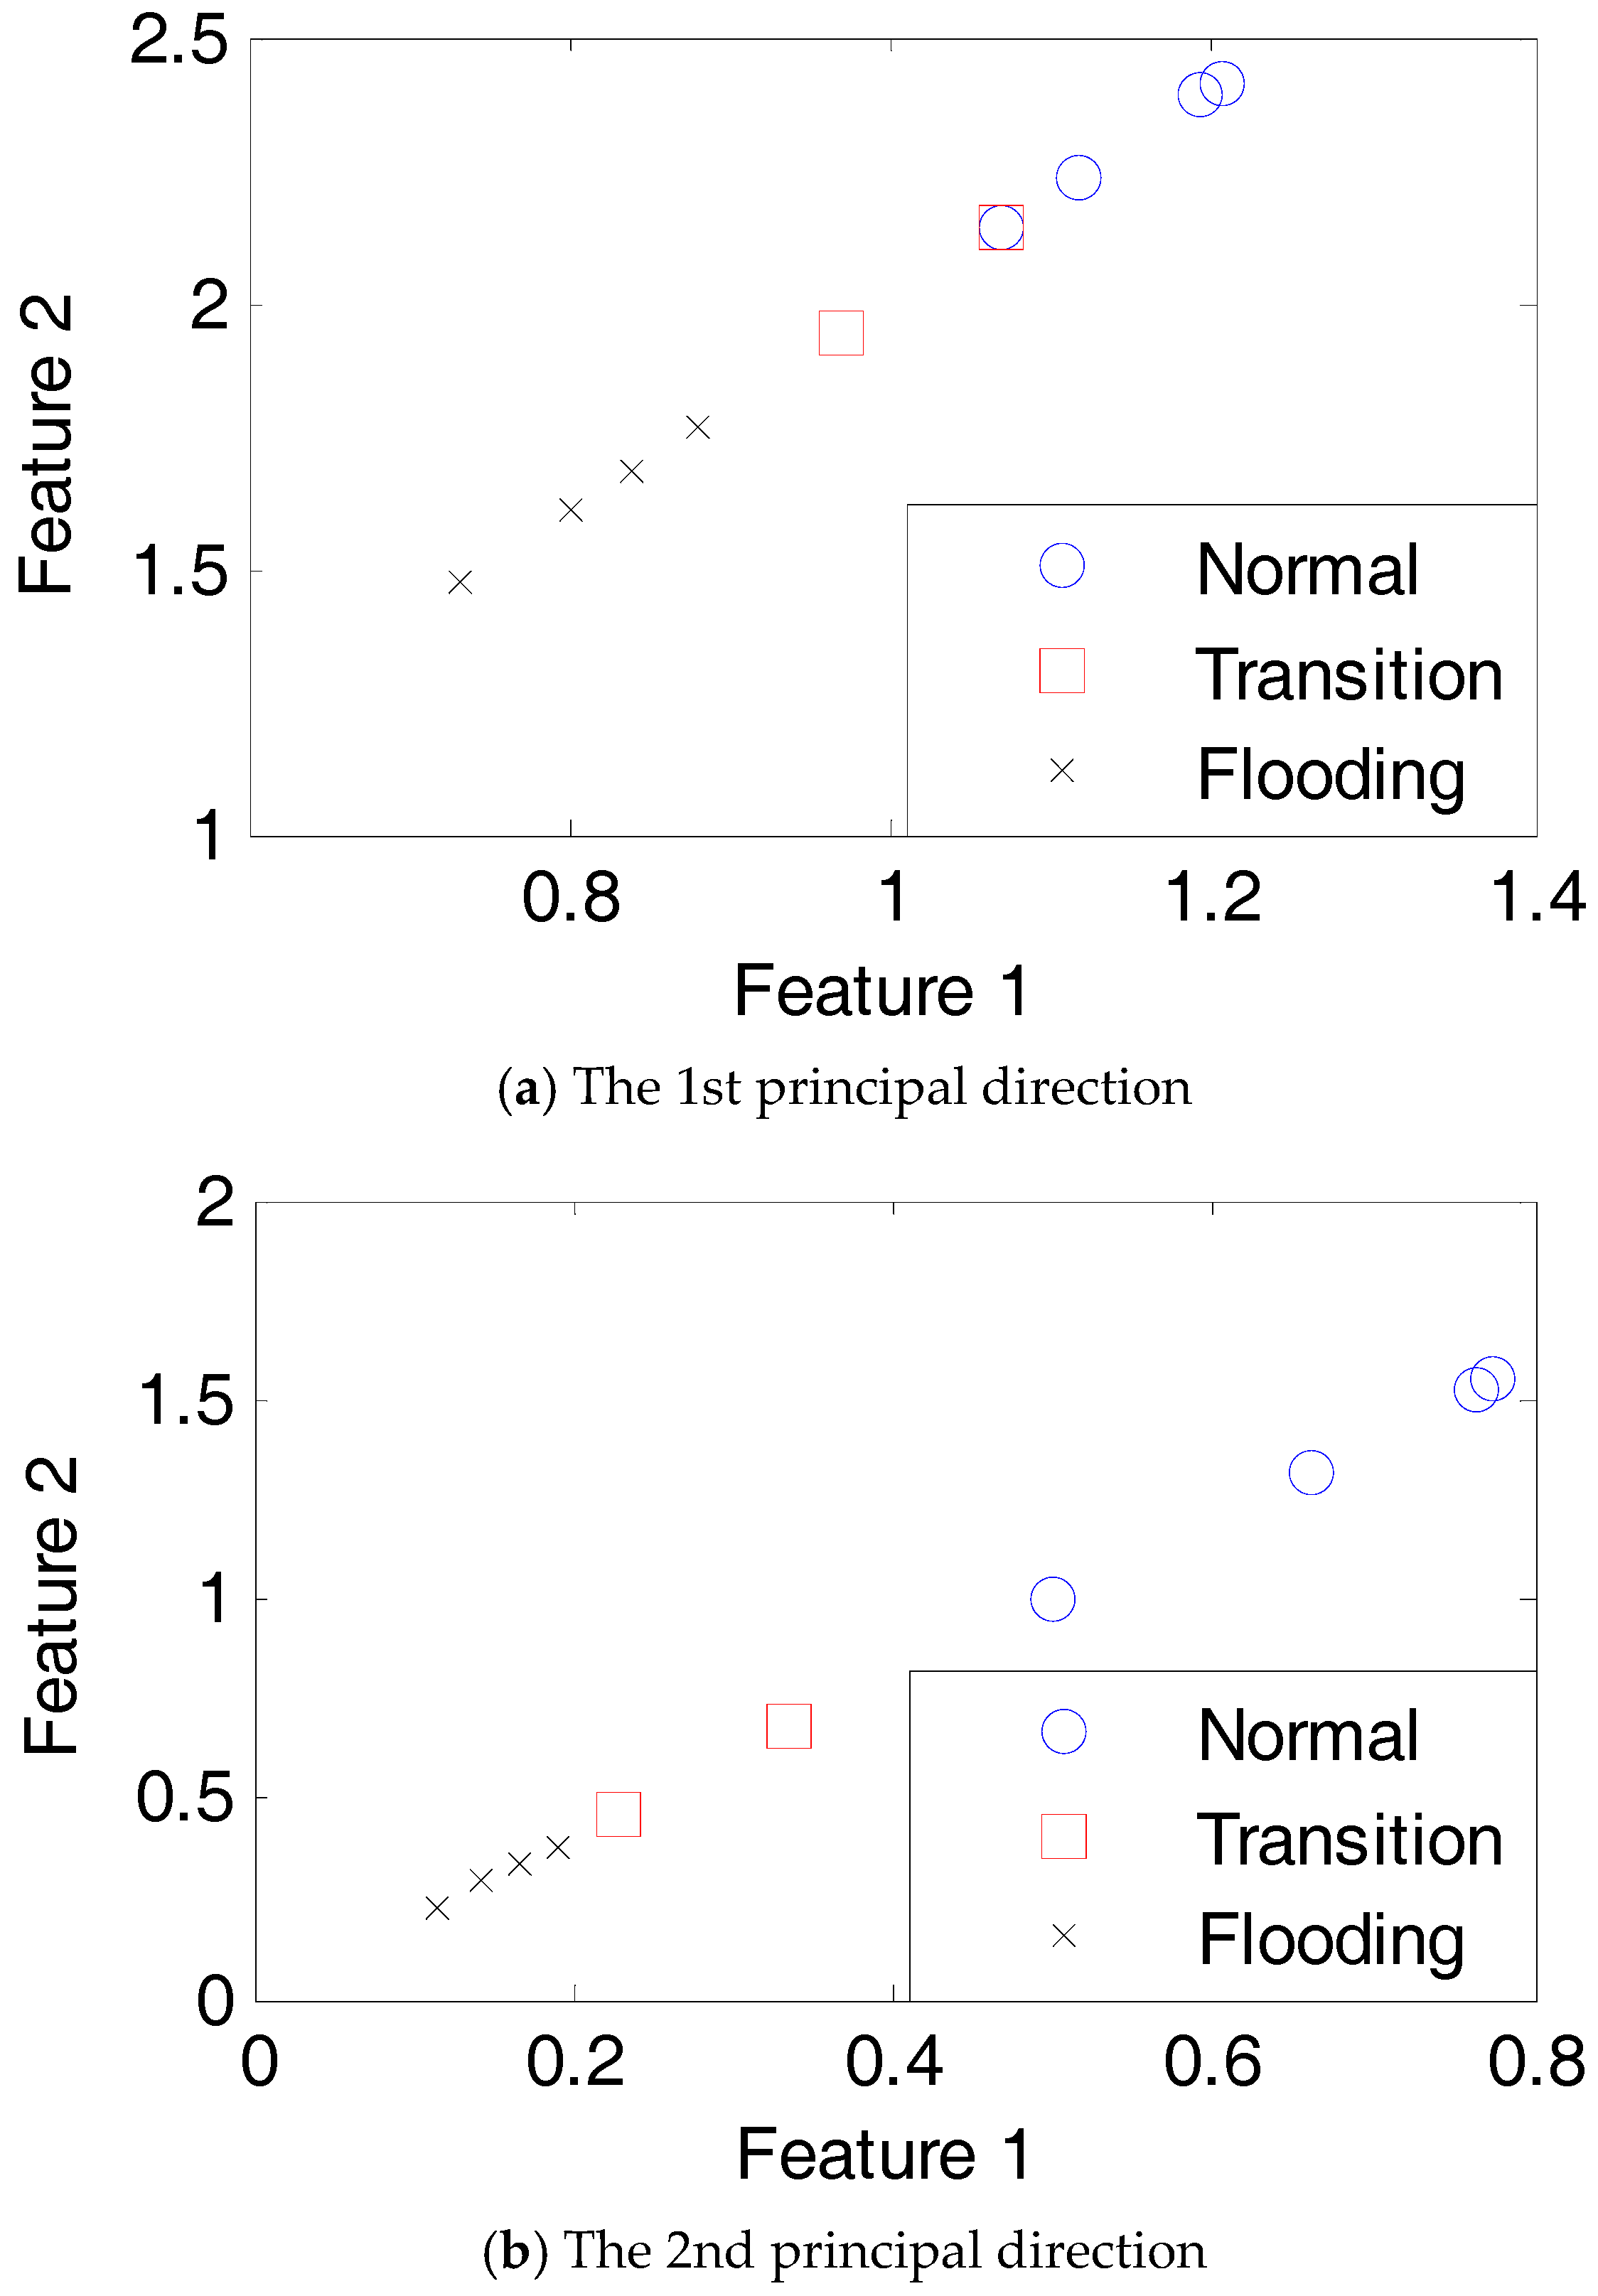
Figure 12 depicts the diagnostic results using the selected optimal sensors from Section 3. For the purpose of better comparison, the same diagnostic procedure is used and the original dataset containing three sensor measurements is projected into the first two principal directions.
From the above figure, all three states can be classified clearly by using the selected sensors, indicating that fuel cell faults can be identified effectively with selected sensors. Moreover, transition and flooding states can be discriminated, which means that by using selected sensors and a data-driven diagnostic procedure, fuel cell faults at different levels can also be identified, which will be beneficial for better understanding of the fuel cell state and design of mitigation strategies.
5. Conclusions
This paper investigated the application of the sensor selection approach in fuel cell PHM. The performance of a sensor selection technique in predicting PEM fuel cell performance was studied. Moreover, the performance of selected sensors in PEM fuel cell fault diagnosis was investigated using test data from a PEM fuel cell system, and the results are compared with those using all available sensors.
The sensor selection approach used in this study is based on the sensor sensitivities and sensor resistance to measurement noises; thus, a selected sensor set would have better sensitivity to the PEM fuel cell performance variation and can better resist measurement noise. Results show that with selected sensors, reliable fuel cell performance can be predicted, and compared to predictions using more sensors, computational time can be reduced significantly using selected sensors while a reliable prediction can still be obtained. Moreover, with data-driven approaches which are commonly used for system fault diagnosis, the optimal sensors can provide better diagnostic performance than that with all the sensors, and fuel cell faults at different levels can be classified with good quality; as computational time can be reduced significantly using fewer sensors, the sensor selection techniques can be applied in practical PEM fuel cell systems for on-line health monitoring purposes.
Acknowledgments
This work is supported by grant EP/K02101X/1 for Loughborough University, Department of Aeronautical and Automotive Engineering from the UK Engineering and Physical Sciences Research Council (EPSRC). Authors also acknowledge Intelligent Energy for its close collaboration in providing necessary information for the paper.
Author Contributions
Lei Mao developed PEM fuel cell model and performed numerical analysis, analyzed the data, and wrote the paper; Ben Davies designed and performed the experiments; Lisa Jackson contributed analysis ideas and polished the paper.
Conflicts of Interest
The authors declare no conflict of interest.
References
- Lebold, M.; Reichard, K.; Boylan, D. Utilizing DCOM in an open system architecture framework for machinery monitoring and diagnostics. In Proceedings of the 2003 IEEE Aerospace Conference, Big Sky, MT, USA, 8–15 March 2003; Volume 3, pp. 1227–1236. [Google Scholar]
- Jouin, M.; Gouriveau, R.; Hissel, D.; Pera, M.C.; Zerhouni, N. Prognostics and health management of PEMFC—State of the art and remaining challenges. Int. J. Hydrog. Energy 2013, 38, 15307–15317. [Google Scholar] [CrossRef] [Green Version]
- Lee, J.; Wu, F.; Zhao, W.; Ghaffari, M.; Liao, L.; Siegel, D. Prognostics and health management design for rotary machinery systems—Review, methodology and applications. Mech. Syst. Signal Process. 2014, 42, 314–334. [Google Scholar] [CrossRef]
- Fouquet, N.; Doulet, C.; Nouillant, C.; Tanguy, G.D.; Bouamama, B.O. Model based PEM fuel cell state-of-health monitoring via ac impedance measurements. J. Power Sources 2006, 159, 905–913. [Google Scholar] [CrossRef]
- Riascos, L.A.M.; Simoes, M.G.; Miyagi, P.E. On-line fault diagnostic system for proton exchange membrane fuel cells. J. Power Sources 2008, 175, 419–429. [Google Scholar] [CrossRef]
- Rubio, M.A.; Urquia, A.; Dormido, S. Diagnosis of performance degradation phenomenon in PEM fuel cells. Int. J. Hydrog. Energy 2010, 35, 2586–2590. [Google Scholar] [CrossRef]
- Zeller, A.; Rallieres, O.; Regnier, J.; Turpin, C. Diagnosis of a hydrogen/air fuel cell by a statistical model-based method. In Proceedings of the Vehicle Power and Propulsion Conference (VPPC), Lille, France, 1–3 September 2010. [Google Scholar]
- Petrone, R.; Zheng, Z.; Hissel, D.; Pera, M.C.; Pianese, C.; Sorrentino, M.; Becherif, M.; Steiner, N.Y. A review on model-based diagnosis methodologies for PEMFCs. Int. J. Hydrog. Energy 2013, 38, 7077–7091. [Google Scholar] [CrossRef]
- Ramschak, E.; Peinecke, V.; Prenninger, P.; Schaffer, T.; Hacker, V. Detection of fuel cell critical status by stack voltage analysis. J. Power Sources 2006, 157, 837–840. [Google Scholar] [CrossRef]
- Placca, L.; Kouta, R.; Candusso, D.; Blachot, J.F.; Charon, W. Analysis of PEM fuel cell experimental data using principle component analysis and multi linear regression. Int. J. Hydrog. Energy 2010, 35, 4582–4591. [Google Scholar] [CrossRef] [Green Version]
- Steiner, N.Y.; Hissel, D.; Mocoteguy, P.; Candusso, D. Non intrusive diagnosis of polymer electrolyte fuel cells by wavelet packet transform. Int. J. Hydrog. Energy 2011, 36, 740–746. [Google Scholar] [CrossRef]
- Taniguchi, A.; Akita, T.; Yasuda, K.; Miyazak, Y. Analysis of electrocatalyst degradation in PEMFC caused by cell reversal during fuel starvation. J. Power Sources 2011, 130, 42–49. [Google Scholar] [CrossRef]
- Zheng, Z.; Petrone, R.; Pera, M.C.; Hissel, D.; Becherif, M.; Steiner, N.Y.; Sorrentino, M. A review on non-model based diagnosis methodologies for PEM fuel cell stacks and systems. Int. J. Hydrog. Energy 2013, 38, 8914–8926. [Google Scholar] [CrossRef]
- Vural, Y.; Ingham, D.B.; Pourkashanian, M. Performance prediction of a proton exchange membrane fuel cell using the ANFIS model. Int. J. Hydrog. Energy 2009, 34, 9181–9187. [Google Scholar] [CrossRef]
- Becker, S.; Karri, V. Predictive models for PEM-electrolyzer performance using adaptive neuro-fuzzy inference systems. Int. J. Hydrog. Energy 2010, 35, 9963–9972. [Google Scholar] [CrossRef]
- Jouin, M.; Gouriveau, R.; Hissel, D.; Pera, M.C.; Zerhouni, N. Prognostics of PEM fuel cell in a particle filtering framework. Int. J. Hydrog. Energy 2013, 39, 481–494. [Google Scholar] [CrossRef]
- Silva, R.E.; Gouriveau, R.; Jemei, S.; Hissel, D.; Boulon, L.; Agbossou, K.; Steiner, N.Y. Proton exchange membrane fuel cell degradation prediction based on adaptive neuro-fuzzy inference systems. Int. J. Hydrog. Energy 2014, 39, 11128–11144. [Google Scholar] [CrossRef] [Green Version]
- Mao, L.; Jackson, L. Selection of optimal sensors for predicting performance of polymer electrolyte membrane fuel cell. J. Power Sources 2016, 328, 151–160. [Google Scholar] [CrossRef]
- Sowers, T.S.; Kopasakis, G.; Simon, D.L. Application of the systematic sensor selection strategy for turbofan engine diagnostics. In Proceedings of the Turbo Expo 2008 Gas Turbine Technical Congress and Exposition, Berlin, Germany, 9–13 June 2008. [Google Scholar]
- Simon, D.L.; Garg, S. A systematic approach to sensor selection for aircraft engine health estimation. In Proceedings of the 19th ISABE conference, Montreal, QC, Canada, 7–11 September 2009. [Google Scholar]
- Yang, S.; Qiu, J.; Liu, G. Sensor optimization selection model based on testability constraint. Chin. J. Aeronaut. 2012, 25, 262–268. [Google Scholar]
- Lyu, K.; Tan, X.; Liu, G.; Zhao, C. Sensor selection of helicopter transmission systems based on physical model and sensitivity analysis. Chin. J. Aeronaut. 2014, 27, 643–654. [Google Scholar] [CrossRef]
- Pukrushpan, J.T. Modeling and Control of Fuel Cell Systems and Fuel Processors. Ph.D. Thesis, The University of Michigan, Ann Arbor, MI, USA, 2003. [Google Scholar]
- Khan, M.J.; Lqbal, M.T. Modelling and analysis of electro-chemical, thermal, and reactant flow dynamics for a PEM fuel cell system. Fuel Cells 2005, 5, 463–475. [Google Scholar] [CrossRef]
- Rod, B.; Jeremy, M.; Bryan, P.; Yu, S.K.; Rangachary, M.; Nancy, G.; Deborah, M.; Mahlon, W.; Fernando, G.; David, W.; et al. Scientific aspects of polymer electrolyte fuel cell durability and degradation. Chem. Rev. 2007, 107, 3904–3951. [Google Scholar]
- Rama, P.; Chen, R.; Andrews, J. A review of performance degradation and failure modes for hydrogen-fuelled polymer electrolyte fuel cells. Proc. Inst. Mech. Eng. Part A J. Power Energy 2008, 222, 421–441. [Google Scholar] [CrossRef] [Green Version]
- Wu, J.; Yuan, X.Z.; Martin, J.J.; Wang, H.; Zhang, J.; Shen, J.; Wu, S.; Merida, W. A review of PEM fuel cell durability: Degradation mechanisms and mitigation strategies. J. Power Sources 2008, 184, 104–119. [Google Scholar] [CrossRef]
- FCLAB Research. IEEE PHM Data Challenge 2014. Available online: http://eng.fclab.fr/ieee-phm-2014-data-challenge/ (accessed on 6 July 2014).
- Canut, J.M.L.; Abouatallah, R.M.; Harrington, D.A. Detection of membrane drying, fuel cell flooding, and anode catalyst poisoning on PEMFC stacks by electrochemical impedance spectroscopy. J. Electrochem. Soc. 2006, 153, 857–864. [Google Scholar] [CrossRef]
- Wu, Y.; Zhang, D.; Song, F.; Yang, J.Y.; Jing, Z.; Li, M. A method for speeding up feature extraction based on KPCA. Neurocomputing 2007, 70, 1056–1061. [Google Scholar]
- Mao, L.; Jackson, L.; Dunnett, S.J. Fault diagnosis of practical polymer electrolyte membrane (PEM) fuel cell system with data-driven approaches. Fuel Cells 2017, 17, 247–258. [Google Scholar] [CrossRef]
Figure 1.
Block diagram of the developed fuel cell model.
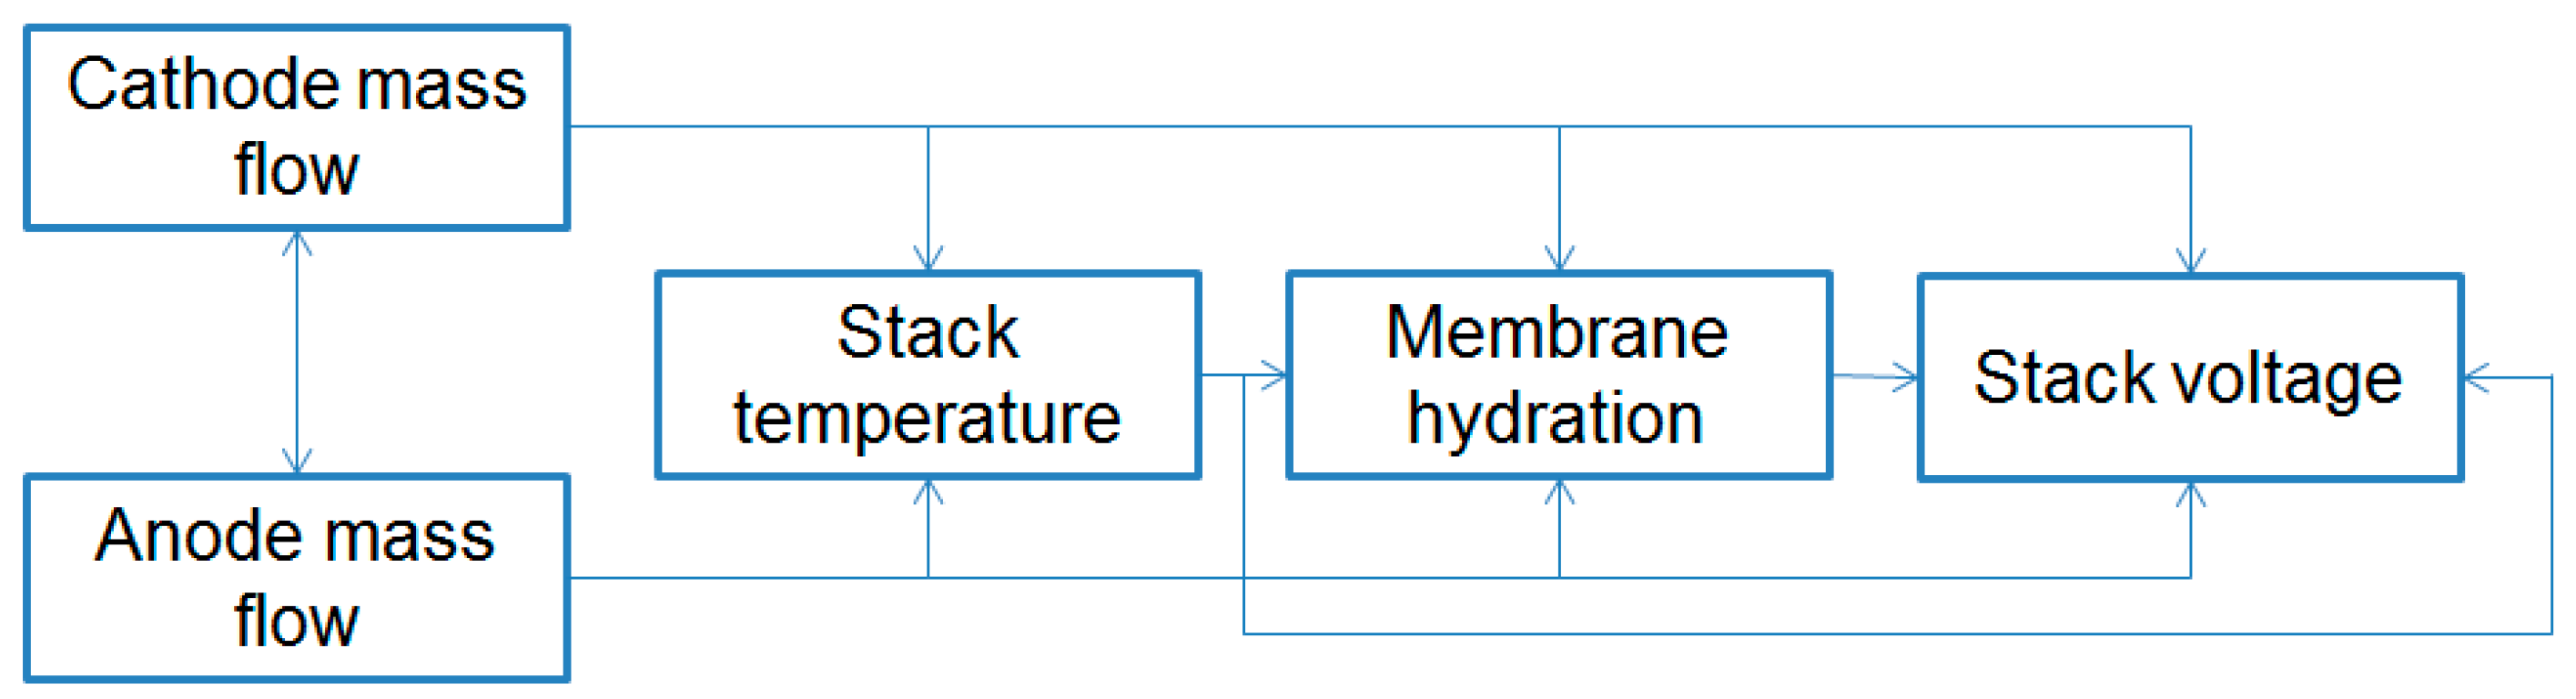
Figure 2.
Comparison of polarization curves from the model and test.
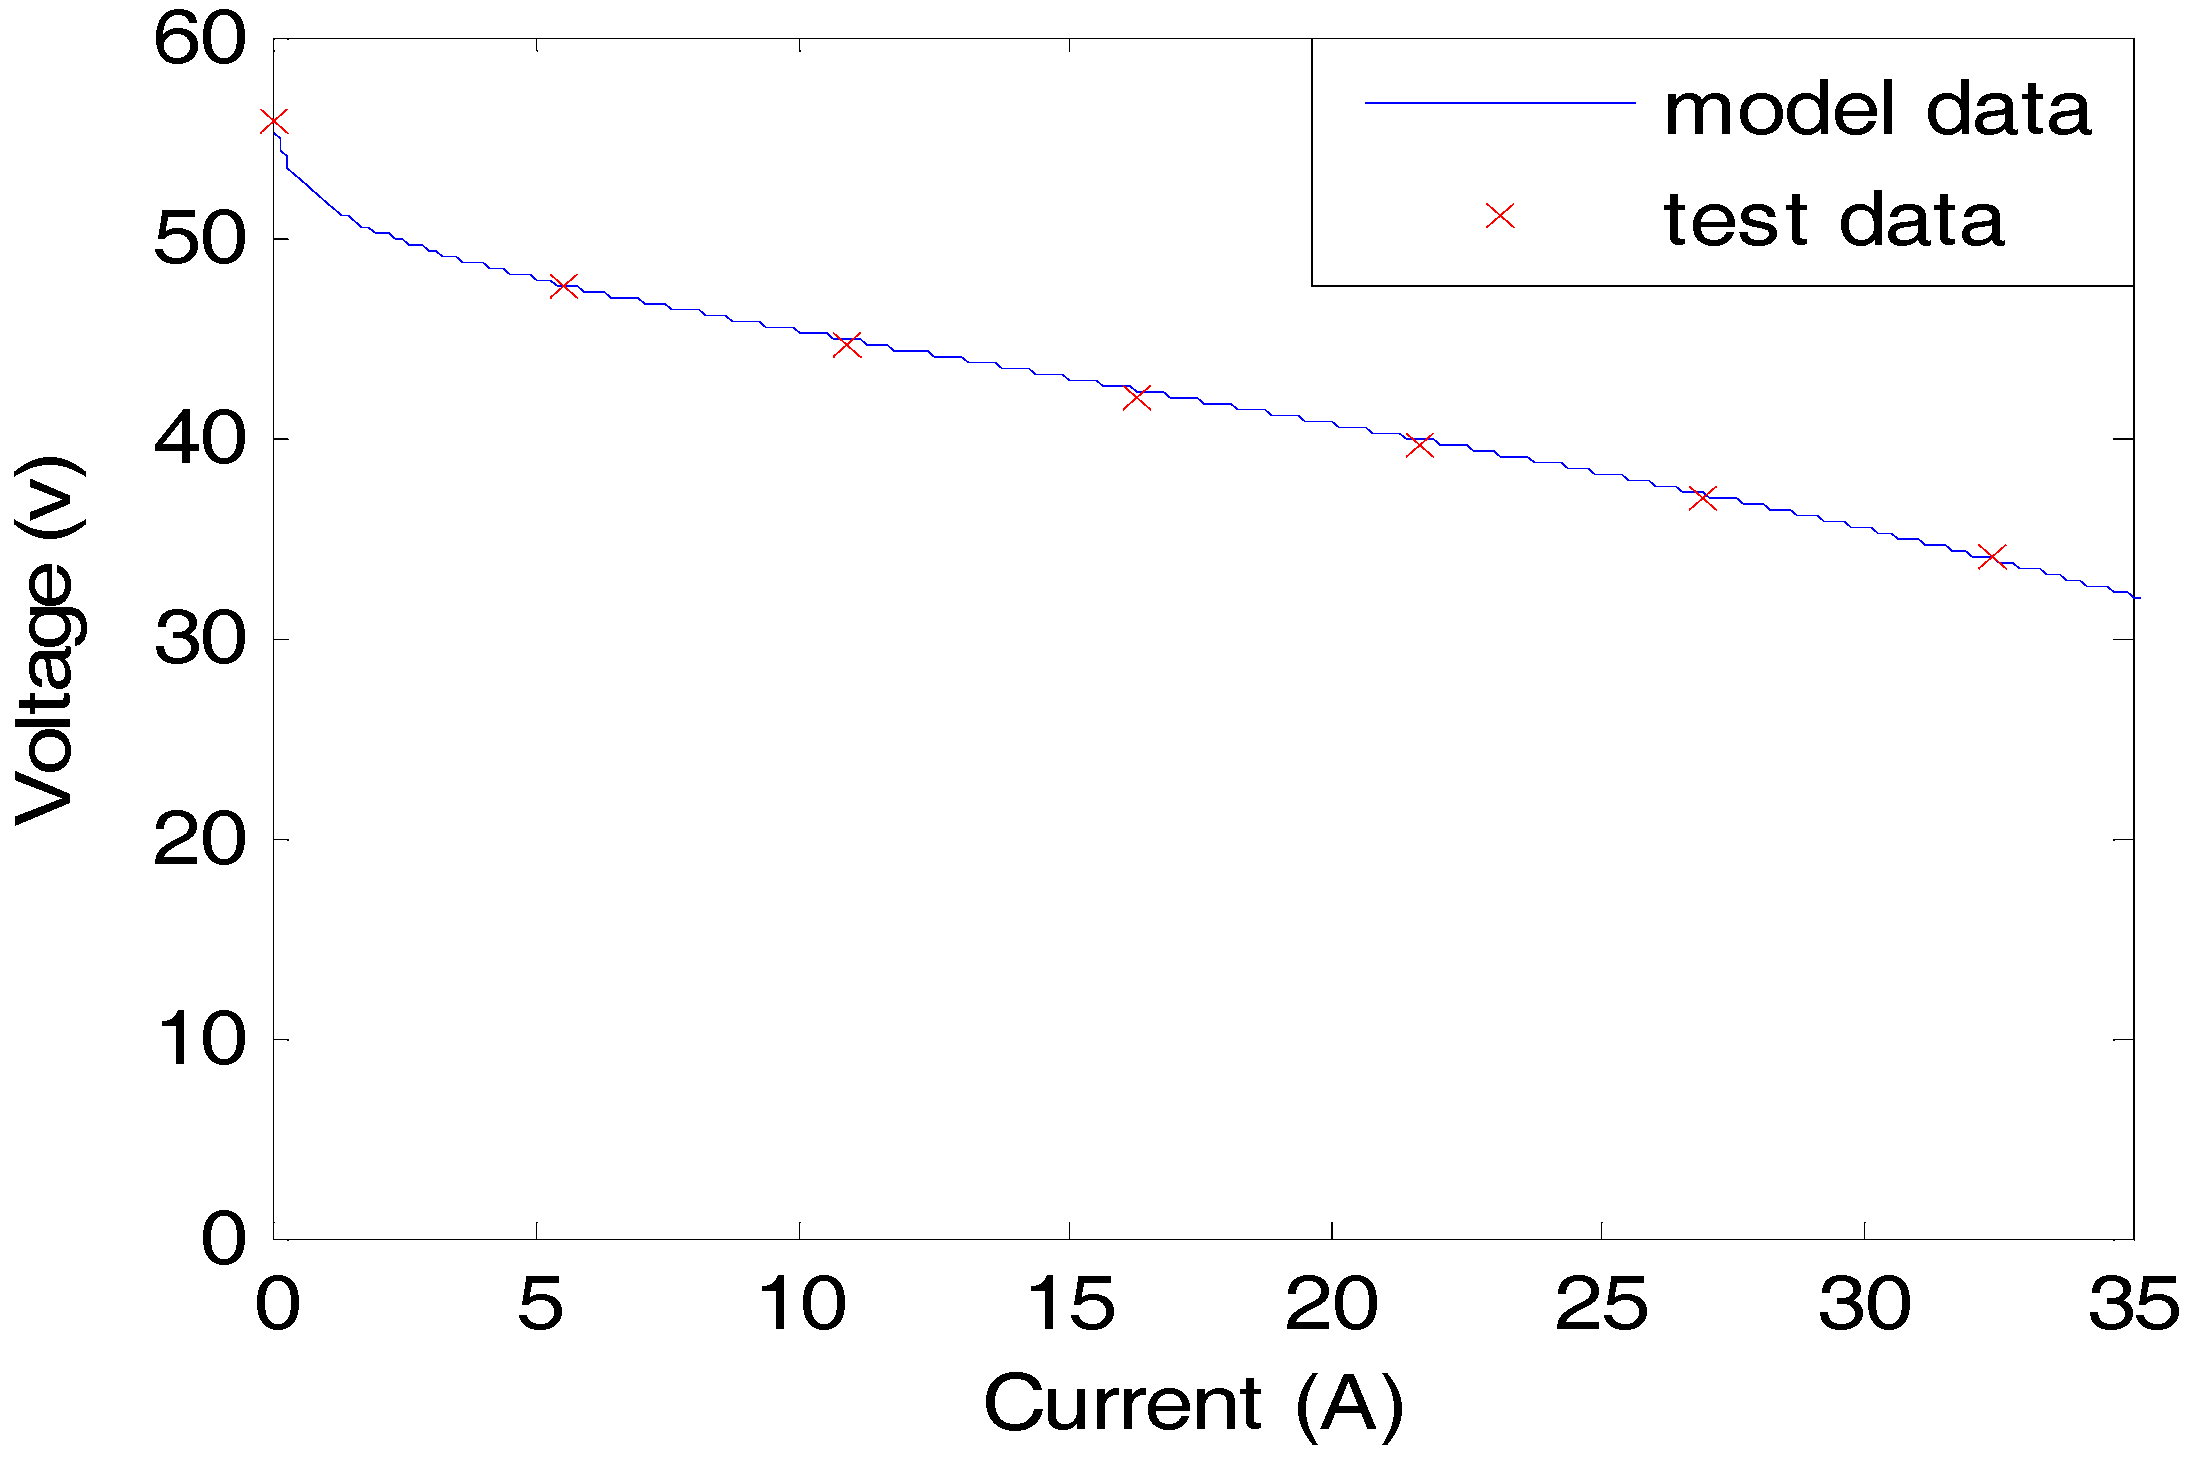
Figure 3.
Sensor sensitivity to different fuel cell parameters.

Figure 4.
Adaptive neuro-fuzzy inference system (ANFIS) structure.

Figure 5.
Prediction performance and computational time of different sensor sets.
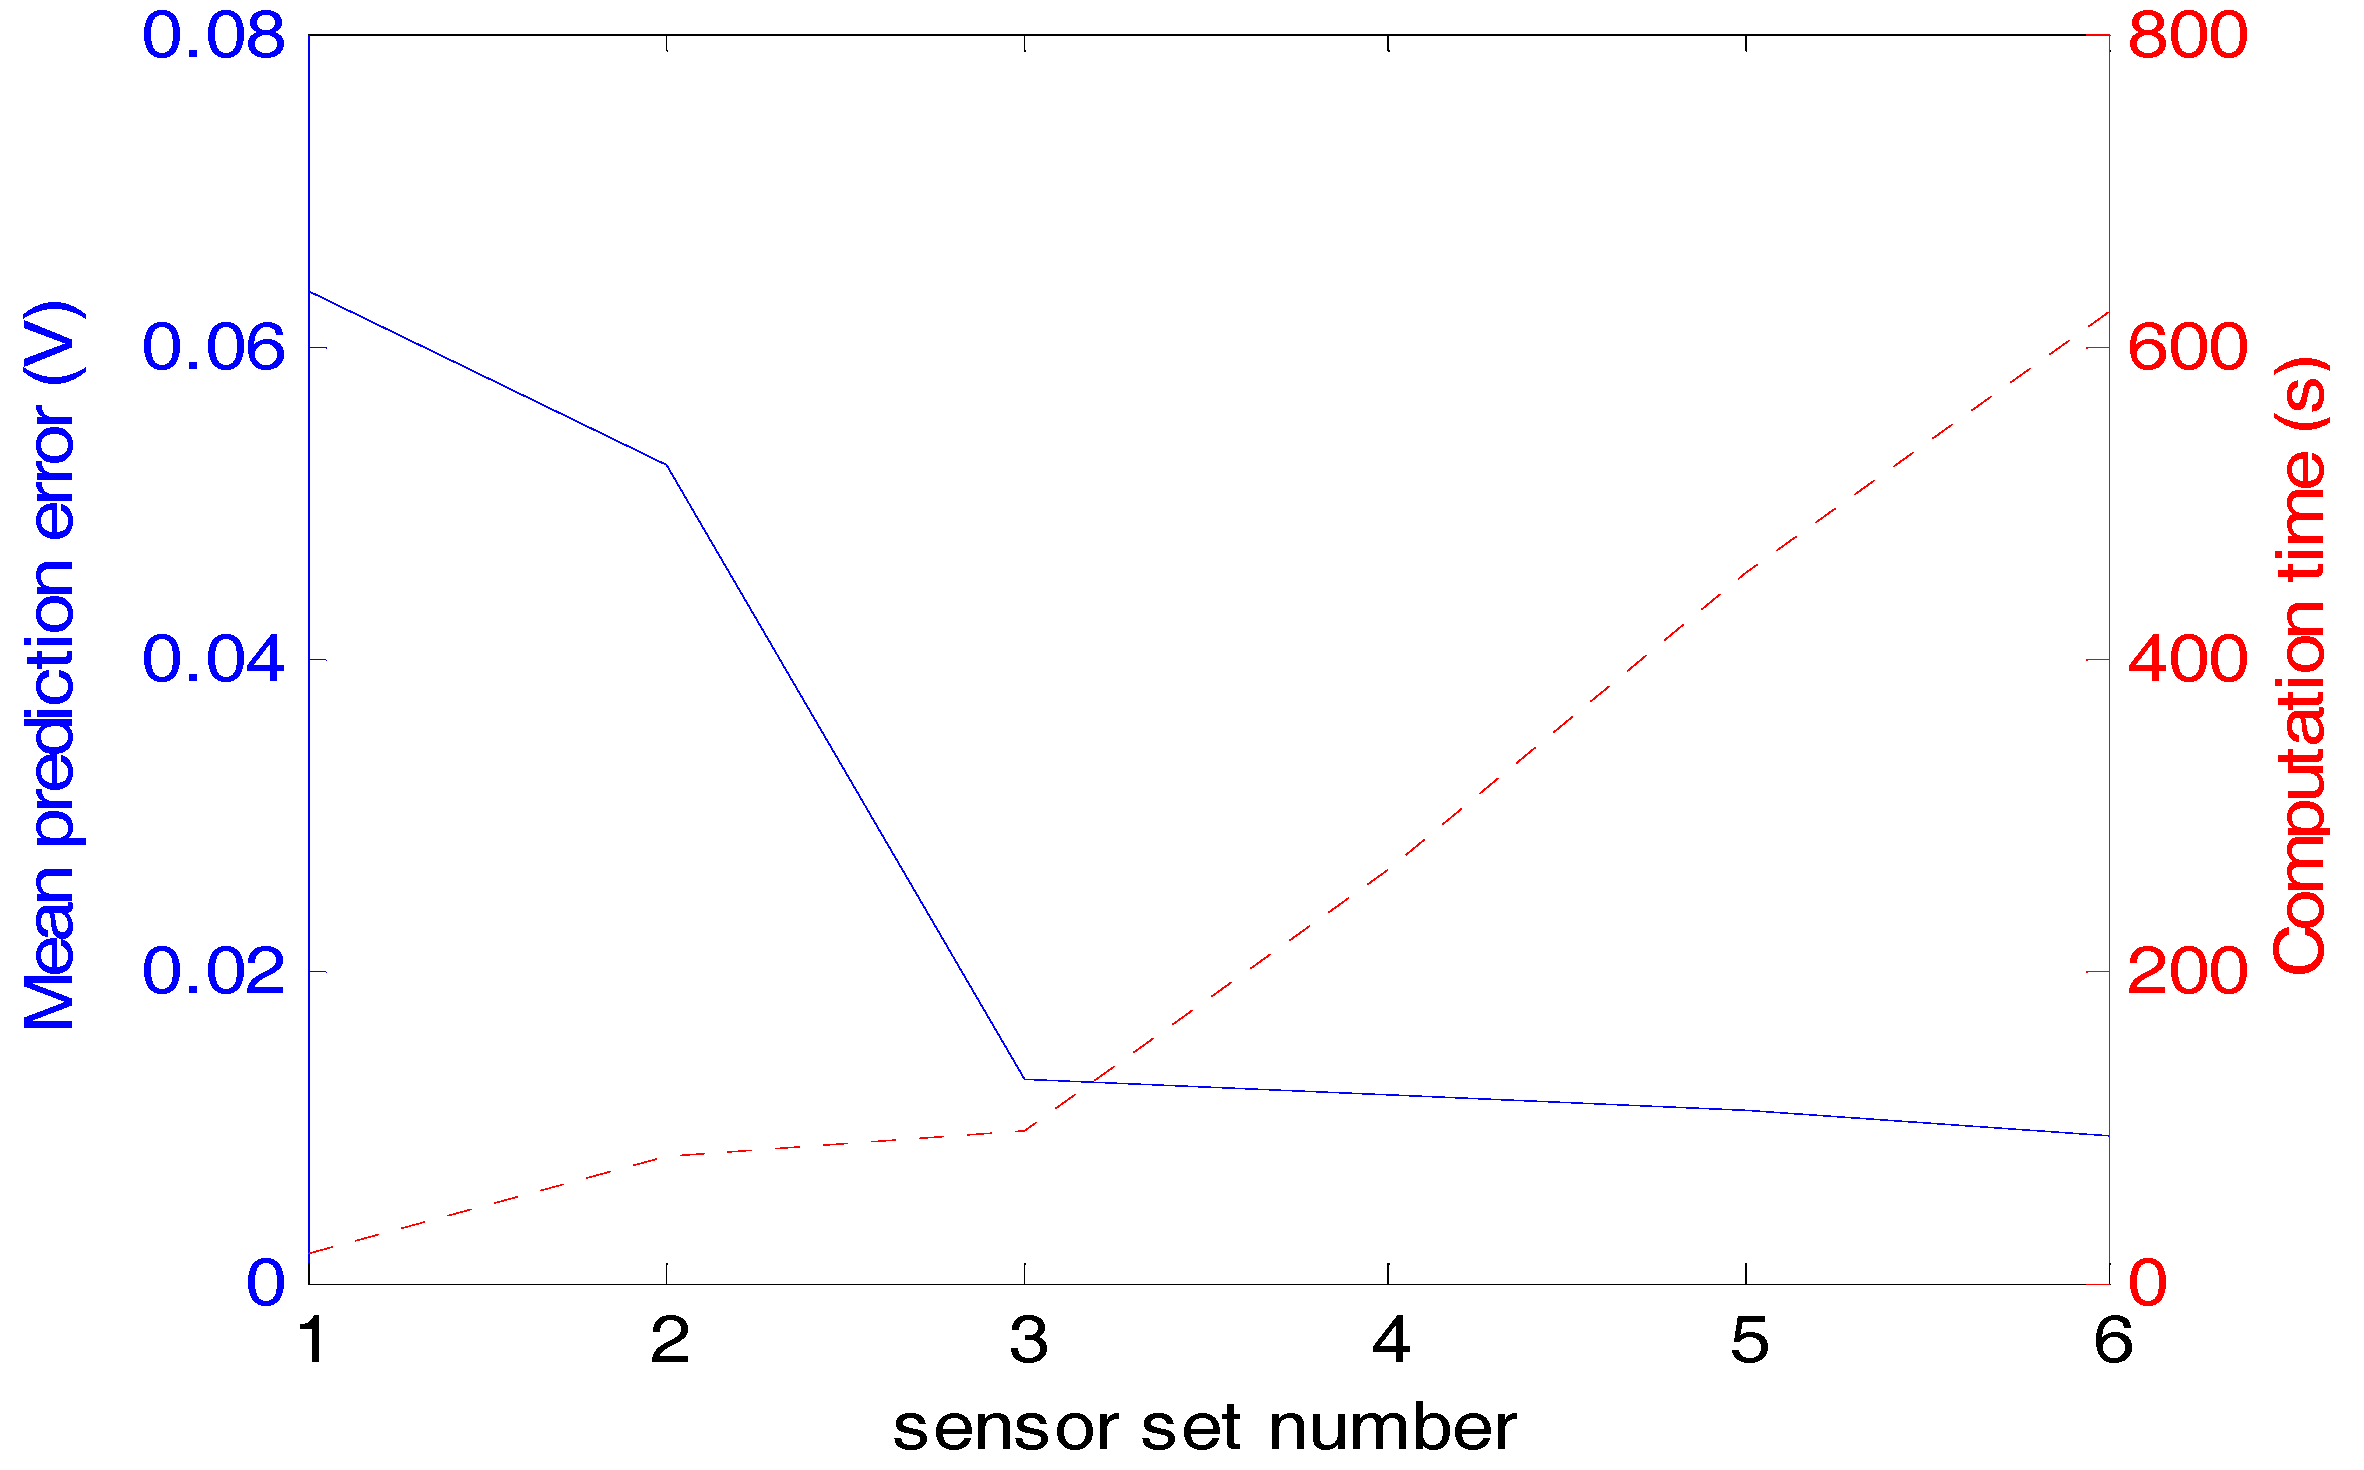
Figure 6.
Prediction performance of selected sensors (the vertical blue dashed line separates the training and validation stages).
Figure 6.
Prediction performance of selected sensors (the vertical blue dashed line separates the training and validation stages).
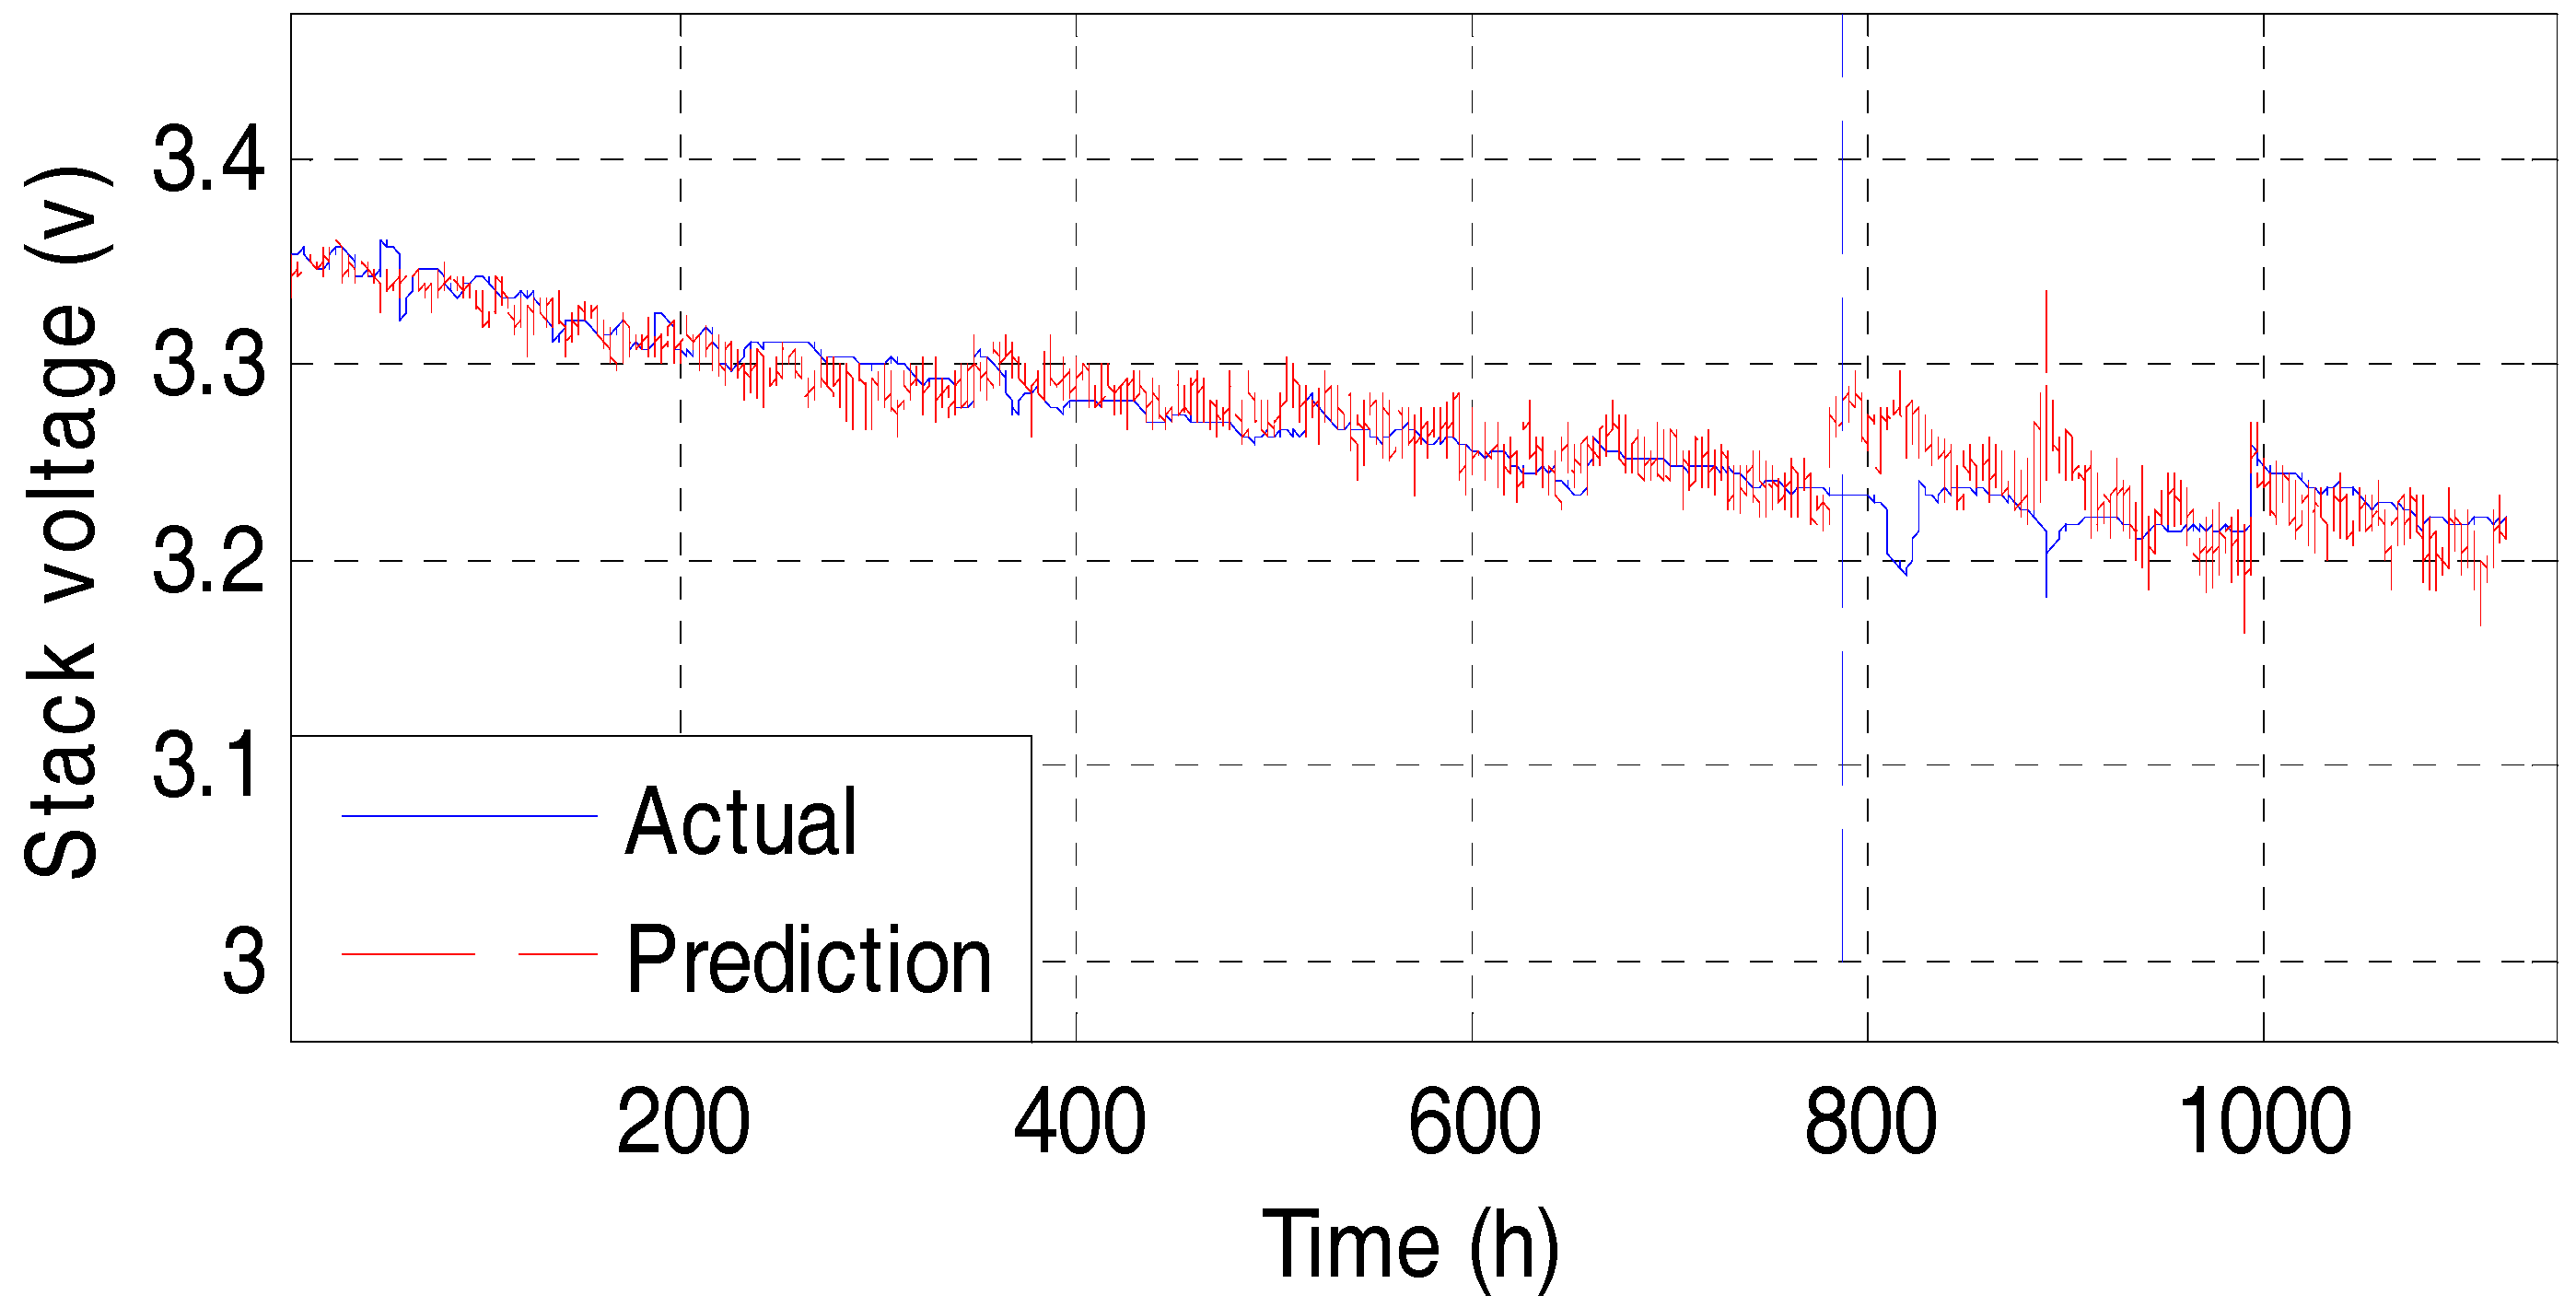
Figure 7.
Fuel cell test rig.

Figure 8.
Fuel cell temperature and corresponding stack voltage during the operation.

Figure 9.
Comparison of polarization curves under the flooding scenario.
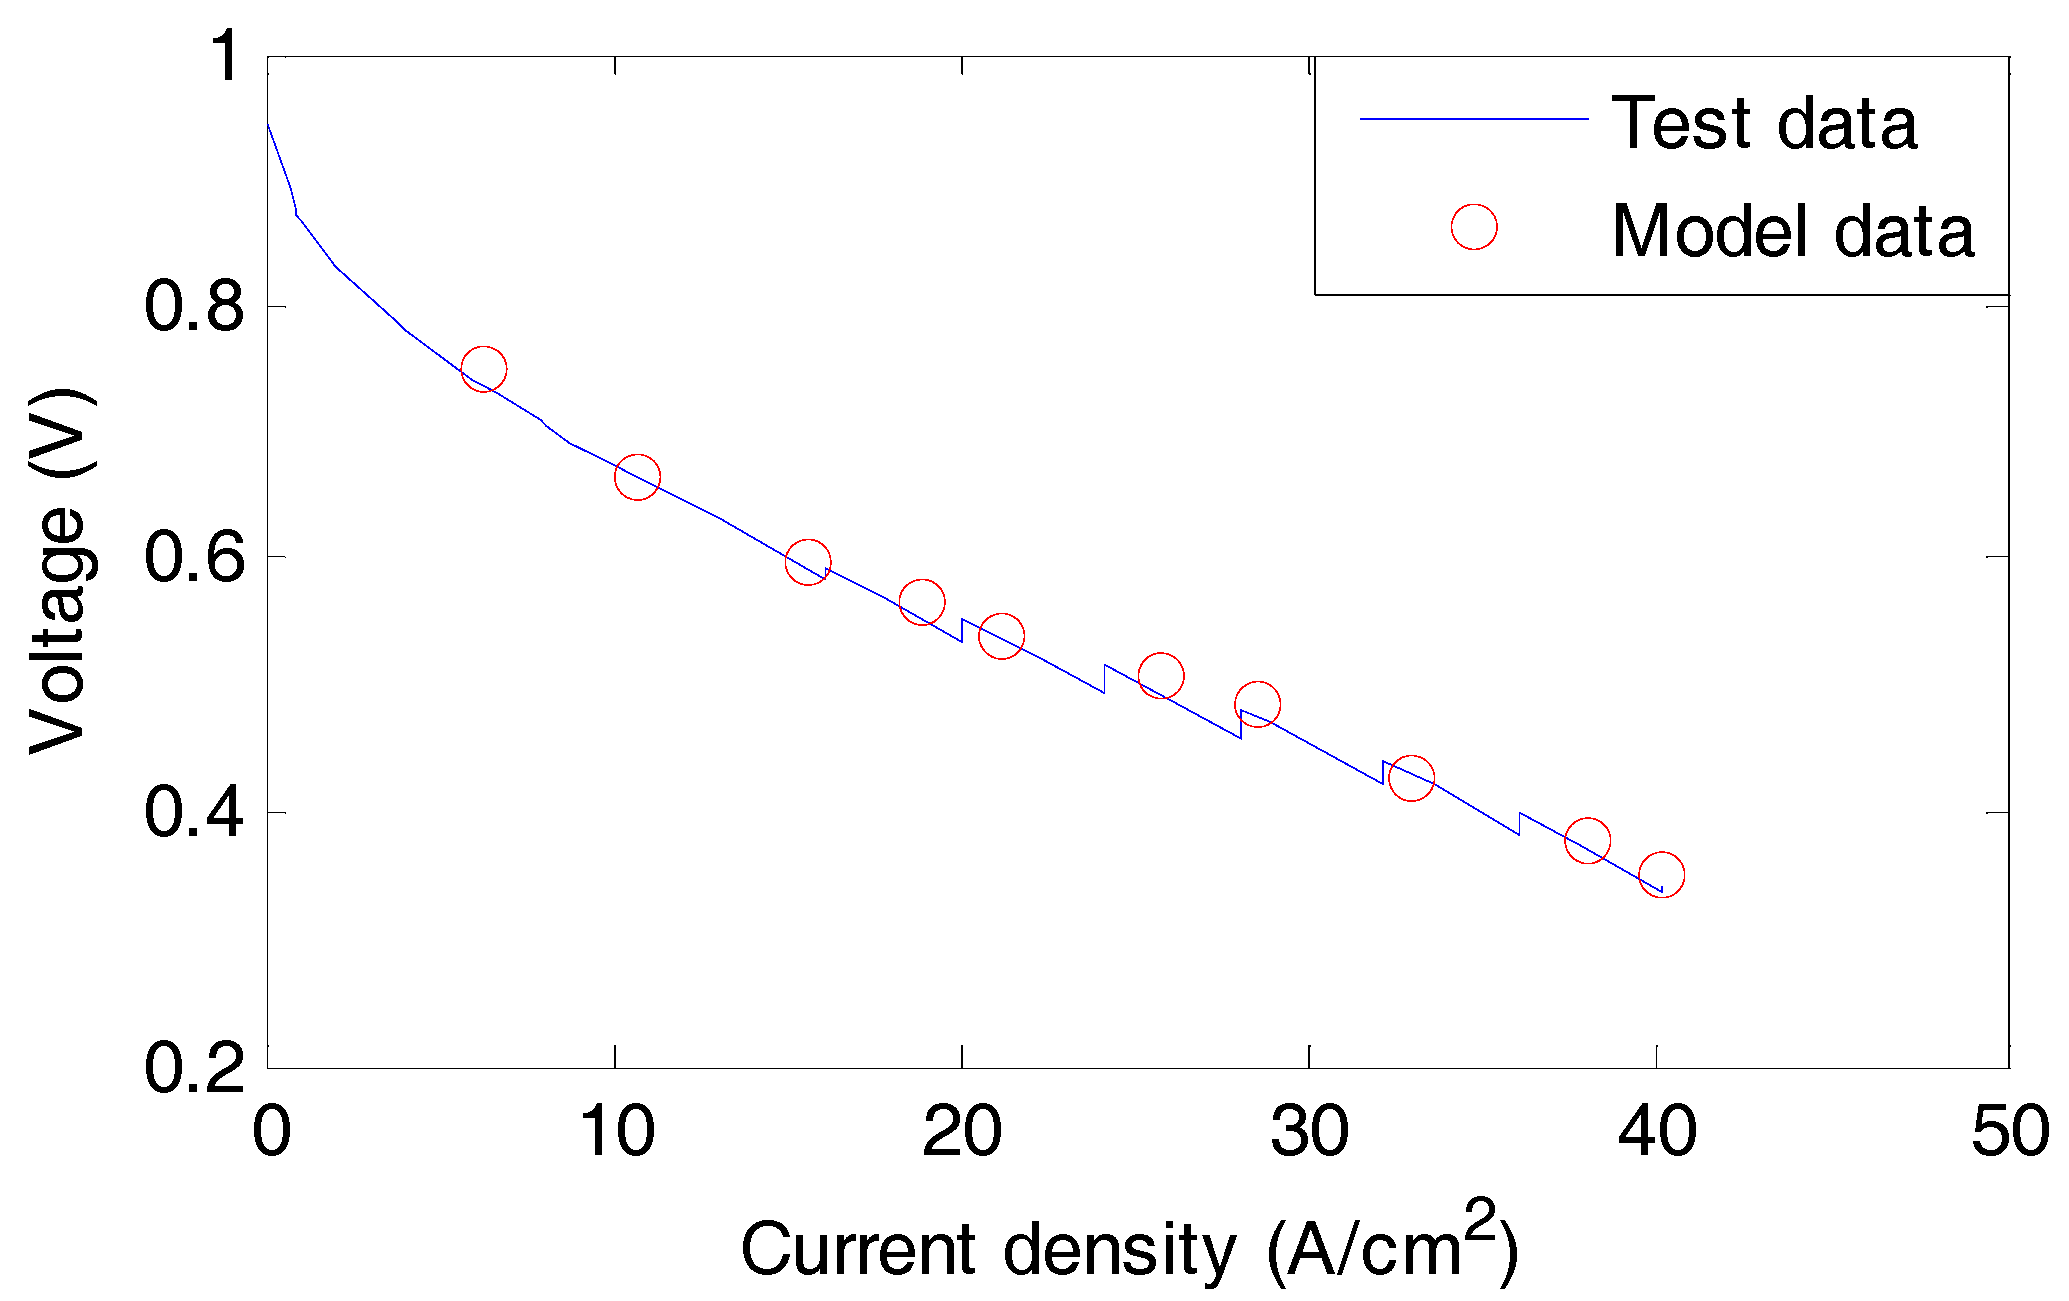
Figure 10.
Flowchart of data-driven approaches in PEM fuel cell fault diagnosis.
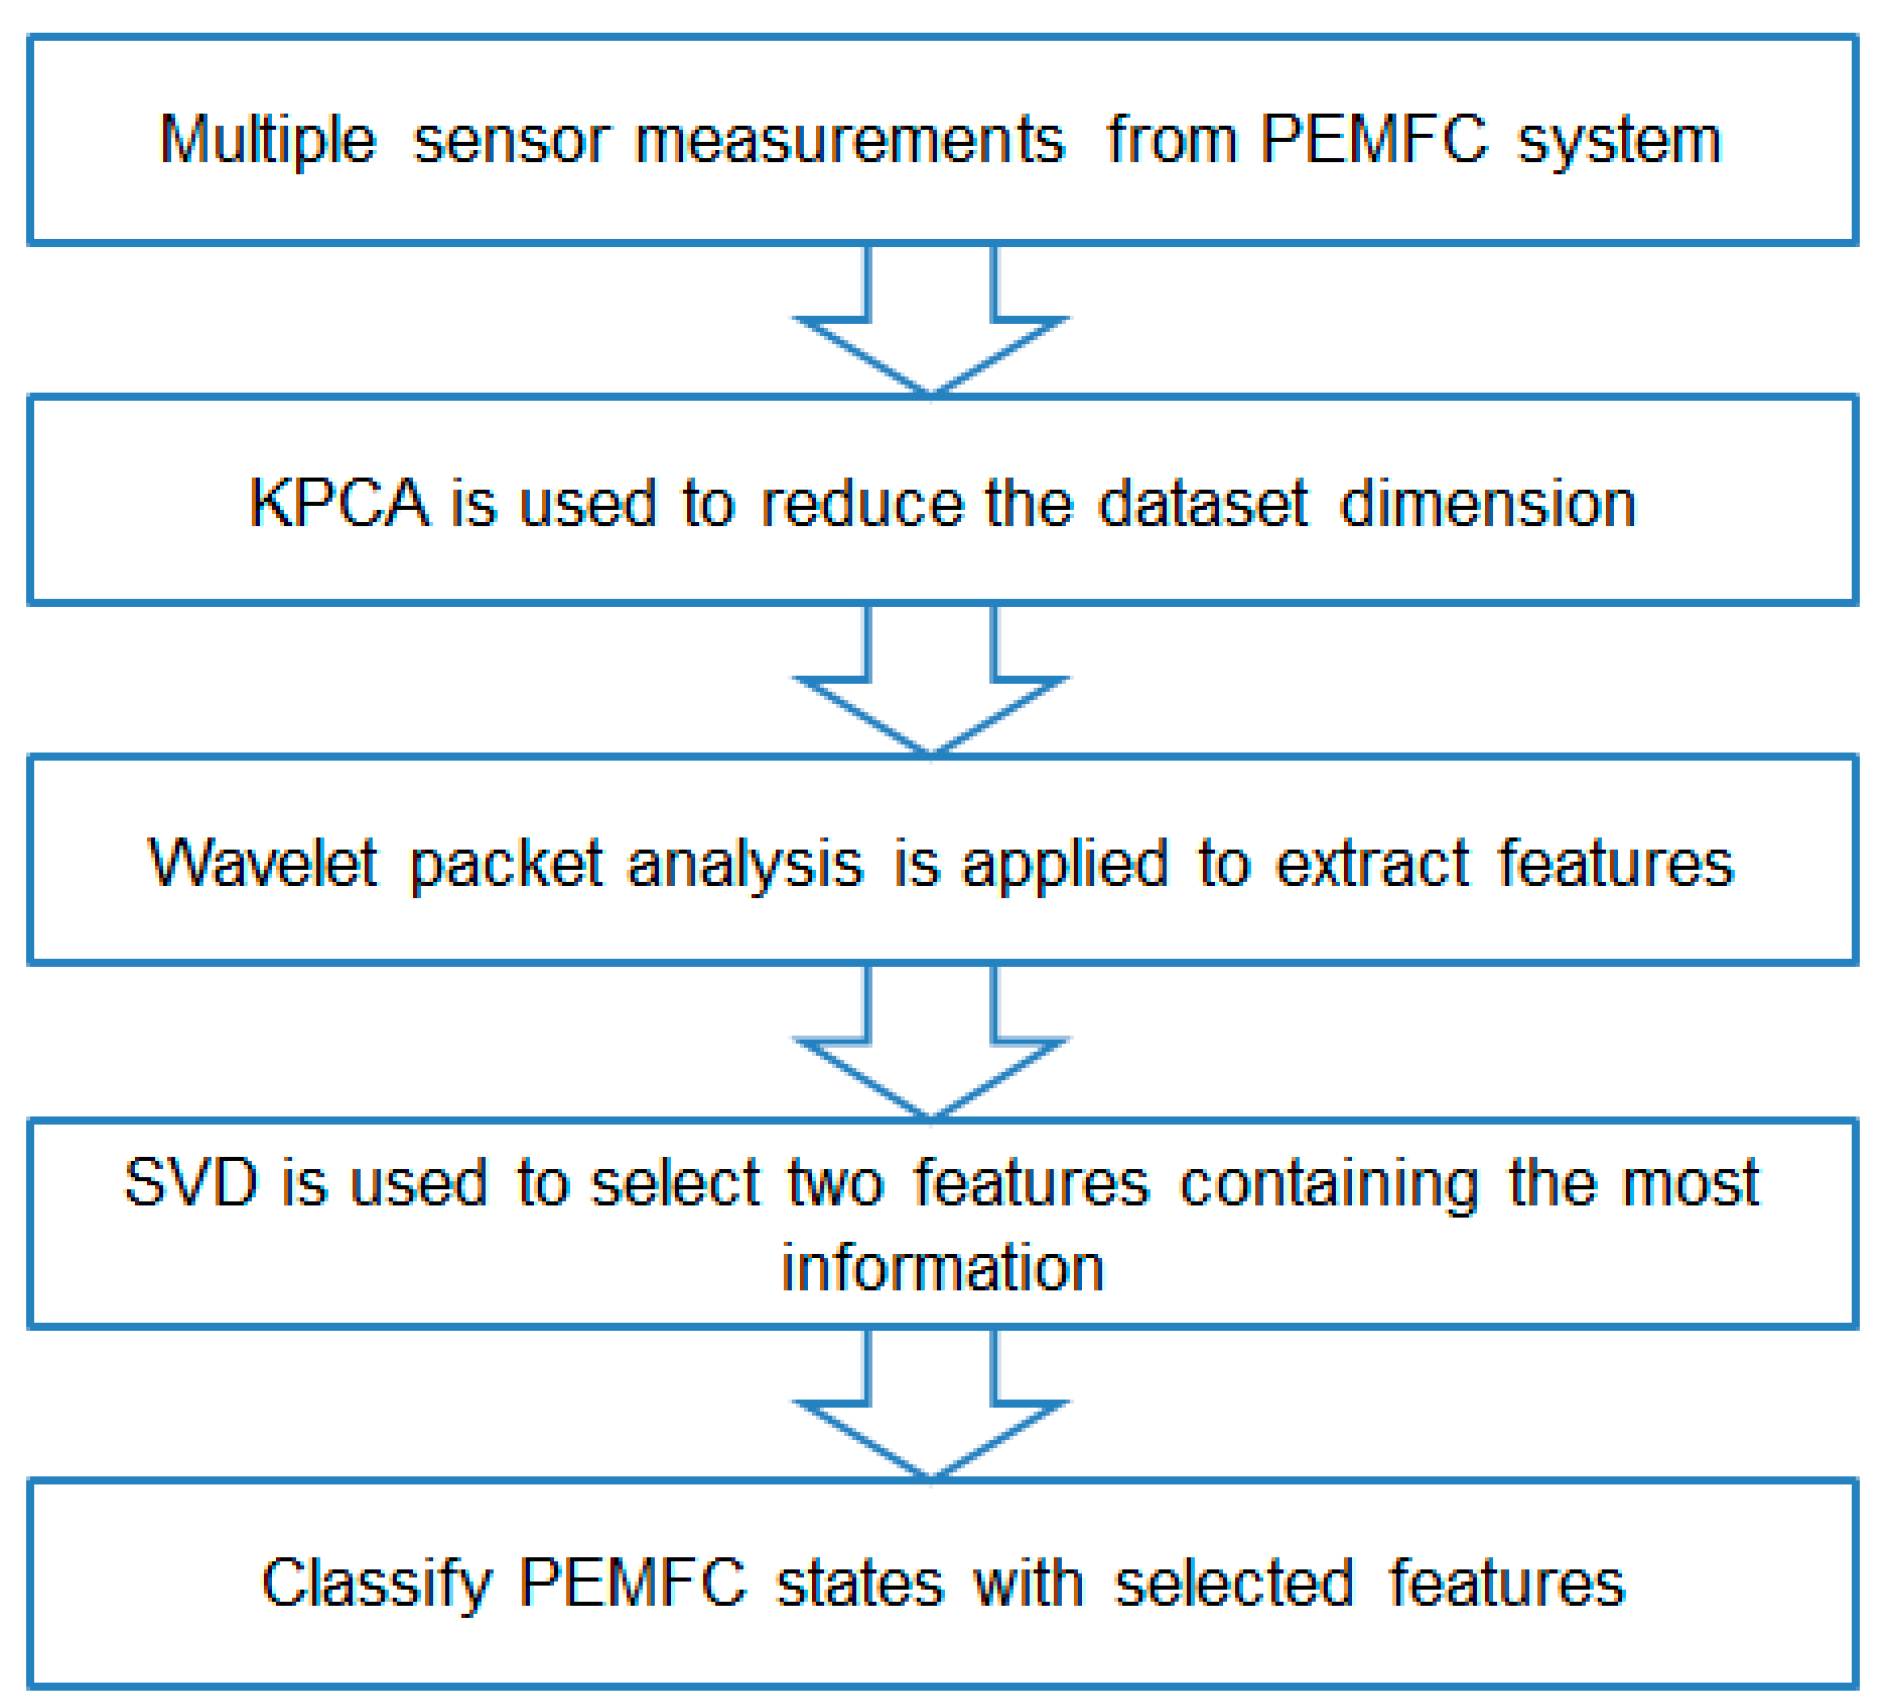
Figure 11.
Diagnostic results using all available sensors.

Figure 12.
Diagnostic results using the selected dataset.


Table 1.
Input parameters for the fuel cell model [24].
Table 1.
Input parameters for the fuel cell model [24].
| Parameter (Unit) | Value |
|---|---|
| Number of fuel cells | 54 |
| Active electrode area of single cell () | 46.5 |
| Hydrogen flow rate stoichiometry | 1.15 |
| Air flow rate stoichiometry | 2.0 |
Table 2.
Sensors used in the analysis.
| Number | Sensor |
|---|---|
| s1 | Cell voltage (V) |
| s2 | Stack temperature (K) |
| s3 | Anode inlet flow (kg/s) |
| s4 | Cathode inlet flow (kg/s) |
| s5 | Anode outlet flow (kg/s) |
| s6 | Cathode outlet flow (kg/s) |
| s7 | Compressor temperature (K) |
| s8 | Coolant inlet flow (kg/s) |
| s9 | Inlet water temperature (K) |
| s10 | Outlet water temperature (K) |
Table 3.
Sensors with the best noise resistance capability from different sizes [18].
Table 3.
Sensors with the best noise resistance capability from different sizes [18].
| Size of Sensor Set | Sensor Set with the Best Noise Resistance Capability |
|---|---|
| 1 | Stack temperature |
| 2 | Stack temperature, cathode outlet flow |
| 3 | Stack temperature, cathode outlet flow, cathode inlet flow |
| 4 | Stack temperature, cathode outlet flow, cathode inlet flow, water inlet temperature |
| 5 | Stack temperature, cathode outlet flow, cathode inlet flow, water inlet temperature, water outlet temperature |
| 6 | Stack temperature, cathode outlet flow, cathode inlet flow, water inlet temperature, water outlet temperature, anode outlet flow |
Table 4.
Technical details of the polymer electrolyte membrane (PEM) fuel cell system.
| Parameter | Value |
|---|---|
| Membrane thickness () | 25 |
| Active area () | 100 |
| Platinum loading () | 0.2 |
| Gas diffusion thickness () | 415 |
Table 5.
Sensors used in the fuel cell test.
| Sensor | Sensor |
|---|---|
| Voltage | Anode inlet flow |
| Anode outlet pressure | Cathode outlet pressure |
| Cathode inlet flow | Anode inlet pressure |
| Anode relative humidity | Cathode relative humidity |
| Cathode inlet pressure | Stack temperature |
© 2017 by the authors. Licensee MDPI, Basel, Switzerland. This article is an open access article distributed under the terms and conditions of the Creative Commons Attribution (CC BY) license (http://creativecommons.org/licenses/by/4.0/).
Share and Cite
MDPI and ACS Style
Mao, L.; Davies, B.; Jackson, L. Application of the Sensor Selection Approach in Polymer Electrolyte Membrane Fuel Cell Prognostics and Health Management. Energies 2017, 10, 1511. https://doi.org/10.3390/en10101511
AMA Style
Mao L, Davies B, Jackson L. Application of the Sensor Selection Approach in Polymer Electrolyte Membrane Fuel Cell Prognostics and Health Management. Energies. 2017; 10(10):1511. https://doi.org/10.3390/en10101511
Chicago/Turabian StyleMao, Lei, Ben Davies, and Lisa Jackson. 2017. "Application of the Sensor Selection Approach in Polymer Electrolyte Membrane Fuel Cell Prognostics and Health Management" Energies 10, no. 10: 1511. https://doi.org/10.3390/en10101511
Note that from the first issue of 2016, this journal uses article numbers instead of page numbers. See further details here.