1. Introduction
Nowadays, ocean monitoring has attracted an increasing amount of attention, as it enables the prediction of global climate changes. Buoys, commonly used ocean monitor equipment, can be used to measure hydrological and weather information of a given position by sensors mounted on the buoy body and a mooring cable used to fix buoy’s position. Plenty of buoys are able to establish an ocean monitoring network to implement area monitoring.
Ocean monitoring is a long-term process; therefore, it is critical that the ocean buoy has both a low cost of maintenance and a high reliability. At present, the battery which is chiefly used as the power source of the underwater sensors of existing buoys needs to be replaced frequently when it runs low on power, which is costly. Reducing the measuring frequency may allow for a long measurement period, but the monitoring capability is limited. Many scholars have been working on how to extend the battery life based on the point of energy efficiency, and many excellent achievements have been presented [
1,
2,
3]. Nevertheless, these methods have not radically solved the problem of power limits. In theory, an electric cable can be used to transfer electric power from buoys to underwater sensors. However, this method is barely applied because it is not very reliable and unsuitable for multi-sensors. The capability of a real-time power supply for underwater sensors will dramatically enhance the monitoring performance of ocean buoys.
Due to the advantage of noncontact connection, an inductively coupled power transfer (ICPT) system has recently made great developments in special fields such as electric vehicles, mobile devices, and biomedical implants [
4,
5,
6,
7,
8,
9]. In the harsh underwater environment, ICPT technology is preferable for its ease of use and reliability. Many recent studies of underwater ICPT systems have focused on the power supply for autonomous underwater vehicles [
10,
11,
12,
13,
14,
15]. This kind of ICPT system requires extra power source stations on the seafloor that are connected to electric substations via submarine cable. Since the power source is an electric substation, this system is suitable for high-power equipment. For the application of the ICPT system to ocean buoys, very few studies can be found. Paper [
16] introduced a contactless underwater power transfer system, which may be utilized for ocean buoys. In this paper, the losses in cable are discussed, and a prototype inductive coupler is designed. Experimental results indicate that approximate 2 kW of power can be transferred to load without considering cable losses. The structure of the cable is not described in this paper, but it has great influence on compensation. Paper [
17] proposed a power feeding system using magnetic coupling for an ocean observation mooring buoy. The primary coil is wound around the underwater wire, which is connected to the buoy, and the secondary coil, which is wound around a short segment of underwater wire, is parallel to the primary coil. On account of the fact that no ferromagnetic core exists, the system’s leakage flux is high. Meanwhile, the installation of underwater coils and sensors is inconvenient. In the case of a 4.8 m mooring wire, the maximum power received by the sensor is merely 180 mW. Members of our team have published several papers on the circuit design of the ICPT system for ocean buoys, but the model and optimization of power transfer were not elaborated [
18,
19].
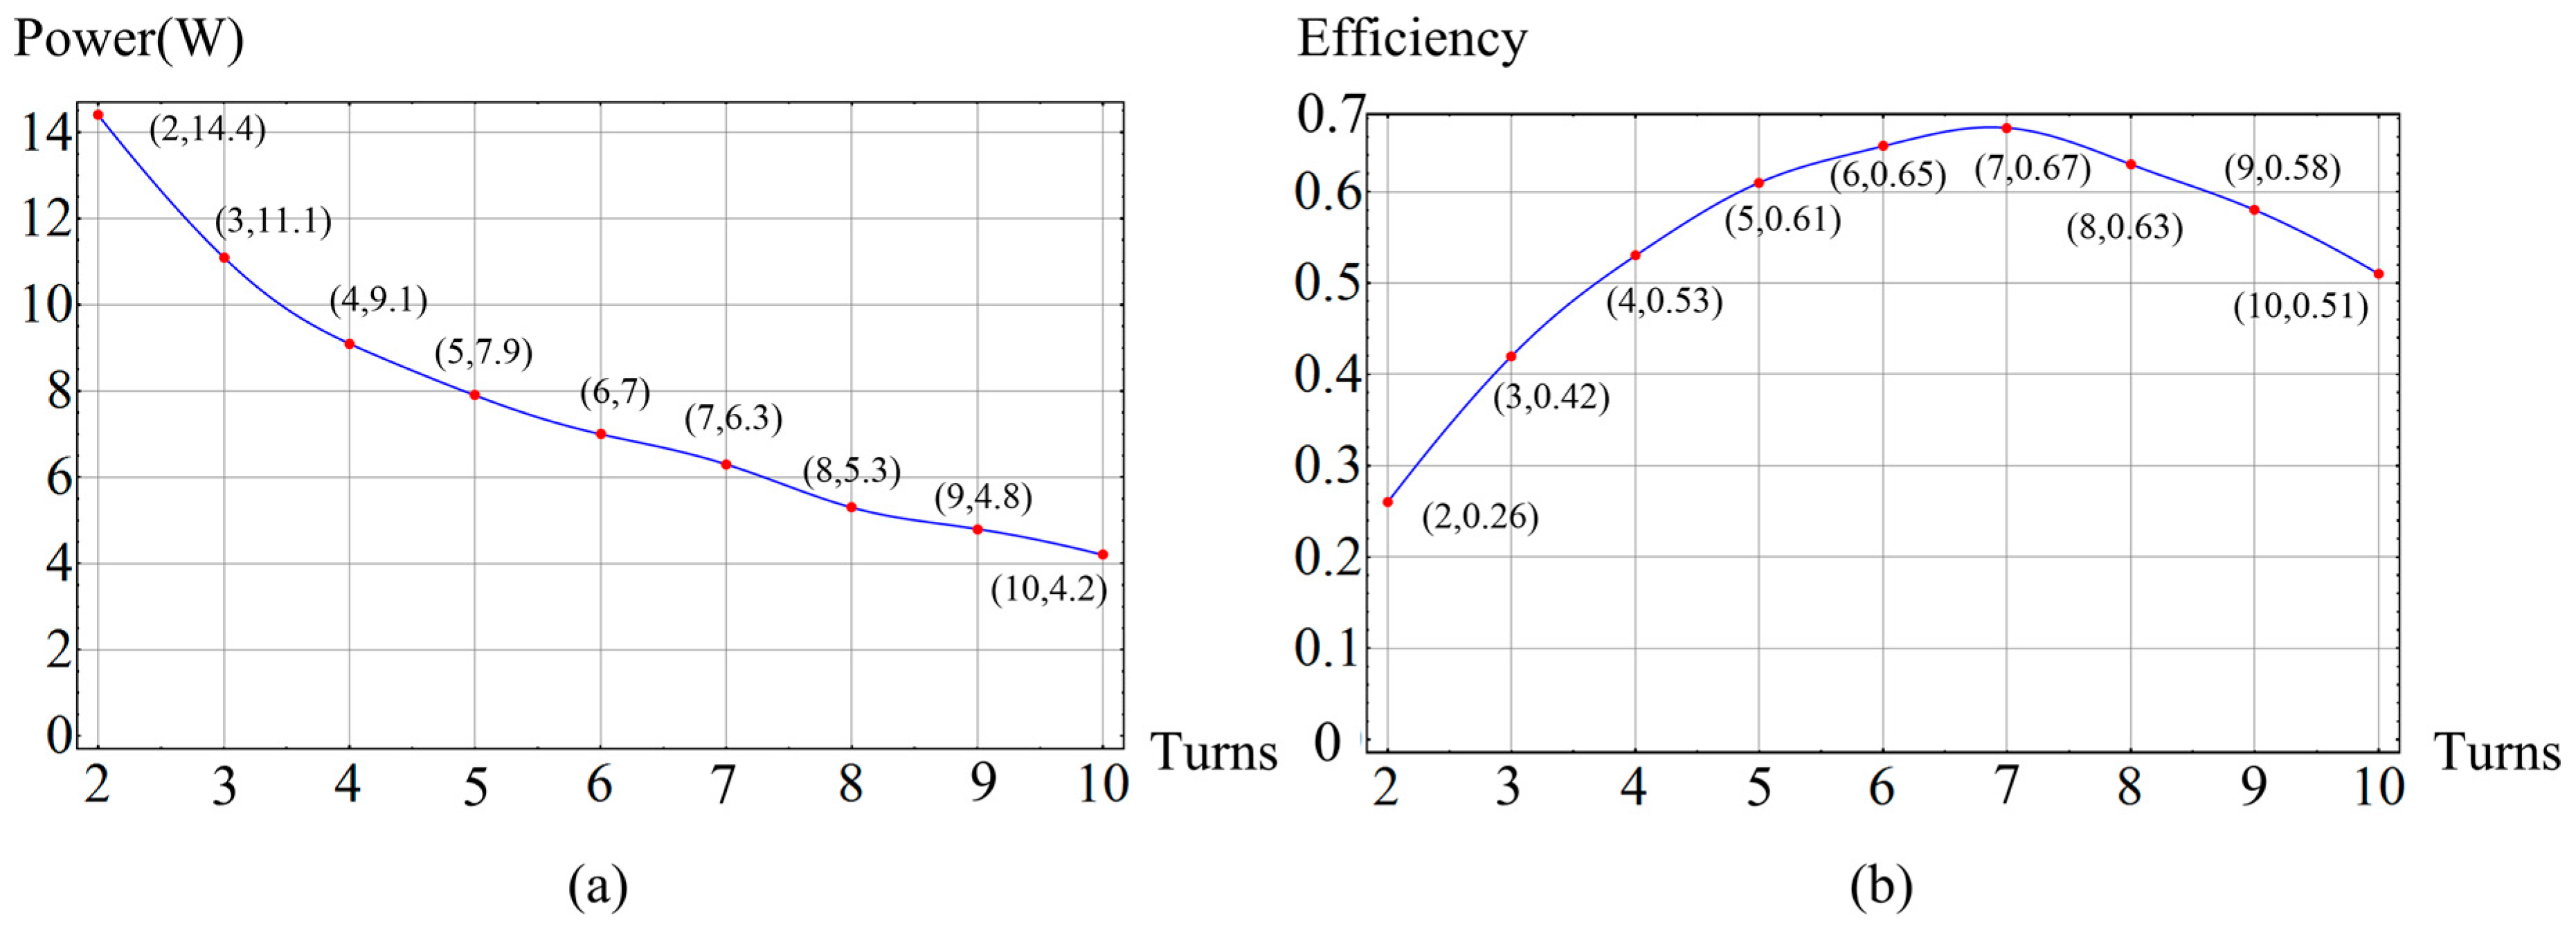
An ICPT system applied to transfer electric power to an underwater sensor of an ocean buoy in real time is detailed in this paper. To ensure the stability of power transfer, a special mooring cable is designed to decrease the influence of its changes in impedance. For the purpose of transmitting data in the same path (not introduced in this paper), two couplers are employed in this system. The model of this special ICPT system is established here. An analysis of parameters is discussed according to the model, and compensation is used to improve power transfer. After optimization, the experiment results show that the maximum power received by load is 14.4 W and maximum efficiency is 67%. The solution proposed in this paper can be easily used to existing mooring buoys to mitigate the periodical replacement of the sensor’s batteries. This paper might also be seen as a reference to other similar ICPT system so as to speed up the design process.
2. System Structure
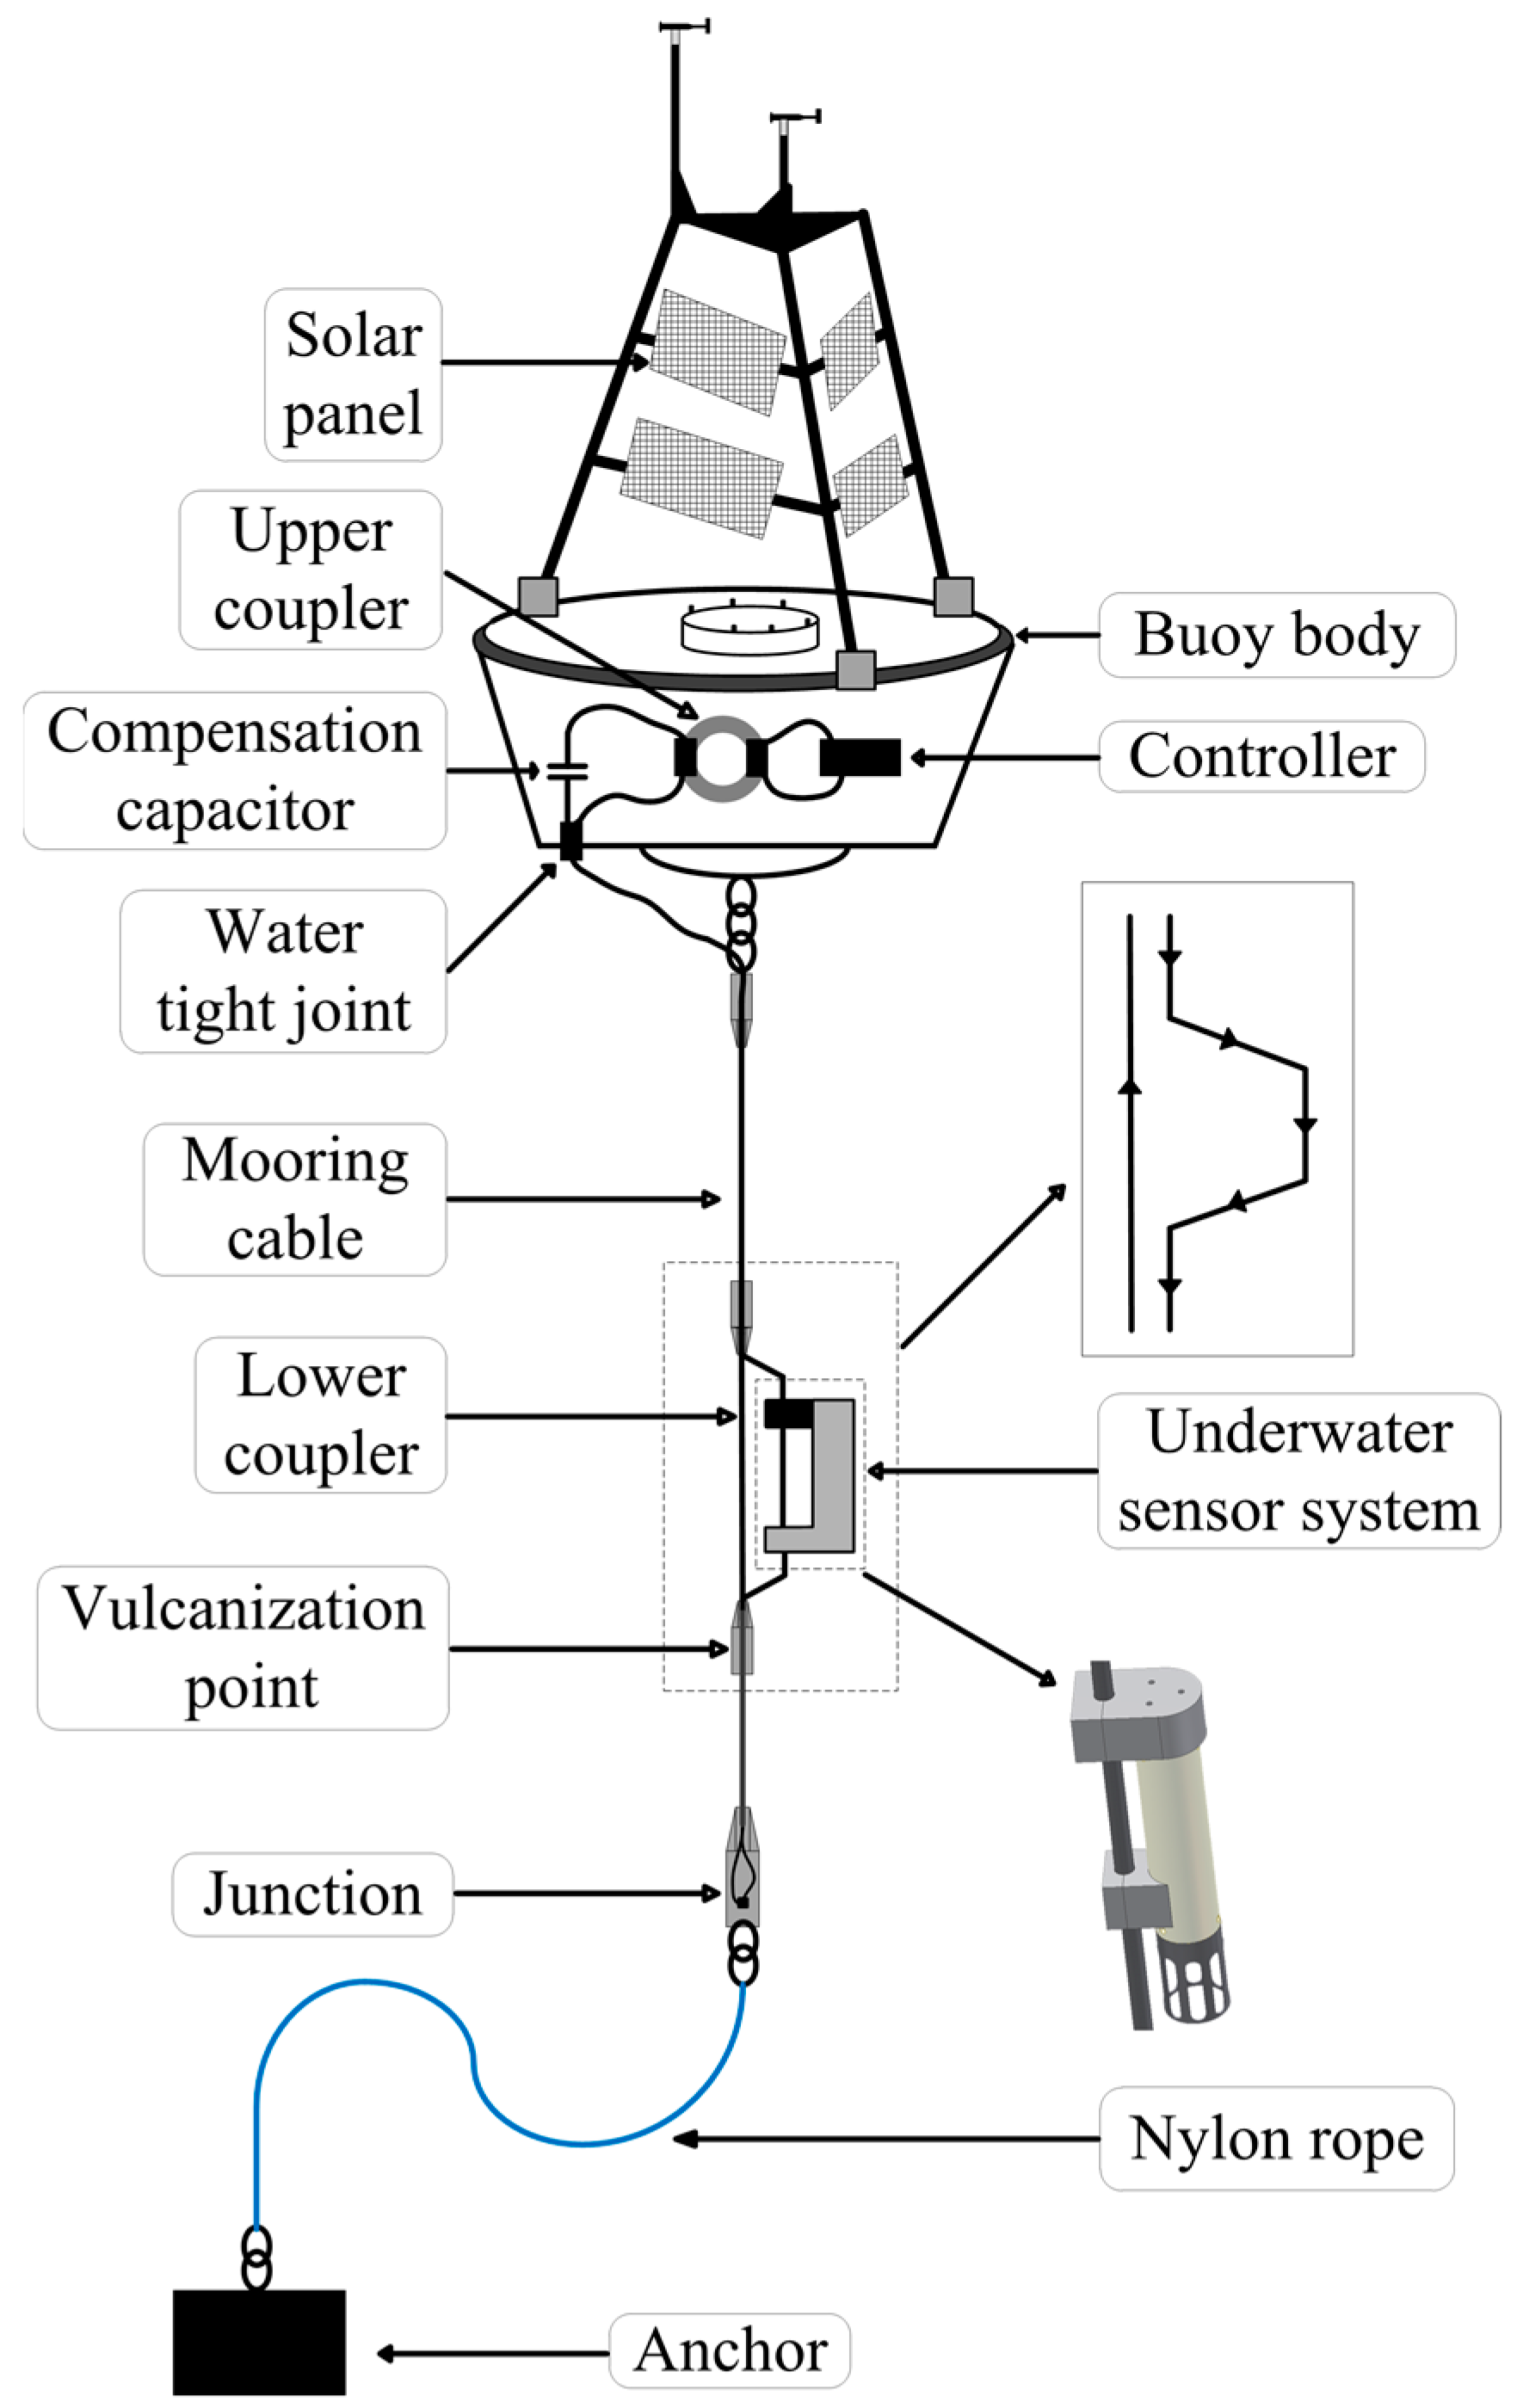
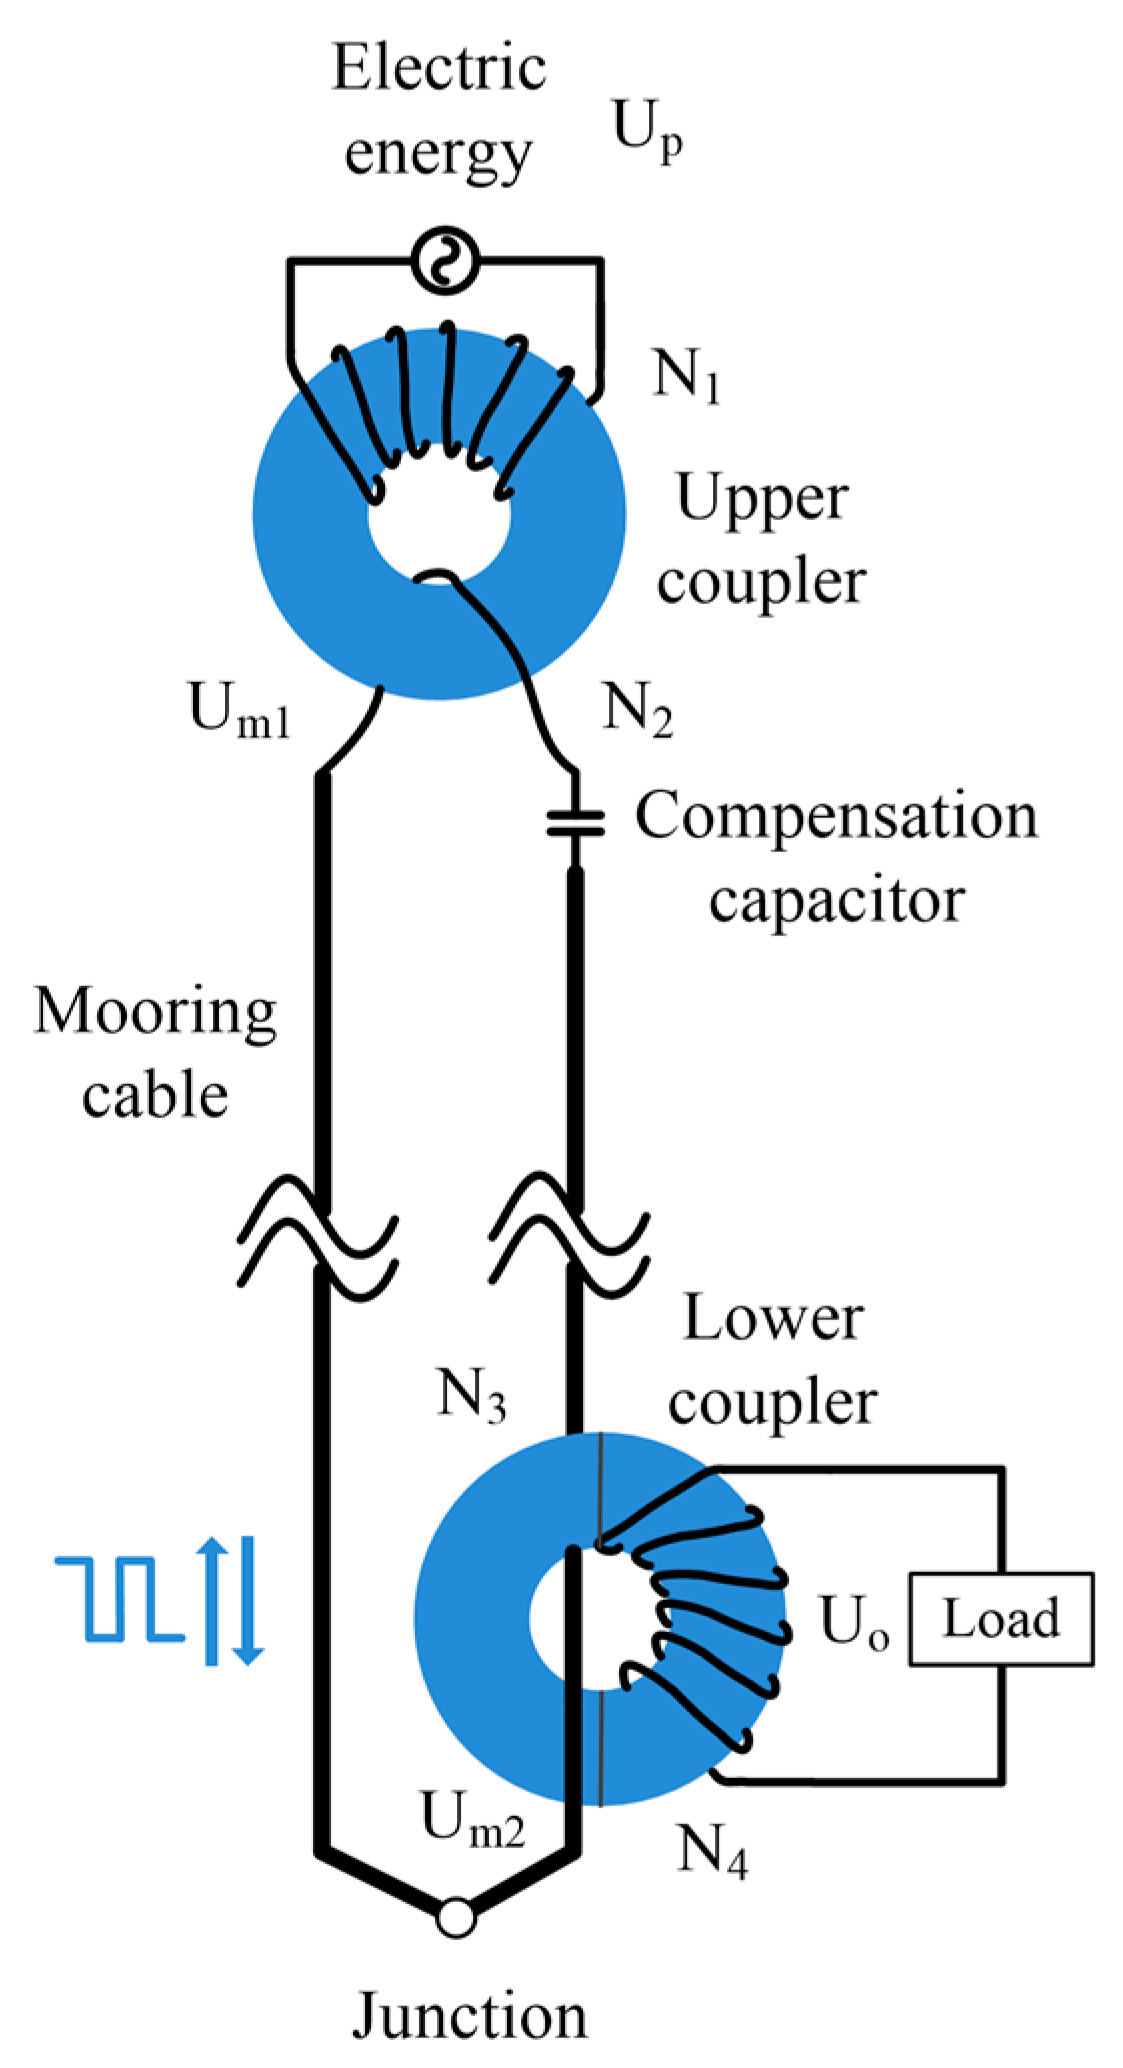
Figure 1 shows the structure of the system. The system is primarily composed of a solar panel, a buoy body, a controller, an upper coupler, a mooring cable, a lower coupler, an underwater sensor, and so on. Electric energy, which is generated by solar panels, is stored in a lead-acid battery as a power source for the whole system. Specifications of the lead-acid battery are as follows: 12 V, 150 Ah. A DC-DC converter is utilized to raise output voltage to 24 V. The principle of this ICPT system can be simplified as
Figure 2 shows. The mooring cable which is the transmission media of the electric power is both the upper coupler’s secondary winding and the lower coupler’s primary winding. The rectangular signal can be transferred from the buoy to the underwater sensor by coupling the effects of the upper and lower couplers. The numbers of the upper coupler’s secondary winding and of the lower coupler’s primary winding are both one in the system.
Under ideal conditions, the primary and secondary windings are fully coupled and all impedance is ignored, and the magnetic flux in any section of a core is identical. Therefore, equations can be obtained as follows:
where
and
, respectively, are the magnetic flux of the upper coupler’s primary and secondary windings;
and
, respectively, are the magnetic flux of the lower coupler’s primary and secondary windings. According to the law of electromagnetic induction, the induced voltage can be obtained as follows:
where
is the voltage amplitude of the rectangular signal,
is the induced voltage of the upper coupler’s secondary winding,
is the voltage of the lower coupler’s primary winding,
is the induced voltage of the lower coupler’s secondary winding.
,
,
, and
, respectively, are the numbers of windings as shown in
Figure 2. Since the mooring cable’s impedance is ignored,
, which is transferred from
, equals
. As a result, from Equations (1) and (2), the voltage gain of the system is
In this system, and are both one, so the ratio of and is .
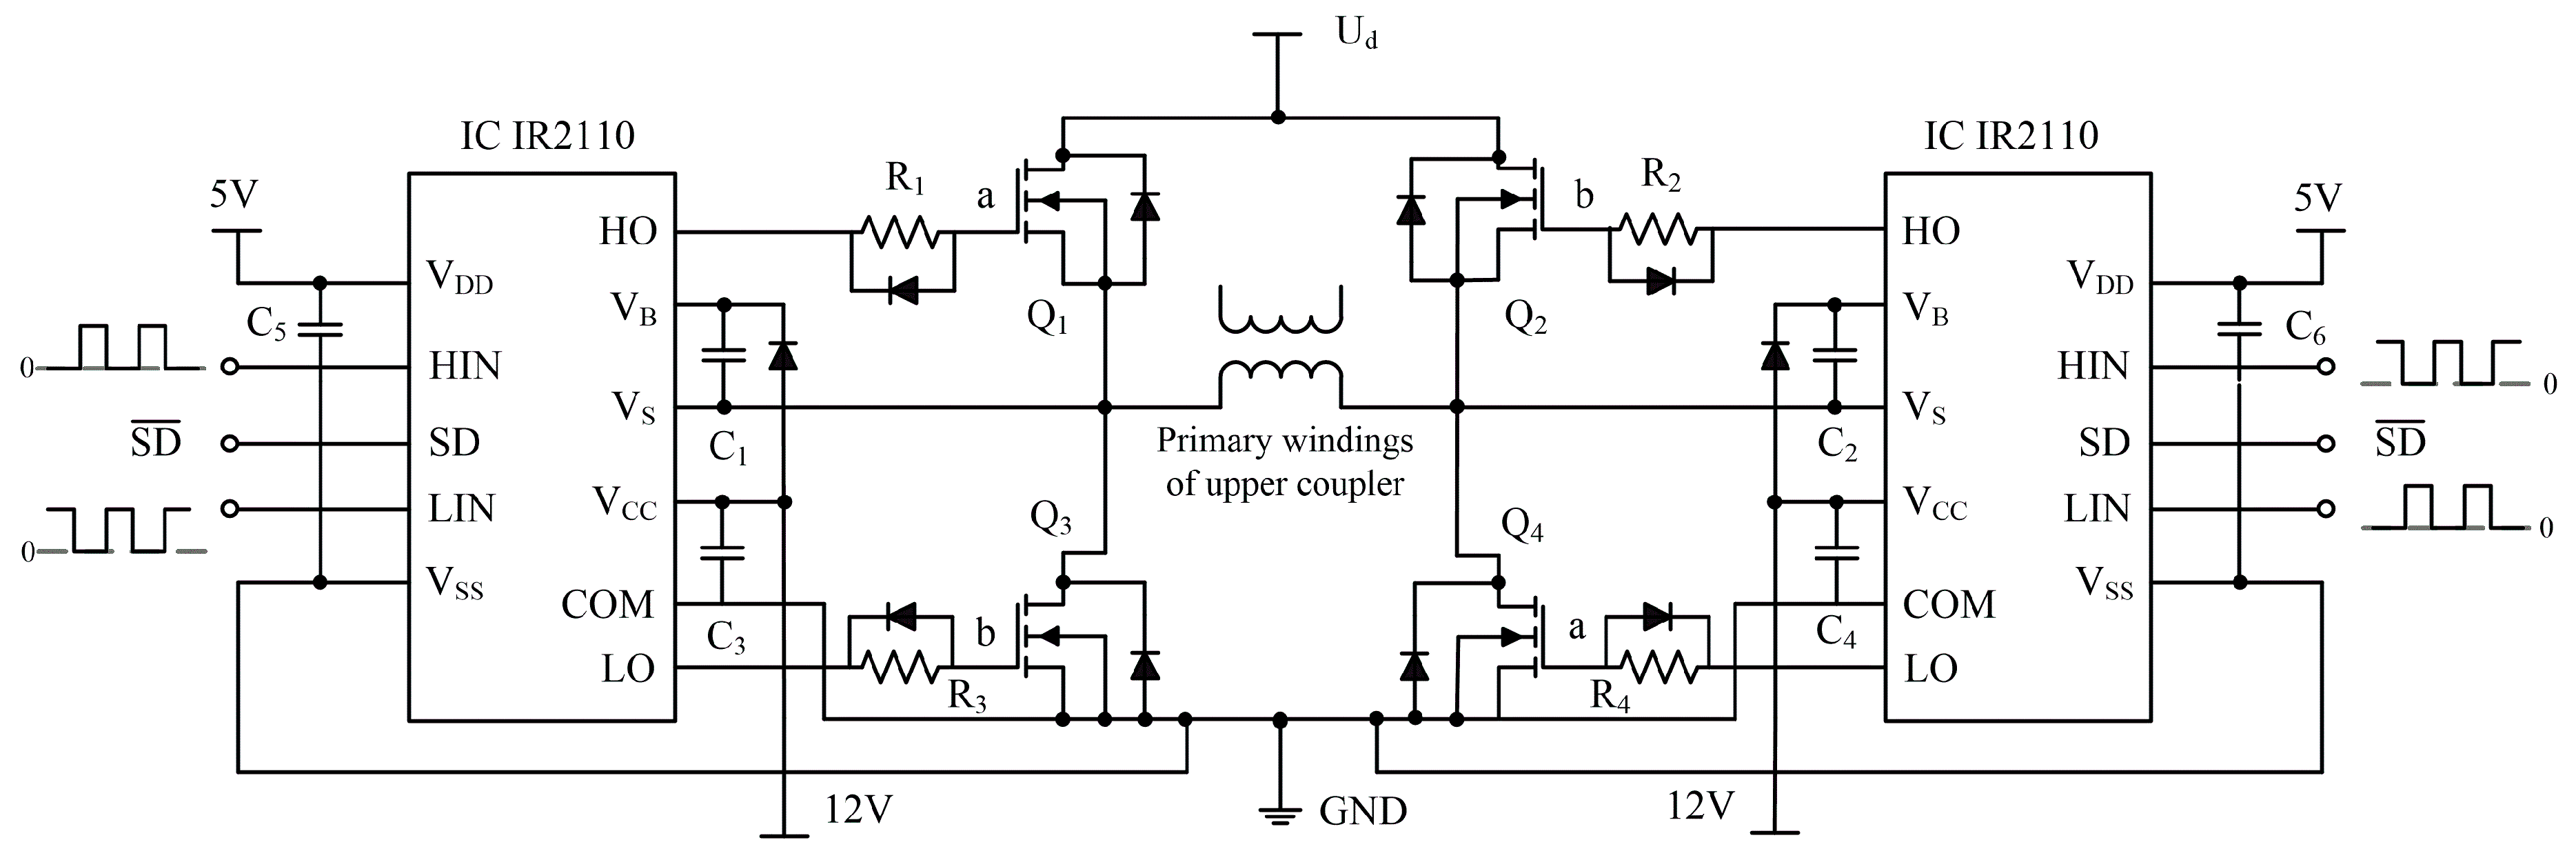
In order to invert DC power to the rectangular signal, a full-bridge inverter circuit as shown in
Figure 3 is placed in the controller. The rectangular signal is achieved by the alternate switching of two groups of metal-oxide semiconductor field-effect transistors (MOSFET) at the diagonal position. Chip IR2110 (Infineon, Munich, Germany) is used to drive MOSFET at the switching frequency of pulse width modulation (PWM) waves which are generated by the ARM core chip STM32F407 (STMicroelectronics, Geneva, Switzerland). The expected voltage amplitude of the rectangular signal depends on the DC power’s voltage
Ud, while the frequency of the rectangular signal hinges on the PWM waves’ frequency.
A special mooring cable is designed as shown in
Figure 4. The external form of the mooring cable whose interior construction is in the form of a loop appears as a single cable by connecting two groups of interior wires at the end. The length of the mooring cable should be a little longer than the distance from the surface to the sensor’s deepest mounting position in seawater. A nylon rope is used to link the mooring cable and anchor. At the underwater sensor’s mounting position, the mooring cable is separated into two parts to leave space for the installation of the coupler. At the top, the mooring cable is connected to the buoy by a connector, and the cable’s two groups of wires are connected as the upper coupler’s secondary coil in the buoy body.
As
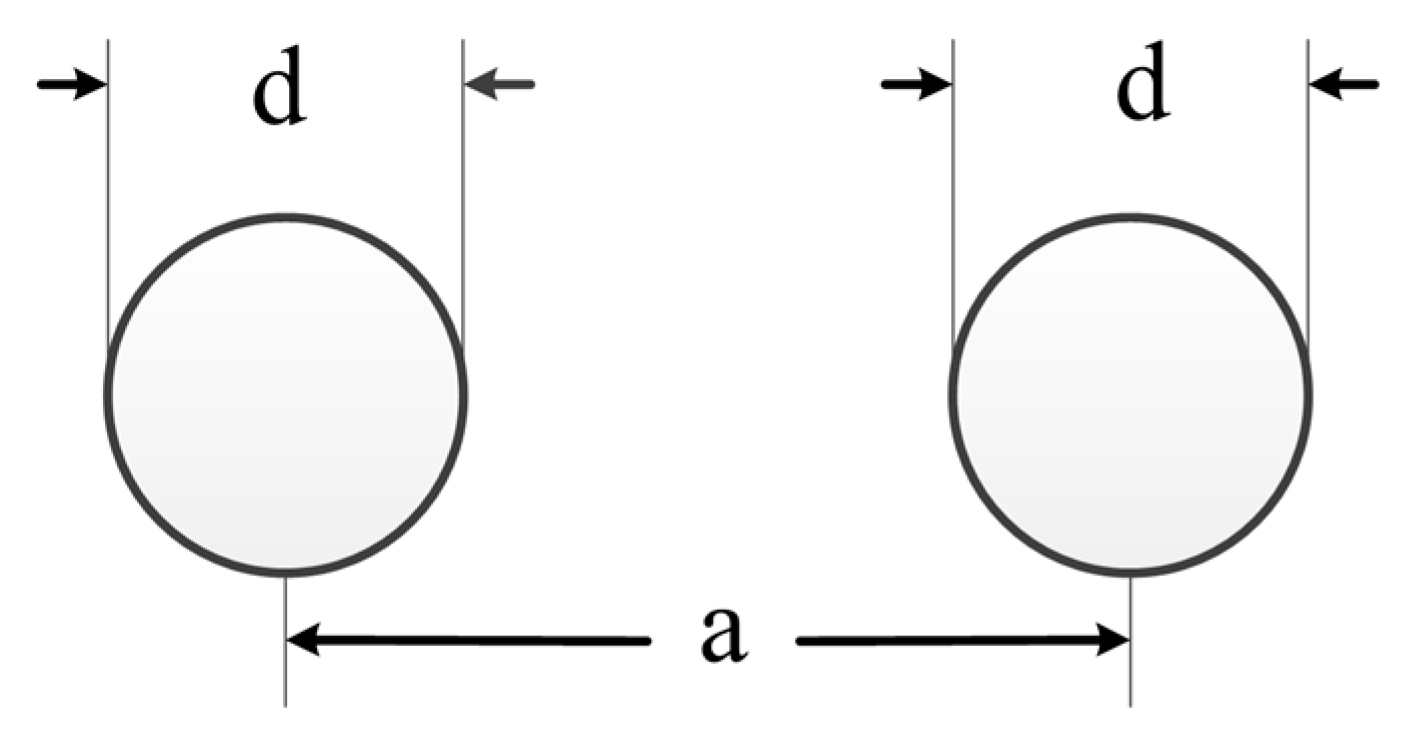
Figure 4 shows, the length of the branch cable is so small that the cable can be equivalent to a set of parallel wires as shown in
Figure 5. According to [
20], the inductance of cable can be calculated as follows:
where
l is the length of the parallel wires,
d is the diameter of wire, and
a is the distance between the two parallel wires. All of the above units are in m. According to
Figure 4, the values of parameters
l, d, and
a are fixed; therefore, the inductance of the mooring cable can be considered changeless.
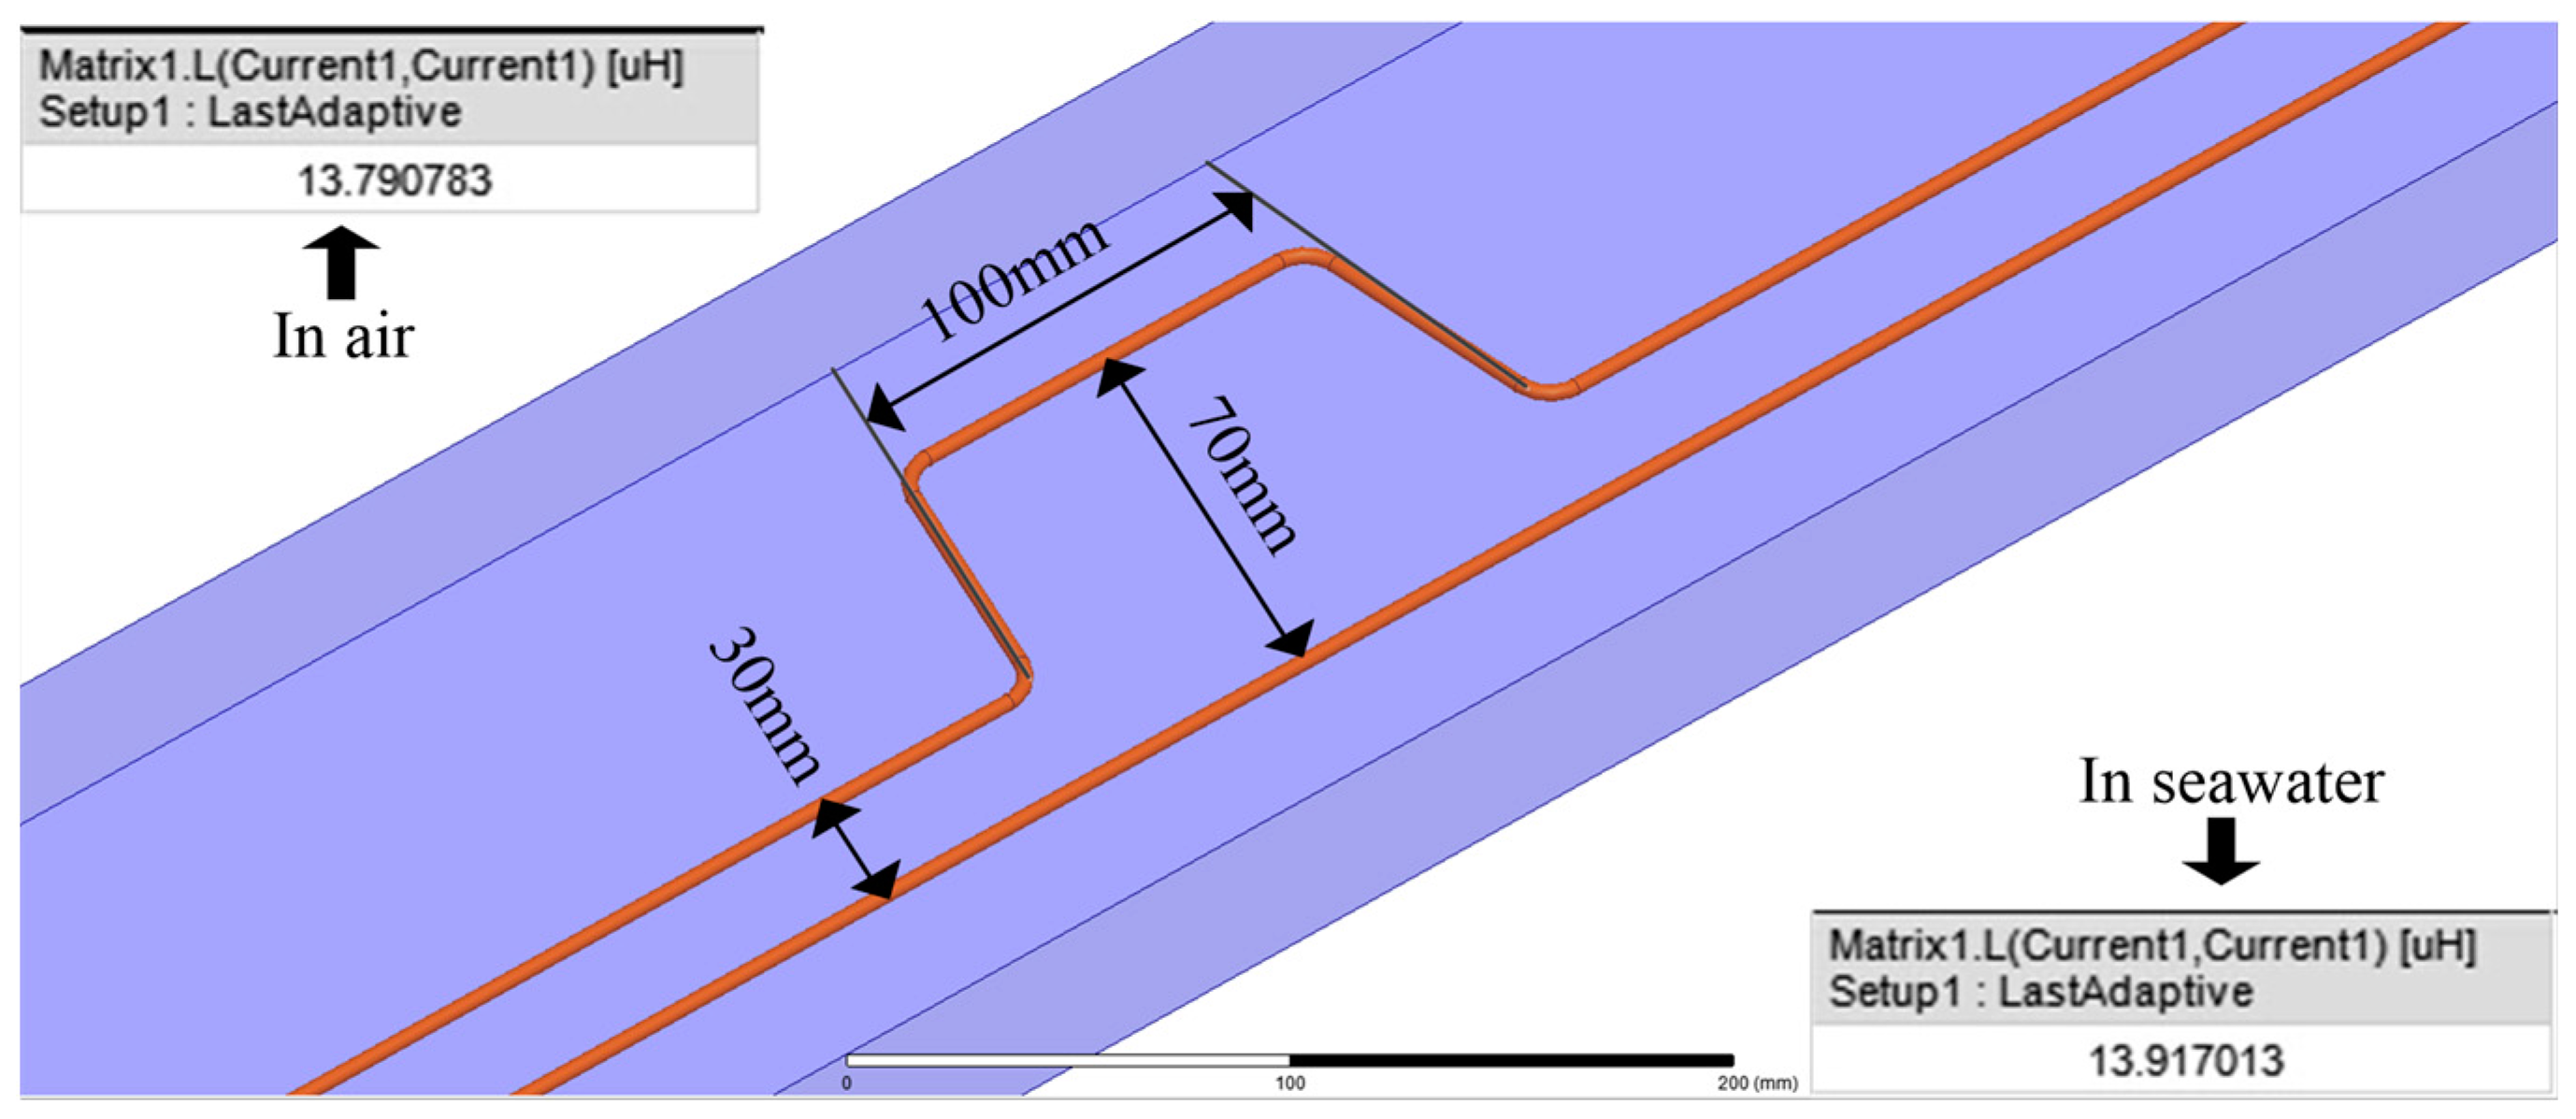
In order to verify the theoretical analysis, the simulations of the mooring cable’s inductance are carried out by Ansoft Maxwell. There is a shielding layer outside the wires to reduce the influence of the seawater. The parameters of the mooring cable applied in the simulation and following analysis are as follows: the length is 12 m, the distance between the two groups of wires is 3 cm, and the diameter of each group of wires is 4 mm. The simulation is carried out as shown in
Figure 6. Results show that the mooring cable’s inductance in air and seawater, respectively, is 13.8 and 13.9
. It can be observed that the inductance in the air and seawater is very close. Most importantly, we rented a ship to put the mooring cable in the seawater and measure the inductance of the mooring cable in the condition of bending, and the result indicates that the variation range of inductance is smaller than 0.1
, and the value is very close to that in air.
Compared with the traditional ICPT system, there are two couplers and a ring-form cable in this system. This will make the system model distinctive from the traditional ICPT system and have its own particularity.
3. Theoretical Modeling
The mutual inductance model and the T type model are commonly applied to analyze the coupling effect in ICPT systems [
21,
22,
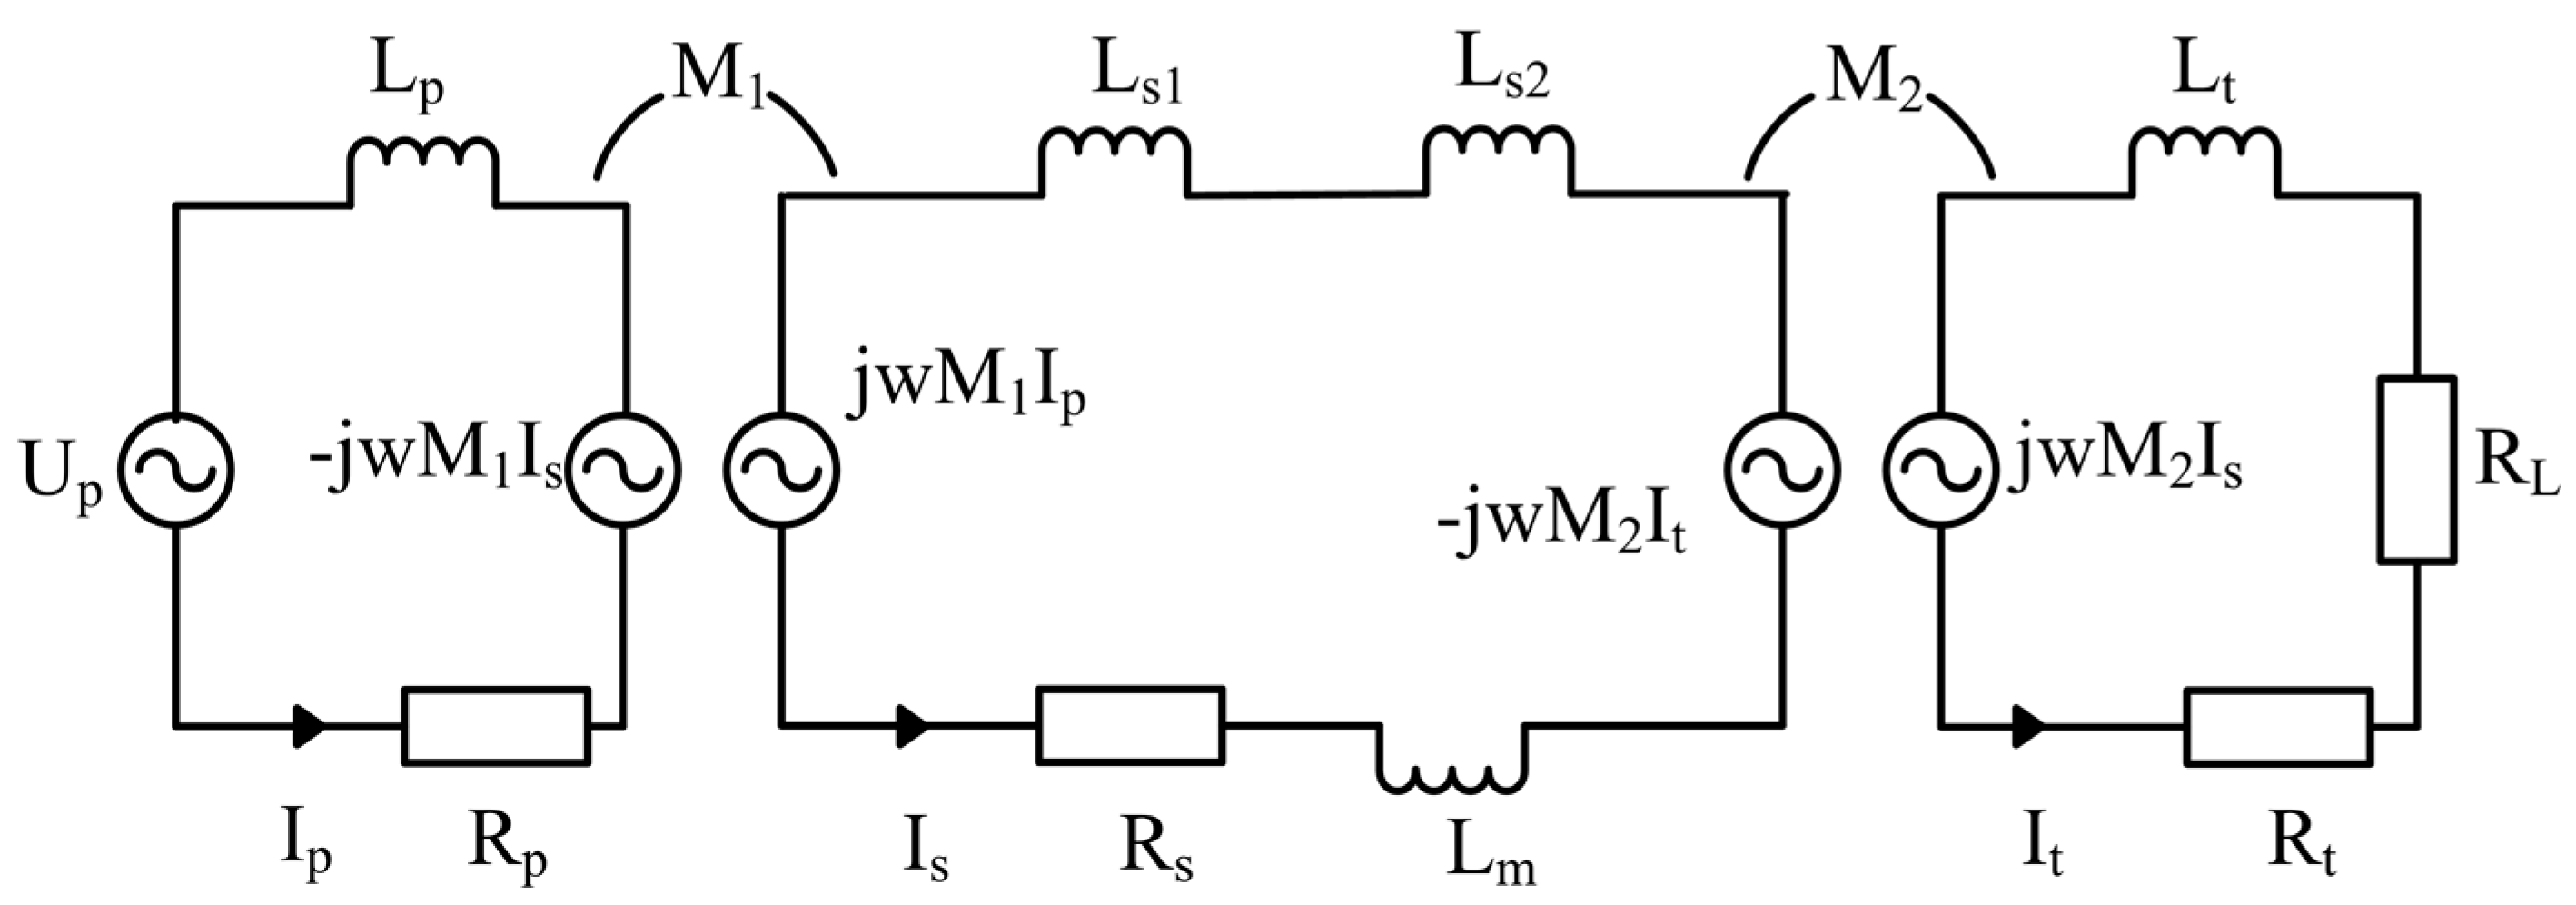
23]. The mutual inductance model that utilizes the induced voltage to describe the coupling effect is considered simpler than the T type mode in the analysis procedure. Thus, the system mutual inductance model is established and shown in
Figure 7.
The model’s associated parameters are summarized in
Table 1. It is critical that the mooring cable’s inductance is separated equivalently. According to the mutual inductance models,
and
, respectively, are the self-inductance of the upper coupler’s secondary and the lower coupler’s primary windings.
equals the self-inductance related to the part of the mooring cable that threads through the upper magnetic core,
equals the self-inductance related to the part of the mooring cable that threads through the lower magnetic core. The numbers of the upper coupler’s secondary winding and the lower coupler’s primary winding are both one. The windings’ length that threads through the magnetic cores is so small that the decrease of the mooring cable’s inductance brought by separation can be ignored. Therefore,
in
Table 1 approximately equals the inductance of the mooring cable with no magnetic cores mounted. Through the above separation, it can be observed that
and
do not vary with the mooring cable’s length, and
is constant due to the analysis in
Section 2.
We introduce a new parameter
to facilitate analysis. It is defined as follows:
Then, the mathematical expressions of the system’s three current loops can be obtained as follows:
where
is the voltage amplitude of the rectangular signal, and
is the angular frequency of the rectangular signal.
,
, and
, respectively, are current in the upper coupler’s primary winding, the mooring cable, and the lower coupler’s secondary winding. Let
The equations of the three loops’ current can be obtained from Equations (6) and (7):
The coefficient of mutual inductance, which changes with the windings’ number, the position, the dimension, and so on, will bring difficulties to the analysis of the model. From [
24], the coupling factor
k primarily associated with the section of the magnetic core is relatively stable. The expression of
k is defined in (11) [
25].
where
and
, respectively, are the self-inductance of the coupler’s primary winding (Coil A) and the secondary winding (Coil B),
is the total flux of the primary winding when it is excited, and
is the total flux of the secondary winding when it is excited.
and
, respectively, are the fractions of
and
that link the corresponding coil, and
and
, respectively, are the coupling factors when Coil A or Coil B acts as the primary coil. In this paper,
and
which, respectively, are the upper and lower coupler’s coupling factors, can be obtained by replacing
and
in (11) with
,
or
,
in
Table 1. For a certain ICPT system similar to this paper, the coupling factor is constant.
Therefore, in order to facilitate the analysis, we use the coupling factor to replace the coefficient of mutual inductance. The voltage of the load can be described by the following equation:
where
and
, respectively, are the coupling factors of the upper and lower couplers. The voltage gain
, power
, and efficiency η can be obtained as follows:
It can be observed that the voltage gain , power , and efficiency η, which are summarized as the power transfer performance, are related to the coupling factor, the frequency, the inductance of windings, and the impedance of the mooring cable.
4. Parameter Analysis and Compensation
A prototype system is established with original parameters as shown in
Table 2. Upper and lower magnetic cores are all the same in material and size. The material of the magnetic core is Mn–Zn ferrite with a relative initial permeability of 10
4. The shape is annular, and the size is 85.7 mm (outer diameter) × 55.5 mm (inner diameter) × 25.4 mm (thickness). The magnetic core is separated into two halves with an air-gap to facilitate the installation. The end faces of the core are mirror-finished, and the air-gap can be estimated to be smaller than 1 μm. Copper-made Litz wires are used as the winding wires with parameters as follows: 0.2 mm (single wire diameter) × 20 (number of threads). The original number of the upper coupler’s primary and that of the lower coupler’s secondary windings are both 7. To the ferrite core, under the low power and frequency condition in this paper, the core loss is so small that it is ignored in the analysis. The parameter analysis is carried out based on the system model.
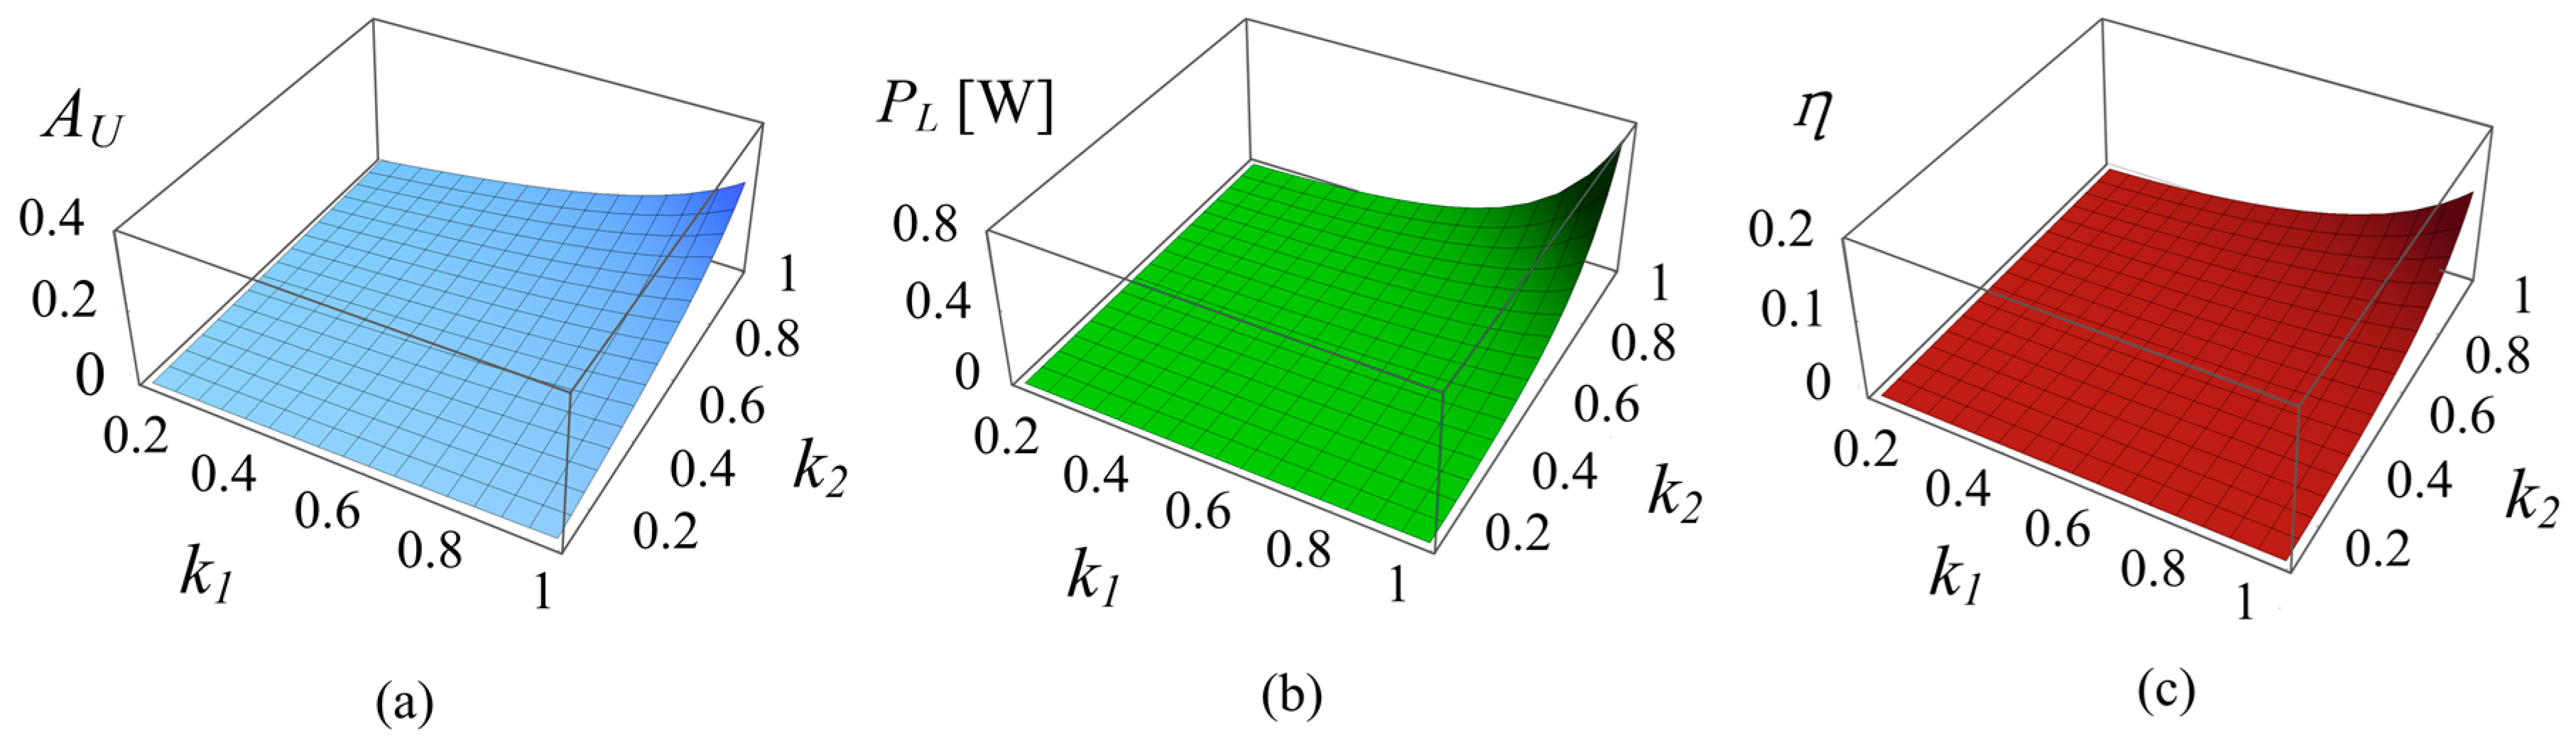
4.1. Analysis of Coupling Factor
The coupling factor, which is a very important parameter in the ICPT system, can affect the power transfer performance [
26]. Expressions of voltage gain
, power
, and efficiency η are shown as Equations (13)–(15) in
Section 3. By substituting parameter values in
Table 2 to Equations (13)–(15), the equations covered the power transfer performance, and
and
could be obtained. According to the equations, the surface diagrams of the relationship between the power transfer performance and
and
can be obtained as shown in
Figure 8.
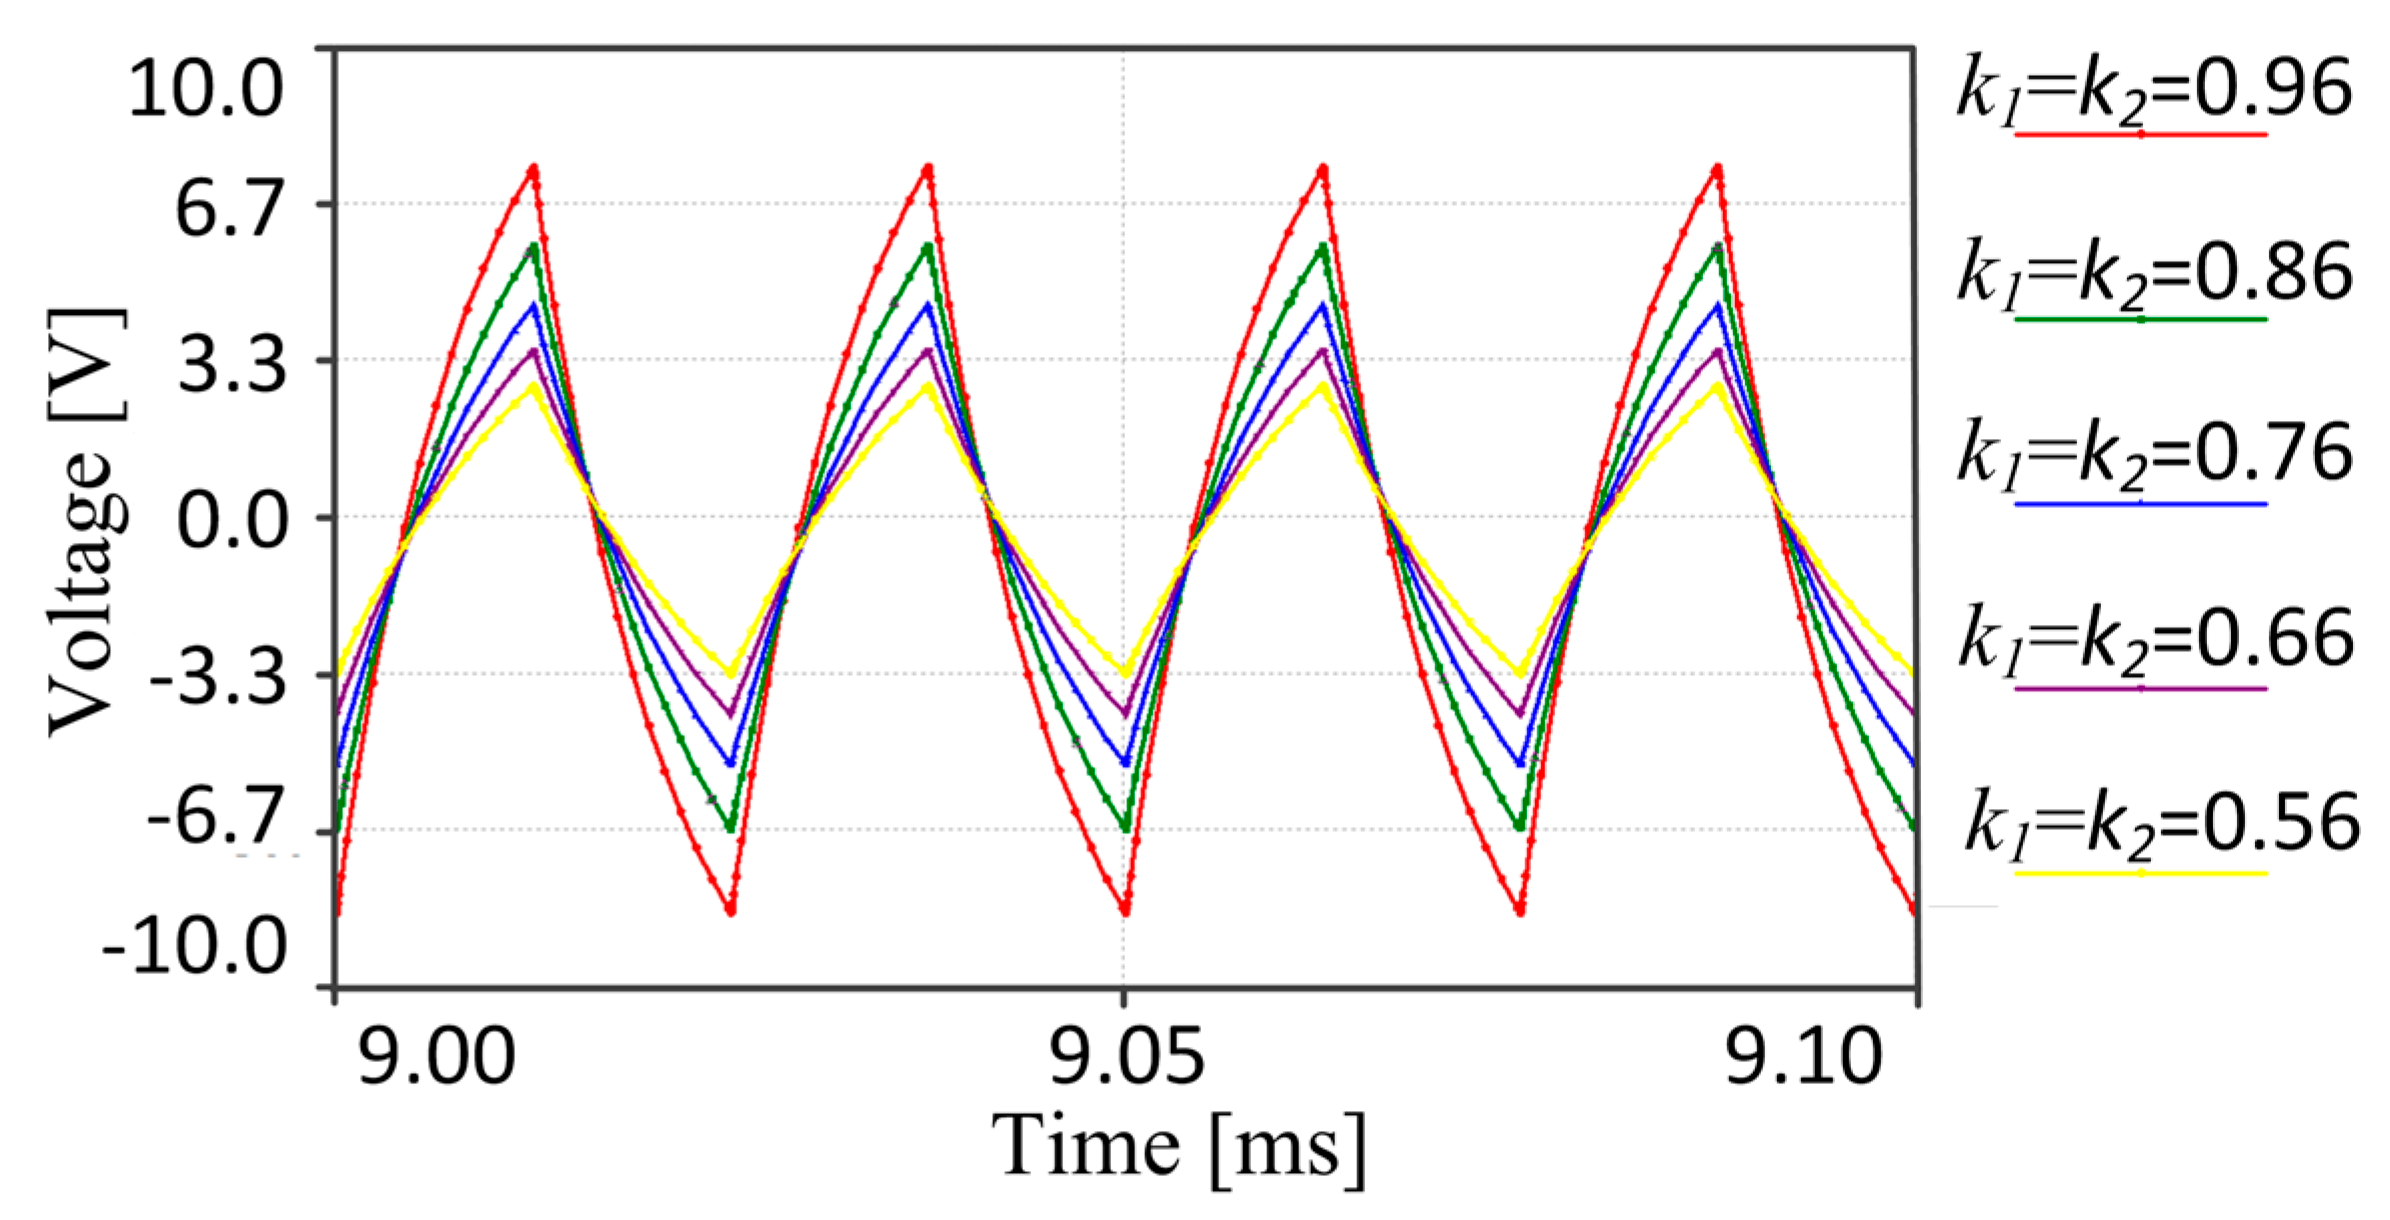
The result shows that all three indicators of power transfer performance increase with and . From the definition of the coupling factor in (11), a higher coupling factor will lead to a larger mutual flux at the same total flux and then a higher induced voltage can be obtained in the secondary winding.
The coupling factor is primarily related to the structure of the core, especially the air-gap between the two half cores. The large air-gap will lead to an extremely low coupling factor. Couplers in this system are composed of two semicircular halves to make the installation expedient. A sealing device is produced to isolate the seawater and impact the two half magnetic cores closely. The practical measured values of coupling factors are
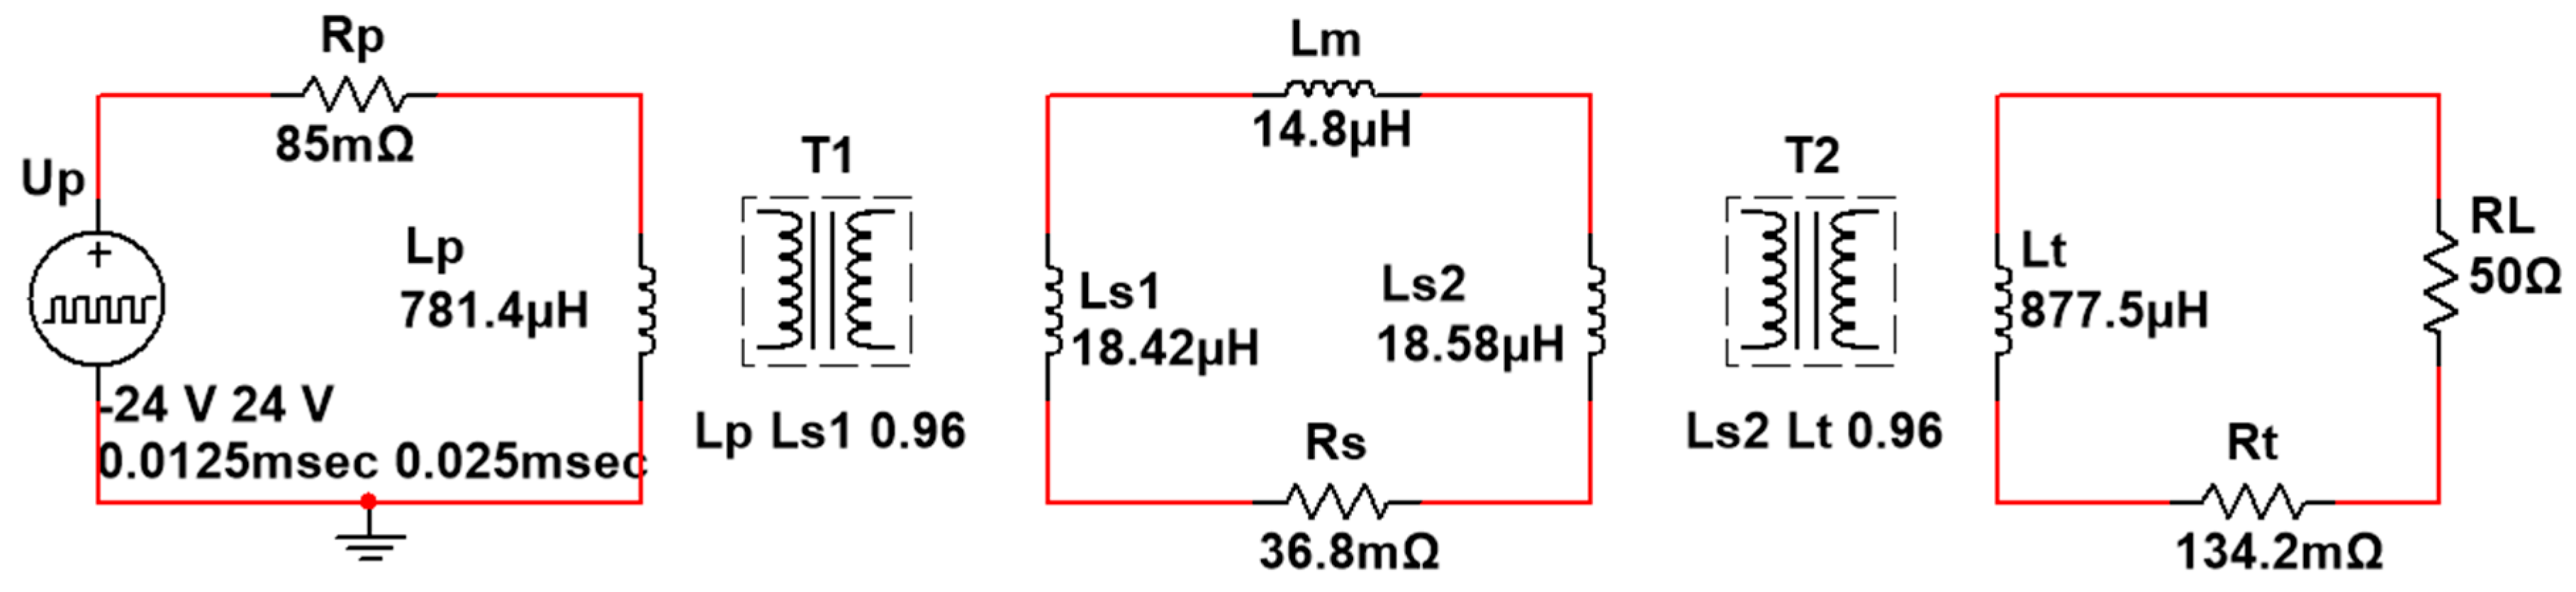
. These values are used in the following analysis. In this paper, Multisim is used to simulate the power transfer in order to verify the model. The details of the simulation model are shown in
Figure 9. The load’s voltage waveforms with different coupling factors obtained by simulation are shown in
Figure 10. Results coincide with mathematical analysis.
4.2. Analysis of Frequency
There is a typical working frequency range to a specific magnetic core. According to the principle of the transformer, equations can be obtained as follows:
where
e is the induced voltage,
is the magnetic flux,
B is the magnetic flux density,
N is the turn of winding, and
A is the area of the core section. The signal’s cycle length is inversely proportional to the frequency. When fixing the induced voltage, according to Equation (16), the magnetic flux imported to the coupler will be small, while the frequency becomes excessively high. Then,
i will be small since
L and
N are fixed. The voltage source is used as the power source in this system; therefore, the power transfer will be small as the current becomes small. The frequency cannot be excessively small, because this will lead to a high current and power loss in the mooring cable and windings. A suitable frequency is important to this system.
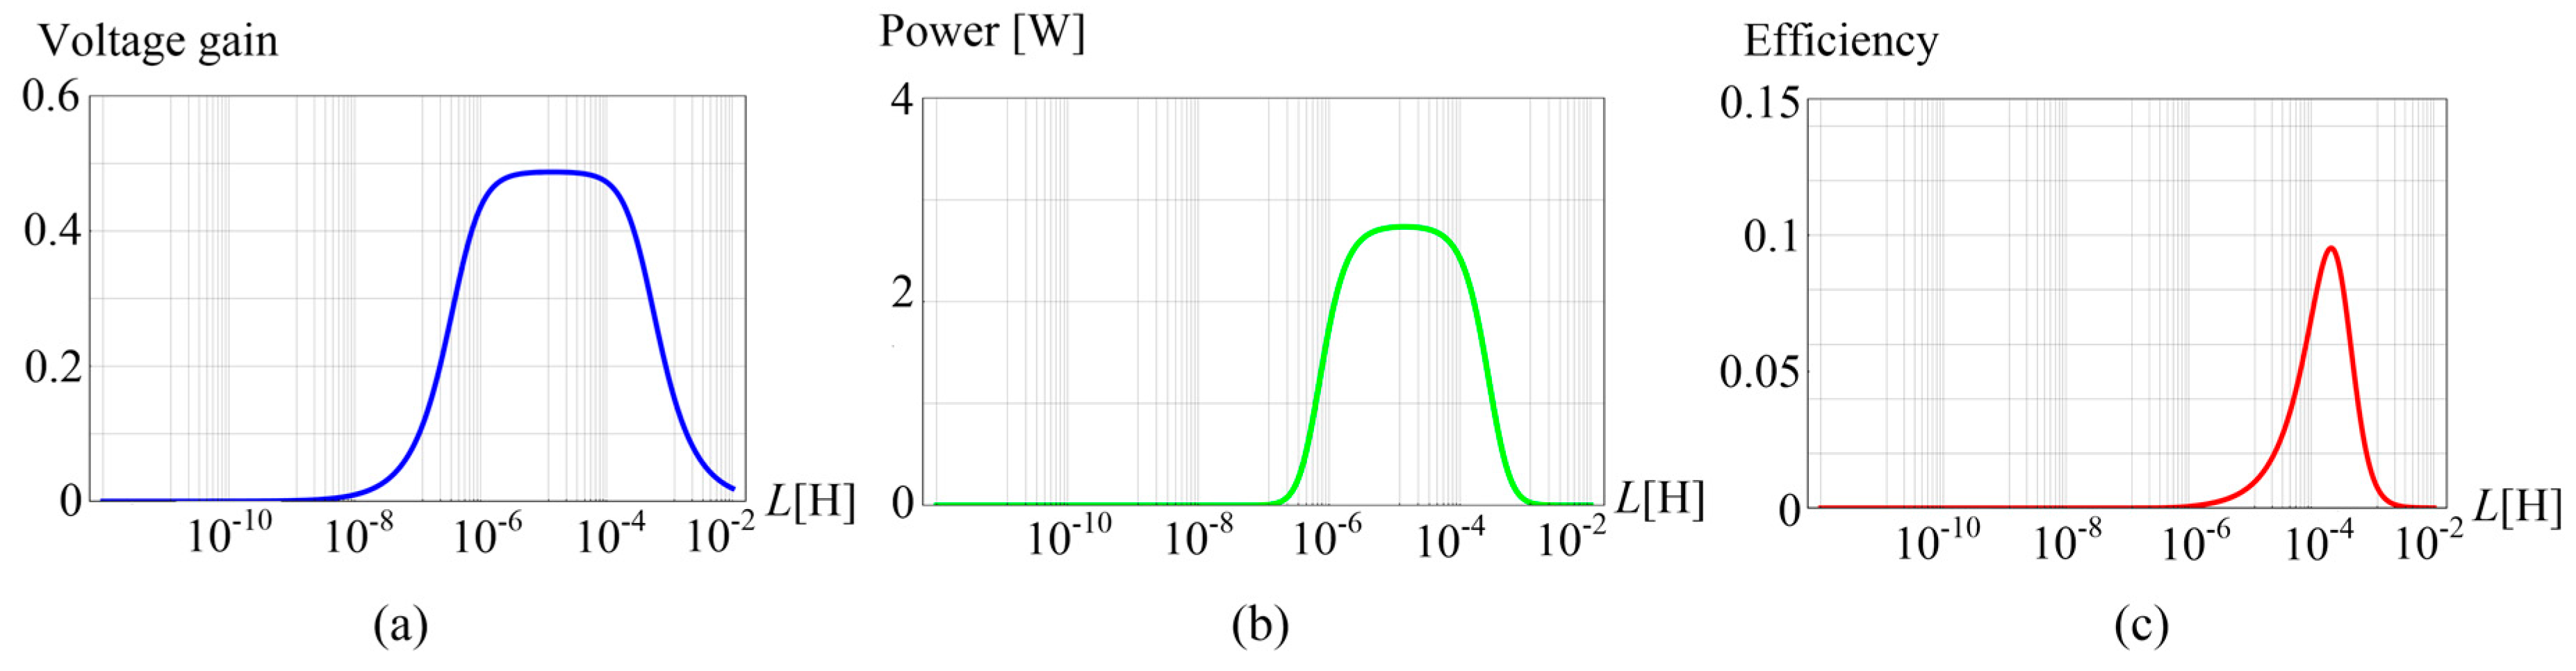
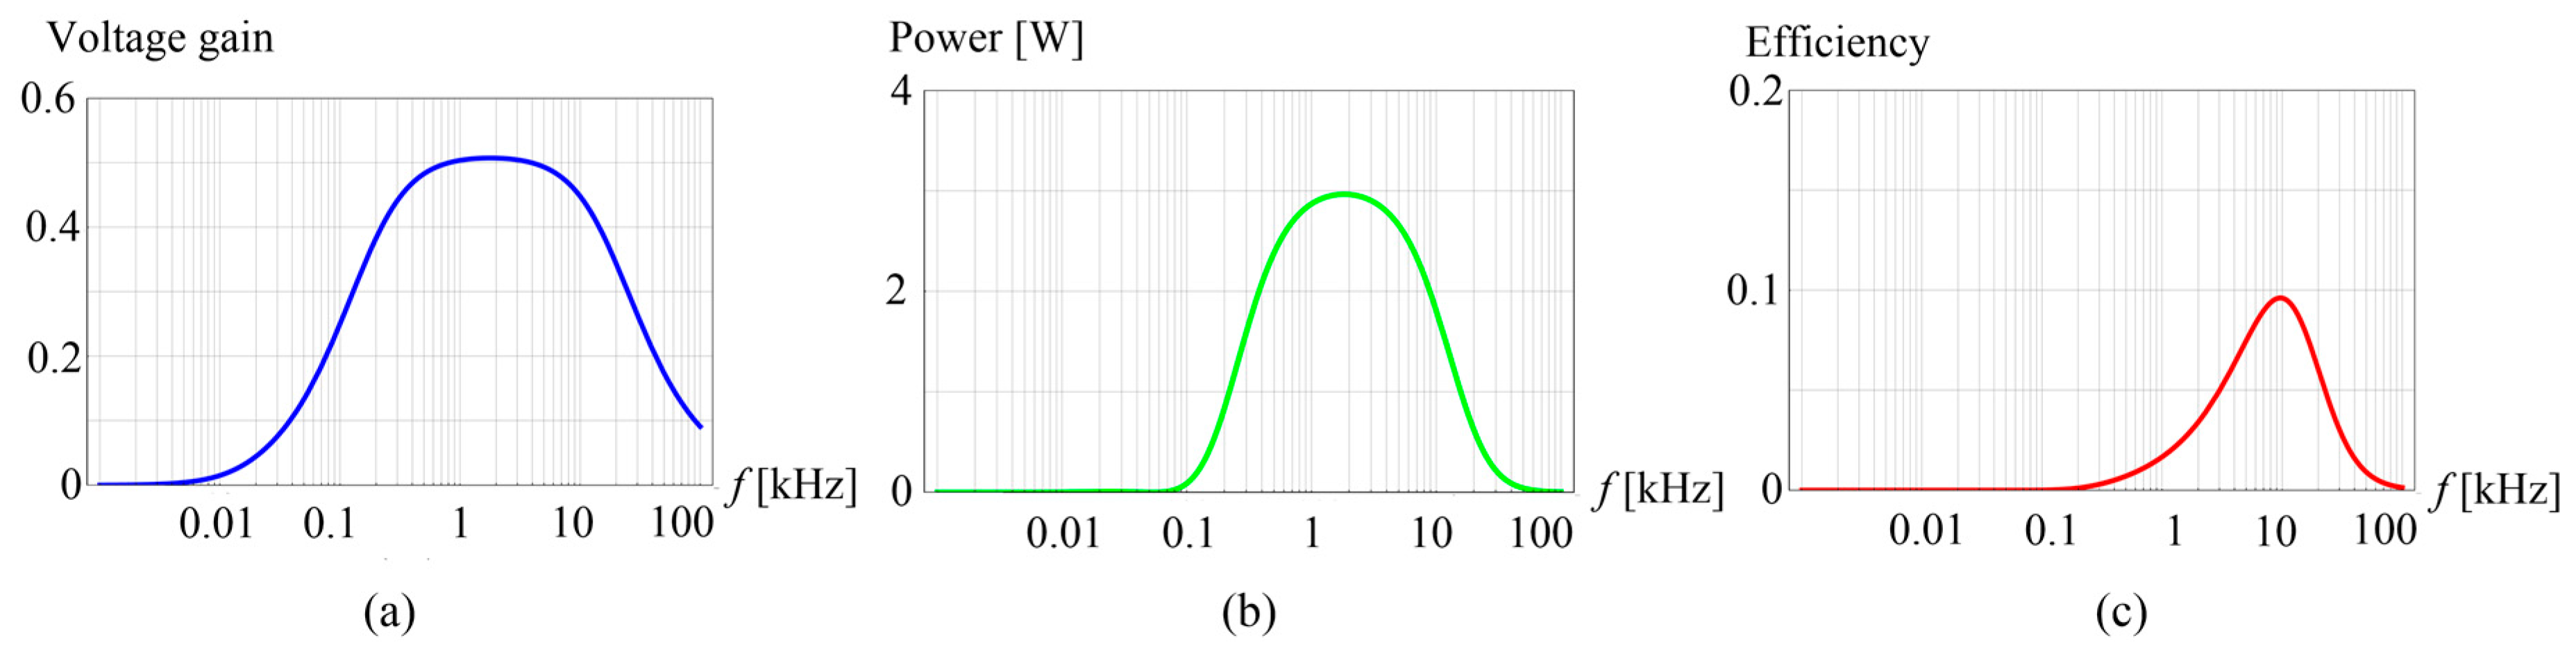
The parameter values in
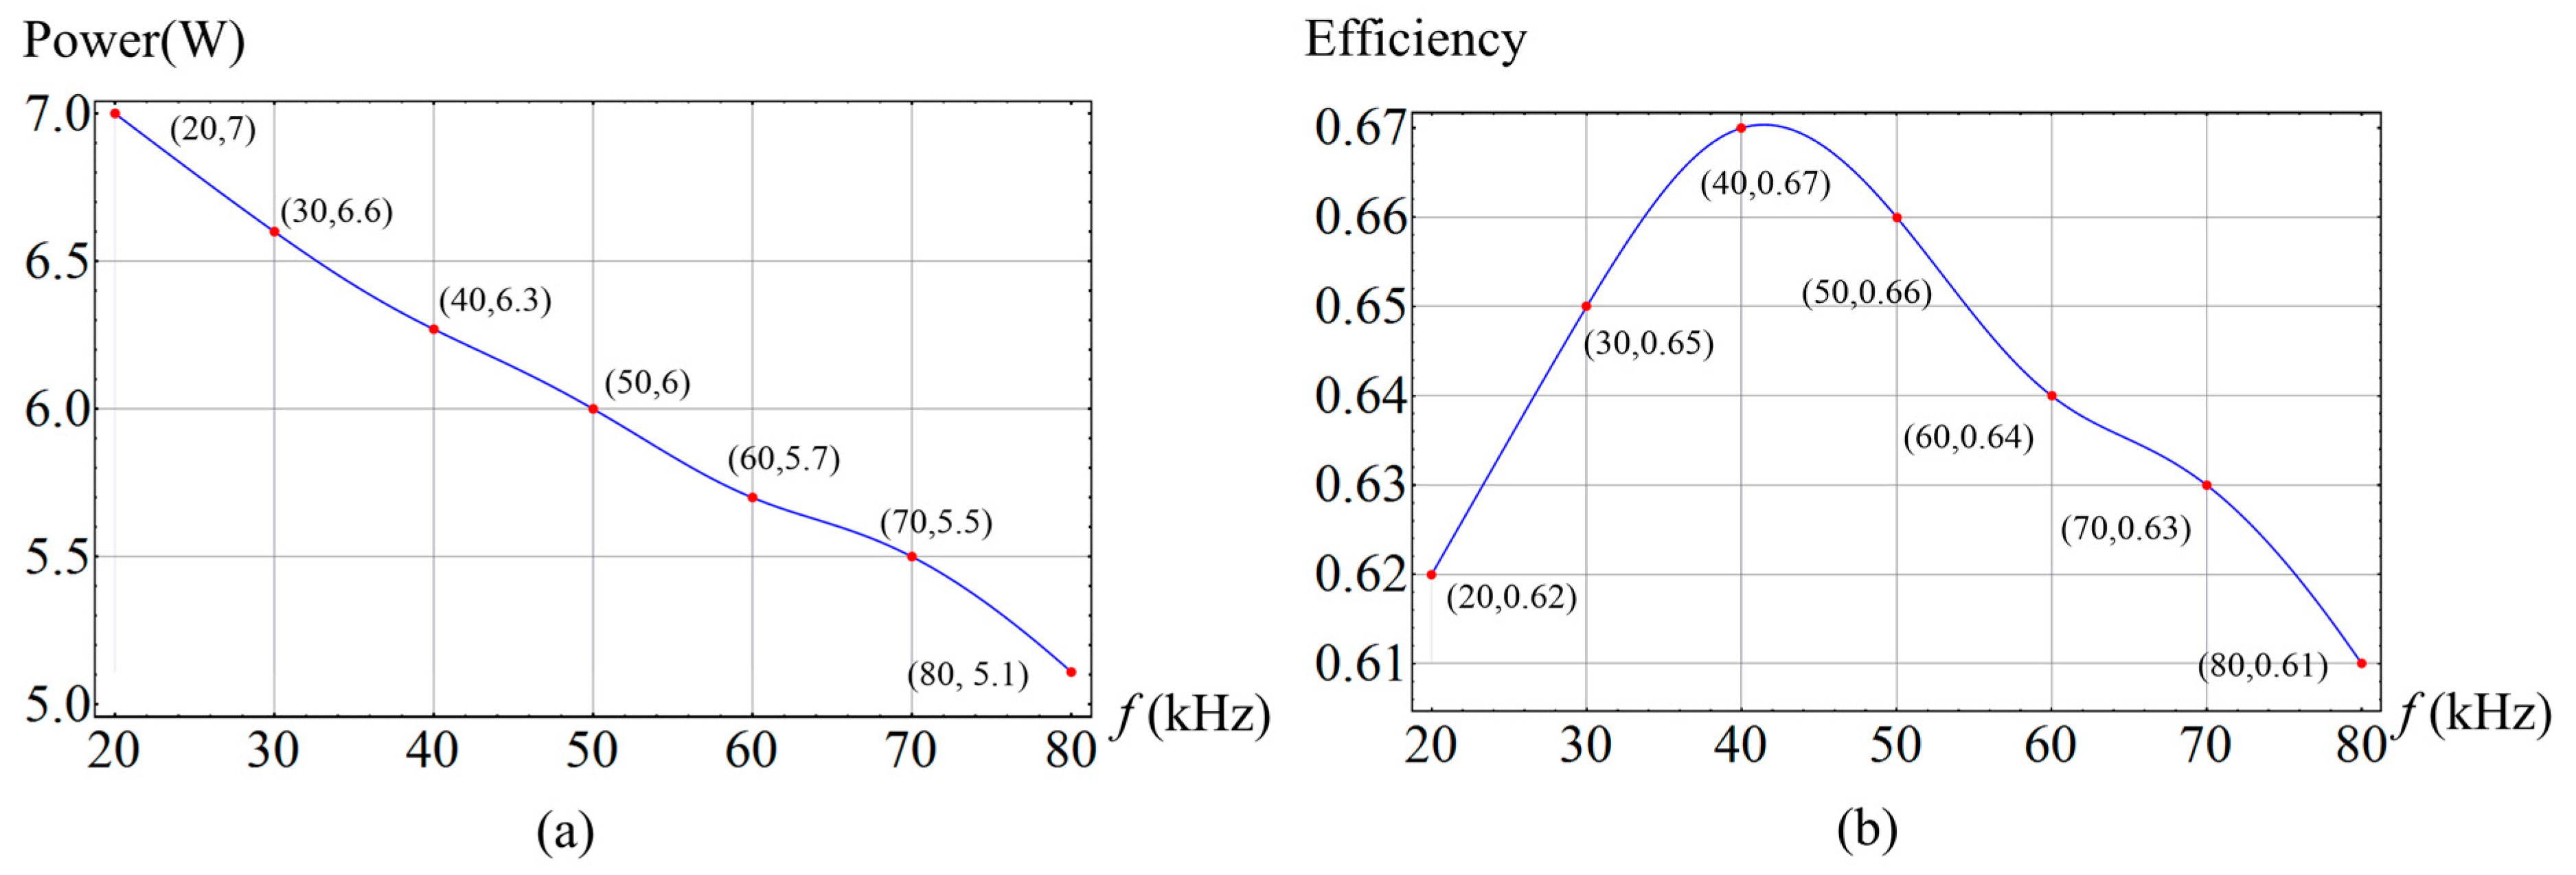
Table 2 are substituted to Equations (13)–(15), and the influence of frequency of the power transfer performance is analyzed. Curve charts of power transfer performance related to the frequency are shown in
Figure 11.
From
Figure 11, it can be seen that frequency values that make power transfer and efficiency reach their maximums are not identical. When the frequency equals 1.8 kHz, the voltage gain and the power achieve maximums simultaneously, and the maximum power is 3 W. When frequency equals 9.7 kHz, the efficiency achieves a maximum and the value is 9.6%. The simulation results of the maximum power transferred and efficiency are as follows:
As the model calculations are ideal, results of the simulation are somewhat different.
4.3. Analysis of Coupler’s Winding
In this system, turns of the upper coupler’s secondary and the lower coupler’s primary winding are both fixed at a value of one. Thus, only the influence of the upper coupler’s primary and the lower coupler’s secondary windings is discussed. The influence of the coupler’s windings behaves chiefly as an impact of the windings’ self-inductance. Since the material and the structure of the upper and lower couplers are all the same, to simplify the analysis, let . Thus, turns of the upper coupler’s primary winding and the lower coupler’s secondary winding are equal. According to Equation (16), changes of inductance will affect the current. When L (excited inductance) becomes small, the current and the loss in the windings and the mooring cable become large. On the other hand, when L becomes large, the current received by the load becomes small. Thus, it is necessary to take account of loss and power when assigning values to L.
Substituting parameter values in
Table 2 to Equations (13)–(15), the curve charts of the power transfer performance related to the coupler’s windings can be obtained, as
Figure 12 shows.
As shown in
Figure 12, the power of the load reaches maximum 2.7 W when
(turn is about 1); however, the current at that time is very high. Efficiency reaches a maximum value of 9.5% when
(turn is about 2). The simulation results of the maximum power and efficiency are as follows:
Through analyzing the current in the system, we found that the influence of the coupler’s windings presents as the effect of the current in the system. When power reaches a maximum, losses in windings and the mooring cable are significant, such that efficiency is very low at that time.
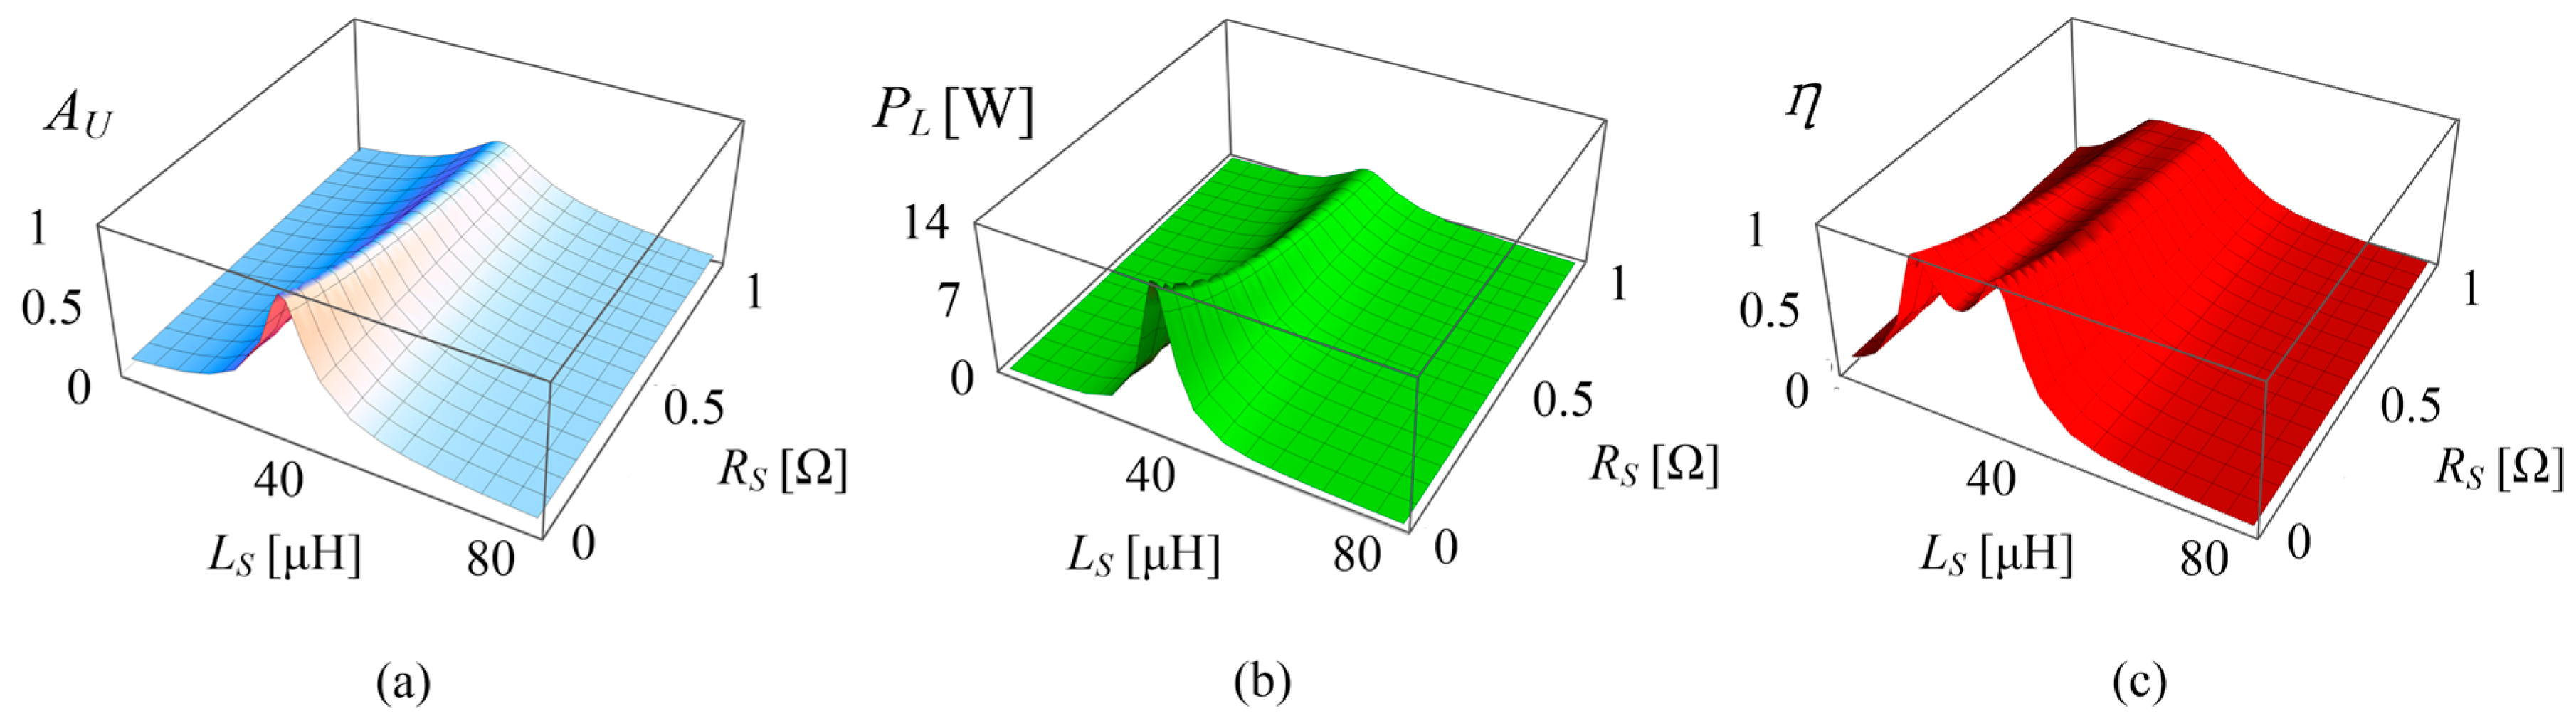
4.4. Analysis of Mooring Cable and Compensation
According to the system model, the impedance of the mooring cable is represented by
,
,
, and
. The relationship between
,
,
, and
are defined in Equation (5). Similarly, surface diagrams of the power transfer performance related to
and
are obtained as shown in
Figure 13.
From
Figure 13, it can be observed that the smaller
is, the higher the power transfer performance will be. Since there is an alternating current in the mooring cable, Litz wires are utilized to reduce the influence of the skin effect. Lower resistivity is also necessary to the mooring cable. There is one value of
that makes
and
reach their maximums, whereas there are two values of
that make η reach its maximum.
Substituting parameter values except for
in
Table 2 to Equations (13)–(15), values of
that make power and efficiency reach their maximums can be obtained by solving the equations. Results show that, when
equals
,
and
reach their maximums, and maximum power is 12.9 W; when
equals
or
, only η can reach its maximum, and maximum efficiency is 85.2%. However, when
equals
, the voltage gain and power are very small. Consequently, the value of
that makes power and efficiency reach their maximums are almost the same, and
is used to represent it.
The summation of the self-inductance of the upper coupler’s secondary winding and the lower coupler’s primary winding is
Comparing the value with
, we find
According to the analysis above and Equation (18), the smaller the self-inductance of the mooring cable is, the higher the power transfer performance will be. This is because reactive power, which is generated by the inductance element, has a strong impact on power transfer. LC resonant compensation can be used to reduce the influence of the inductance element in the ICPT system. To implement compensation, the compensation capacitor is added to the mooring cable as shown in
Figure 1 and
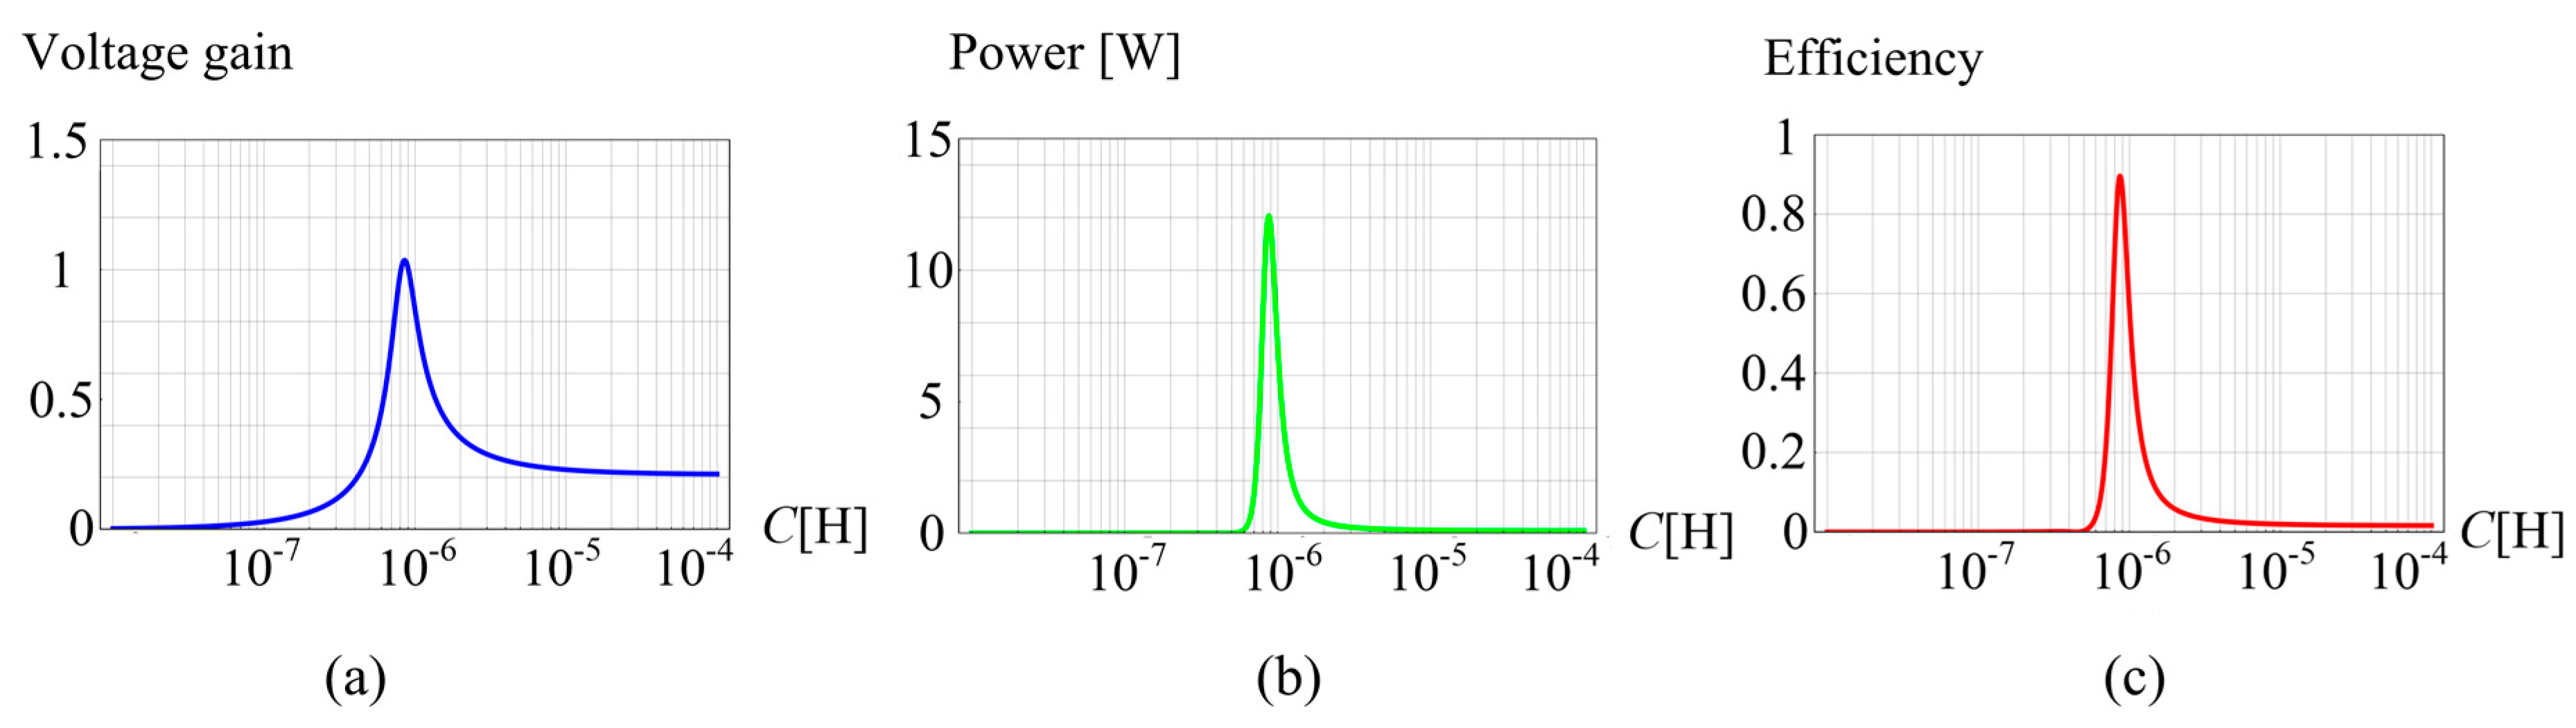
Figure 2. The principle of compensation is that the imaginary part of the system’s whole impedance equals zero. According to the system model and the parameters in
Table 2, the value of the compensation capacitor is calculated to be 0.86
. Surface diagrams of power transfer performance related to the compensation capacitor are obtained as shown in
Figure 14. It can be observed that, when the compensation capacitor equals 0.86
, the power transfer and efficiency reach maximums.
From the analysis in
Section 4.1,
Section 4.2,
Section 4.3 and
Section 4.4, it can be found that, although adjusting the coupling factor, the frequency, and the coupler’s winding can improve the system’s power transfer, the effect is not significant. Applying resonant compensation is able to gain a higher power transfer and efficiency.


