Article

Multi-Time Scale Control of Demand Flexibility in Smart Distribution Networks

1
Idaho National Laboratory, Idaho Falls, ID 83415, USA
2
Department of Energy Technology, Aalborg University, 9220 Aalborg, Denmark
3
Department of Electrical and Computer Engineering, Michigan Technological University, Houghton, MI 49931, USA
*
Author to whom correspondence should be addressed.
Energies 2017, 10(1), 37; https://doi.org/10.3390/en10010037
Submission received: 13 October 2016 / Revised: 16 December 2016 / Accepted: 19 December 2016 / Published: 1 January 2017
(This article belongs to the Special Issue Smart Microgrids: Developing the Intelligent Power Grid of Tomorrow)

Abstract

:
This paper presents a multi-timescale control strategy to deploy electric vehicle (EV) demand flexibility for simultaneously providing power balancing, grid congestion management, and economic benefits to participating actors. First, an EV charging problem is investigated from consumer, aggregator, and distribution system operator’s perspectives. A hierarchical control architecture (HCA) comprising scheduling, coordinative, and adaptive layers is then designed to realize their coordinative goal. This is realized by integrating multi-time scale controls that work from a day-ahead scheduling up to real-time adaptive control. The performance of the developed method is investigated with high EV penetration in a typical residential distribution grid. The simulation results demonstrate that HCA efficiently utilizes demand flexibility stemming from EVs to solve grid unbalancing and congestions with simultaneous maximization of economic benefits to the participating actors. This is ensured by enabling EV participation in day-ahead, balancing, and regulation markets. For the given network configuration and pricing structure, HCA ensures the EV owners to get paid up to five times the cost they were paying without control.

1. Introduction

The future power system is anticipated to undergo major transformation as shown in Figure 1 due to changes in the mode of electricity generation and transportation. Recently, increased environmental concerns and favorable government policies are leading to increased penetration of renewable energy sources (RESs), such as wind and solar PVs, in many countries (e.g., USA, Denmark, and Germany) [1,2,3]. This transformation is progressively phasing-out large power plants which were conventionally used for balancing purposes [2]. Moreover, limited rotational inertia and low-power regulation capability of RES create potential issues on power balancing and system stability of the existing power system.
On the other hand, electrification of transportation sector, one of the highest energy consumption sectors, is rapidly transforming existing fossil fuel vehicles towards electric vehicles (EVs) [2]. The increased penetration of EVs congests most of the existing networks, thereby requiring grid reinforcements to host them [4]. However, due to faster response and vehicle-to-grid (V2G) features, EVs can offer great deal of flexibility [5]. This paper presents smart EV charging control strategies to exploit their flexibilities for system balancing and congestion management of smart distribution grids, with simultaneous maximization of economic benefits.
The remainder of the paper is structured as follows. Recent related works are reviewed in Section 2. Next, detailed EV modeling is presented in Section 3. Section 4 presents EV charging strategies from consumer, distribution system operator (DSO), and aggregator’s perspectives. A hierarchical control architecture (HCA) is proposed in Section 5 to realize the multi-time scale control, and the performance of the HCA is demonstrated in Section 6. Finally, the paper concludes in Section 7.

2. Recent Related Work

Recently, EVs are gaining significant attention from research communities to deploy their flexibility for providing system balancing or local congestion management. Authors in [6,7,8,9,10,11,12,13] proposed various control algorithms and strategies for utilizing EVs flexibility for system balancing purposes. In particular, supplementary load frequency control using aggregated devices (e.g., EVs [6], EVs and heat pumps [7], air-conditioners [8], and residential water heaters [9]) are developed to exploit EV flexibilities for system level balancing. Similarly, the performance of an aggregated V2G and an area control error approach for providing frequency regulation are demonstrated in [10,12]. The authors in [13] further developed a framework for ensuring EV to participate in multiple electricity markets. Such aggregated EVs deployment provides good insights for system planning, but cannot assure that the network constraints and individual consumer requirements are satisfied.
Actual control of EV must assure consumer, DSO, and aggregator requirements, which are often conflicting. Most of the current literatures often decouple the EV charging problem and analyze from a single actor’s perspectives. For instance, minimization of charging costs, is the key objective for EV owner. To address those concerns, authors in [14] proposed EV charging algorithm to maximize the comfort, and in [15,16,17] presented techniques to manage flexibility considering customer preferences.
To ensure grid constraints are within limits, EV charging control is normally carried out by maximizing network performance with simultaneous assurance of thermal and voltage constraints limits. The authors in [18,19] investigated impacts of different charging schemes in distribution networks and developed various control algorithms (e.g., energy shifting [20], load profile smoothing [21], valley filling [22], peak-shaving [23], and loss minimization [24]) to address grid issues. In addition, an adaptive control algorithm based on predefined voltage and current sensitivity is proposed in [25] to mitigate grid constraints violations. Despite technical advantages, economic aspects are often not well-respected while charging EV from network perspectives.
To simultaneously respect technical and economic concerns, authors in [26] proposed an optimum EV charging control strategy from aggregator perspectives. Optimized EV charging control based on cost minimization [27,28,29,30,31] and risk assessment [32] is developed to simultaneously realize cost minimization and respect network constraints. In addition, distribution market based EV charging coordination is developed in [33,34,35,36,37] to enable EV participation in multiple electricity markets. However, those approaches lack capability to address any real-time operational uncertainties that may stem from errors in load forecast and EV plug-in/-out estimates. This requires a rigorous and generic approach to simultaneously assure consumer comfort, technical constraints, and profit maximization during EV charging. The novel contributions of this paper include:
(1)
An optimum EV charging algorithm from EV owner, EV aggregator, and DSO perspectives, is developed and a coordination framework among them to apprehend their coordinative goal is designed.
(2)
A HCA consisting of scheduling, coordinative, and adaptive control layers is designed to ensure EV participation to day-ahead, balancing, and regulation markets.
(3)
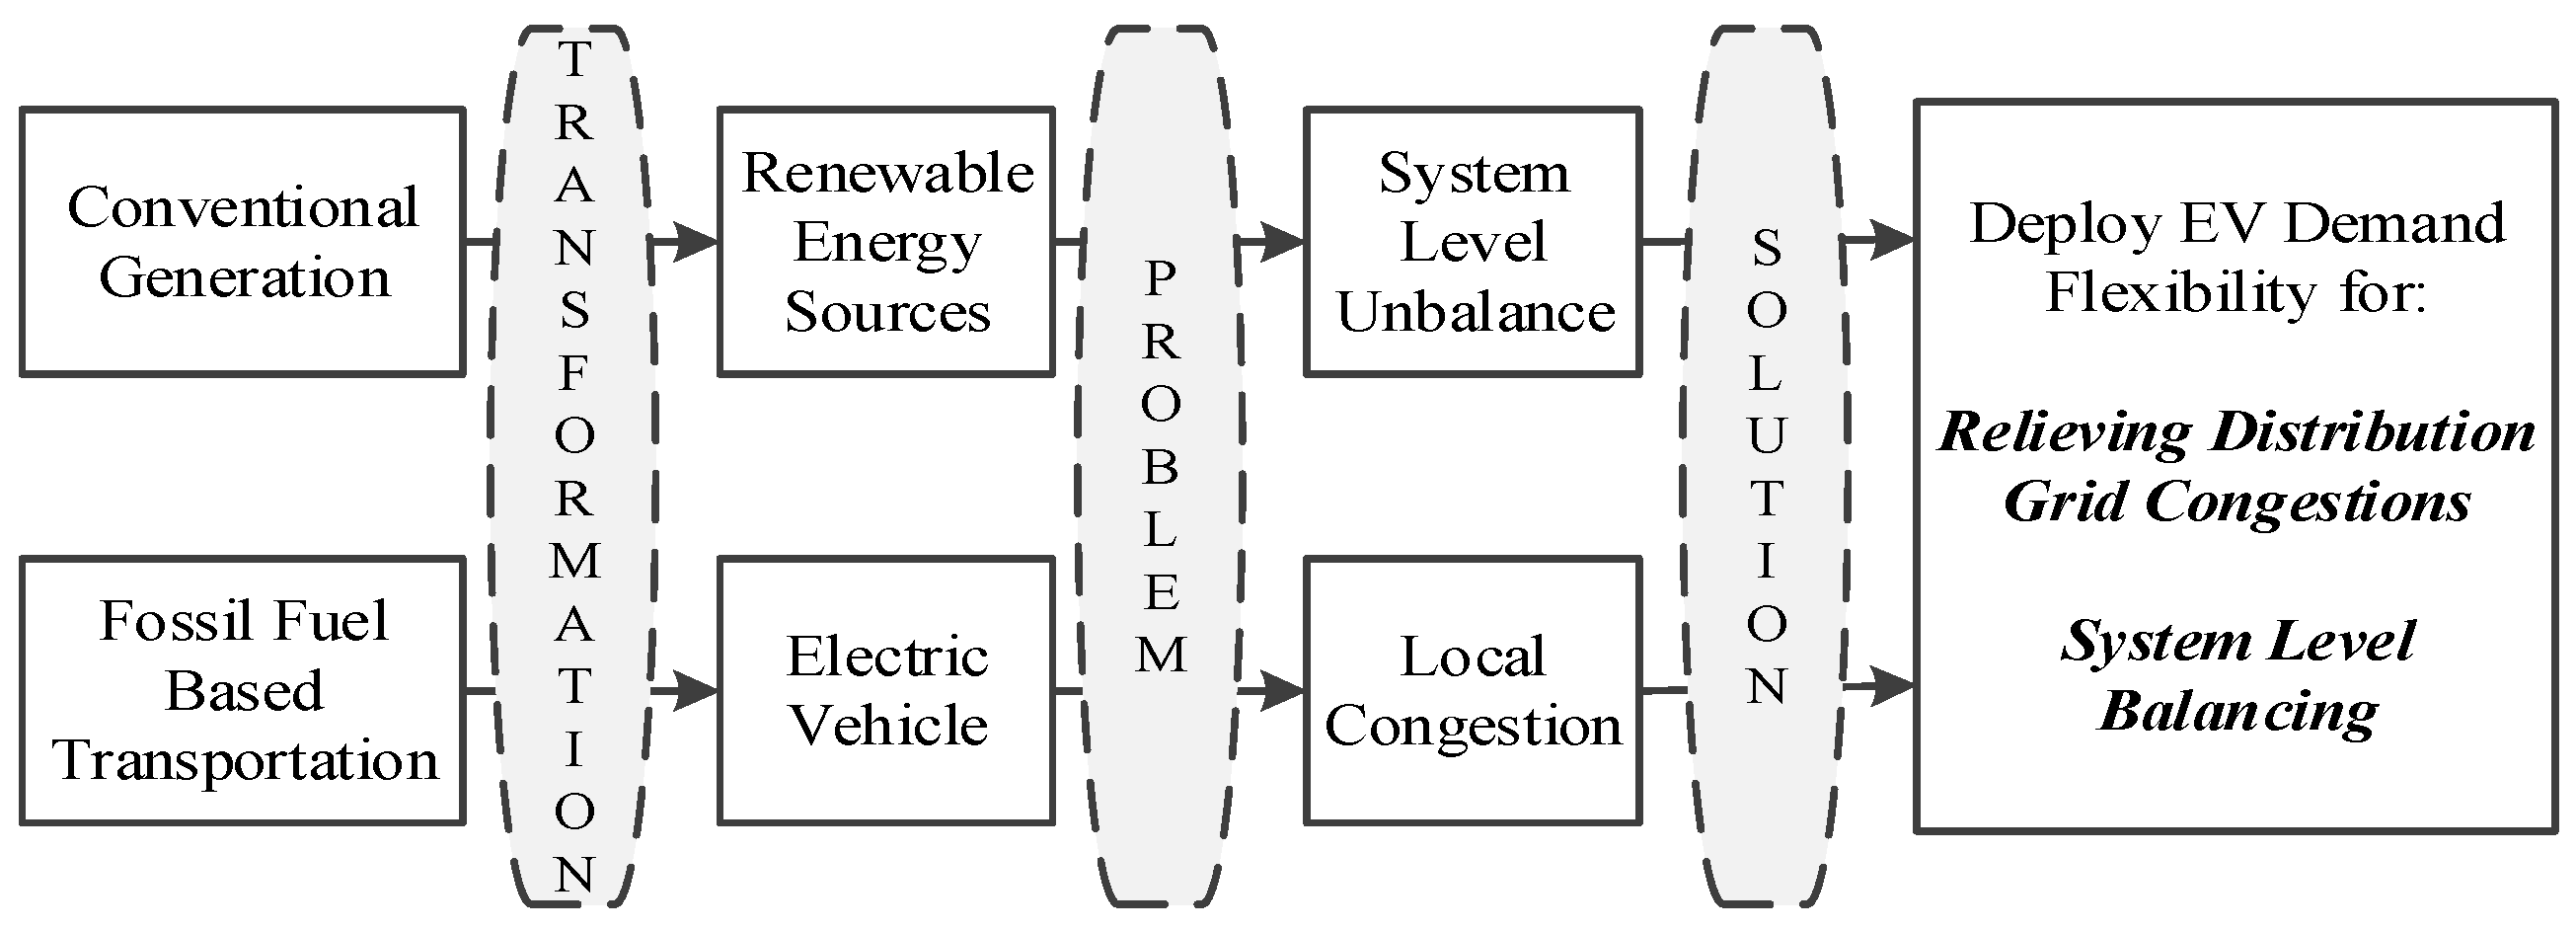
A multi-time scale control that works from a day-ahead scheduling up to real-time control is proposed to simultaneously utilize EV flexibilities for solving both grid balancing and network congestions management.

3. Modeling and Characterization of Electric Vehicle

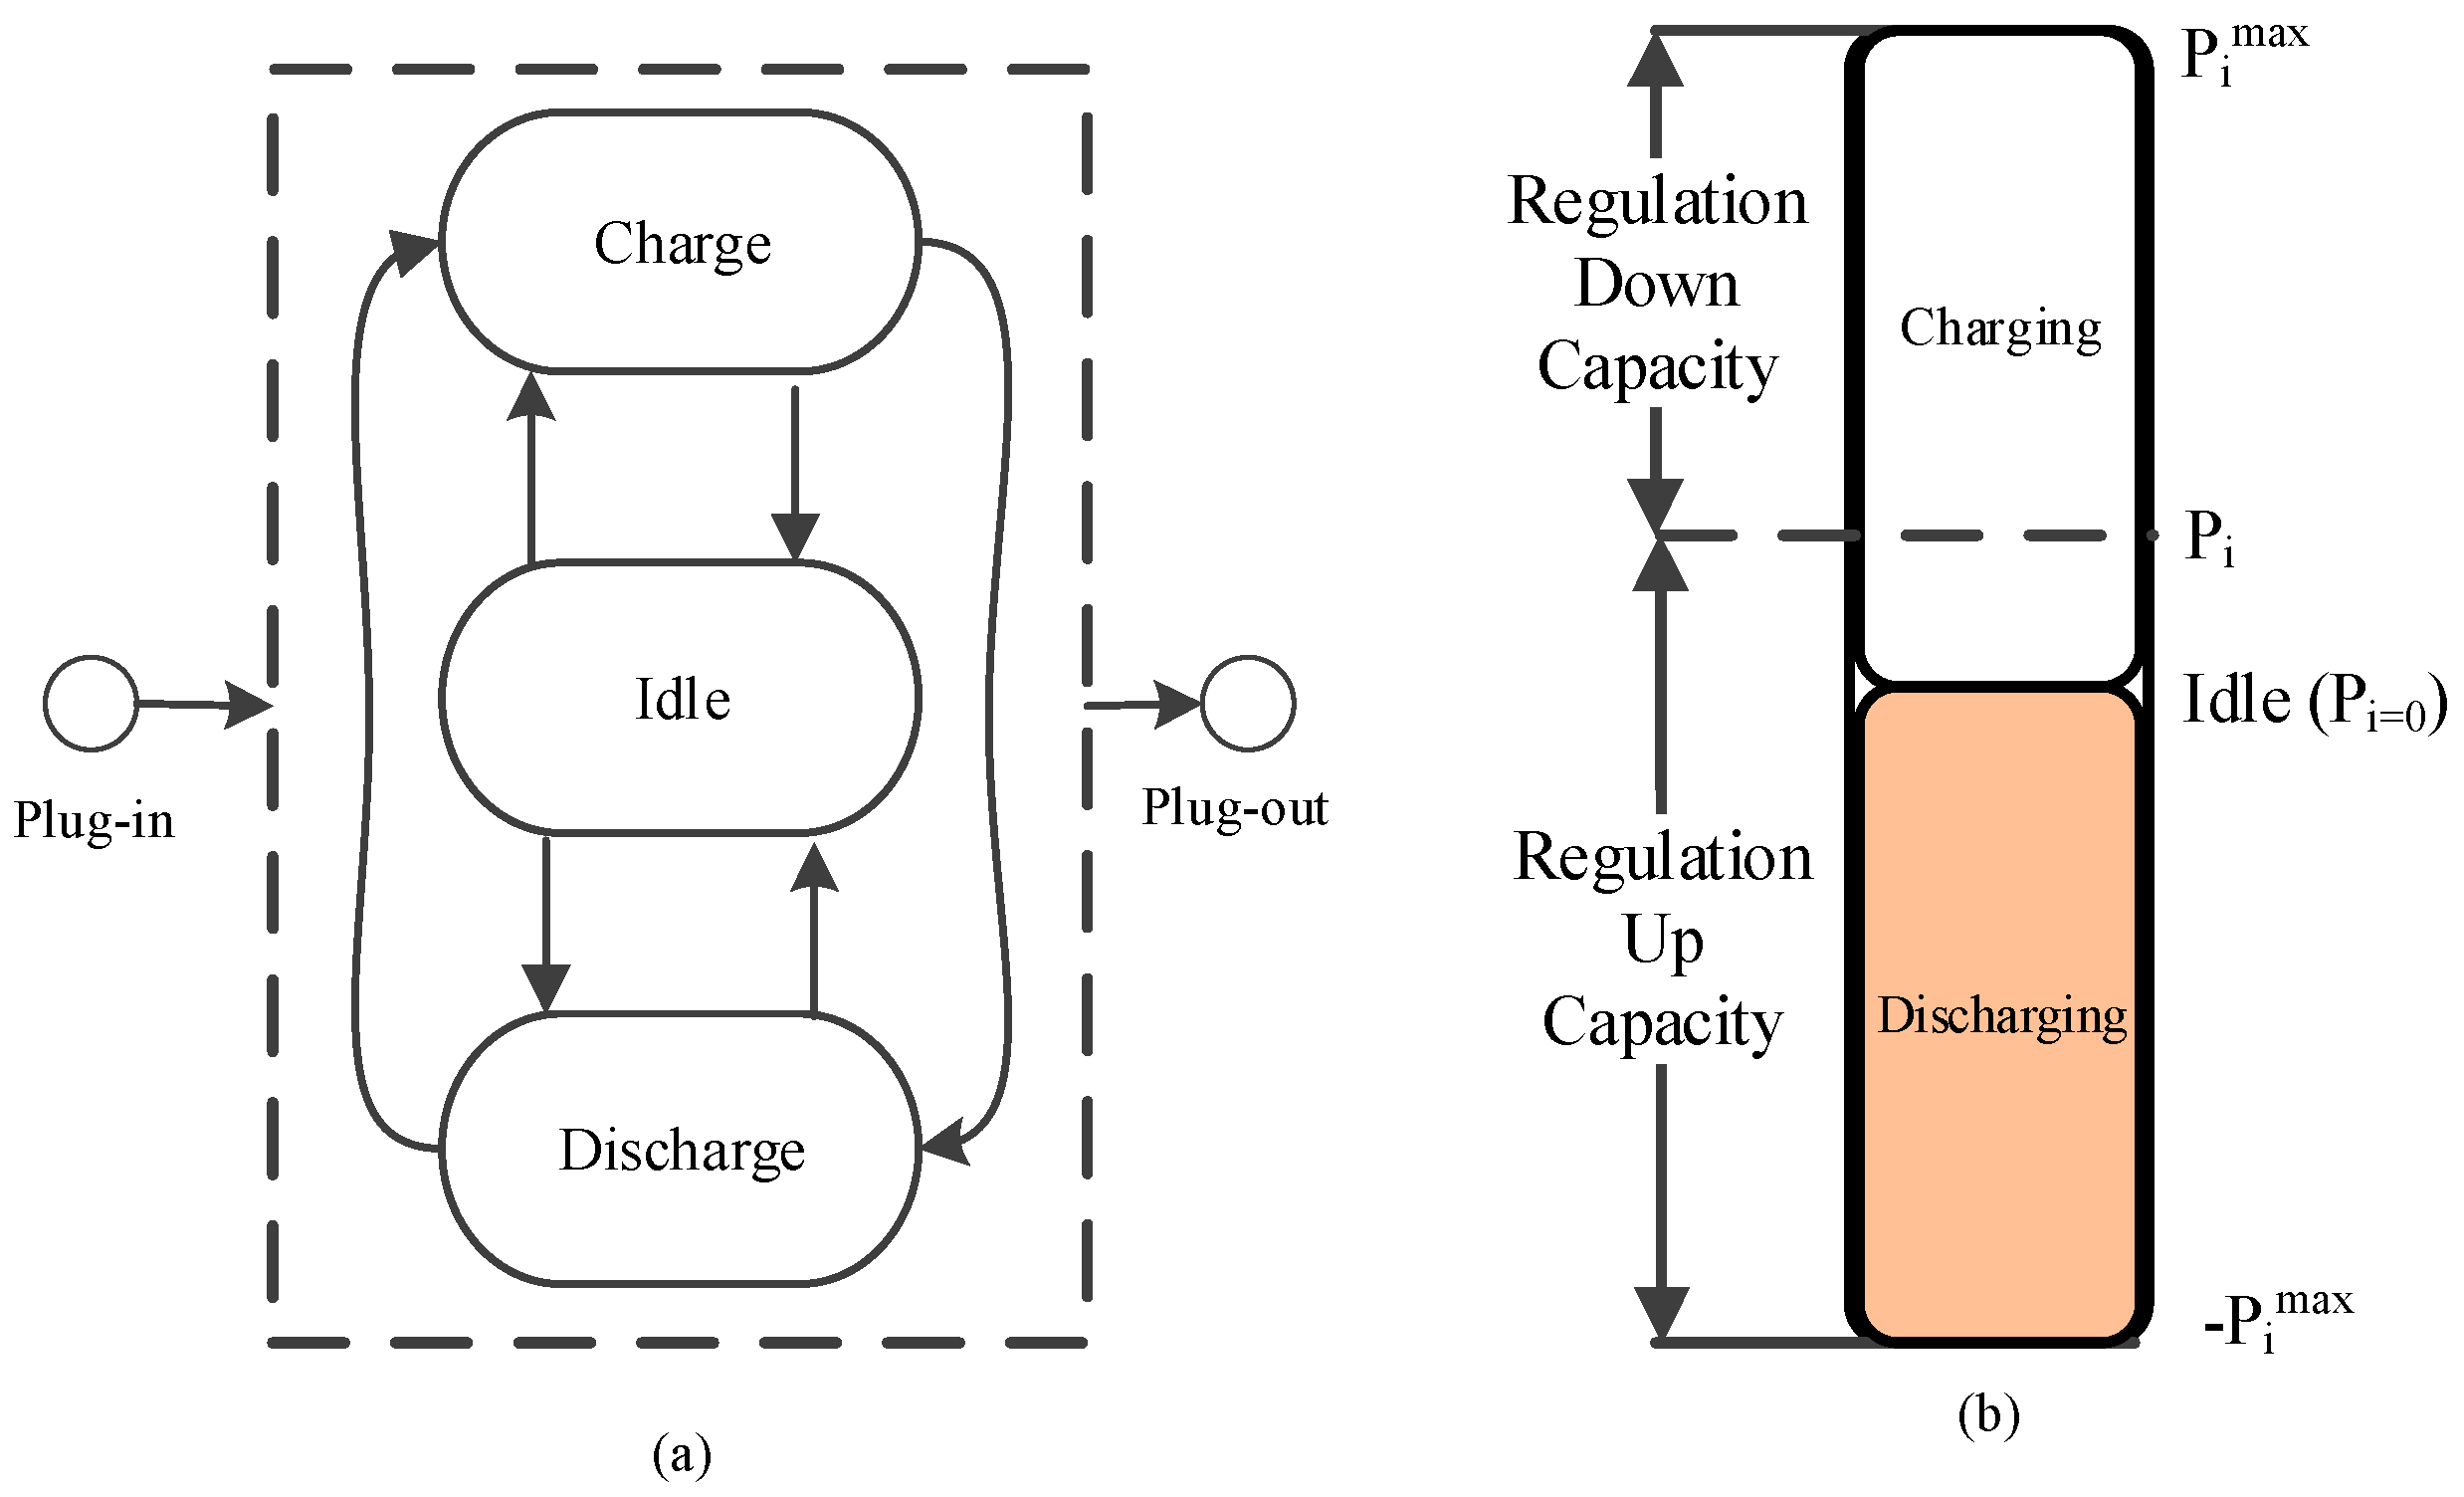
3.1. Electric Vehicle Modeling

From power system perspective, an EV is a storage device which can be regarded as an electrical load while charging and a static generating source while discharging. Therefore, EV in this paper is modeled as a three state model as shown in Figure 2 and detailed in the following subsections.

3.1.1. Charging

During charging, EV is modeled as a constant power load such that its power is a continuous control variable ranging from zero to its maximum (max) power rating ( P i max ) as:
P i chg [ o    P i max ]   S O C i S O C i max
where P i chg is the charging power, S O C i max is the maximum allowable state-of-charge (SOC), and subscript i denotes the EV index. Note that the charging power is constrained by given S O C i max .

3.1.2. Discharging

EV is essentially a static generating source of injecting power back to the grid in discharging mode of operation and is modeled as follows:
P i dsg [ o    P i max ]   S O C i S O C i min
where P i dsg is the discharging power and S O C i min is the minimum (min) allowable SOC.

3.1.3. Idle

During idle mode, EV is connected to the grid, but it neither draws nor injects power. However, the EV can still provide both up and down regulation capability even during its idle state.
Figure 2 depicts a graphical representation of up and down regulation capability of an EV, which is computed mathematically as follows:
P i up = P i EV ( P i max ) P i dn = P i max P i EV
where P i up and P i dn are, respectively, the up and down regulation capacities for the ith EV operating at P i EV . The higher the value of P i max , the higher the total regulation potential of the EV would be. One notable attribute is that P i up is normally higher than P i dn while charging and vice-versa.
As the key focus of this paper is to enable EVs for providing multiple grid supports, a simple three state model is implemented. In particular, the focus of this paper is to develop a mechanism to utilize EV flexibilities in various grid supports rather than on explicitly consideration of battery degradation, non-linearity, and charging/discharging efficiencies. Nonetheless, a detailed investigation of the battery performance will be done as an extension of this work.

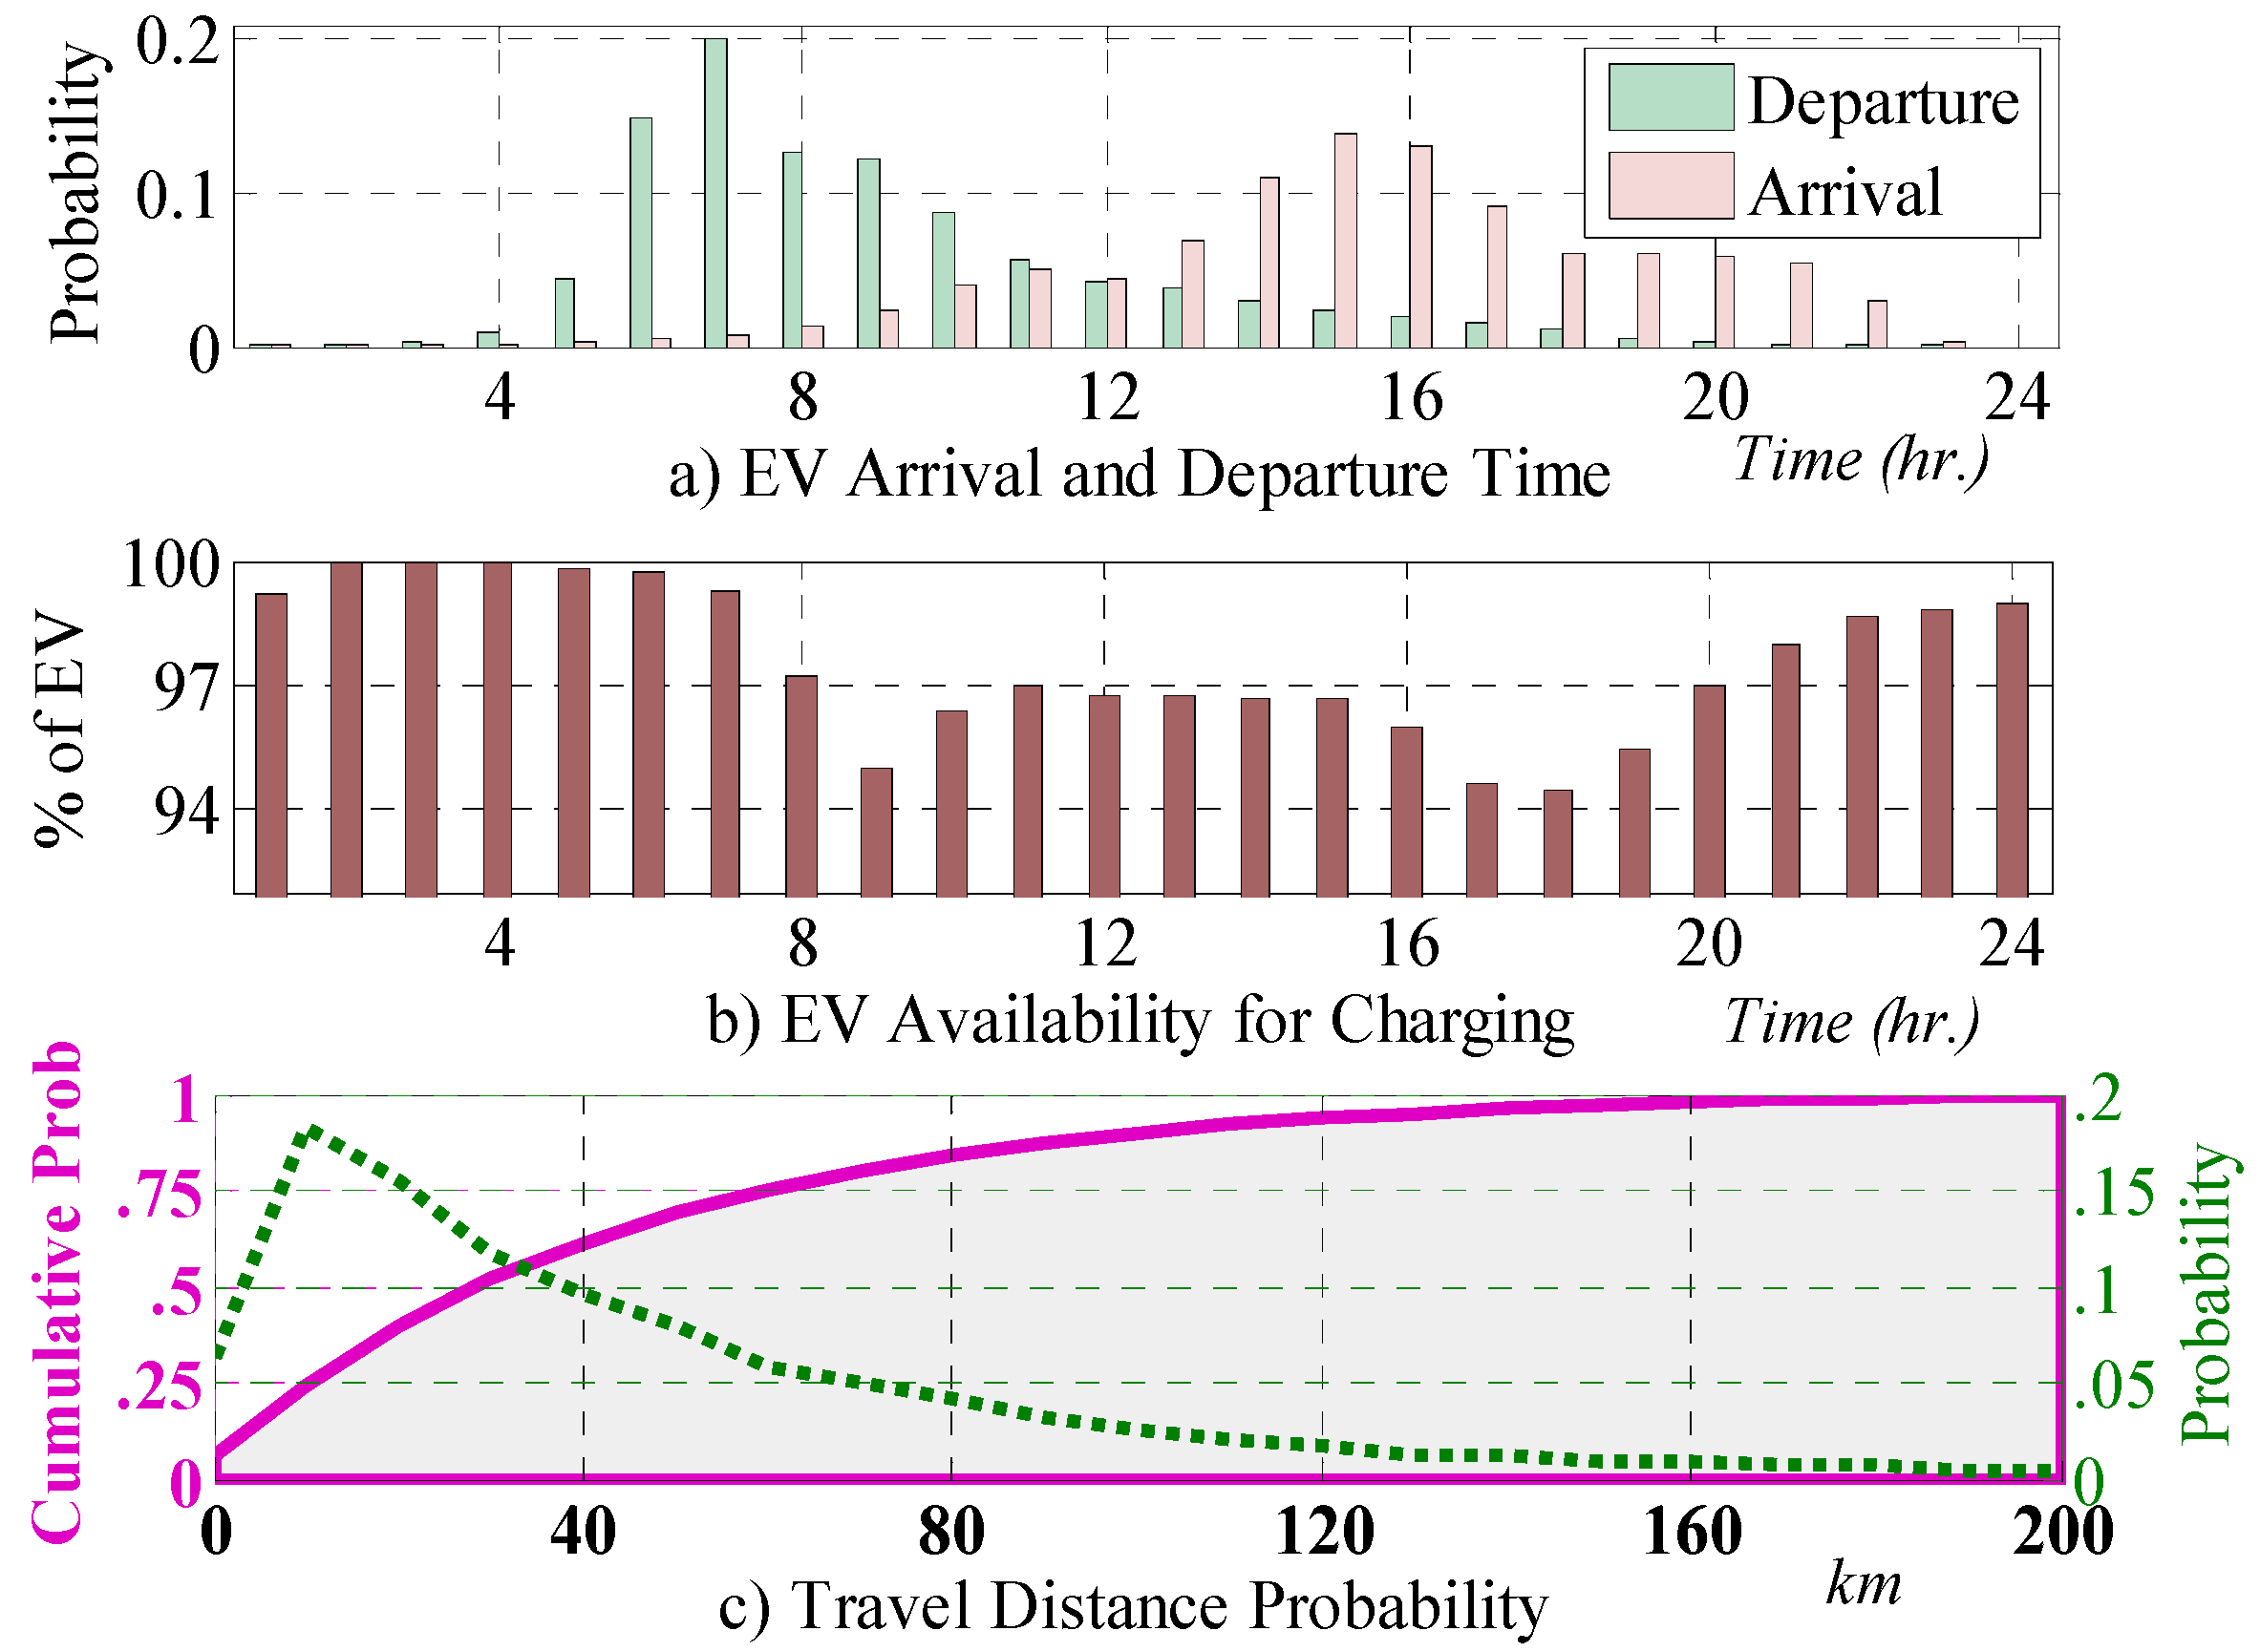
3.2. Electric Vehicle Driving Characteristics

Configuration of EV data (e.g., arrival/departure time, availability, and travel distance probability) is of utmost importance to design proper control strategies for EV charging/discharging. In particular, the arrival and departure of EVs are configured by using statistical information on travelling behaviors of light cars in Denmark [38]. The arrival and departures of light electric cars over 24 h for a typical working-day are depicted in Figure 3a. It can be observed that majority of the vehicles (more than 60%) departs for their first trip between 6:00 and 9:00, while the majority of vehicles arrive back to home between 14:00 and 17:00. In addition to the arrival and departure time, Figure 3b depicts the availability of EVs for charging/discharging throughout the day. An interesting observation here is that more than 94% of EVs are available for charging throughout a day. However, it should be noted that EVs may be available at different distribution feeders. Figure 3c illustrates the travelling distance probability in a day in Denmark. It is observed that majority (approximately 70%) of the cars drive less than 50 km/day and minority (less than 10%) drive more than 100 km/day. The EV data for simulation are configured using those national statistical information sets.

3.3. Electric Vehicle Charging Framework

EV charging control requires proper coordination among consumer, aggregator, DSO, balancing and regulating markets (BRM), and day-ahead energy market. A coordination framework, as shown in Figure 4, is implemented to ensure coordination among the actors. Primarily, aggregator plays a key role to ensure overall coordination by interacting with the other actors as follows:
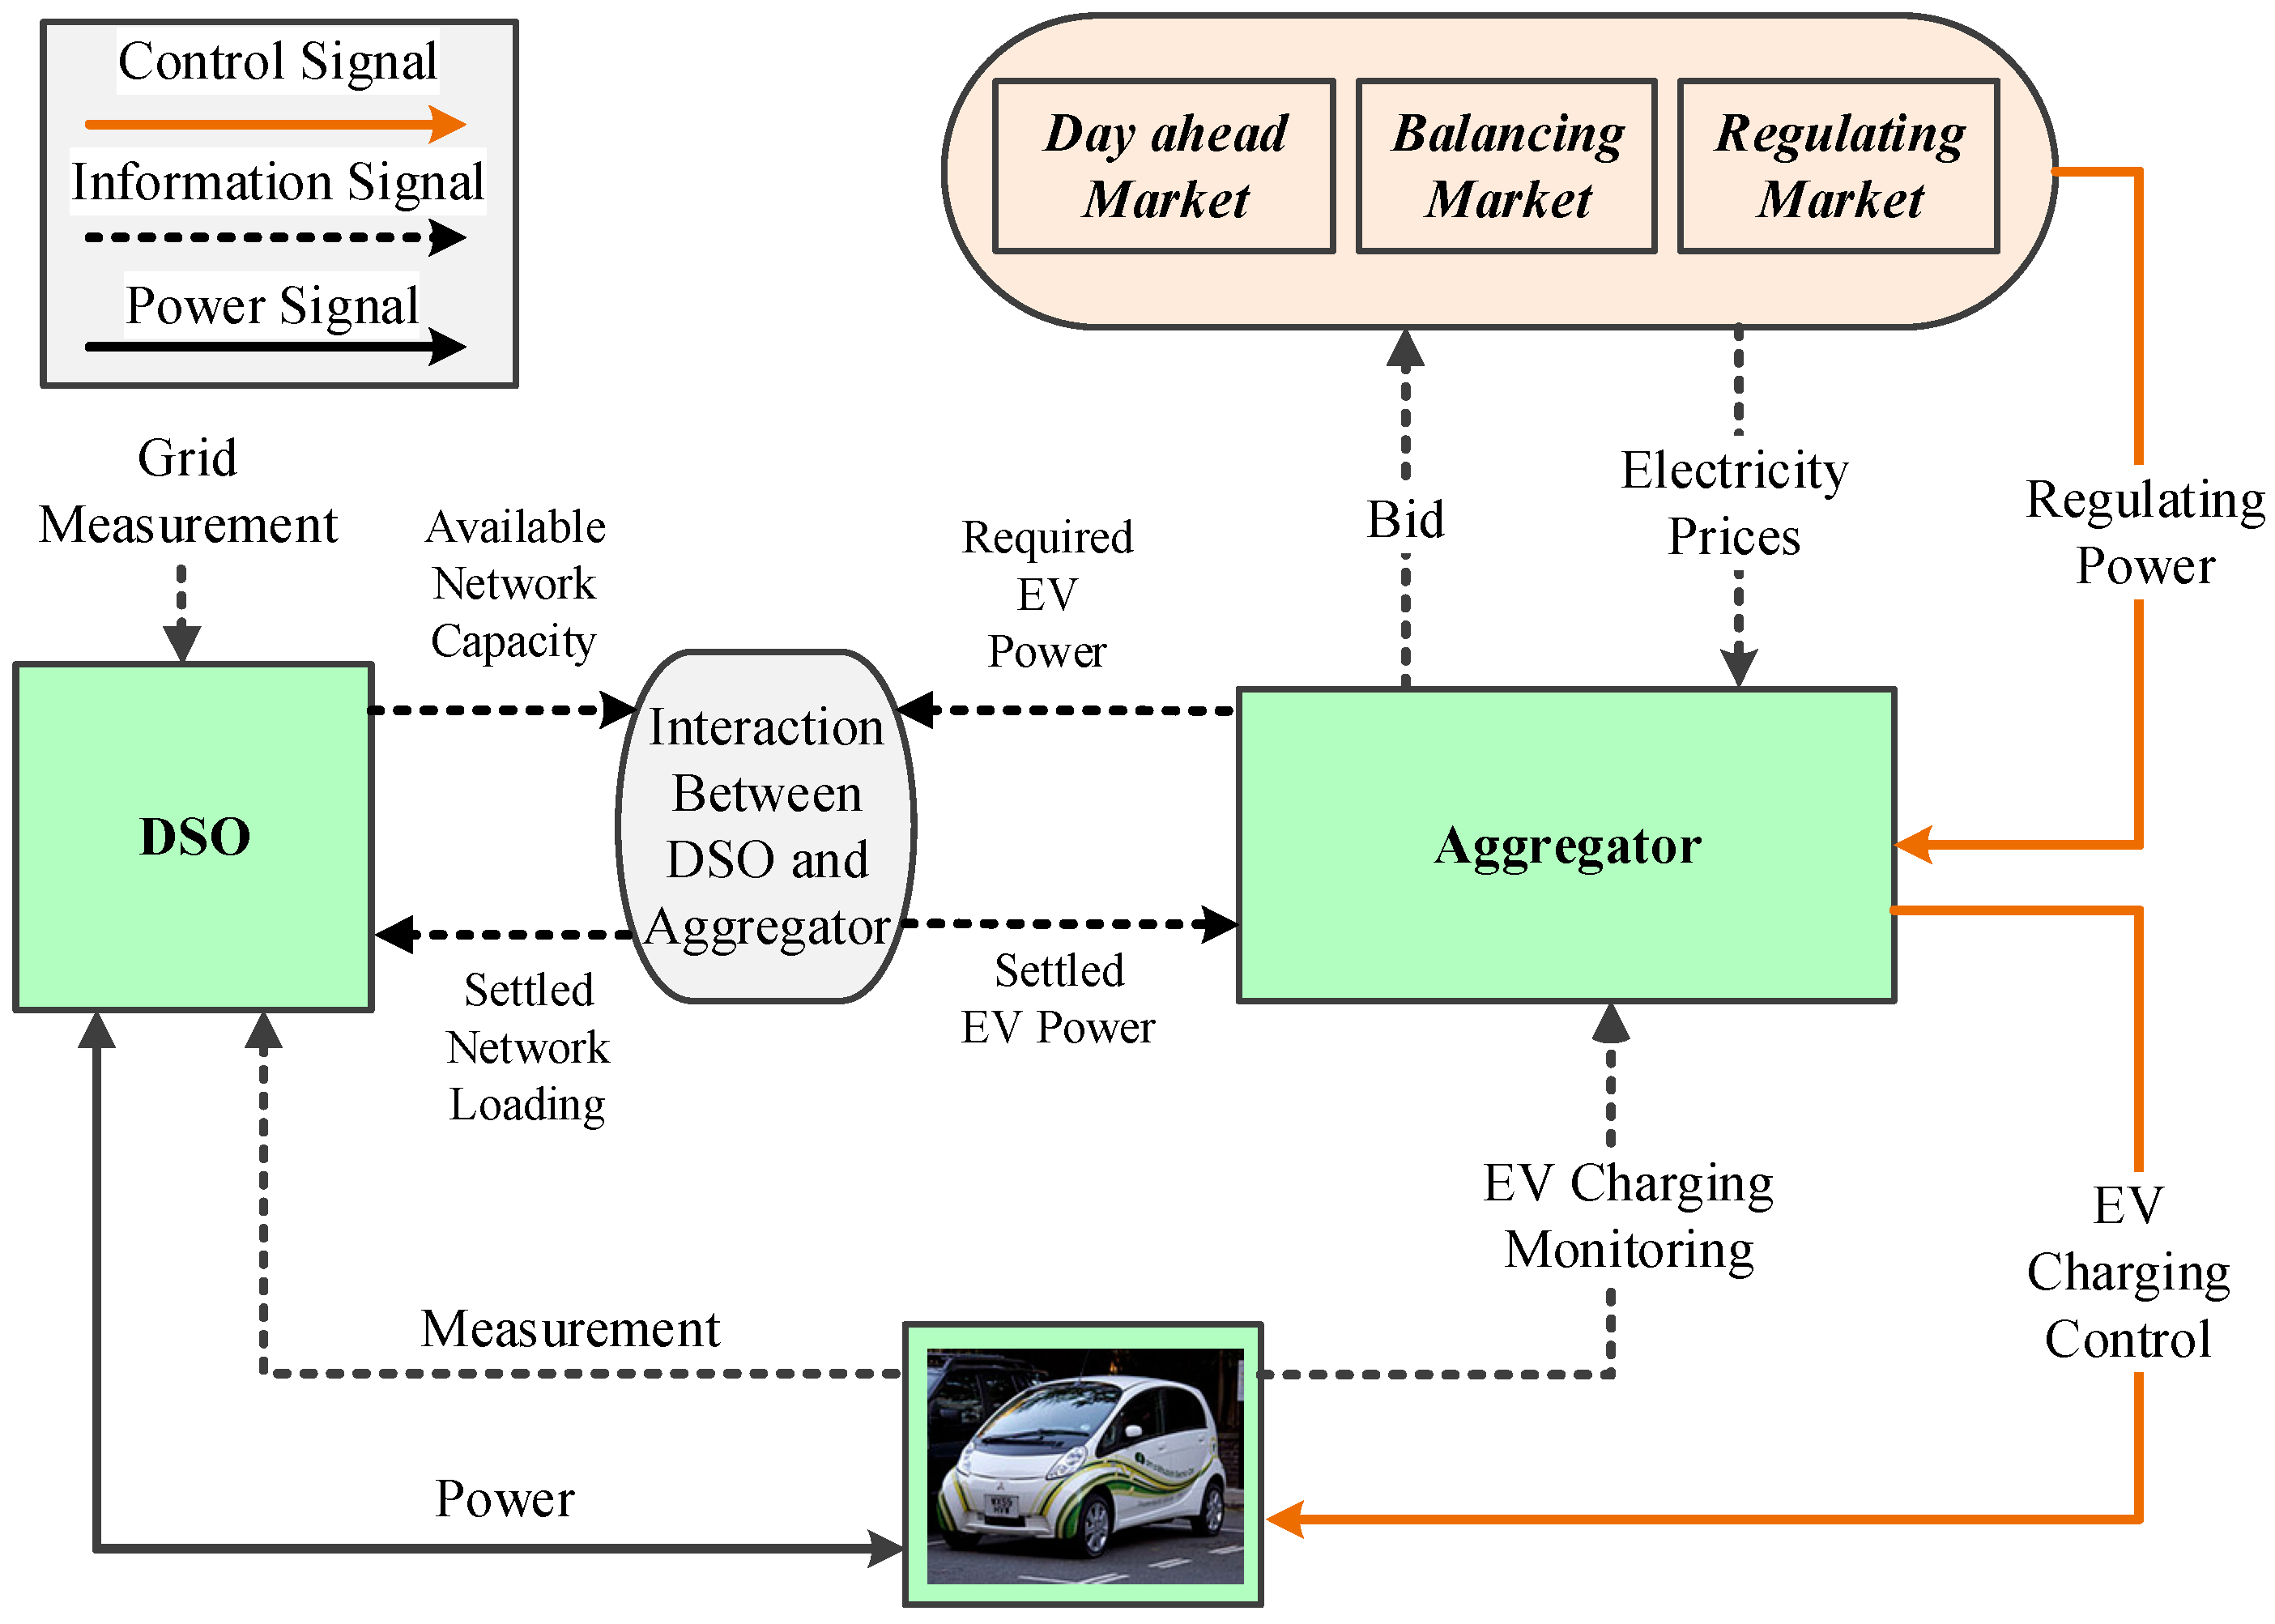
  • Aggregator-Consumer: The interaction between aggregator and consumer is realized through a common goal of charging cost minimization. While doing so, aggregator initiates EV charging control strategies with simultaneous assurance of travel requirement of each EV.
  • Aggregator-DSO: Interaction with DSO is realized through a common aim to avoid local grid congestions management. Aggregator and DSO communicate back and forth to settle charging power without jeopardizing the network constraints.
  • Aggregator-BRM: Aggregator bids to BRM with aggregated regulation capabilities of EVs. The primary responsibility of the aggregator is to ensure committed ancillary services and the objective is to maximize benefit from its participation to BRM.
  • Aggregator-Day-ahead Market: While interacting with day-ahead market, aggregator bids energy for EV charging and in return acquires hourly electricity price.
It is worth mentioning that this paper is focused on EV charging from consumer, DSO, and aggregator perspectives, while the impacts of BRM and energy markets are incorporated through the regulating and price signals, respectively.

4. Electric Vehicle Charging from Multiple Actors Perspective

This section first presents EV charging problem from consumer, aggregator, and DSO perspectives. Then, a generic EV charging approach to realize their coordinative goals is presented.

4.1. Consumer Perspective

Consumer normally intends to minimize their EV charging cost without due concern on the network conditions. Therefore, cost minimization (Min.) is a key objective while viewing the EV charging from consumer perspectives, and is mathematically formulated as follows:
Min . k = T i in T i out C k × P i k × Δ t
which is subjected to the following set of constraints:
P i min < P i k <   P i max S O C i T out = S O C max S O C min S O C i S O C max S O C i k + 1 = S O C i k + P i k × Δ t B i C p
where P i k is the charging rate of ith EV, Ck is the electricity price for the for kth slot, T i i n / T i o u t is the plug-in/-out time of EVs, and ∆t is the time slot duration in hours. Moreover, P i min / P i max are minimum/maximum EV charging power, SOCmin/SOCmax are the minimum/maximum SOC, SOCk/SOCk+1 are the SOC at kth/(k + 1)th slots, and B i C p is the battery capacity of ith EV. The first constraint imposes charger capacity limits such that P i min equals zero during grid-to-vehicle (G2V) and equals “− P i max ” during V2G. The second and the third constraints ensure travel requirements of the EV owners, while the fourth constraint sets the variations of SOC as a function of charging/discharging power. The forth constraint assumes a linear relationship between power and SOC despite the fact that their actual relationship is non-linear. Nonetheless, the linear relationship gives fairly accurate computation of SOC for investigating impacts of EVs on grid performances. It is worth mentioning that EV battery energy consumptions during journeys are not directly considered. However, the consumptions during each journey are reflected in terms of changes in SOC between plugged-out and plugged-in.
The optimization is solved by a simplex solver available in MATLAB 2016a (MathWorks, Natick, MA, USA) optimization toolbox to compute optimized schedules of each EV for each slot. It is worth mentioning that controlling EVs based on electricity cost encourages all EVs to be charged during low price period, thereby congesting the network and violating the grid limits. This requires explicit consideration of network limits in the EV charging optimizations.

4.2. Distribution System Operator Perspective

DSO is primarily responsible for delivering quality power supply to consumers and satisfying operational grid constraints (e.g., voltage and thermal limits). As such, one of the key intents of the DSO would be to better utilize the existing grid assets. In this paper, a technique of shifting the consumption from peak to lower demand periods with simultaneous consideration of thermal and voltage constraints is implemented. Mathematically, the energy shifting is formulated as:
Min . k = 1 K {   L k L max ( i = 1 N P i k × Δ t ) }
where Lk is the feeder loading at kth slot, and Lmax is the feeder maximum capacity. Particularly, Lk represents the predicted day-ahead load profile which is considered as a deterministic value and Lmax is the maximum of Lk. Note that Lk represents the loading of the feeder connecting the secondary of the substation transformer to the following node, which is literally same as the loading of the substation transformer. The objective function is formulated such that it allows the EVs to charge during the periods of low loading. Since the maximum amount of power that the EV can draw is limited by the thermal capacity of upstream feeders, a thermal constraint is introduced as follows:
i = 1 N   P i k ( L Max L k )   k = 1 : K
In addition to the thermal constraints, EV constraints illustrated in Equation (5) are incorporated to satisfy EV travel requirements. The optimization problem subjected to constraints (5) and (7) is solved using linear programming (LP) available in MALTAB to obtain optimized EV schedules. After obtaining the optimized EV schedules, a power flow calculation is performed at each slot with the optimized EV schedules to ensure that voltage are within acceptable limits:
V min < V j < V max   j = 1 : n d
where Vmin/Vmax are the minimum/maximum allowable voltage and nd is total number of nodes in the given network. If the optimum EV schedules result in violation of voltage limits at any slot, EVs are rescheduled based on their SOC to bring the voltage back to the limits. In particular, the rescheduling is done such that EVs having higher SOC, which were initially scheduled for charging, are rescheduled to idle state to bring back the voltage within acceptable limits. The EVs are subsequently set idle in the descending order of SOC until the voltage of all nodes reaches within the acceptable limit. Since the EVs are set idle based on SOC, the proposed approach will not be impacted due to presence of distributed generations. As such, it presents a simple yet effective algorithm to ensure the voltages of each node are within the acceptable limits.
One formal method in solving the given problem could be direct incorporation of voltage and thermal limits as constraints in the formulation and solve by using non-linear solvers. However, introduction of highly non-linear voltage and current flow constraints in the optimization normally increase the risk of non-convergence especially with the increased number of EVs and need of number of optimizations (e.g., periodic optimization as described in Section 5). Therefore, we implement a simple yet effective approach for EV scheduling which works fairly well for the intended focus of this paper. The EV schedules which satisfy both thermal and voltage constraints form the final schedules.

4.3. Electric Vehicle Aggregator Perspective

The aggregator is primarily responsible for acting on behalf of individual EVs, who otherwise cannot directly participate in electricity markets. In fact, the aggregator trades flexibilities stemming from EVs either to resolve the distribution grid constraints or to resolve system unbalancing. As aggregator is a commercial entity, its primary objective is to maximize its economic benefits. Therefore, the aggregator tries to minimize the EV charging cost subjected to travel requirements of EV owners and network constraints. As aggregator normally get benefited from a day-ahead energy market, the EV charging from an aggregator perspective is formulated to minimize charging cost based on day-ahead electricity prices as follows:
Min . k = 1 K i = 1 N C k × P i k × Δ t
Note that EV charging is subjected to consumer travel constraints set per Equation (5) and network constraints set per Equation (7). The optimization problem is solved by LP with Simplex solver to determine the optimum charging schedules for individual EVs. As the cost saving from the day-ahead market is relatively low, it is a challenging task for the aggregator to ensure enough financial incentives to EV owners to motivate their participation.

4.4. Coordinative Goal of Consumer, Distribution System Operator, and Aggregator

The preceding sections investigate EV charging seen from consumer, DSO, and aggregator perspectives. It is observed that consumer are mainly concerned with charging cost minimization, DSO is concerned about technical performance and better utilization of the grid assets, and aggregator tries to maximize the benefits by trading the demand flexibility to different markets. One of the best approaches to realize their coordinative goal is to maximize economic benefits (equivalently minimize costs) with simultaneous assurance of the consumer comforts, grid constraints violations, and better utilization of the grid assets. We propose a mechanism to maximize economic benefits by enabling EVs to participate in day-ahead as well as BRM markets. The coordinative objective consists of two parts as follows:
Min . { k = 1 K i = 1 N C k × P i k × Δ t } + Max . { k = 1 K i = 1 N R k up × [ P i k + P i max ] + R k dn × [ P i max P i k ] }
where R k up and R k dn are the up and down regulation prices at kth slot; and Max. means maximization. The first part of the objective function essentially minimizes the total EV charging cost based on the day-ahead electricity prices, while the second part of the objective function maximizes the benefit by participating in BRM. Note that the proposed method considers payments for regulation capacity based on the availability. However, energy payments for regulation are not explicitly modeled and will be included as a part of the extension of this work. This two-part objective function is converted into a single minimization problem by minimizing the negative of aggregator benefits (i.e., the second part of Equation (10)) as follows:
Min . k = 1 K i = 1 N ( C k × P i k × Δ t R k up × [ P i k + P i max ] R k dn × [ P i max P i k ] )
The consumer requirements and network constraints are imposed per Equations (5), (7) and (8), and the problem is solved by using the Simplex solver available in MATLAB optimization toolbox. To practically enable participation of the EVs to different electricity markets, a hierarchical architecture capable of executing multi-time scale control is implemented.

5. Hierarchical Coordinated Electric Vehicle Charging

A HCA is set up to enable a multi-timescale EV charging control starting from a day-ahead scheduling to the real-time monitoring and control. Particularly, the HCA is designed for enabling EVs to participate in multiple electricity markets, namely day-ahead (Spot), hourly balancing (Elbas) and real-time (regulation). The HCA is designed with scheduling, coordinative, and adaptive control layers so as to realize the multi-time scale control. The scheduling is the outermost control layer that exhibits slowest response, while adaptive is the innermost layer that exhibits the fastest response. As depicted in Figure 5, the lower HCA layer backs up the immediate upper layer in smaller time-frame.

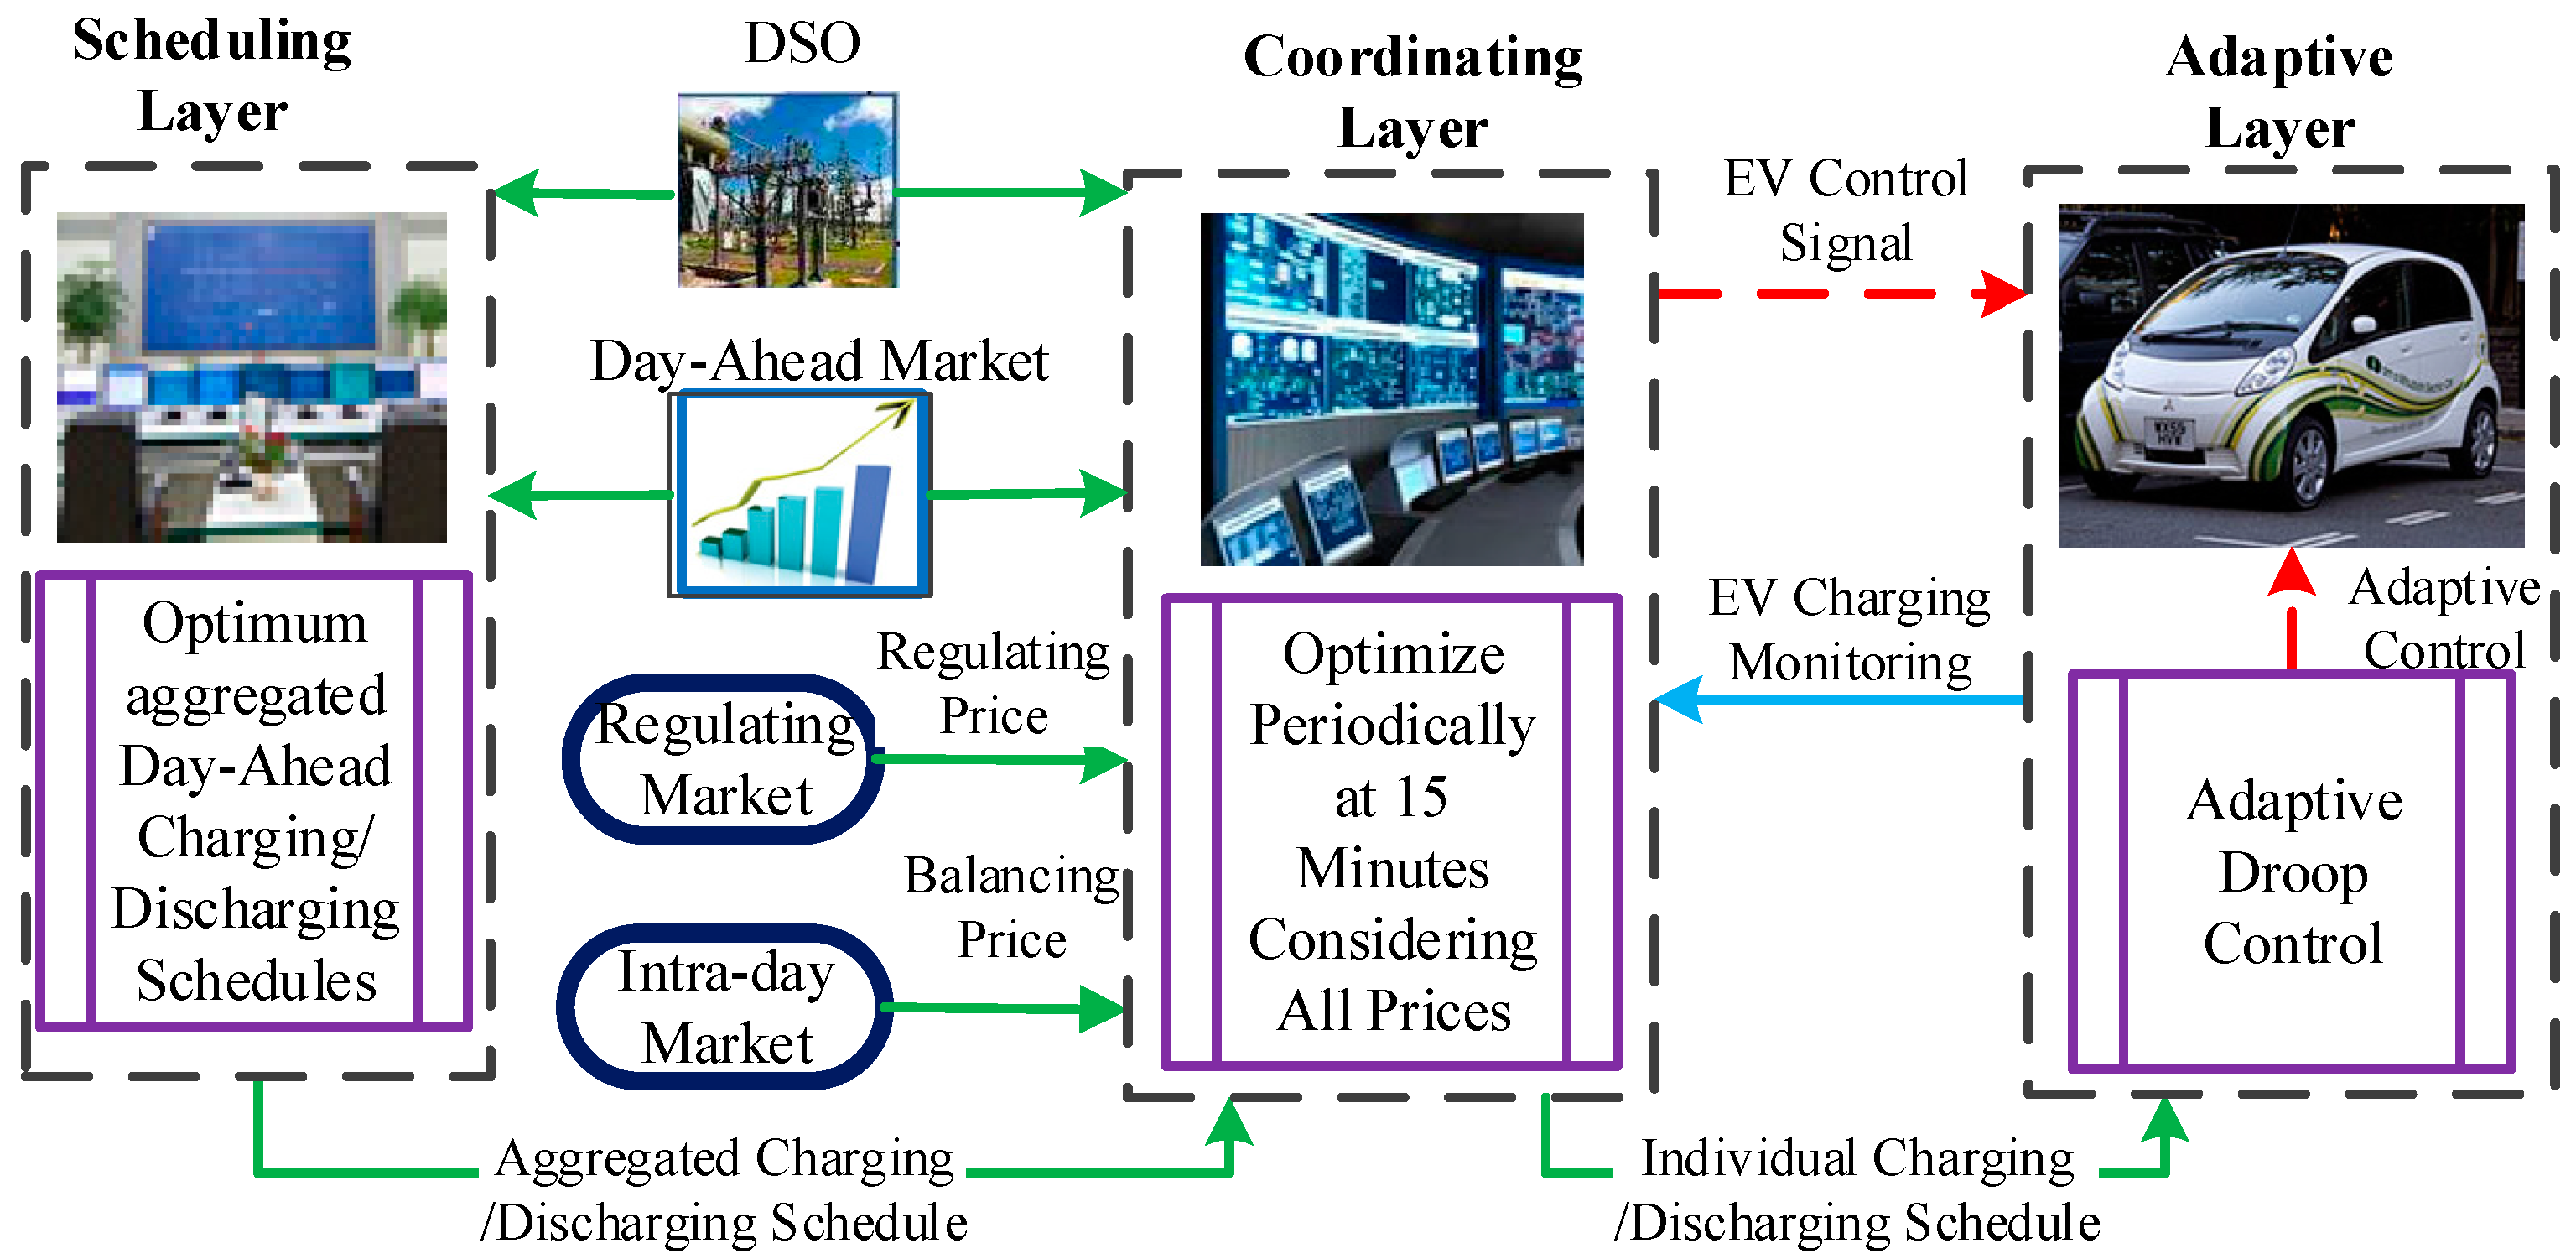
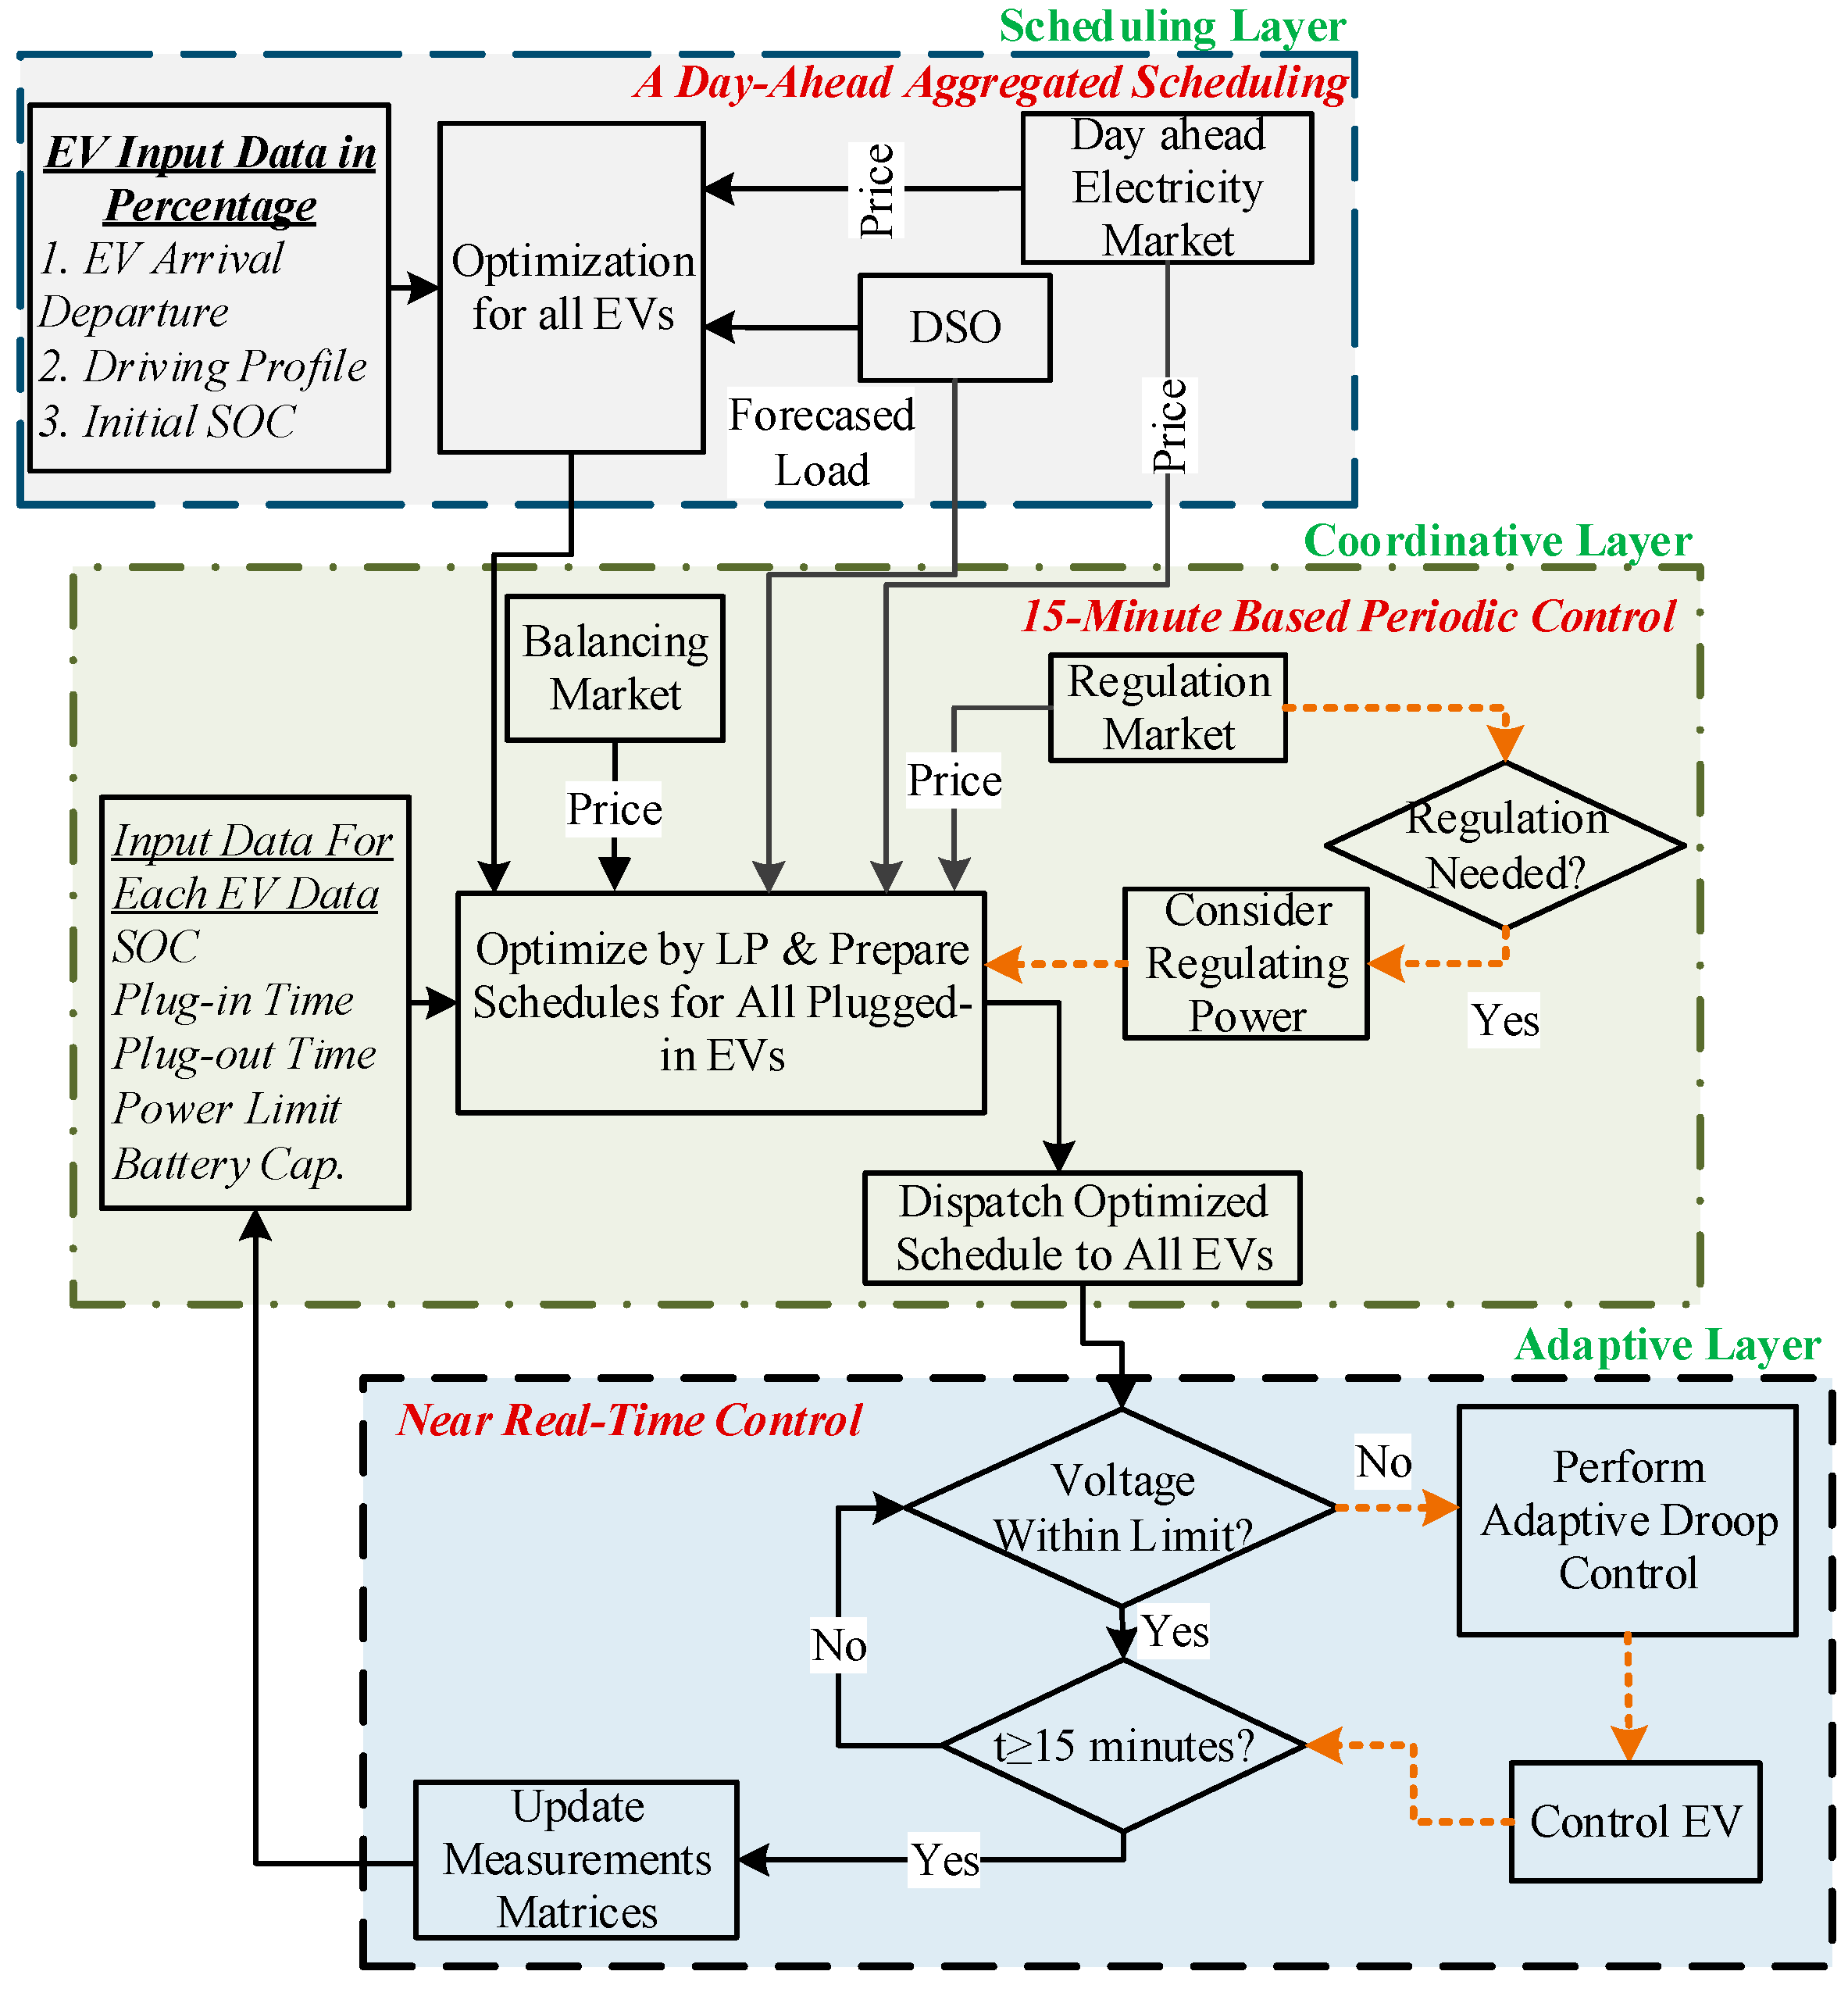
5.1. Scheduling Layer

The scheduling layer (SL) is primarily responsible for preparing day-ahead operational schedules of total number of EVs for the next 24 h. As individual EV data (e.g., T i in , T i out , P i max , SOCi) are often unavailable in a day-ahead time-frame, the charging/discharging schedules are made for aggregated EVs by considering the percentage of EV availability over a day as illustrated in Figure 3. As depicted in the Figure 6, day-ahead electricity price, feeder load, and EV availability percentage are used to compute optimum EV schedules for the next day. The following algorithm is implemented to compute the aggregated EV charging power at each slot:
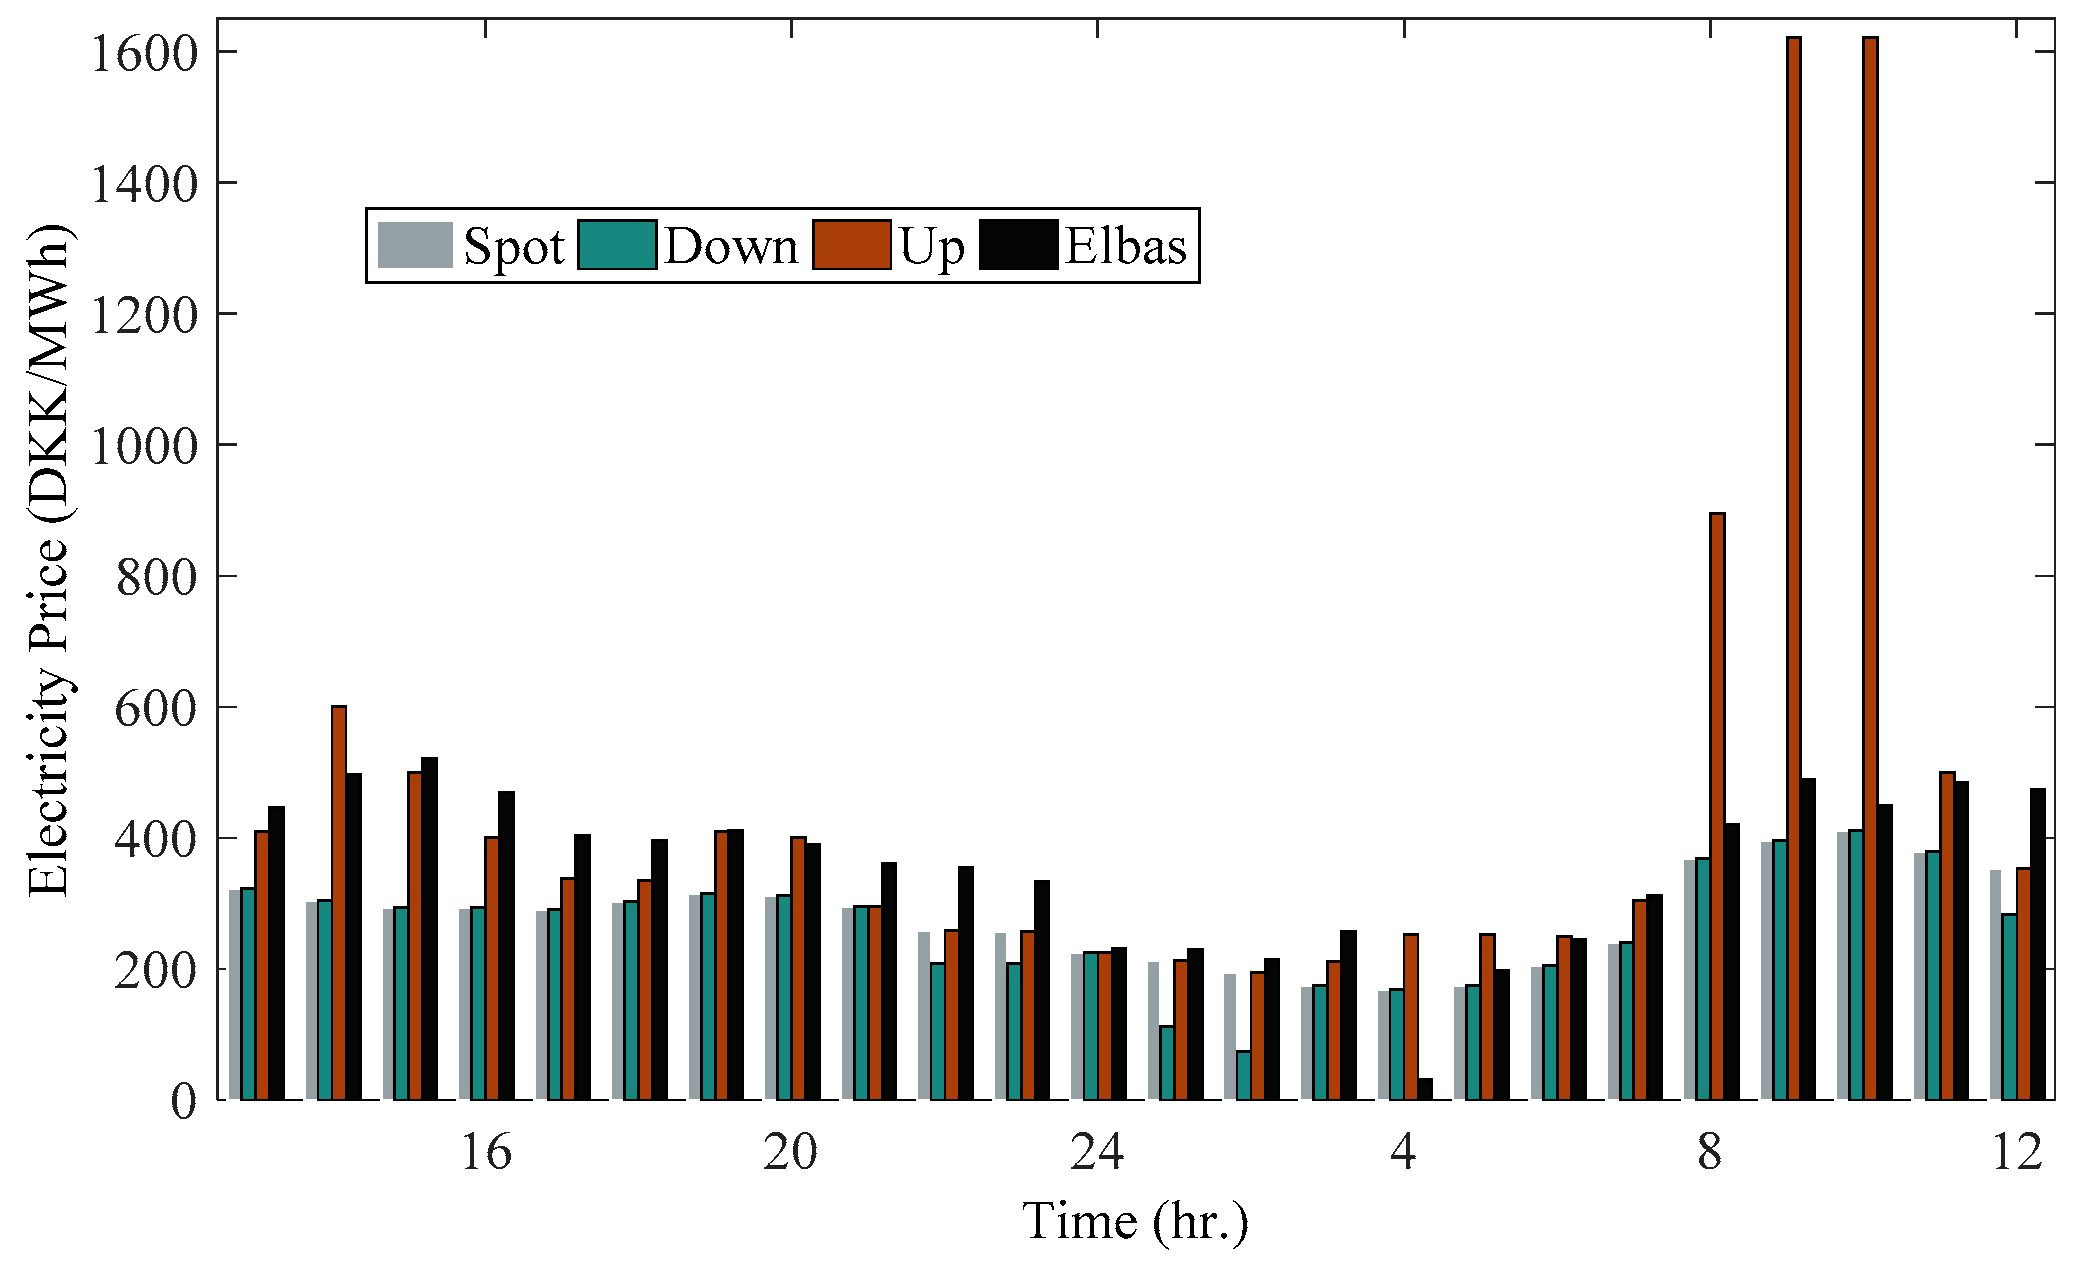
  • Hourly electricity prices for the next day are taken from spot market.
  • DSO provides forecasted load for every 15 min for the next 24 h.
  • EV availability at different time slots is generated based on distribution of arrival and departure of EVs and percentage availability of the EVs over the day.
  • The SL minimizes the charging cost based on the coordinative goal (Section 4.4) to determine total power allocated for EV charging at each time slot. The solution thus consists of optimized aggregated schedule for all slots for next 24 h.
As SL generates optimum aggregated schedule, additional mechanism to optimally distribute the aggregated power among the plugged-in EVs is desired. To do so, SL dispatches the aggregated schedules as a reference signal to the inner HCA layer.

5.2. Coordinative Layer

The coordinative layer (CL) works with 15 min time resolution to optimally allocate the aggregated power received from SL among the plugged-in EVs. In particular, the aggregated power received from SL for a particular time slot is distributed among all the plugged-in EVs at the slot. As such, the CL considers only the EVs that are plugged-in at that moment and prepares their charging/discharging schedules. One notable attribute of the CL is that it has the capability to consider BRM requirements (if any) in addition to the schedules received from SL. A conceptual framework for the operation of CL is presented in Figure 6 and is described as follows:
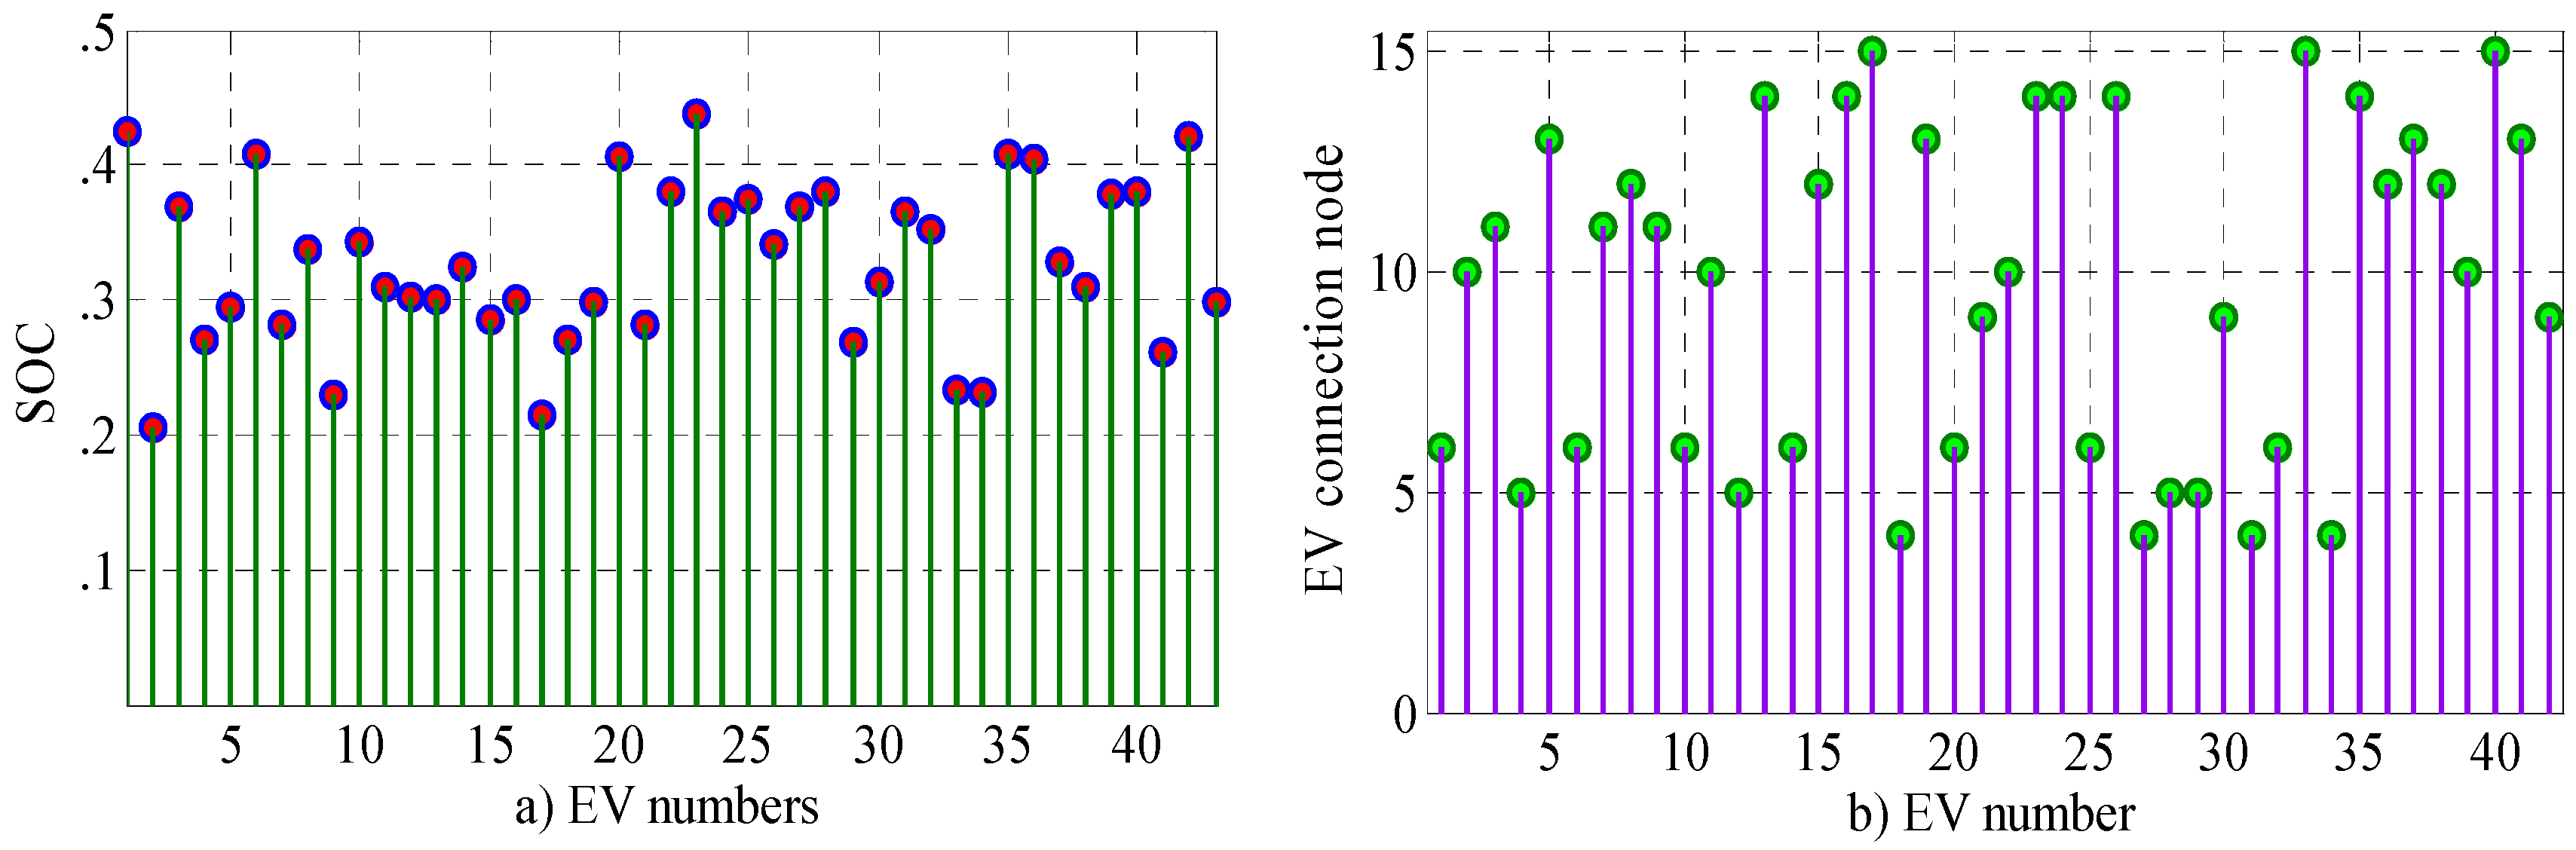
  • All EVs send their SOC, Tin, Tout, and Pmax to the aggregator after plugged-in. Therefore, those matrices for each plugged-in EV are known to CL.
  • Any unusual travel requirements, including emergency charging, are assumed to be provided by the customers during plug-in period.
  • Upon receipt of those matrices from all connected EVs, the aggregator performs optimization considering network constraints and individual EV requirements to compute optimum operational schedules of each EV. Those schedules are then dispatched to each EV.
  • At the end of each slot, all plugged-in EVs send their updated measurement matrices and the optimization is performed again considering the newly added EVs and observed deviations in charging/discharging profiles of the EVs. The process is repeated periodically at each time slot (every 15 min in this paper).
As the balancing market closes an hour ahead of the actual operation, the CL allows updating EV schedules to enable their participation to BRM. As BRM offers significantly higher prices, it is a great opportunity for all consumer, aggregator, and DSO to participation in BRM for maximizing the benefits. It should be noted that the actual regulating power that each EV can provide depends greatly on the actual operation condition of the EV. For instance, EV in lower SOC regime can provide only down-regulation, while the EV in higher SOC regime can provide only up-regulation. Therefore, CL should reschedule each plugged-in EV to maximize their benefit considering both day-ahead market and BRM. It is worth mentioning that the proposed mechanism requires back and forth communication between EV aggregator and individual EVs. Our previous works [5,39] demonstrated the performance of required communication from both simulation and experiments that can effectively deployed for the proposed algorithm.
Even though CL provides a perfect platform for participation to BRM by allowing periodic updates on EV schedules, it has no controllability to capture any intra-slot (within 15 min) discrepancies. Therefore, an adaptive control layer that adapts EV schedules based on real-time operating condition of the local network is implemented.

5.3. Adaptive Layer

The adaptive layer (AL) is designed to address any intra-slot discrepancies that cannot be captured by SL and CL. Particularly, AL locally monitors and controls the EVs near real-time based on the contemporary network conditions. In particular, voltage at the consumer point of connection (POC) is continuously monitored and charging/discharging rate of the EV is adjusted adaptively using a simplified P(V) droop as shown in Figure 7b. The proposed P(V) droop is formulated as follows:
P i k ( t ) = { P i k V n > V n th P i k + ( V n V n th ) V n th V n min ( P i k P i max ) V n min < V n < V n th P i max V n V n min
where Vn, V n th , and V n min are the measured voltage at the POC, threshold voltage, and minimum cutoff voltage for the nth node, respectively. V n th is essentially the voltage beyond which the P(V) droop starts functioning, and V n min is the minimum allowable voltage beyond which the EV discharges at maximum power (i.e., Pmax). A simple linear interpolation between V n th and V n min is done to determine the corresponding droop power P i k (t) as a function of Vn. It is worth mentioning that the performance of the adaptive control can be improved by properly designing Vth for each node. We implement a multi-power flow approach as proposed in our previous works [35,40,41] to compute the voltage threshold of each node in the network. Primarily, the Vth of a node nearer to the substation is higher compared to the Vth of the node farther from the substation. This is done to avoid unfair impact to the farthest end EV(s). As mentioned earlier, violation of voltage overrides the optimum schedule initially dispatched by the CL. Therefore, at the end of each time slot, AL sends the updated SOC and actual power to the CL, which is then used by CL to update the EV schedules of the subsequent slots.

6. Results and Discussion

6.1. Configuration of Simulation Parameters

The performance of the proposed methodology is demonstrated through a 24 h time sweep simulation performed in a real residential distribution network located in southeast of Denmark. One notable attribute of the test network is that it has significant penetration of EVs and other flexible resources, such as heat pumps and electric water heaters. Figure 7a illustrates the one line diagram of a test network which comprises 15 nodes and supplies 45 detached residential consumers. The 24 h EV charging horizon, starting from the noon of a day until the noon of the next day, is then converted into 15 min time-slots. Subsequently, EV availability, feeder load, and electricity prices for each slot are configured. In particular, the EV availability distribution (Figure 3a) is utilized to configure Tin/Tout, while the travel distance probability (Figure 3b) is used to configure initial SOC.
It is worth mentioning that the generation of arrival/departure time, driving profile, and initial SOC was done using stochastic procedure as presented in our previous work [38]. Particularly, the national statistical data as presented in Figure 3 were used to generate individual driving profile and travel distance for each EV. Subsequently, those travel distance and arrival/departure times are used to compute initial SOCs for the given number of EVs. Figure 8a illustrates the configuration of initial SOC of each EV and Figure 8b illustrates the connection nodes for each EV. Note that EVs are uniformly allocated at each node based on the number of consumers connected to that node. As such, the nodes which have no consumer will have no EV. For instance, nodes 1–3 do not have any consumer connected, thereby having no connected EVs. One notable attribute of the test grid is that it can host up to 60% penetration of the proposed EVs. Note that each EV in this paper is assumed to have 4 kW, 16 kWh, lithium-ion chemistry. In order to make the paper case interesting, we made the network congested by allocating one EV per consumer.
Moreover, a typical winter day load profile, illustrated in Figure 9, is used for simulation to capture the worst case operating scenario from EV accommodation perspective. Electricity prices as shown in Figure 10 are taken for the simulation. In particular, the day-ahead electricity price is taken from Nordic spot market, balancing price is taken from Elbas, and regulating price is taken from Danish transmission system operator. Note that the electricity prices for both charging and discharging are assumed to be the same because all the existing utilities are adopting the same pricing structure for charging as well as discharging.

6.2. Simulation Results and Analysis

This section first demonstrates the performance of the proposed method from consumer, DSO, and aggregator perspectives. Then, HCA performance to realize their coordinative goal is evaluated.

6.2.1. Consumer Perspective

As discussed in Section 4.1, consumers tend to charge their EV during low price periods and discharge (if applicable) during high price periods without due respect on network conditions. Figure 11a illustrates the optimum EV charging profile seen from consumer perspectives when EVs are allowed only for charging (i.e., G2V), while Figure 11b illustrates the optimum EV charging/discharging from consumer perspective when EVs are allowed for V2G. It can be seen that all EVs are scheduled for charging at low price period (2:00–6:00) and are scheduled for discharging during high price periods (20:00–22:00).
It can further be observed that the feeder capacity limit of 250 kVA is violated in both G2V and V2G cases. Furthermore, Figure 11d depicts that the voltage at the farthest end node (node 15) is far less than the acceptable lower limit (0.95 pu) in both G2V and V2G cases. More interestingly, the voltage and network limit violations are worse than the case with uncontrolled charging. This is due to coincidence of EVs charging during low price period and discharging during high price periods. Therefore, the charging/discharging of all EVs coincides. Even though the EV charging cost (depicted in Figure 12) is significantly lower, the network limit violations cannot allow such schedules. This issue can be taken care of by explicitly considering grid constraints in the optimization process.

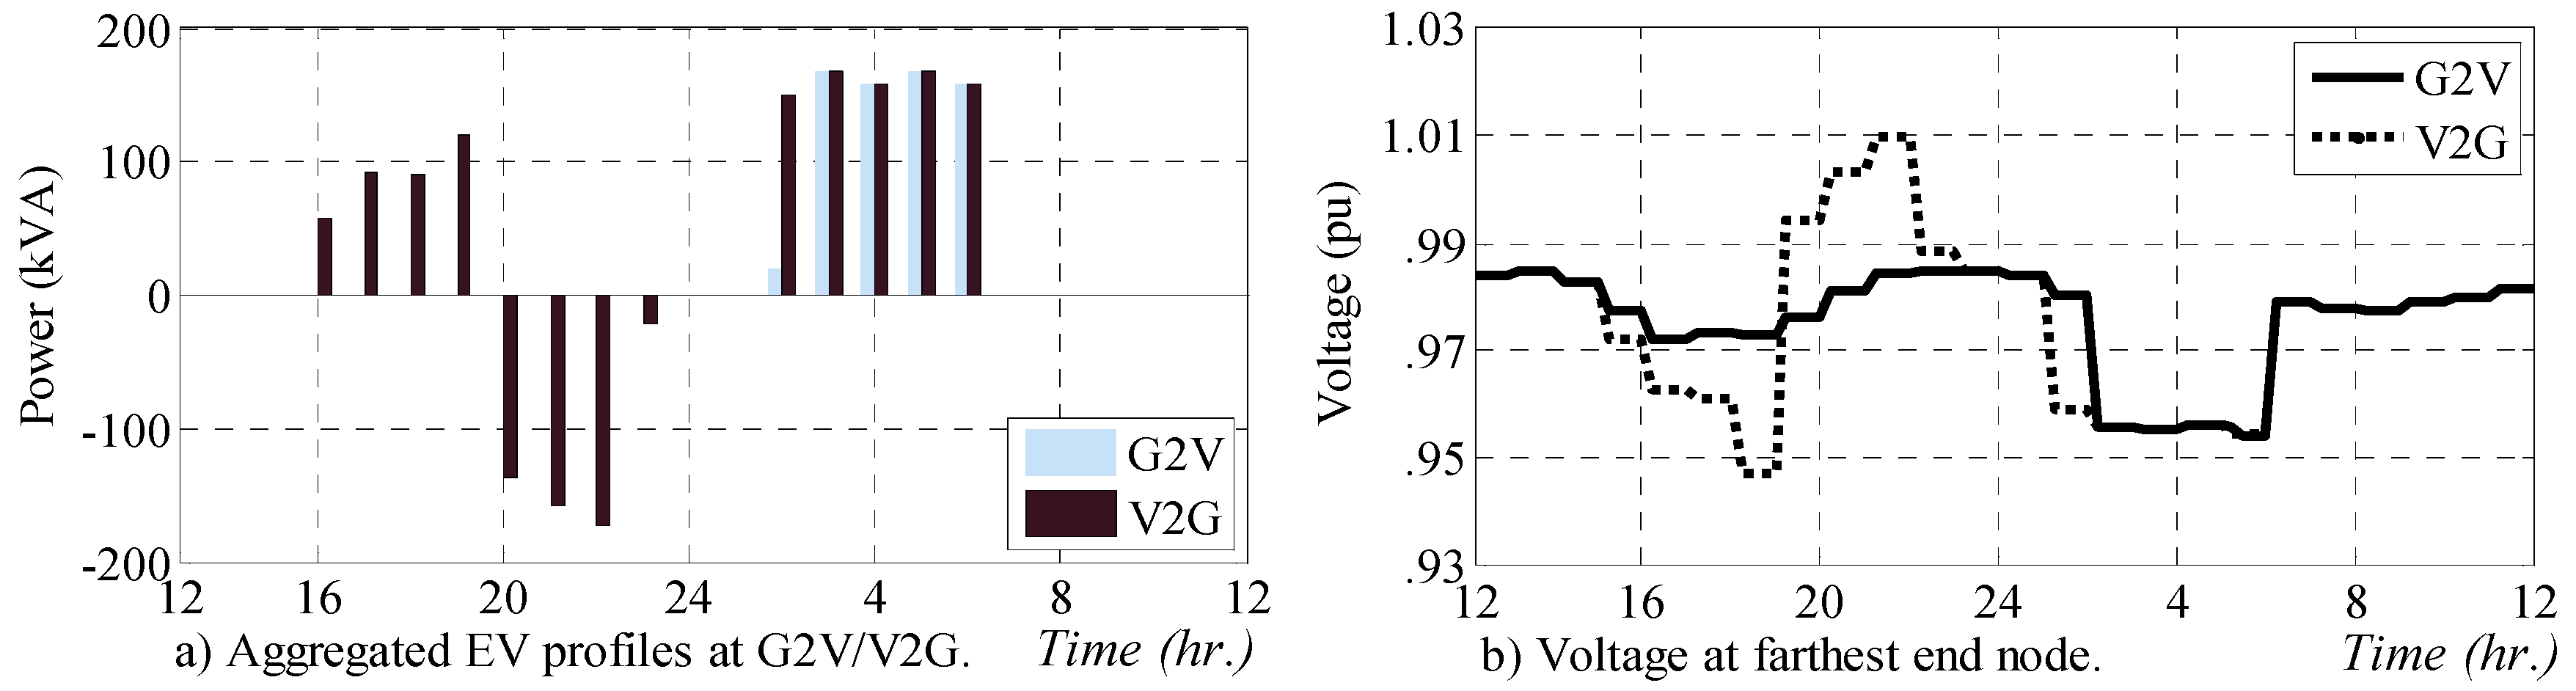
6.2.2. Distribution System Operator Perspective

The key intent of the DSO is to shift the EV charging during low demand periods to better utilize the existing grid assets. Simulation results for the optimum EV charging seen from DSO perspective are illustrated in Figure 11c. It is observed that EVs are scheduled for charging during the lower demand period and the network constraints are kept within the limits. It is clearly seen that the feeder capacity (250 kVA) and voltage of the farthest end node (which was violated while charging from consumer perspective) are respected. However, Figure 11c further depicts that some of the EVs are also charged during higher price periods. This leads to a higher EV charging cost compared to the EV charging cost seen from consumer perspective. As depicted from Figure 12, the total cost of EV charging from DSO perspective is more than double compared to the case of consumer perspective.

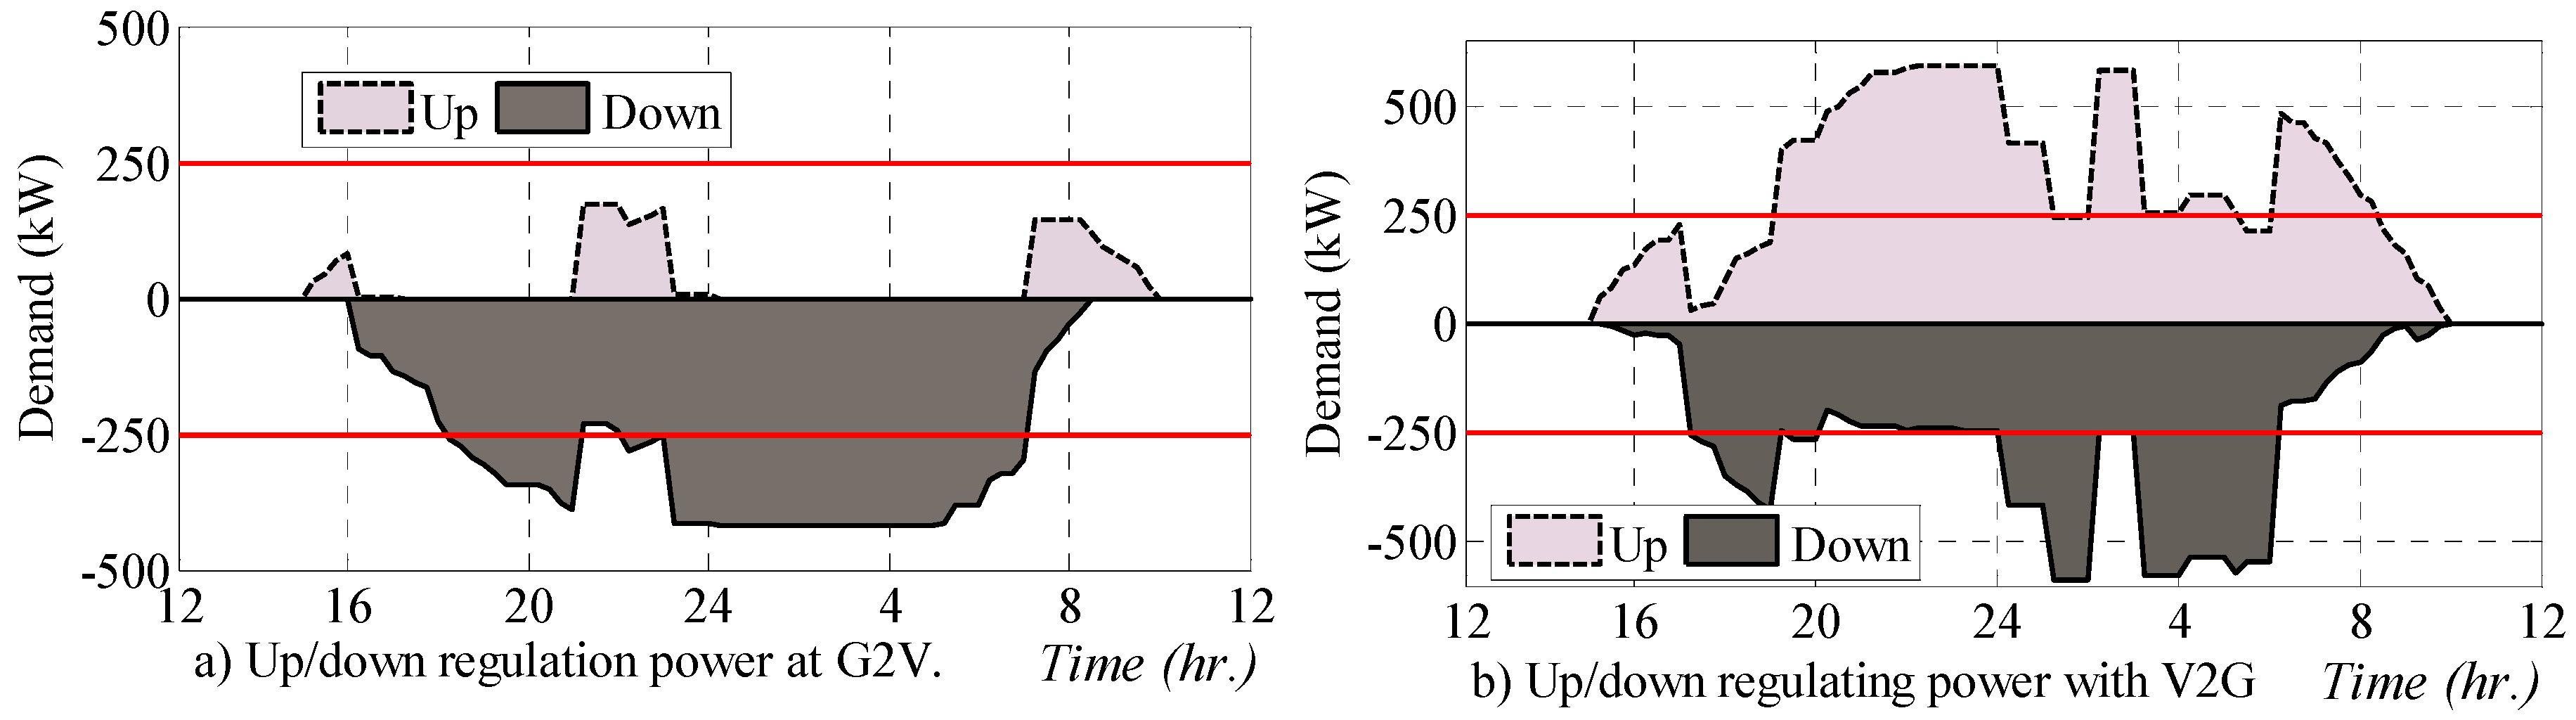
6.2.3. Aggregator Perspective

Aggregator solves the EV charging problem considering charging cost and network limit. Figure 13a illustrates the EV charging profiles for G2V and V2G cases seen from aggregator perspective. It is observed that the total feeder load, including EV and base load, is within the network limit of 250 kVA for both the cases. Figure 13b further depicts that the voltage is also within the limit throughout the charging horizon. The EV charging from aggregator perspective is similar to that of the consumer perspective (Figure 11a,b), except the network limits are respected during EV charging from aggregator perspective. This can be seen as rescheduling of some of the EVs from their initial scheduled charging/discharging to bring the network constraints back within the limits. Due to the need of rescheduling, total cost of EV charging from aggregator perspective is comparatively higher than the total cost seen from consumer perspective. In particular, as seen from Figure 12, the cost increases by 21.15% in G2V and by 18.08% in V2G case compared to that of the consumer perspective.
It is worth mentioning that the total cost during V2G is significantly lower (by 45.26%) compared to the case of G2V only. However, the monitory benefits resulting from EV participation to day-ahead markets only are often insufficient to compensate for the battery degradation. Therefore, a HCA approach to realize the coordinative goal of maximizing the total cost of EV charging control with simultaneous assurance of consumer comfort and network constraints is realized.

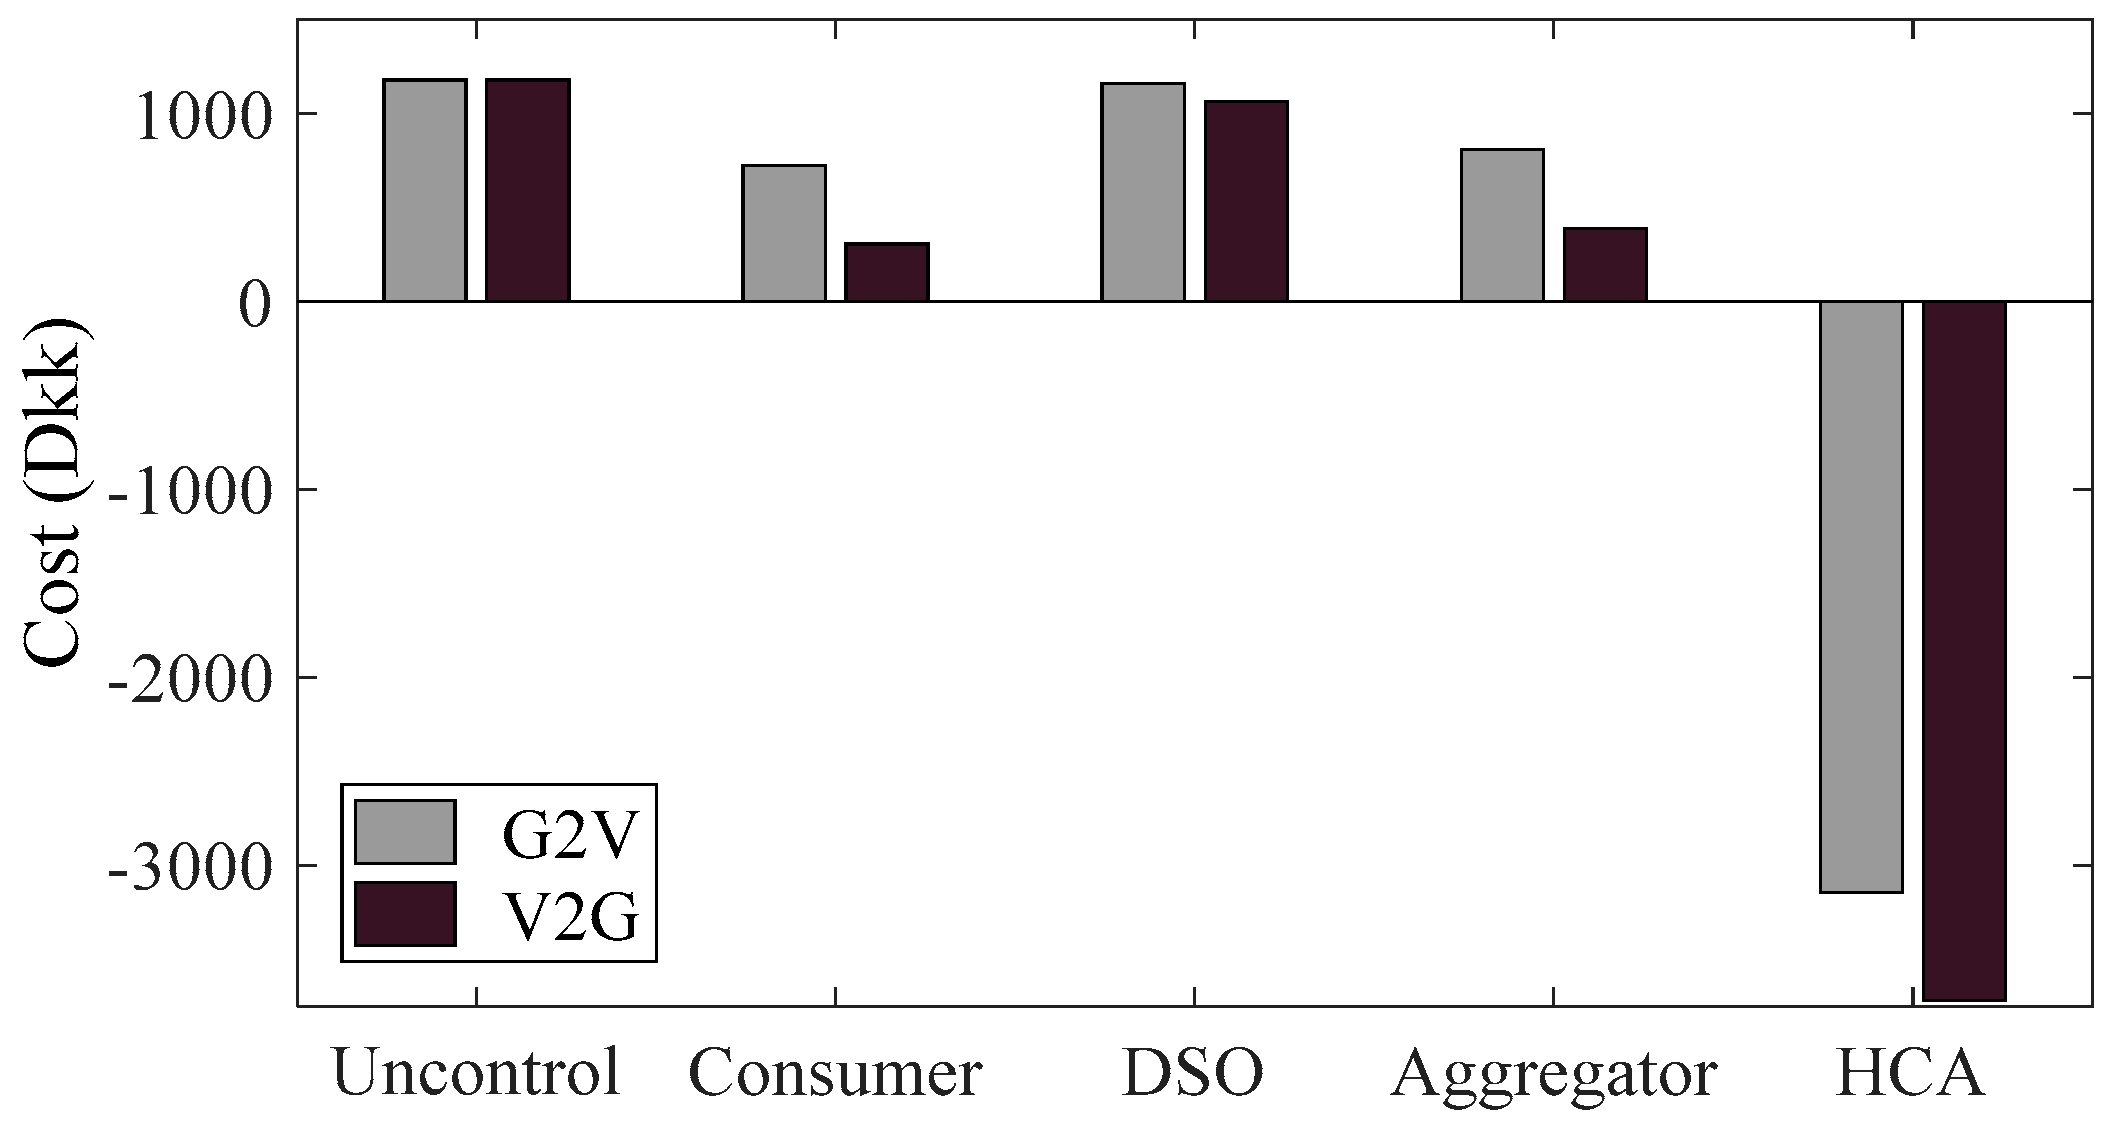
6.2.4. Hierarchical Coordinated Charging

Unlike individual actors perspective where EVs are scheduled based on their individual objectives, the HCA first formulate the problem as a single optimization problem considering the requirements of each actor. In particular, the HCA minimizes the total EV charging cost (equivalently maximizes the benefits) by considering day-ahead, balancing, and regulating prices through explicit consideration of network limits and EV requirements as constraints. The HCA thus provides a framework for EVs to participate in BRM with the remaining up-/down-regulation capabilities of already scheduled EVs. Figure 14 depicts the regulating capacity of EVs during G2V and V2G scenarios. It is observed that regulation-up capacity is significantly smaller compared to the regulation-down capacity in G2V case. This is due to the fact that the EV can provide the regulation-up during charging periods only. As EVs stays idle for most of the time, they provide regulation-down capability for most of the time. However, during V2G case, both up- and down-regulations are remarkably higher compared to the case of G2V. This is due to increased regulation potential resulting from V2G capability. One interesting observation from Figure 14 is that the regulation capacity from EVs is greater than the feeder capacity limit. Therefore, the usable up-/down-regulation capabilities are limited to the network thermal limit.
In addition, it is observed from Figure 12 that the total cost for EV charging is negative in both G2V and V2G. Basically, paying the negative price means getting money back instead. In fact, the participation of EVs in BRM allows the EV owners to earn money. For the given configuration of electricity price, the consumers were able to get approximately five times the total cost paying for EV charging. In particular, EV charging cost during V2G in HCA is compared with the total charging cost of G2V while charging from consumer perspective. In addition to the significant financial benefits, HCA also allows to utilize EV flexibility by DSO for solving grid congestion and by system operators for system balancing. However, one should note that the utilization of those additional flexibilities from EVs may result in violations of voltage in the network, thereby requiring a real-time control.
Figure 15 illustrates a portion of voltage and total EV charging power profiles at the farthest end node in the network before and after realization of the adaptive control. Figure 15a,b demonstrates how EV flexibilities are utilized to solve local voltage violations. In particular, at the beginning of each slot, the voltage deviates below the pre-defined values due to random additions of loads to emulate errors on load forecasting and/or plug-in/-out of EV estimates. However, the P(V) droop implemented at each EV charging controls the actual power of the EVs whose voltage at the POC is violated to bring the voltage back within the acceptable limits. Figure 15b illustrates the total EV charging power at node-15 where the voltage was violated. It can be observed that the droop decreases the EV power per observed POC voltage when voltage lies between Vth and Vmin. Thus, the droop acts locally to improve voltage in real-time which otherwise cannot be done by SL and CL.

7. Conclusions

This paper presented a multi-time scale EV charging control algorithm to simultaneously maximize the economic benefits and technical grid supports. First, the EV charging problem is investigated individually from consumer, DSO, and aggregator perspectives. Potential drawbacks while analyzing EV charging from individual actor’s perspective are quantified and a generic HCA framework is developed to realize the coordinative goal. Particularly, HCA integrates multi-time scale control, including a day-ahead scheduling, 15-min based periodic balancing, and real-time adaptive control. This is done to simultaneously respect economic benefits, network constraints, and consumer requirements in the EV charging problem. Simulation results demonstrated the capability of the HCA in enabling consumer participation in day-ahead, balancing, and BRM. For the given configuration, the EV owners were able to get significant economic benefit (up to five times the cost they were paying in the base case) using this approach. The future work will incorporate battery degradation and non-linear network constraints in the existing models to expand the capability of the presented method. Moreover, availability and energy payments from regulation markets will be incorporated in the future.

Acknowledgments

This work was supported by Laboratory Directed Research and Development fund from Idaho National Laboratory, ‘Work for Others’ projects for U.S. Army, Navy, and AirForce, and Idaho National Laboratory’s Program Development Funds. The authors would like to acknowledge all the funding sources for providing financial supports.

Author Contributions

Bishnu P. Bhattarai performed modeling, simulation, result analysis, and paper writing. Kurt S. Myers, Birgitte Bak-Jensen, and Sumit Paudyal provided feedback at each step of modeling, simulation, and result analysis and significantly contributed in paper writing and reviewing.

Conflicts of Interest

The authors declare no conflict of interests.

References

  1. The U.S. Department of Energy. Smart Grid System Report; The U.S. Department of Energy: Washington, DC, USA, 2014.
  2. Danish Ministry of Climate. Energy and Building, Energy Policy Report; Danish Ministry of Climate: Copenhagen, Denmark, 2013. [Google Scholar]
  3. Bhattarai, B.P.; Bak-Jensen, B.; Mahat, P.; Pillai, J.R.; Maier, M. Hierarchical control architecture for demand response in smart grid scenario. In Proceedings of the 5th IEEE PES Asia-Pacific Power and Energy Engineering Conference (APPEEC 2013), Hong Kong, China, 8–11 December 2013; pp. 1–6.
  4. Danish Energy Association. Smart Grid in Denmark 2.0; Energinet.dk: Erritsø, Denmark, 2013. [Google Scholar]
  5. Bhattarai, B.P.; Lévesque, M.; Maier, M.; Bak-Jensen, B.; Pillai, J.R. Optimizing electric vehicle coordination over a heterogeneous mesh network in a scaled-down smart grid testbed. IEEE Trans. Smart Grid 2015, 6, 784–794. [Google Scholar] [CrossRef]
  6. Han, S.; Han, S. Economic feasibility of V2G frequency regulation in consideration of battery wear. Energies 2013, 6, 748–765. [Google Scholar] [CrossRef]
  7. Masuta, T.; Yokoyama, A. Supplementary load frequency control by use of a number of both electric vehicles and heat pump water heaters. IEEE Trans. Smart Grid 2012, 3, 1253–1262. [Google Scholar] [CrossRef]
  8. Zhou, L.; Li, Y.; Wang, B.; Wang, Z.; Hu, X. Provision of supplementary load frequency control via aggregation of air conditioning loads. Energies 2015, 8, 14098–14117. [Google Scholar] [CrossRef]
  9. Gelazanskas, L.; Gamage, K.A.A. Distributed energy storage using residential hot water heaters. Energies 2016, 9, 127. [Google Scholar] [CrossRef] [Green Version]
  10. Pillai, J.R.; Bak-Jensen, B. Integration of vehicle-to-grid in western Danish power system. IEEE Trans. Sustain. Energy 2011, 2, 12–19. [Google Scholar] [CrossRef]
  11. Hu, W.; Su, C.; Chen, Z.; Bak-Jensen, B. Optimal operation of plug-in electric vehicles in power systems with high wind power penetrations. IEEE Trans. Sustain. Energy 2013, 4, 577–585. [Google Scholar]
  12. Liu, Z.; Wu, Q.; Hielsen, A.H.; Wang, Y. Day-ahead energy planning with 100% electric vehicle penetration in the Nordic region by 2050. Energies 2014, 7, 1733–1749. [Google Scholar] [CrossRef] [Green Version]
  13. Pakka, V.H.; Rylatt, M. Design and analysis of electrical distribution networks and balancing markets in the UK: A new framework with applications. Energies 2016, 9, 101. [Google Scholar] [CrossRef] [Green Version]
  14. Wen, C.; Chen, J.; Teng, J.; Ting, P. Decentralized plug-in electric vehicle charging selection algorithm in power systems. IEEE Trans. Smart Grid 2012, 3, 1779–1789. [Google Scholar] [CrossRef]
  15. Rasheed, M.B.; Javaid, N.; Ahmad, A.; Jamil, M.; Khan, Z.A.; Qasim, U.; Alrajeh, N. Energy optimization in smart homes using customer preference and dynamic pricing. Energies 2016, 9, 583. [Google Scholar] [CrossRef]
  16. Rasheed, M.B.; Javaid, N.; Awais, M.; Khan, Z.A.; Qasim, U.; Alrajeh, N.; Iqbal, Z.; Javaid, Q. Real time information based energy management using customer preference and dynamic pricing in smart homes. Energies 2016, 9, 542. [Google Scholar] [CrossRef]
  17. Olivella-Rosell, P.; Villafafila, R.R.; Sumper, A.; Bergas-Jane, J. Probabilistic agent-based model of electric vehicle charging demand to analysis the impact on distribution networks. Energies 2015, 8, 4160–4187. [Google Scholar] [CrossRef] [Green Version]
  18. Bhattarai, B.P.; Bak-Jensen, B.; Mahat, P.; Pillai, J.R. Voltage controlled dynamic demand response. In Proceedings of the 2013 4th IEEE/PES Innovative Smart Grid Technologies Europe (ISGT EUROPE), Copenhagen, Denmark, 6–9 October 2013.
  19. Leemput, N.; Geth, F.; Roy, J.V.; Olivella-Rosell, P.; Driesen, J.; Sumper, A. MV and LV residential grid impact of combined slow and fast charging of electric vehicles. Energies 2015, 8, 1760–1783. [Google Scholar] [CrossRef] [Green Version]
  20. Sundstrom, O.; Binding, C. Flexible charging optimization for electric vehicles considering distribution grid constraints. IEEE Trans. Smart Grid 2013, 3, 26–37. [Google Scholar] [CrossRef]
  21. Alonso, M.; Amaris, H.; Germain, J.G.; Galan, J.M. Optimal charging scheduling of electric vehicles in smart grids by heuristic algorithms. Energies 2014, 7, 2449–2475. [Google Scholar] [CrossRef]
  22. Gan, L.; Topcu, U.; Low, H. Optimal decentralized protocol for electric vehicle charging. IEEE Trans. Power Syst. 2013, 28, 940–951. [Google Scholar] [CrossRef]
  23. Gerards, M.E.T.; Hurink, J.L. Robust peak-shaving for a neighborhood with electric vehicles. Energies 2016, 9, 594. [Google Scholar] [CrossRef]
  24. Clement-Nyns, K.; Haesen, E.; Driesen, J. The impact of charging plug-in hybrid electric vehicles on a residential distribution grid. IEEE Trans. Power Syst. 2010, 25, 371–380. [Google Scholar] [CrossRef] [Green Version]
  25. Richardson, P.; Flynn, D.; Keane, A. Local versus centralized charging strategies for electric vehicles in low voltage distribution systems. IEEE Trans. Smart Grid 2012, 3, 1020–1028. [Google Scholar] [CrossRef]
  26. Bhattarai, B.P.; Bak-Jensen, B.; Pillai, J.R.; Mahat, P. Two-stage electric vehicle charging coordination in low voltage distribution grids. In Proceedings of the 2014 IEEE PES Asia-Pacific Power and Energy Engineering Conference (APPEEC), Hong Kong, China, 7–10 December 2014; pp. 1–5.
  27. Fan, Y.; Zhu, W.; Xue, Z.; Zhang, L.; Zou, Z. A multi-function conversion techniques for vehicle to grid applications. Energies 2015, 8, 7638–7653. [Google Scholar] [CrossRef]
  28. Hu, J.; You, S.; Lind, M.; Østergaard, J. Coordinated charging of electric vehicles for congestion prevention in the distribution grid. IEEE Trans. Smart Grid 2014, 5, 703–711. [Google Scholar] [CrossRef] [Green Version]
  29. Mingchao, C.; Lai, Q.; Zhong, Y.; Li, C.; Chiang, H. Aggregator-based interactive charging management system for electric vehicle charging. Energies 2014, 9. [Google Scholar] [CrossRef]
  30. Geng, B.; Mills, J.K.; Sun, D. Two-stage charging strategy for plug-In electric vehicles at the residential transformer level. IEEE Trans. Smart Grid 2013, 4, 1442–1452. [Google Scholar] [CrossRef]
  31. Bhattarai, B.P.; Bak-Jensen, B.; Pillai, J.R.; Maier, M. Demand flexibility from residential heat pump. In Proceedings of the 2014 IEEE PES General Meeting | Conference & Exposition, National Harbor, MD, USA, 27–31 July 2014.
  32. Yang, J.; Hao, W.; Chen, L.; Chen, J.; Jin, J.; Want, F. Risk assessment of distribution networks considering the charging-discharging behaviors of electric vehicles. Energies 2016, 9, 560. [Google Scholar] [CrossRef]
  33. Divshali, P.H.; Choi, B.J. Electrical market management considering power system constraints in smart distribution grids. Energies 2016, 9, 405. [Google Scholar] [CrossRef]
  34. Paudyal, S.; Bharati, G.R. Hierarchical approach for optimal operation of distribution grid and electric vehicles. In Proceedings of the 2015 IEEE PowerTech Eindhoven, Eindhoven, The Netherlands, 29 June–2 July 2015.
  35. Bhattarai, B.P.; Bak-Jensen, B.; Pillai, J.R.; Gentle, J.; Myers, K. Overvoltage mitigation using coordinated control of demand response and grid-tiled rooftop photovoltaic. In Proceedings of the 2015 IEEE Conference on Technologies for Sustainability (SusTech), Ogden, UT, USA, 30 July–1 August 2015.
  36. Bharati, G.R.; Paudyal, S. Coordinated control of distribution grid and electric vehicle loads. Electr. Power Syst. Res. 2016, 140, 761–768. [Google Scholar] [CrossRef]
  37. Galvan, E.; Mandal, P.; Velez-Reyes, M.; Kamalasadan, S. Transitive control mechanism for efficient management of EVs charging in transitive energy environment. In Proceedings of the 2016 North American Power Symposium (NAPS), Denver, CO, USA, 18–20 September 2016.
  38. Mendaza, I.D.C.; Pigazo, A.; Bak-Jensen, B.; Chen, Z. Generation of domestic hot water space heating and driving pattern profiles for integration analysis of active loads in low voltage grids. In Proceedings of the 4th IEEE/PES Innovative Smart Grid Technologies Europe (ISGT EUROPE), Copenhagen, Denmark, 6–9 October 2013.
  39. Bhattarai, B.P.; Levesque, M.; Bak-Jensen, B.; Pillai, J.; Maier, M.; Tipper, D.; Myers, K. Design and co-simulation of hierarchical architecture for demand response control and coordination. IEEE Trans. Ind. Inform. 2016. [Google Scholar] [CrossRef]
  40. Bhattarai, B.P.; De Zerio Mendaza, I.D.; Bak-Jensen, B.; Pillai, J.R.; Karki, N.R.; Gentle, J.P.; Myers, K.S. Active control of thermostatic loads for economic and technical support to distribution grids. In Proceedings of the 2016 Power and Energy Society General Meeting (PESGM), Boston, MA, USA, 17–21 July 2016.
  41. Bhattarai, B.P.; Mendaza, I.D.M.; Bak-Jensen, B.; Pillai, J.R. Local adaptive control of solar photovoltaic and electric water heaters for real-time grid support. In Proceedings of the 2016 CIGRE Paris Session, Paris, France, 21–26 August 2016.
Figure 1. Future power system problem. EV: electric vehicle.
Energies 10 00037 g001
Figure 2. (a) Three-state EV model; and (b) regulation capability of single EV.
Energies 10 00037 g002
Figure 3. Configuration of EV data for simulation studies.
Energies 10 00037 g003
Figure 4. Schematic of EV charging coordination framework. DSO: distribution system operator.
Energies 10 00037 g004
Figure 5. Hierarchical coordinated schematic.
Energies 10 00037 g005
Figure 6. Block diagram of the hierarchical control architecture (HCA) operation. SOC: state-of-charge; and LP: linear programming.
Energies 10 00037 g006
Figure 7. (a) Test case network; and (b) adaptive P(V) droop.
Energies 10 00037 g007
Figure 8. Distribution of: (a) initial SOC; and (b) EV connection nodes, for each EV.
Energies 10 00037 g008
Figure 9. Minimum and maximum load profile at the substation of test network.
Energies 10 00037 g009
Figure 10. Day-ahead, balancing, and regulating prices.
Energies 10 00037 g010
Figure 11. (a) Grid-to-vehicle (G2V) from consumer perspective; (b) vehicle-to-grid (V2G) from consumer perspective; (c) DSO perspective; and (d) farthest end voltage at various cases.
Energies 10 00037 g011
Figure 12. EV charging/discharging cost during various cases.
Energies 10 00037 g012
Figure 13. EV charging/discharging from aggregator perspective.
Energies 10 00037 g013
Figure 14. Up-/down-regulation capability of EVs at: (a) G2V; and (b) V2G cases.
Energies 10 00037 g014
Figure 15. Adaptive variation of power per real-time monitored voltage.
Energies 10 00037 g015

