Article

Optimization of Reducing Sugar Production from Manihot glaziovii Starch Using Response Surface Methodology

by
Abdi Hanra Sebayang
1,2,
Masjuki Haji Hassan
1,
Hwai Chyuan Ong
1,*,
Surya Dharma
1,2,
Arridina Susan Silitonga
1,2,
Fitranto Kusumo
1,
Teuku Meurah Indra Mahlia
3 and
Aditiya Harjon Bahar
4
1
Department of Mechanical Engineering, Faculty of Engineering, University of Malaya, Kuala Lumpur 50603, Malaysia
2
Department of Mechanical Engineering, Medan State Polytechnic, Medan 20155, Indonesia
3
Department of Mechanical Engineering, Universiti Tenaga Nasional, Kajang 43000, Selangor, Malaysia
4
Department of Mechanical Engineering, Faculty of Engineering, The University of Melbourne, Parkville, VIC 3010, Australia
*
Author to whom correspondence should be addressed.
Energies 2017, 10(1), 35; https://doi.org/10.3390/en10010035
Submission received: 14 June 2016 / Revised: 30 August 2016 / Accepted: 4 September 2016 / Published: 1 January 2017
(This article belongs to the Collection Bioenergy and Biofuel)

Abstract

:
Bioethanol is known as a viable alternative fuel to solve both energy and environmental crises. This study used response surface methodology based on the Box-Behnken experimental design to obtain the optimum conditions for and quality of bioethanol production. Enzymatic hydrolysis optimization was performed with selected hydrolysis parameters, including substrate loading, stroke speed, α-amylase concentration and amyloglucosidase concentration. From the experiment, the resulting optimum conditions are 23.88% (w/v) substrate loading, 109.43 U/g α-amylase concentration, 65.44 U/mL amyloglucosidase concentration and 74.87 rpm stroke speed, which yielded 196.23 g/L reducing sugar. The fermentation process was also carried out, with a production value of 0.45 g ethanol/g reducing sugar, which is equivalent to 88.61% of ethanol yield after fermentation by using Saccharomyces cerevisiae (S. cerevisiae). The physical and chemical properties of the produced ethanol are within the specifications of the ASTM D4806 standard. The good quality of ethanol produced from this study indicates that Manihot glaziovii (M. glaziovii) has great potential as bioethanol feedstock.

1. Introduction

The use of alternative fuels has rapidly developed with the objective of reducing the impact of continuously burning non-renewable fossil fuel. Currently, the predominant bioethanol is generally used blended with gasoline to push down the usage of conventional fuel and can be used in existing motor engines [1]. Bioethanol is a liquid resulting from fermentation of sugar and it is sourced from plants containing carbohydrates (starch) [2]. Moreover, microorganisms are used as enzymes in the fermentation process [3]. Bioethanol is widely used as a biofuel due to the following reasons: (1) bioethanol has high oxygen content and octane number; (2) bioethanol is non-toxic; and (3) bioethanol is environmentally friendly since it decreases pollutant emissions such as carbon monoxide, sulphur and nitrogen oxides [4,5]. However, bioethanol has a number of disadvantages, one of them being that it has low vapour pressure compared to gasoline, making engine starts difficult at low temperatures. In addition, bioethanol can cause corrosion in engines [6,7].
Bioethanol production from starch-based biomass is dependent on the type of feedstock and the steps involved in the bioethanol production process [8]. In general, bioethanol production consists of five main steps, which are pre-treatment, hydrolysis, fermentation, distillation and dehydration [9]. The hydrolysis process breaks down the carbohydrates in the feedstock into sugar by using enzymes [10], and hydrolysis is often taken as the parameter of interest in the effort to improve bioethanol production. First-generation bioethanol feedstocks such as corn, sweet potatoes, cassava and sugar cane have raised concerns about global food security, and this hinders worldwide acceptance of using bioethanol as fuel for compression-ignition engines. Hence, much effort is being made to produce bioethanol from non-edible feedstocks [11,12,13].
Manihot glaziovii (M. glaziovii) has been shown to be a promising non-edible feedstock for bioethanol production because of its low cost and high starch content [14]. M. glaziovii holds high starch content of about 70%–85% by dry weight and high rate of production per hectare, and these properties are suitable for bioethanol production [15]. Moreover, M. glaziovii is drought-resistant and has a short growth cycle, and therefore it can be grown on marginal lands. M. glaziovii is native to tropical countries within Africa, South America, South Asia and Southeast Asia regions [16].
Response surface methodology (RSM) is a technique based on design of experiments (DOE). RSM is used to analyse the changes of the dependent variable (i.e., response variable) due to changes in the independent variables, and it is also used to optimize the dependent variable. RSM has been widely used to optimize the process parameters for bioethanol and biodiesel production [17,18,19]. RSM has been shown to be an efficient method to optimize every stage of the bioethanol production process, which significantly reduces time, costs and effort associated with conventional experimental techniques [20].
Studies of the starch-to-glucose hydrolysis process have been widely performed. The enzymatic starch hydrolysis process [21,22] and the acid hydrolysis process [23,24,25] still use conventional methods. Therefore, RSM optimization methods are used in the starch hydrolysis process into reducing sugar to obtain optimum conditions globally.
In this study, M. glaziovii starch is used as the feedstock to produce bioethanol. In addition, optimization of enzymatic hydrolysis is performed, with expectation of yielding the optimum quality of the produced reducing sugar. Response surface methodology based on the Box-Behnken experimental design was then used to optimize the operating parameters of the hydrolysis processes. Quadratic regression models were developed in this study and used to predict the reducing sugar concentration from hydrolysis. The physical and chemical properties of the M. glaziovii bioethanol were then measured according to the methods outlined in the ASTM D4806 standard [9,26].

2. Materials and Methods

2.1. Substrate and Enzymes

M. glaziovii flour was sourced from North Sumatra, Indonesia. The M. glaziovii tubers was first peeled and washed to remove impurities, and then cut and shredded. The shredded M. glaziovii was added to water, transforming into wet starch. The wet starch was dried in an oven at a temperature of 50 °C for 48 h. This drying process is important for longer storage periods at 25 °C. The dried starch was then milled and sifted to obtain starch with a homogeneous particle size.
Enzyme α-amylase from Bacillus licheniformis Type XII-A and amyloglucosidase from Aspergillus niger are used as a catalyst liquefaction and saccharification. Both enzymes were purchased from Sigma-Aldrich (St. Louis, MO, USA), with enzymatic activity of more than or equal to 500 U/g protein for α-amylase and greater than or equal to 300 U/mL for amyloglucosidase.

2.2. Methodology

2.2.1. Composition of Manihot glaziovii Substrate

The composition of the M. glaziovii starch was measured at Bioethanol Laboratory, Faculty of Engineering, University of Malaya. The composition of M. glaziovii starch was measured according to the methods outlined in the AAAC International Approved Methods of Analysis.

2.2.2. Analysis of Sugars and Ethanol as by-Products

The reducing sugar content was analyzed using the 3,5-dinitrosalisilat acid (DNS) method [27]. The amount of reducing sugar was determined using an ultraviolet-visible (UV-Vis) spectrophotometer (SPEKOL® 1500, Analytik Jena, Berlin, Germany). Ethanol concentration is the concentration of ethanol at the end of fermentation. It was measured with a gas chromatograph (7890A, Agilent, Santa Clara, CA, USA) system with a thermal conductivity detector and 30 m × 0.32 mm, DB-ALC2 column (Agilent) with He as carrier gas, the injector temperature and detector temperature were 150 °C and 200 °C, respectively.

2.2.3. Hydrolysis Process

The general procedure of enzymatic hydrolysis was initiated by preparing the respective substrates in a flask filled with distilled water. The liquefaction process involved M. glaziovii starch (10%, 17.5% and 25% (w/v)) and (90, 100 and 110 U/g) of α-amylase at 90 °C, stroke speed 50, 90 and 130 spm. The liquefaction process was followed by a saccharification process with amyloglucosidase (36, 51 and 66 U/mL) at 70 °C for 240 min. Each sample was then centrifuged at 10,000 rpm for 5 min to separate the solid residue and then to test the DNS method to measure the amount of reducing sugar in each hydrolyzate. The optimization of M. glaziovii enzymatic hydrolysis was initiated.

2.2.4. Optimization of Hydrolysis Process

Response surface methodology based on Box-Behnken experimental design was used to optimize the operating parameters of the starch hydrolysis process. The Box-Behnken experimental design is one of the optimization tools available in the design expert software version 9.0.4.1 (Stat-Ease Inc., Minneapolis, MN, USA). The independent variables chosen for optimization are as follows: substrate loading (10%, 17.5% and 25% (w/v)), α-amylase concentration (90, 100 and 110 U/g), amyloglucosidase concentration (36, 51 and 66 U/mL) and stroke speed (50, 90 and 130 strokes/min, spm). The coded levels of the independent variables (factor variables) used for hydrolysis of M. glaziovii starch are presented in Table 1 and the Box-Behnken experimental design of the starch hydrolysis process is presented in Table 5.
The experimental data were analyzed using response surface regression. Also, analysis of variance (ANOVA) was used to assess the quality of the model fit. The quadratic response surface model for the reducing sugar concentration is given by Equation (1):
YRS = β0 + β1X1 + β2X2 + β3X3 + β4X4 + β12X1X2 + β13X1X3 + β14X1X4 + β23X2X3 + β24X2X4 + β34X3X4 + β11X12 + β22X22 + β33X32 + β44X42
In Equation (1), YRS is the response variable, which in this case is the reducing sugar concentration (g/L), β0 is the intercept term, β1, β2, β3 and β4 are linear coefficients, β12, β13, β14, β23, β24 and β34 are interactive coefficients, β11, β22, β33 and β44 are quadratic coefficients, and X1, X2, X3 and X4 are the coded independent variables. In this case, X1 represents the substrate loading (% (w/v)), X2 represents the α-amylase concentration (U/g), X3 represents the amyloglucosidase concentration (U/mL) and X4 represent stroke speed (strokes per minute, spm).

2.2.5. Yeast Culturing Media Preparation

The yeast of Saccharomyces cerevisiae (S. cerevisiae) Type II, which was purchased from Sigma-Aldrich, was used to ferment the M. glaziovii starch into ethanol. Yeast peptone dextrose was used for cultivating and maintaining dry yeast from S. cerevisiae. The yeast peptone dextrose was prepared by 2 g of yeast extract, 4 g bacterial peptone, 4 g of glucose and 12 g agar in 200 mL of distilled water. Then, dry yeast was activated by adding 100 mL of distilled water in flask. The solution was sterilized in an autoclave for 35 min and it was placed and maintained on a glass petri dish. The yeast is kept in an incubator at a temperature of 37 °C for 48 h in order to make it occulated before being used for bioethanol production.

2.2.6. Fermentation Process

The fermentation process was carried out in 250 mL Erlenmeyer flasks. Each flask containing hydrolysed M. glaziovii starch was mixed with the following fermentation nutrients: 1 g of yeast extract, 0.4 g of potassium dihydrogen phosphate (KH2PO4) and 0.2 g of ammonium chloride (NH4Cl) for every 100 mL of hydrolysate. The solutions were mixed and then sterilized at a temperature of 125 °C by autoclave for 35 min. The sterilized solutions were then inoculated with S. cerevisiae yeast. Then, the flasks were placed in an incubator shaker. Finally, the flasks were placed in an incubator shaker at 37 °C, agitation 120 rpm for 84 h for the fermentation process. Samples were taken after 12, 24, 36, 48, 60, 72 and 84 h.

2.2.7. Fermentation Kinetics

Modified Gompertz’s equation was used to determine the fermentation kinetics of the M. glaziovii starch [28], which is expressed as:
C e = C e . max × exp { exp [ R e . max × exp ( 1 ) C e . max ] × ( t L t ) + 1 }
where Ce is the predicted ethanol concentration (g/L), Ce.max is the maximum ethanol concentration (g/L), Re.max is the maximum ethanol production rate (g/L/h), tL is the lag phase time (h), and t is the independent variable of time (h).

2.2.8. Distillation Process

The ethanol extraction process was carried out in two stages: distillation and dehydration. Distillation was carried out using a rotary evaporator at a temperature, pressure and rotary speed of 60 °C, 175 mbar and 100 rpm, respectively. The vaporized fermentation solution was vacuumed by a pump and flowed to the other end to be condensed, resulting in an improved quality of ethanol solution. Following that, dehydration process using zeolite was performed. Zeolite was introduced into the dehydration column with diameter of 1 inch and the height of the zeolite is 90% (w/v).

2.2.9. Fourier Transform Infrared Spectroscopy

Fourier transform infrared (FTIR) spectroscopy is a powerful analytical technique to examine the functional groups of an alcohol, therefore FTIR (Tensor 27, Bruker, Billerica, MA, USA) was utilized to identify the limits of the chemical structure of M. glaziovii bioethanol. The produced bioethanol M. glaziovii was analyzed by attenuated total reflection (ATR) sample compartment with mid-infrared (MIR) spectra in the wavenumber range of 4000–400 cm−1.

2.2.10. Physical and Chemical Properties of the Manihot glaziovii Bioethanol

The physical and chemical properties of the bioethanol produced from the inedible M. glaziovii feedstock were tested according to the methods outlined in ASTM D4806 standard. The equipment used to analyze the physical and chemical properties of the bioethanol are summarized in Table 2.

3. Results and Discussion

3.1. Composition of Manihot glaziovii Substrate

The M. glaziovii starch was stored in a closed container in a refrigerator before the laboratory experiment was conducted. The M. glaziovii starch consisted of particles with diameter 125–150 μm (98% or more particles pass through a 150 μm sieve). The content of the main components in the M. glaziovii starch was determined by chemical analysis (Table 3). The presence of more than 70 wt % of carbohydrates in the biomass makes it a potential substrate for bioethanol fuels.

3.2. Optimization of Starch Hydrolysis Process Operating Parameters

Once the optimal hydrolysis process is determined, the Box-Behnken design is used to test four different independent variables in the hydrolysis process. ANOVA was used to determine the effects of the independent variables (i.e., substrate loading, α-amylase concentration, amyloglucosidase concentration and stroke speed) on the dependent variable (i.e., reducing sugar concentration).
Table 4 showed that the regression coefficients of the linear terms X1, X2, and X3 were significant at the 1% level as well as quadratic coefficients of X 1 2 . The regression coefficients of the linear term X4, X2X4 and X3X4 were significant at the 5% level as well as quadratic coefficients of X 2 2 . The polynomial model for reducing sugar concentration was regressed by considering the significant terms and is shown in Equation (3) below:
Y RS = 886.67279 + 10.19401 X 1 + 15.62925 X 2 0.77128 X 3 + 0.91738 X 4 0.012025 X 2 X 4 + 0.009287 X 3 X 4 0.27024 X 1 2 0.07333 X 2 2
In Equation (3), YRS represents the reducing sugar concentration (g/L), X1 represents the substrate loading, X2 represents the α-amylase concentration, X3 represents the amyloglucosidase concentration and X4 represents the stroke speed.
The ANOVA results for the starch hydrolysis process are presented in Table 4. The reducing sugar concentrations were predicted using Equation (3) for each sample and the results are shown in Table 5.
ANOVA was carried out to determine the statistical significance of the quadratic response surface model, and it can be seen from Table 4 that the p-value of the model was less than 0.0001, which indicates the model was statistically significant. The coefficient of determination (R2) was found to be 0.9914, which indicates that 99.14% of the experimental data were relevant and only 0.86% of the total variations was not explained by the model. In general, a high value of R2 indicates that there is good fit between the predicted data and experimental data.
The adjusted coefficient of determination (Ra2) was found to be very high with a value of 0.9828, which indicates that that the model accounted for 98.28% of the variability in the data. The coefficient of variation (C.V.) was found to be 3.05%, indicating that the deviations between the predicted data and experimental data were small. The lack of fit was found to be small with a value of 5.39, and this indicates that the model adequately described the relationship between the dependent variable (i.e., reducing sugar concentration) and the independent variables (i.e., substrate loading, α-amylase concentration, amyloglucosidase concentration and stroke speed). The corresponding p-value for the lack of fit parameter was 0.0593 (p-value > α), which indicates that there was no evidence that the model did not fit the experimental data.
From the experimental result inputs, the optimum conditions for enzymatic hydrolysis were generated by DOE. The optimum substrate loading, α-amylase concentration, amyloglucosidase concentration and stroke speed were 23.88% (w/v), 109.43 U/g, 65.44 U/mL and 74.87 spm, respectively. The optimum reducing sugar was found to be 196.23 g/L. Verification tests in triplicate were performed under the set of optimized parameters. Average reducing sugar of 194.98 g/L was achieved, at predicted optimum conditions of the variables.
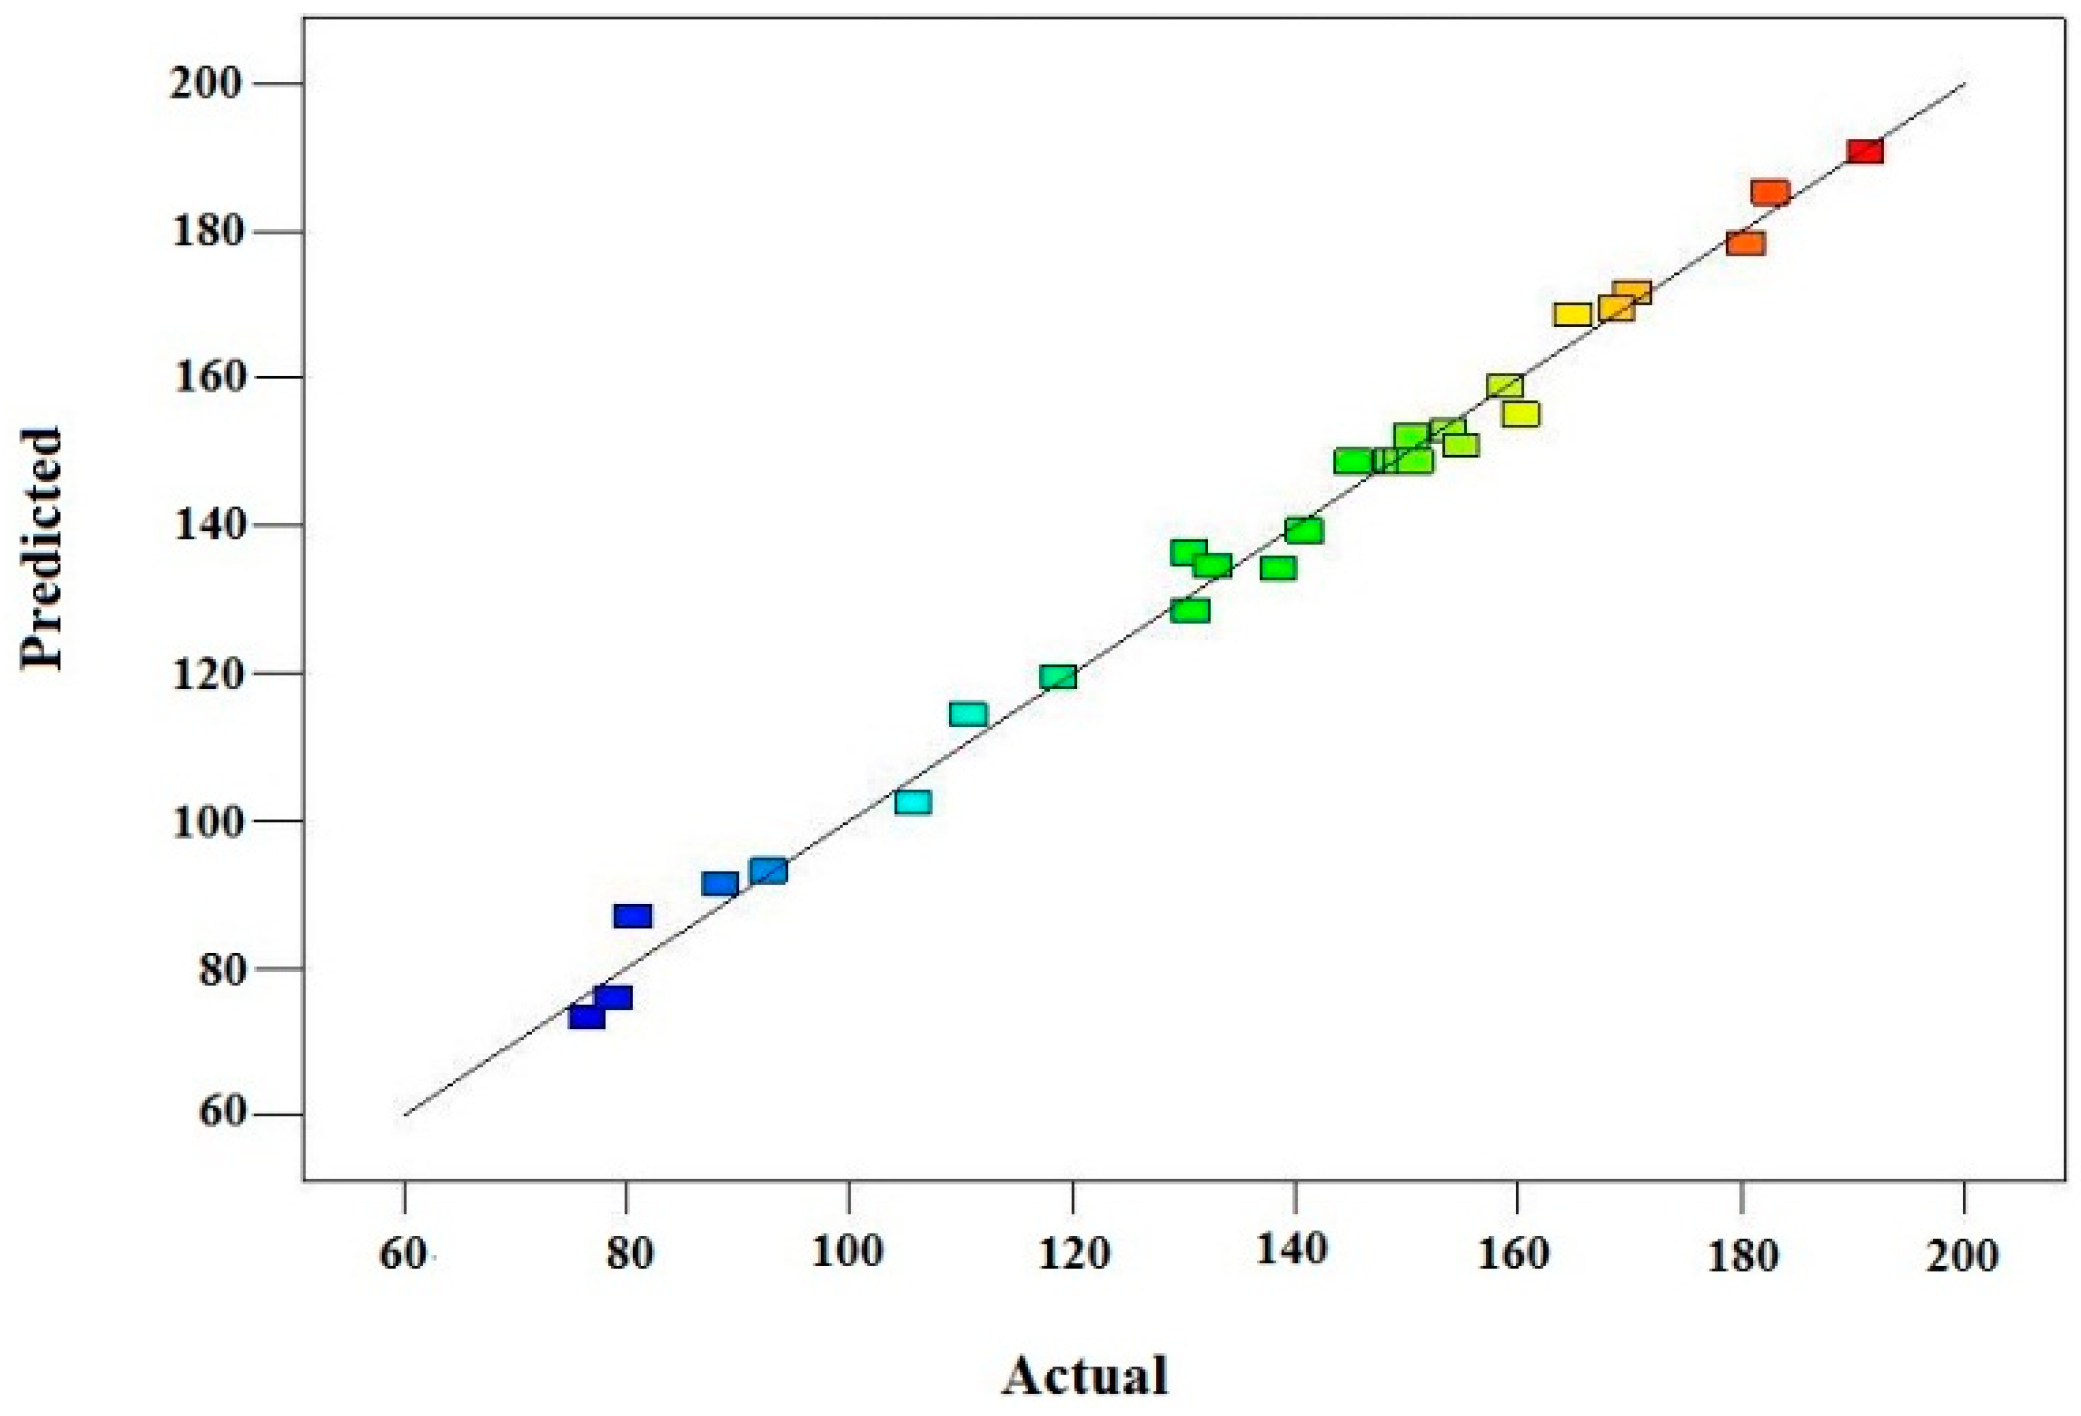
The predicted reducing sugar concentrations are plotted against the experimental values, as shown in Figure 1. It can be observed that all of the data points lie within the proximity of the regression line, which indicates that there is good agreement between the predicted and experimental data.

3.3. Relationship between the Independent Variables of the Starch Hydrolysis Process

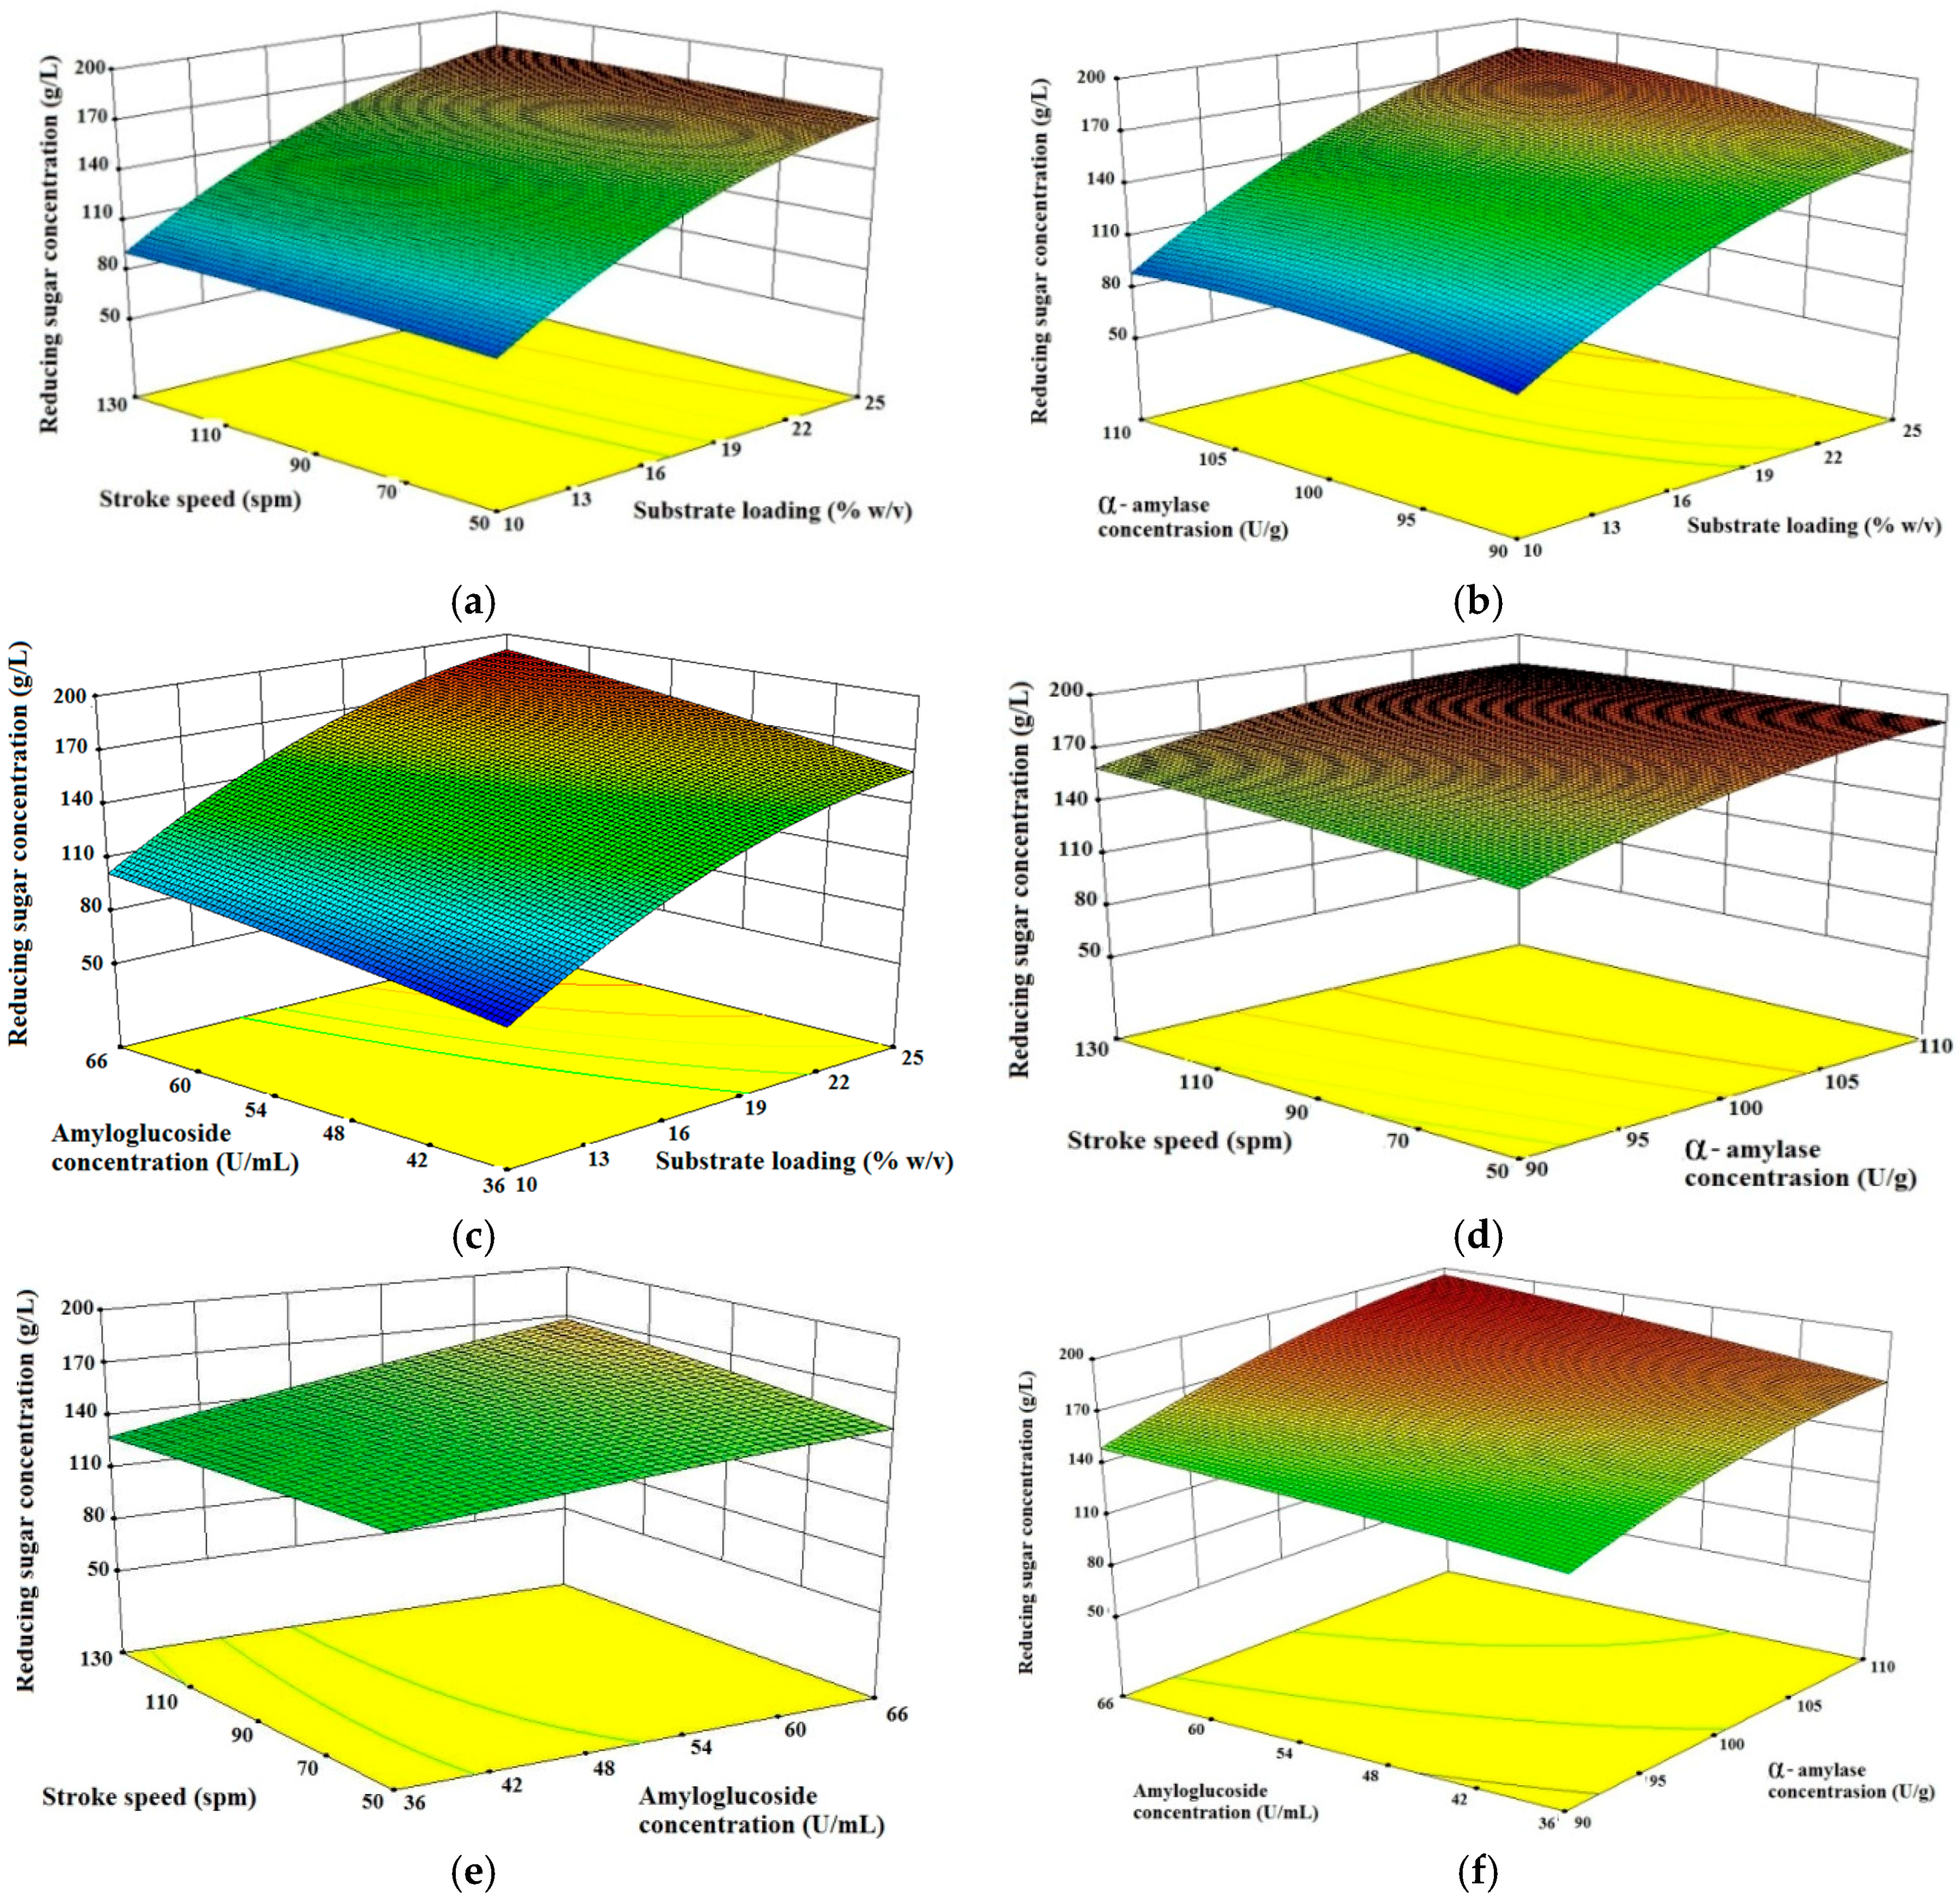
In this study, the operating parameters of the starch hydrolysis process (i.e., substrate loading, α-amylase concentration, amyloglucosidase concentration and stroke speed) were varied in order to determine the interaction effects of these parameters on the produced reducing sugar concentration. The results are presented in the form of three-dimensional surface plots. Figure 2a–c illustrates that there were significant interactions between substrate loading and other process parameters affecting the results of reducing sugar. Figure 2a–c showed that the substrate loading had a more significant influence on the results of reducing sugar compared with stroke speed, α-amylase concentration and amyloglucosidase concentration. In general, an increase in the substrate loading hastened the improvement of reducing sugar concentration. However, an increase in stroke speed had an insignificant effect on the reducing sugar concentration, and it was evident that for a fixed substrate loading, increasing the stroke speed would only increase reducing sugar production by a slight amount. Figure 2a–c indicates that high reducing sugar results could be achieved on a substrate loading amounted to 23.88% (w/v).
Figure 2b,d,f showed there were significant interactions between α-amylase concentration and other process parameters that affected the results of reducing sugar. Figure 2b,d,f showed that high reducing sugar results could be achieved at a concentration of α-amylase amounted to 109.43 U/g. Figure 2b showed that at high substrate loading, the result of reducing sugar increased significantly with increased α-amylase concentration. It is also shown in Figure 2f that increased α-amylase concentration which was followed by an increase in amyloglucosidase concentration also produced maximum reducing sugar.
Figure 2c,e,f showed there were significant interactions of amyloglucosidase concentration with other process parameters that affected the results of reducing sugar. This can be seen in Figure 2c,e,f, which shows that high reducing sugar results could be achieved at 65.44 U/mL amyloglucosidase concentration. However, in Figure 2e showed that the increase in stroke speed did not have a significant impact on increasing the reducing sugar.
The hydrolysis process (liquefaction and saccharification) for M. glaziovii starch is a process for converting starch molecules into reducing sugar that is carried out by the enzyme α-amylse and amyloglucosidase. Figure 2b,c shows reducing sugar levels rise with increasing concentration of the enzyme α-amylse and amyloglucosidase used in the hydrolysis process. This is due to the enzyme α-amylse and amyloglucosidase hydrolyzing α-1,4-glucoside and α-1,6-glucoside producing reducing sugar. From Figure 2a–f, the maximum concentration reducing sugar produced was 196.23 g/L (82%) when the substrate loading, α-amylase, amyloglucosidase concentration and stroke speed were 23.88% (w/v), 109.43 U/g, 65.44 U/mL and 74.87 spm, respectively. The results of reducing in this study are similar to a study by Naguleswaran et al. [25], with corn and triticale (80.8%–84.5%) as a feedstock, but slightly lower than that of wheat (90.8%–95.1%). Gumienna et al. [22] also conduct the enzyme hydrolysis for corn starch and obtained reducing sugar of 11.7 g/L (69.40%). Moreover, Tasić et al. [24] performed acid hydrolysis on potato and produced a 114 g/L (64%) concentration of reducing sugar. It was showed that optimization of hydrolysis improved the reducing sugar and increased ethanol yield.

3.4. Ethanol Production from Manihot glaziovii

The highest initial sugar from the hydrolysis process (Section 3.2) was fermented to produce bioethanol. The production of bioethanol in this study was conducted by batch fermentation. 
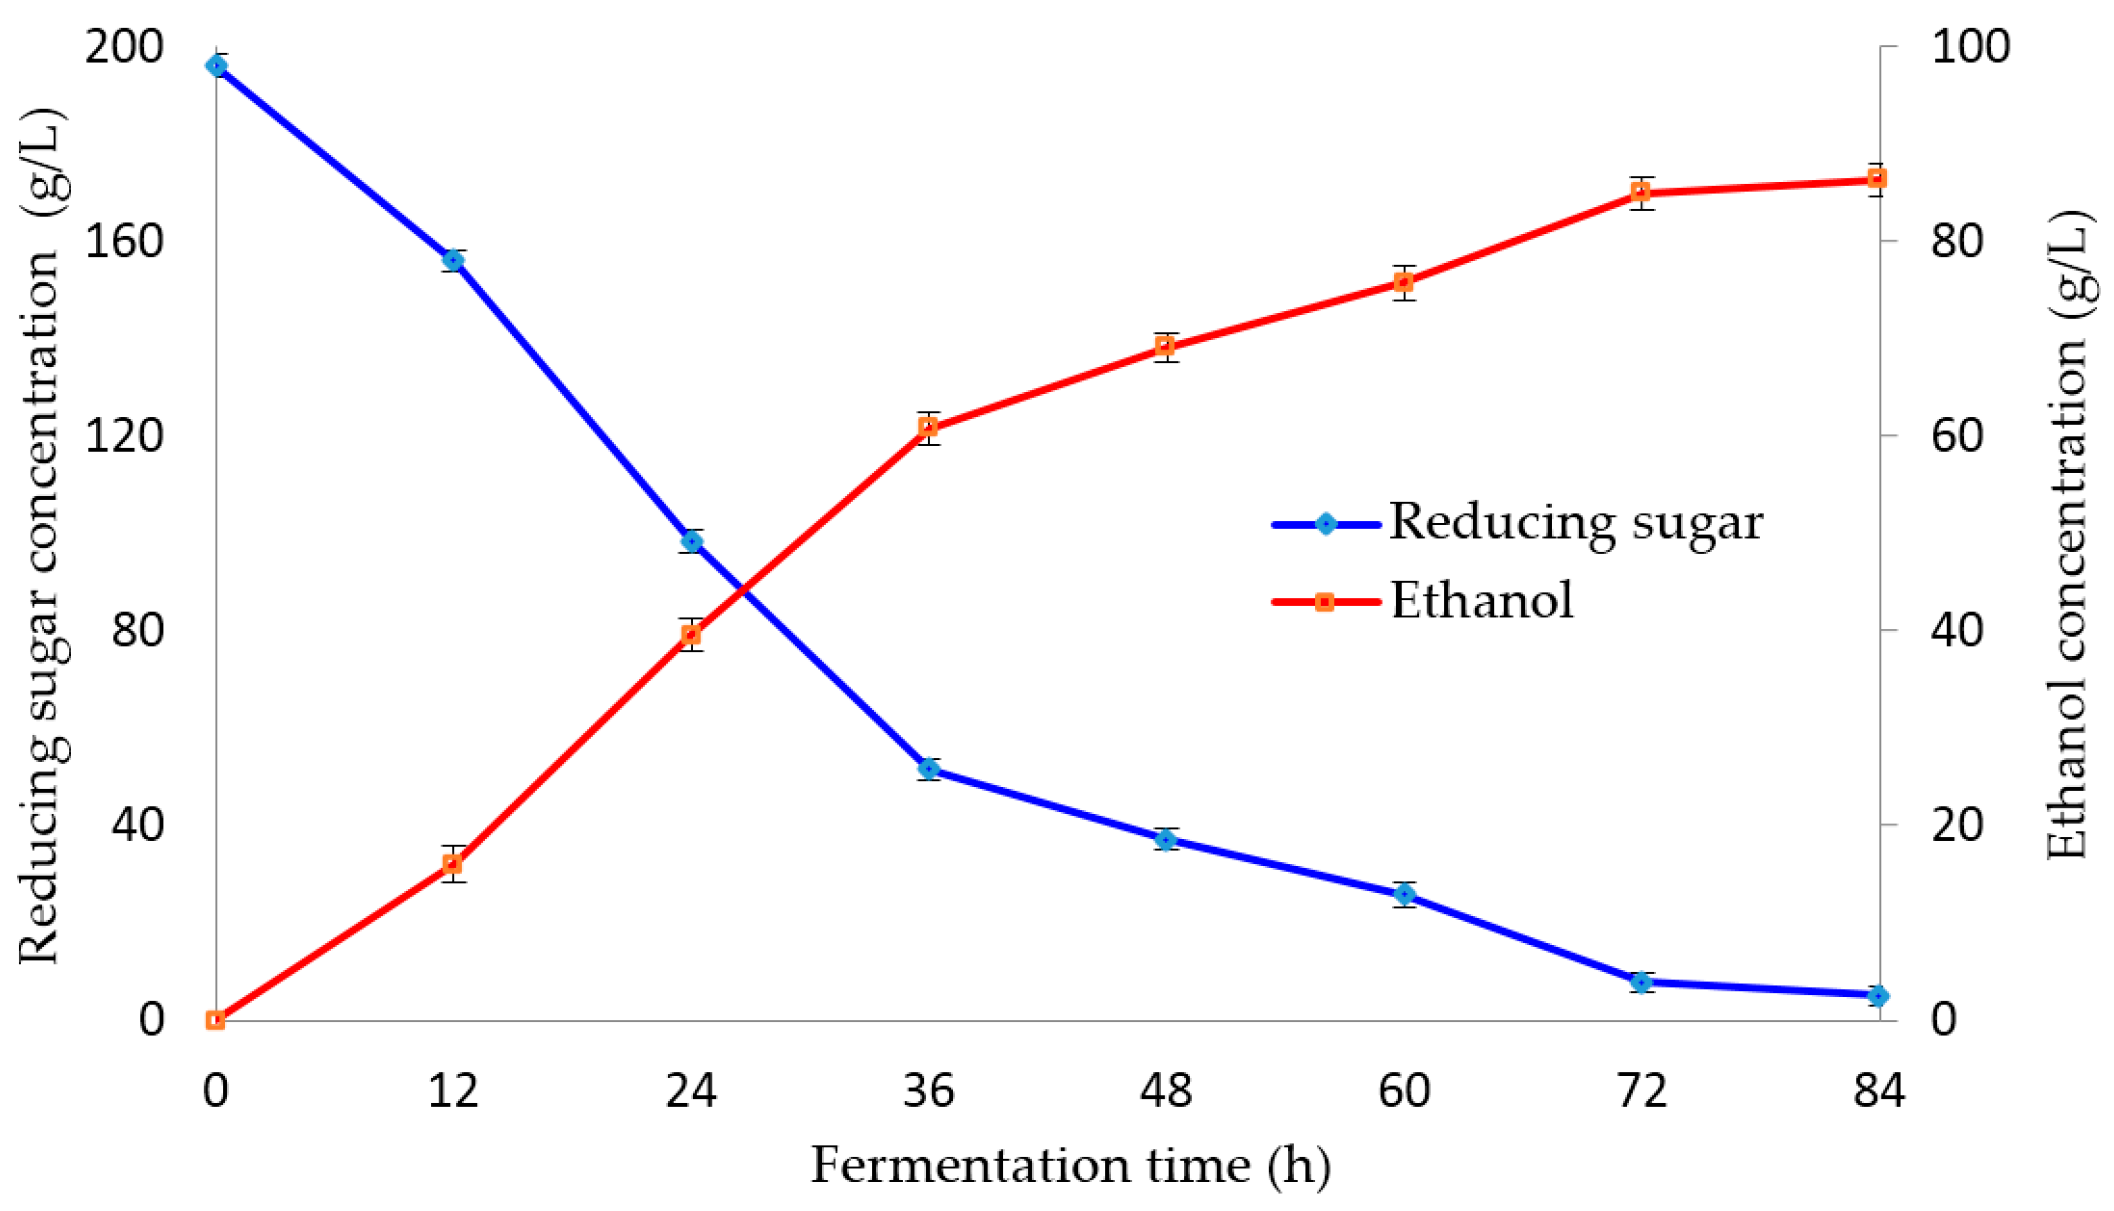
Figure 3 shows the production of ethanol from fermentation process by S. cerevisiae cultivated in M. glaziovii starch solution. During the first 12 h to 84 h of fermentation, reducing sugar consumed in M. glaziovii starch solution changed rapidly. After completing 84 h of fermentation, an ethanol production conversion ratio of 0.41–0.45 g ethanol/g reducing sugar was observed, which is equivalent to 81.94%–88.61% of theoretical ethanol yield (0.51 g ethanol/g reducing sugar). This also produced an ethanol concentration of 86.37 g/L after 84 h fermentation. The result for ethanol yields in this study was similar to study of Moshi et al. [14] and a little higher, where their ethanol yield was 82%–84% of theoretical ethanol yield. However, it was slightly lower than the results of the study Moshi et al. [15,29] which are equal to 95% and 94%. In addition, it was slightly higher when compared with the results of a study by Sivamani et al. [30], where they used cassava peel and ethanol yield was 83% of the theoretical ethanol yield. The same is true when the result is compared with the study by Gumienna et al. [22] where the outcome of each was 81.33%.

3.5. Fermentation Kinetics

In these fermentation conditions, the fermentation kinetics model was based on a modified Gompertz equation developed to describe dynamic change in ethanol concentration as a time function during ethanol fermentation. The kinetic model, which was obtained by nonlinear regression of experimental data using Microsoft Excel Solver, is given by:
C e = 87.47 × exp { exp [ 1.84 × exp   ( 1 ) 87.47 ] × ( 2.94 t ) + 1 }
where Ce is the ethanol concentration in g/L and t is the fermentation time in hours (h). According to Equation (4), the maximum ethanol concentration was 87.47 g/L, maximum reaction rate was 1.84 g/L/h and the lag time period was 2.94 h. The predicted ethanol concentrations using the kinetic model agreed well with the measured ethanol concentrations as shown in Figure 4. The R2 of the regression was 0.99.

3.6. Distillation and Dehydration

Purification of ethanol has been done through a process of distillation and dehydration. In the distillation operation, ethanol obtained had a purity of 91.23% (v/v), and then we continued with dehydration process. Dehydration process used zeolite as an adsorbent with a mass of 90% (w/v); the greater the mass of adsorbent zeolite in a column, the more the height of the content of zeolite in the column increased. The resulting contact between ethanol solution with zeolite solution took more time, so that more water molecules were absorbed into the zeolite pores. The dehydration process resulted in 95.6% (v/v) ethanol, 3.9% higher than Moshi et al. [21].

3.7. Fourier Transform Infrared Spectroscopy of Manihot glaziovii Bioethanol

Figure 5 illustrates the results of FTIR spectroscopy test of M. glaziovii bioethanol. Infrared absorption by O–H groups is indicated in 3355 cm−1 absorption wave; this condition shows that the broad O–H stretching vibration is very strong, and this is the same as the research by Yadira et al. [31]. Peak at 2977 cm−1 represents a stretching C–H bond. In addition, the existence of an absorption wave at the 1645 cm−1 region shows the presence of an alkene group with variable C=C bonds. Absorption at the 1453 cm−1 wave shows there is an alkane group with bonds between atoms C–H in the form of CH3 with medium intensity. The wave of 1320–1000 cm−1 shows the presence of ether groups to stretch the C–C bond, which is strong enough.

3.8. Physical and Chemical Properties of Manihot glaziovii Bioethanol

In general, the physical and chemical properties of the bioethanol indicate the quality of fuel used for internal combustion engines. In this study, the physical and chemical properties of M. glaziovii bioethanol were determined in accordance with the methods stipulated in the ASTM D4806 standard, and the properties are compared with those of gasoline and reference ethanol, as shown in Table 6. It can be seen that M. glaziovii bioethanol has an oxygen content of up to 35.1%, and it can improve the efficiency of combustion at high temperatures of combustion. In addition, the lower C/H atom ratio of M. glaziovii bioethanol decreases its adiabatic flame temperature, which leads to perfect combustion.

4. Conclusions

This study is focused on optimizing the reducing sugar process parameters from a non-edible feedstock, M. glaziovii The operating parameters of the hydrolysis process (i.e., percentage of substrate loading, α-amylase concentration, amyloglucosidase concentration and stroke speed) were optimized using response surface methodology in order to achieve the maximum reducing sugar concentration from hydrolysis of M. glaziovii starch. From this optimization, the observed optimum operating parameters for the hydrolysis process are as follows: 23.88% (w/v) substrate loading; 109.43 U/g α-amylase concentration; 65.44 (U/mL) amyloglucosidase concentration and 74.87 (spm) stroke speed. The results show that the substrate loading is the most important factor in reducing sugar production during hydrolysis. The quadratic response surface model predicted the optimum reducing sugar concentration to be 196.23 g/L, which is close to the experimental value of 194.98 g/L, which was obtained by running the hydrolysis with the optimum variables. In the latter part of the experiment, the optimized hydrolysate was brought to the fermentation process. The calculated ethanol concentration from the fermentation process using S. cerevisiae was found to be 86.37 g/L. From the optimization of enzymatic hydrolysis, it can be concluded that the selected parameters have a strong correlation with the reducing sugar production process, as proven by ANOVA analysis. Also, the results show that M. glaziovii has great potential for use as a non-edible feedstock for bioethanol production.

Acknowledgments

The authors gratefully acknowledge the financial support provided by the Ministry of Education of Malaysia and University of Malaya, Kuala Lumpur, Malaysia, under the High Impact Research Grant (Project title: Clean diesel technology for military and civilian transport vehicles, Grant No.: UM.C/HIR/MOE/ENG/07 D000007-16001), University Malaya Research Grant Scheme (Grant No.: RP022A-13AET), SATU Joint Research Scheme (RU021A-2015) and Postgraduate Research Grant, PPP (Grant No.: PG014-2015A).

Author Contributions

All the authors contributed to this work. Abdi Hanra Sebayang designed the study, performed the experiments, and prepared the first draft of the paper. Masjuki Haji Hassan, Hwai Chyuan Ong, Arridina Susan Silitonga, Teuku Meurah Indra Mahlia and Aditiya Harjon Bahar contributed to the conceptual approach and thoroughly revised the paper. Fitranto Kusumo contributed to developing the response surface methodology (RSM) analyses. Surya Dharma carried out the GC analyses and reducing sugar analyses by DNS method.

Conflicts of Interest

The authors declare no conflict of interest.

References

  1. Liguori, R.; Soccol, C.; De Souza Vandenberghe, L.P.; Woiciechowski, A.; Faraco, V. Second generation ethanol production from brewers’ spent grain. Energies 2015, 8, 2575–2586. [Google Scholar] [CrossRef]
  2. Renó, M.L.G.; Olmo, O.A.D.; Palacio, J.C.E.; Lora, E.E.S.; Venturini, O.J. Sugarcane biorefineries: Case studies applied to the brazilian sugar-alcohol industry. Energy Convers. Manag. 2014, 86, 981–991. [Google Scholar] [CrossRef]
  3. Pejin, J.D.; Mojović, L.V.; Pejin, D.J.; Kocić-Tanackov, S.D.; Savić, D.S.; Nikolić, S.B.; Djukić-Vuković, A.P. Bioethanol production from triticale by simultaneous saccharification and fermentation with magnesium or calcium ions addition. Fuel 2015, 142, 58–64. [Google Scholar] [CrossRef]
  4. Hansdah, D.; Murugan, S.; Das, L.M. Experimental studies on a DI diesel engine fueled with bioethanol-diesel emulsions. Alexandria Eng. J. 2013, 52, 267–276. [Google Scholar] [CrossRef]
  5. Wang, J.; Kim, Y.M.; Rhee, H.S.; Lee, M.W.; Park, J.M. Bioethanol production from mannitol by a newly isolated bacterium, Enterobacter sp. JMP3. Bioresour. Technol. 2013, 135, 199–206. [Google Scholar] [CrossRef] [PubMed]
  6. Balat, M. Production of bioethanol from lignocellulosic materials via the biochemical pathway: A review. Energy Convers. Manag. 2011, 52, 858–875. [Google Scholar] [CrossRef]
  7. Küüt, A.; Ritslaid, K.; Olt, J. Study of potential uses for farmstead ethanol as motor fuel. Agron. Res. 2011, 9, 125–134. [Google Scholar]
  8. Mahalaxmi, S.; Williford, C. Biochemical conversion of biomass to fuels. In Handbook of Climate Change Mitigation; Springer: Berlin, Germany, 2012; pp. 965–999. [Google Scholar]
  9. Sebayang, A.H.; Masjuki, H.H.; Ong, H.C.; Dharma, S.; Silitonga, A.S.; Mahlia, T.M.I.; Aditiya, H.B. A perspective on bioethanol production from biomass as alternative fuel for spark ignition engine. RSC Adv. 2016, 6, 14964–14992. [Google Scholar] [CrossRef]
  10. Yangcheng, H.; Jiang, H.; Blanco, M.; Jane, J.-L. Characterization of normal and waxy corn starch for bioethanol production. J. Agric. Food Chem. 2013, 61, 379–386. [Google Scholar] [CrossRef] [PubMed]
  11. Brunschwig, C.; Moussavou, W.; Blin, J. Use of bioethanol for biodiesel production. Prog. Energy Combust. Sci. 2012, 38, 283–301. [Google Scholar] [CrossRef]
  12. Ahmed, I.N.; Nguyen, P.L.T.; Huynh, L.H.; Ismadji, S.; Ju, Y.-H. Bioethanol production from pretreated Melaleuca leucadendron shedding bark—Simultaneous saccharification and fermentation at high solid loading. Bioresour. Technol. 2013, 136, 213–221. [Google Scholar] [CrossRef] [PubMed]
  13. Yu, C.-Y.; Jiang, B.-H.; Duan, K.-J. Production of bioethanol from carrot pomace using the thermotolerant yeast kluyveromyces marxianus. Energies 2013, 6, 1794–1801. [Google Scholar] [CrossRef]
  14. Moshi, A.P.; Hosea, K.M.M.; Elisante, E.; Mamo, G.; Mattiasson, B. High temperature simultaneous saccharification and fermentation of starch from inedible wild cassava (Manihot glaziovii) to bioethanol using caloramator boliviensis. Bioresour. Technol. 2015, 180, 128–136. [Google Scholar] [CrossRef] [PubMed]
  15. Moshi, A.P.; Crespo, C.F.; Badshah, M.; Hosea, K.M.M.; Mshandete, A.M.; Mattiasson, B. High bioethanol titre from Manihot glaziovii through fed-batch simultaneous saccharification and fermentation in automatic gas potential test system. Bioresour. Technol. 2014, 156, 348–356. [Google Scholar] [CrossRef] [PubMed]
  16. Li, P.; Zhu, M. A consolidated bio-processing of ethanol from cassava pulp accompanied by hydrogen production. Bioresour. Technol. 2011, 102, 10471–10479. [Google Scholar] [CrossRef] [PubMed]
  17. Zhang, W.; Lin, Y.; Zhang, Q.; Wang, X.; Wu, D.; Kong, H. Optimisation of simultaneous saccharification and fermentation of wheat straw for ethanol production. Fuel 2013, 112, 331–337. [Google Scholar] [CrossRef]
  18. Dharma, S.; Masjuki, H.H.; Ong, H.C.; Sebayang, A.H.; Silitonga, A.S.; Kusumo, F.; Mahlia, T.M.I. Optimization of biodiesel production process for mixed Jatropha curcasCeiba pentandra biodiesel using response surface methodology. Energy Convers. Manag. 2016, 115, 178–190. [Google Scholar] [CrossRef]
  19. Ali, O.; Mamat, R.; Najafi, G.; Yusaf, T.; Safieddin Ardebili, S. Optimization of biodiesel-diesel blended fuel properties and engine performance with ether additive using statistical analysis and response surface methods. Energies 2015, 8, 14136–14150. [Google Scholar] [CrossRef]
  20. Cheng, Y.; Wang, J.; Jönsson, P.G.; Zhao, Z. Improvement and optimization of the growth quality of upright ZnO rod arrays by the response surface methodology. Appl. Surf. Sci. 2015, 351, 451–459. [Google Scholar] [CrossRef]
  21. Moshi, A.P.; Crespo, C.F.; Badshah, M.; Hosea, K.M.M.; Mshandete, A.M.; Elisante, E.; Mattiasson, B. Characterisation and evaluation of a novel feedstock, Manihot glaziovii, Muell. Arg, for production of bioenergy carriers: Bioethanol and biogas. Bioresour. Technol. 2014, 172, 58–67. [Google Scholar] [CrossRef] [PubMed]
  22. Gumienna, M.; Szwengiel, A.; Lasik, M.; Szambelan, K.; Majchrzycki, D.; Adamczyk, J.; Nowak, J.; Czarnecki, Z. Effect of corn grain variety on the bioethanol production efficiency. Fuel 2016, 164, 386–392. [Google Scholar] [CrossRef]
  23. Meinita, M.D.N.; Marhaeni, B.; Winanto, T.; Setyaningsih, D.; Hong, Y.-K. Catalytic efficiency of sulfuric and hydrochloric acids for the hydrolysis of Gelidium latifolium (Gelidiales, Rhodophyta) in bioethanol production. J. Ind. Eng. Chem. 2015, 27, 108–114. [Google Scholar] [CrossRef]
  24. Tasić, M.B.; Konstantinović, B.V.; Lazić, M.L.; Veljković, V.B. The acid hydrolysis of potato tuber mash in bioethanol production. Biochem. Eng. J. 2009, 43, 208–211. [Google Scholar] [CrossRef]
  25. Naguleswaran, S.; Li, J.; Vasanthan, T.; Bressler, D.; Hoover, R. Amylolysis of large and small granules of native triticale, wheat and corn starches using a mixture of α-amylase and glucoamylase. Carbohydr. Polym. 2012, 88, 864–874. [Google Scholar] [CrossRef]
  26. Masum, B.M.; Masjuki, H.H.; Kalam, M.A.; Rizwanul Fattah, I.M.; Palash, S.M.; Abedin, M.J. Effect of ethanol-gasoline blend on NOx emission in SI engine. Renew. Sustain. Energy Rev. 2013, 24, 209–222. [Google Scholar] [CrossRef]
  27. Miller, G.L. Use of dinitrosalicylic acid reagent for determination of reducing sugar. Anal. Chem. 1959, 31, 426–428. [Google Scholar] [CrossRef]
  28. Dodić, J.M.; Vučurović, D.G.; Dodić, S.N.; Grahovac, J.A.; Popov, S.D.; Nedeljković, N.M. Kinetic modelling of batch ethanol production from sugar beet raw juice. Appl. Energy 2012, 99, 192–197. [Google Scholar] [CrossRef]
  29. Moshi, A.P.; Temu, S.G.; Nges, I.A.; Malmo, G.; Hosea, K.M.M.; Elisante, E.; Mattiasson, B. Combined production of bioethanol and biogas from peels of wild cassava Manihot glaziovii. Chem. Eng. J. 2015, 279, 297–306. [Google Scholar] [CrossRef]
  30. Sivamani, S.; Baskar, R. Optimization of bioethanol production from cassava peel using statistical experimental design. Environ. Prog. Sustain. Energy 2015, 34, 567–574. [Google Scholar] [CrossRef]
  31. Yadira, P.-S.B.; Sergio, S.-T.; Fernando, S.E.L.; Sebastian, P.J.; Eapen, D. Bioethanol production from coffee mucilage. Energy Procedia 2014, 57, 950–956. [Google Scholar] [CrossRef]
Figure 1. Predicted versus experimental of reducing sugar concentration.
Energies 10 00035 g001
Figure 2. Three-dimensional surface plot of reducing sugar concentration for: (a) substrate loading and stroke speed; (b) substrate loading and α-amylase concentration; (c) substrate loading and amyloglucosidase concentration; (d) α-amylase concentration and stroke speed; (e) amyloglucosidase concentration; and stroke speed; and (f) amyloglucosidase concentration and α-amylase concentration
Energies 10 00035 g002
Figure 3. Ethanol and reducing sugar concentration versus fermentation time with Saccharomyces cerevisiae (S. cerevisiae).
Energies 10 00035 g003
Figure 4. Fitting of modified Gompertz model to the experimental data for M. glaziovii ethanol production.
Energies 10 00035 g004
Figure 5. Fourier transform infrared spectrum of M. glaziovii bioethanol.
Energies 10 00035 g005
Table 1. Coded levels of the independent variables used for hydrolysis of Manihot glaziovii (M. glaziovii) starch.
ParameterUnitRange and Levels
−10+1
Substrate loading (X1)% (w/v)1017.525
α-amylase concentration (X2)U/g90100110
Amyloglucosidase concentration (X3)U/mL365166
Stroke speed (X4)spm5090130
Table 2. List of equipment used to analyse the properties of the M. glaziovii bioethanol. CHN: carbon, hydrogen, nitrogen.
PropertyEquipmentStandard Method [9,26]
Kinematic viscosityLovis 2000 M/ME micro viscometer and micro density meter (Anton Paar)DIN 53015
DensityISO 12058
Elemental analysis for carbon (C), hydrogen (H) and oxygen (O)CE-440 CHN Elemental Analyzer (EIA)ASTM D5291
Calorific valueIKA C2000 basic, automatic bomb calorimeterASTM D240
Ethanol contentGas chromatograph, Agilent 7890AASTM D4806
Table 3. The substrate components of M. glaziovii.
ParameterUnitM. glaziovii
carbohydrateswt %74.8
proteinswt %6.62
lipidswt %3.12
Ashwt %5.15
fiberswt %1.70
moisture contentwt %8.61
Table 4. Analysis of variance (ANOVA) results for the starch hydrolysis process. C.V.: coefficient of variation.
SourceSum of SquaresdfMean SquareF Valuep-Value Prob > FRemarks
Model28,689.87142049.28115.29<0.0001significant
A-Substrate loading (X1)22,057.47122,057.471240.98<0.0001-
B-α-amylase (X2)2041.0212041.02114.83<0.0001-
C-Amyloglucosidase (X3)2528.5112528.51142.26<0.0001-
D-Stroke speed (X4)91.69191.695.160.0394-
AB39.38139.382.220.1588-
AC7.5417.540.420.5255-
AD1.3711.370.0770.7854-
BC16.61116.610.930.3502-
BD92.54192.545.210.0387-
CD124.211124.216.990.0193-
A21498.911498.984.33<0.0001-
B2348.881348.8819.630.0006-
C214.11114.110.790.3879-
D212.09112.090.680.4234-
Residual248.841417.77---
Lack of Fit231.661023.175.390.0593not significant
Pure Error17.1844.3---
Cor Total28,938.7128----
R-Squared0.9914-Adj R-Squared a0.9828--
C.V. b %3.05-----
Notes: a Adjusted R2; b Coefficient of variation.
Table 5. Box-Behnken experimental design for the starch hydrolysis process.
Sample NoSubstrate Loading (% w/v) (X1)α-Amylase Concentration (U/g) (X2)Amyloglucosidase Concentration (U/mL) (X3)Stroke Speed (spm) (X4)Reducing Sugar (g/L)
ExperimentPredicted
125905190153.84152.78
210100369078.8475.92
3101005113088.4891.36
417.5903690110.68114.29
52510051130180.52178.27
617.51003650138.46134.07
717.51105150160.28155.00
817.51005190149.64148.62
917.510066130164.94168.63
1017.51006650150.48151.96
11251005150170.28171.57
1217.510036130130.63128.45
1317.5905150118.82119.30
1417.51106690168.84169.40
1517.59051130132.64134.45
1617.51005190148.58148.62
1717.51005190145.24148.62
1810110519092.7593.11
19251003690158.85158.92
2017.51005190150.78148.62
2117.51005190148.84148.62
2217.511051130154.86150.91
23251105190182.64185.13
24251006690191.25190.70
2517.51103690130.49136.30
2617.5906690140.88139.24
2710100515080.5887.00
281090519076.573.30
29101006690105.75102.21
Table 6. Comparison of the properties of M. glaziovii bioethanol, gasoline and ethanol.
Fuel PropertiesM. glaziovii BioethanolGasoline [26]Ethanol ASTM D4806 [26]
FormulaC2H5OHC5–C12C2H5OH
Carbon-fraction56.185–8852.2
Hydrogen-fraction12.512–1513
Oxygen-fraction35.1034.7
C/H (atom ratio)0.370.560.33
Viscosity at 20 °C (mm/s2)1.280.5–0.61.2–1.5
Density at 15 °C (kg/m3)803.7750–765785–809.9
Higher heating value (MJ/kg)30.2647.3029.7
Lower heating value MJ/kg28.984426.9
Ethanol content (%vol. min)95.692.1

