
Analysis on Filling Ratio and Shield Supporting Pressure for Overburden Movement Control in Coal Mining with Compacted Backfilling


Abstract
:1. Introduction
2. Comparison of Overburden Deformational Characteristics between Traditional Caving Method and Coal Mining with Compacted Backfilling (CMCB) Method
2.1. Overburden Deformational Characteristics in Traditional Caving Method
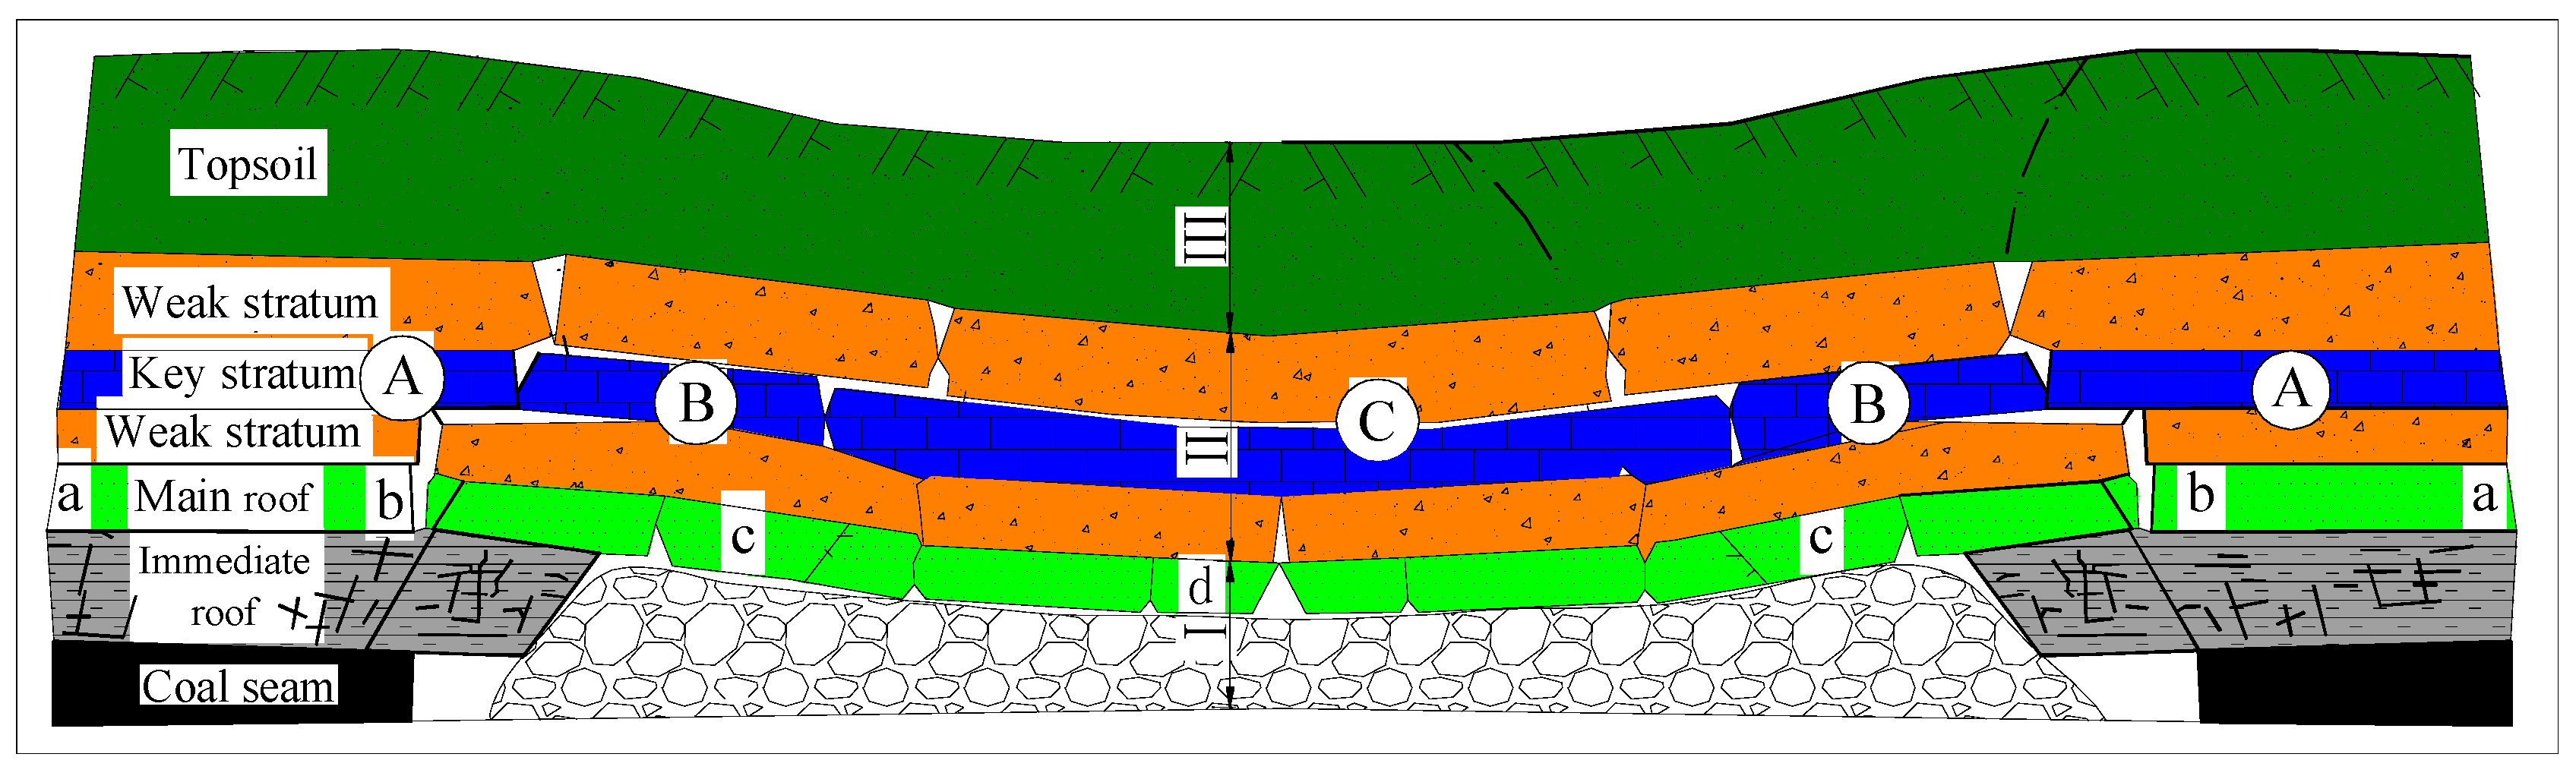
2.2. Overburden Deformation Characteristics in Coal Mining with Compacted Backfilling (CMCB) Method
3. Establishment and Solving of Elastic-Thin-Plate Mechanical Model of Overburden in CMCB
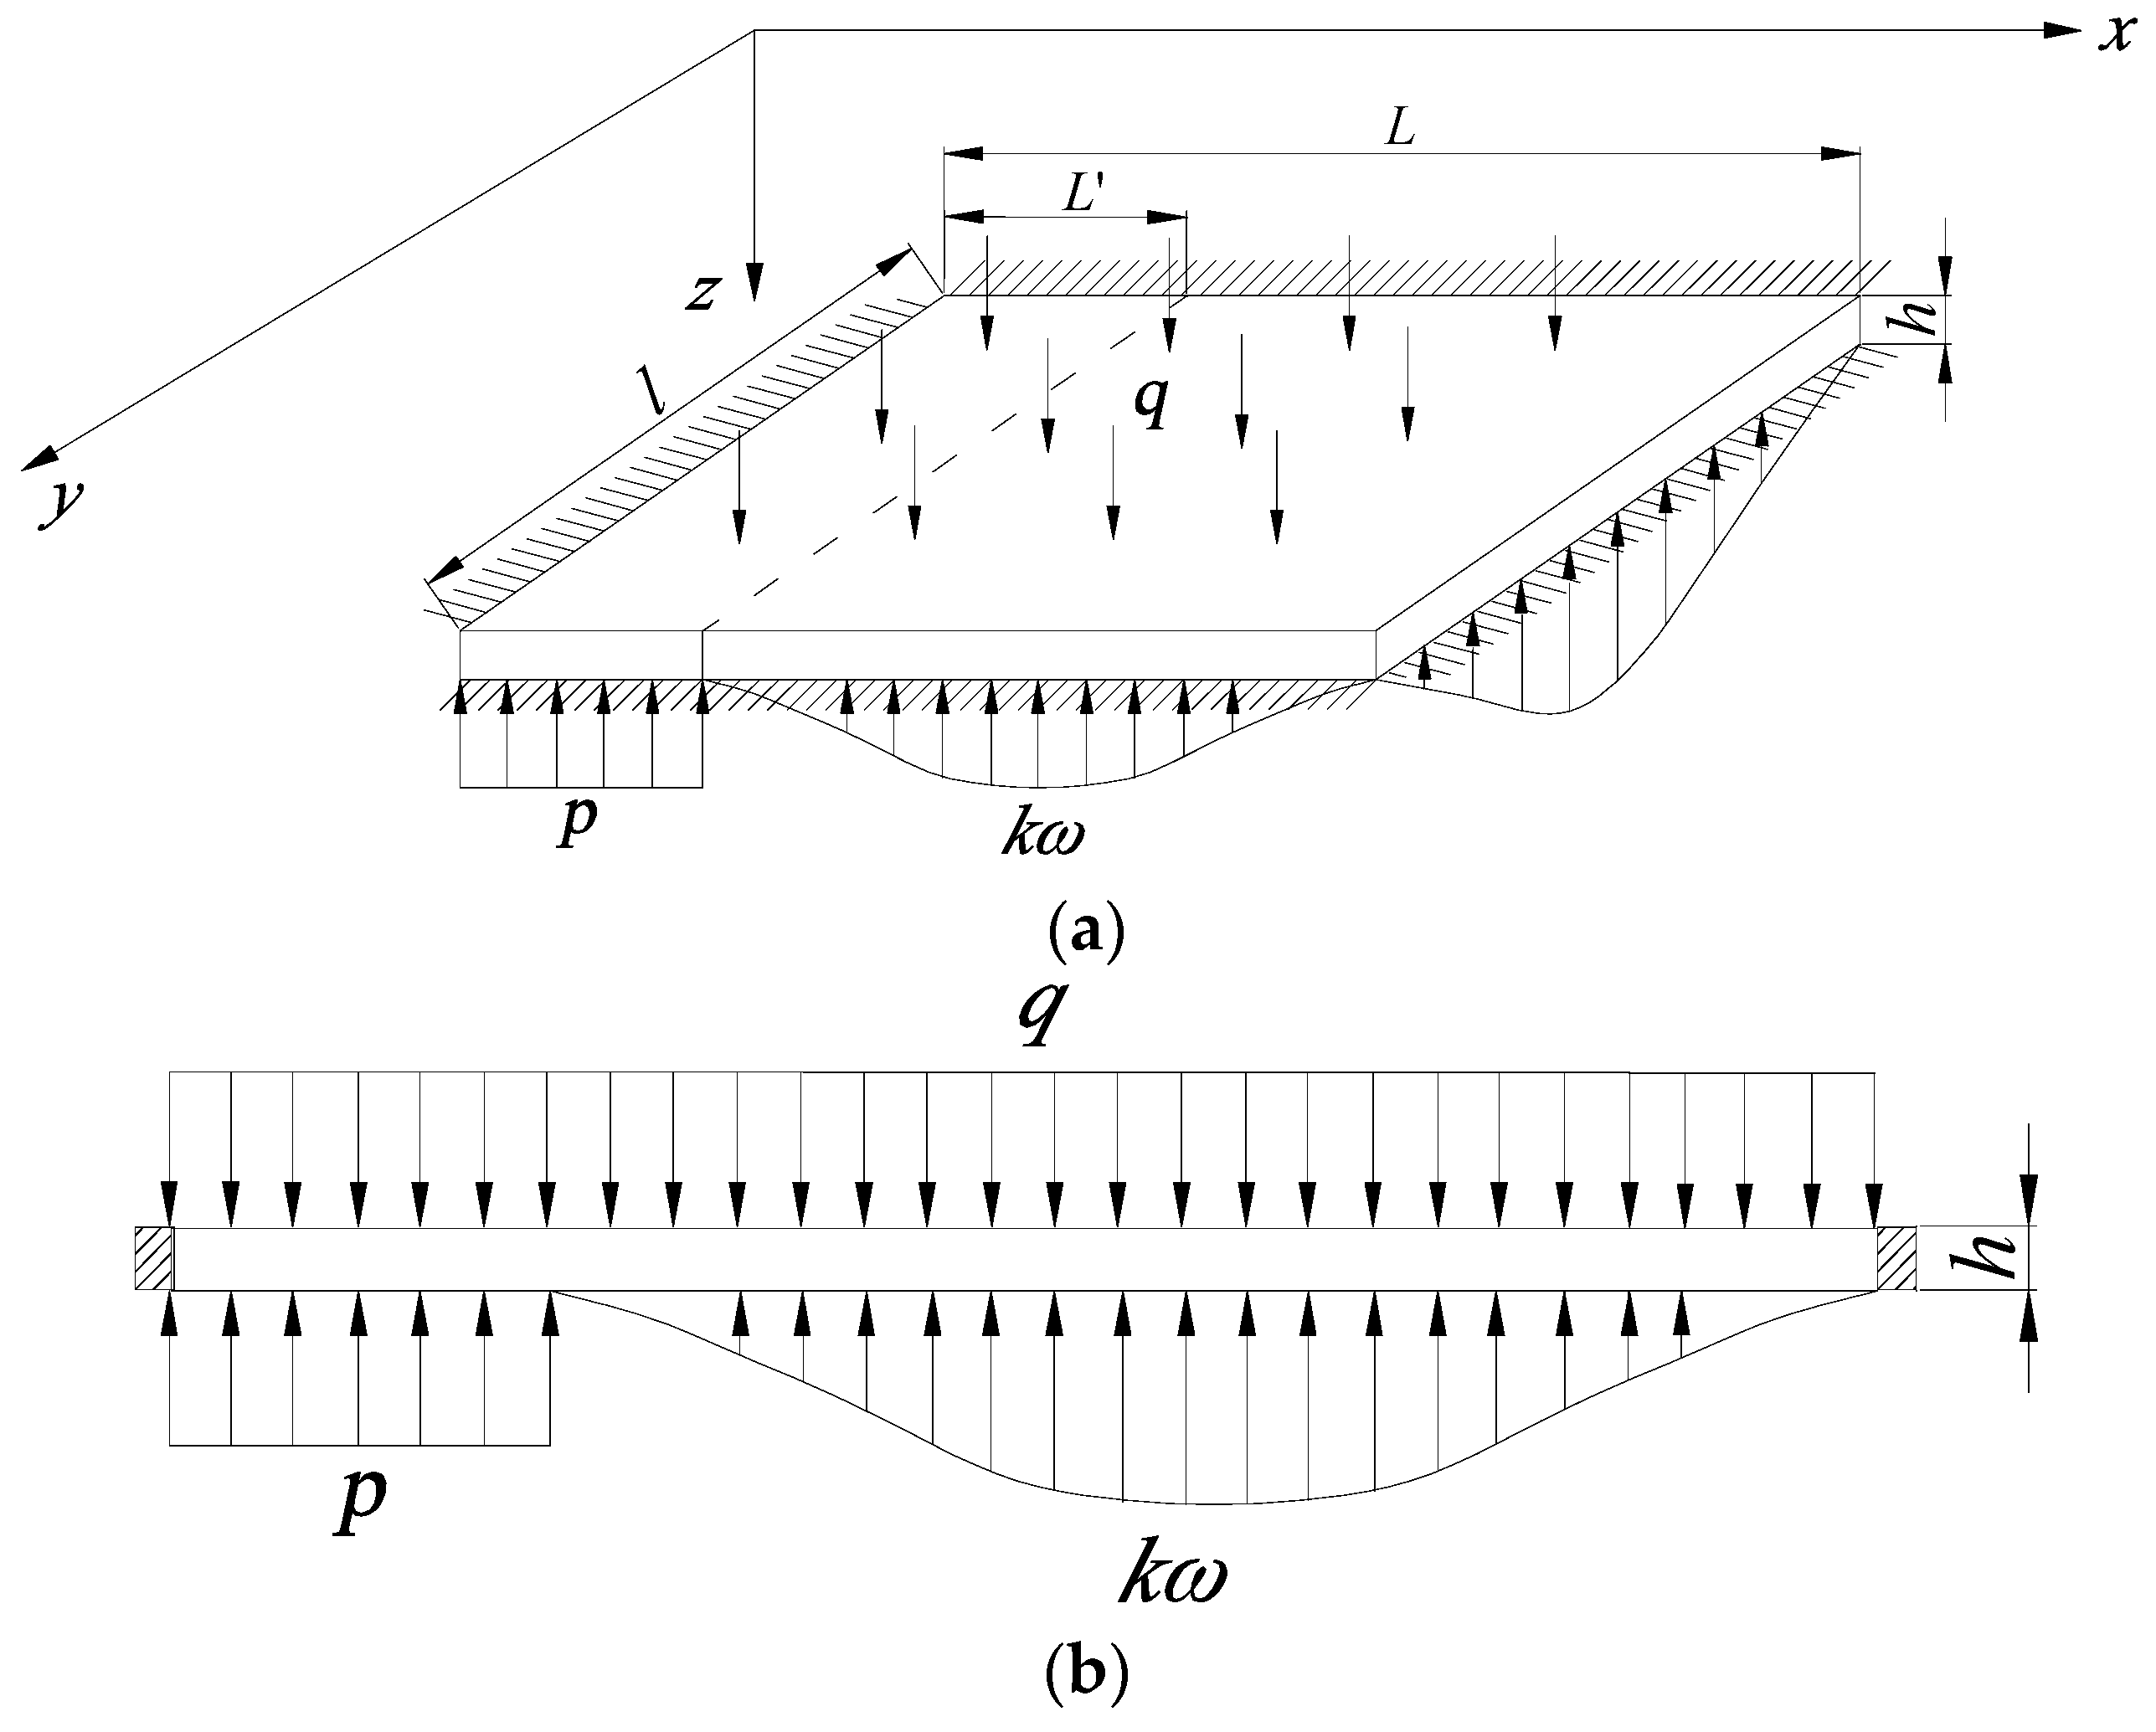
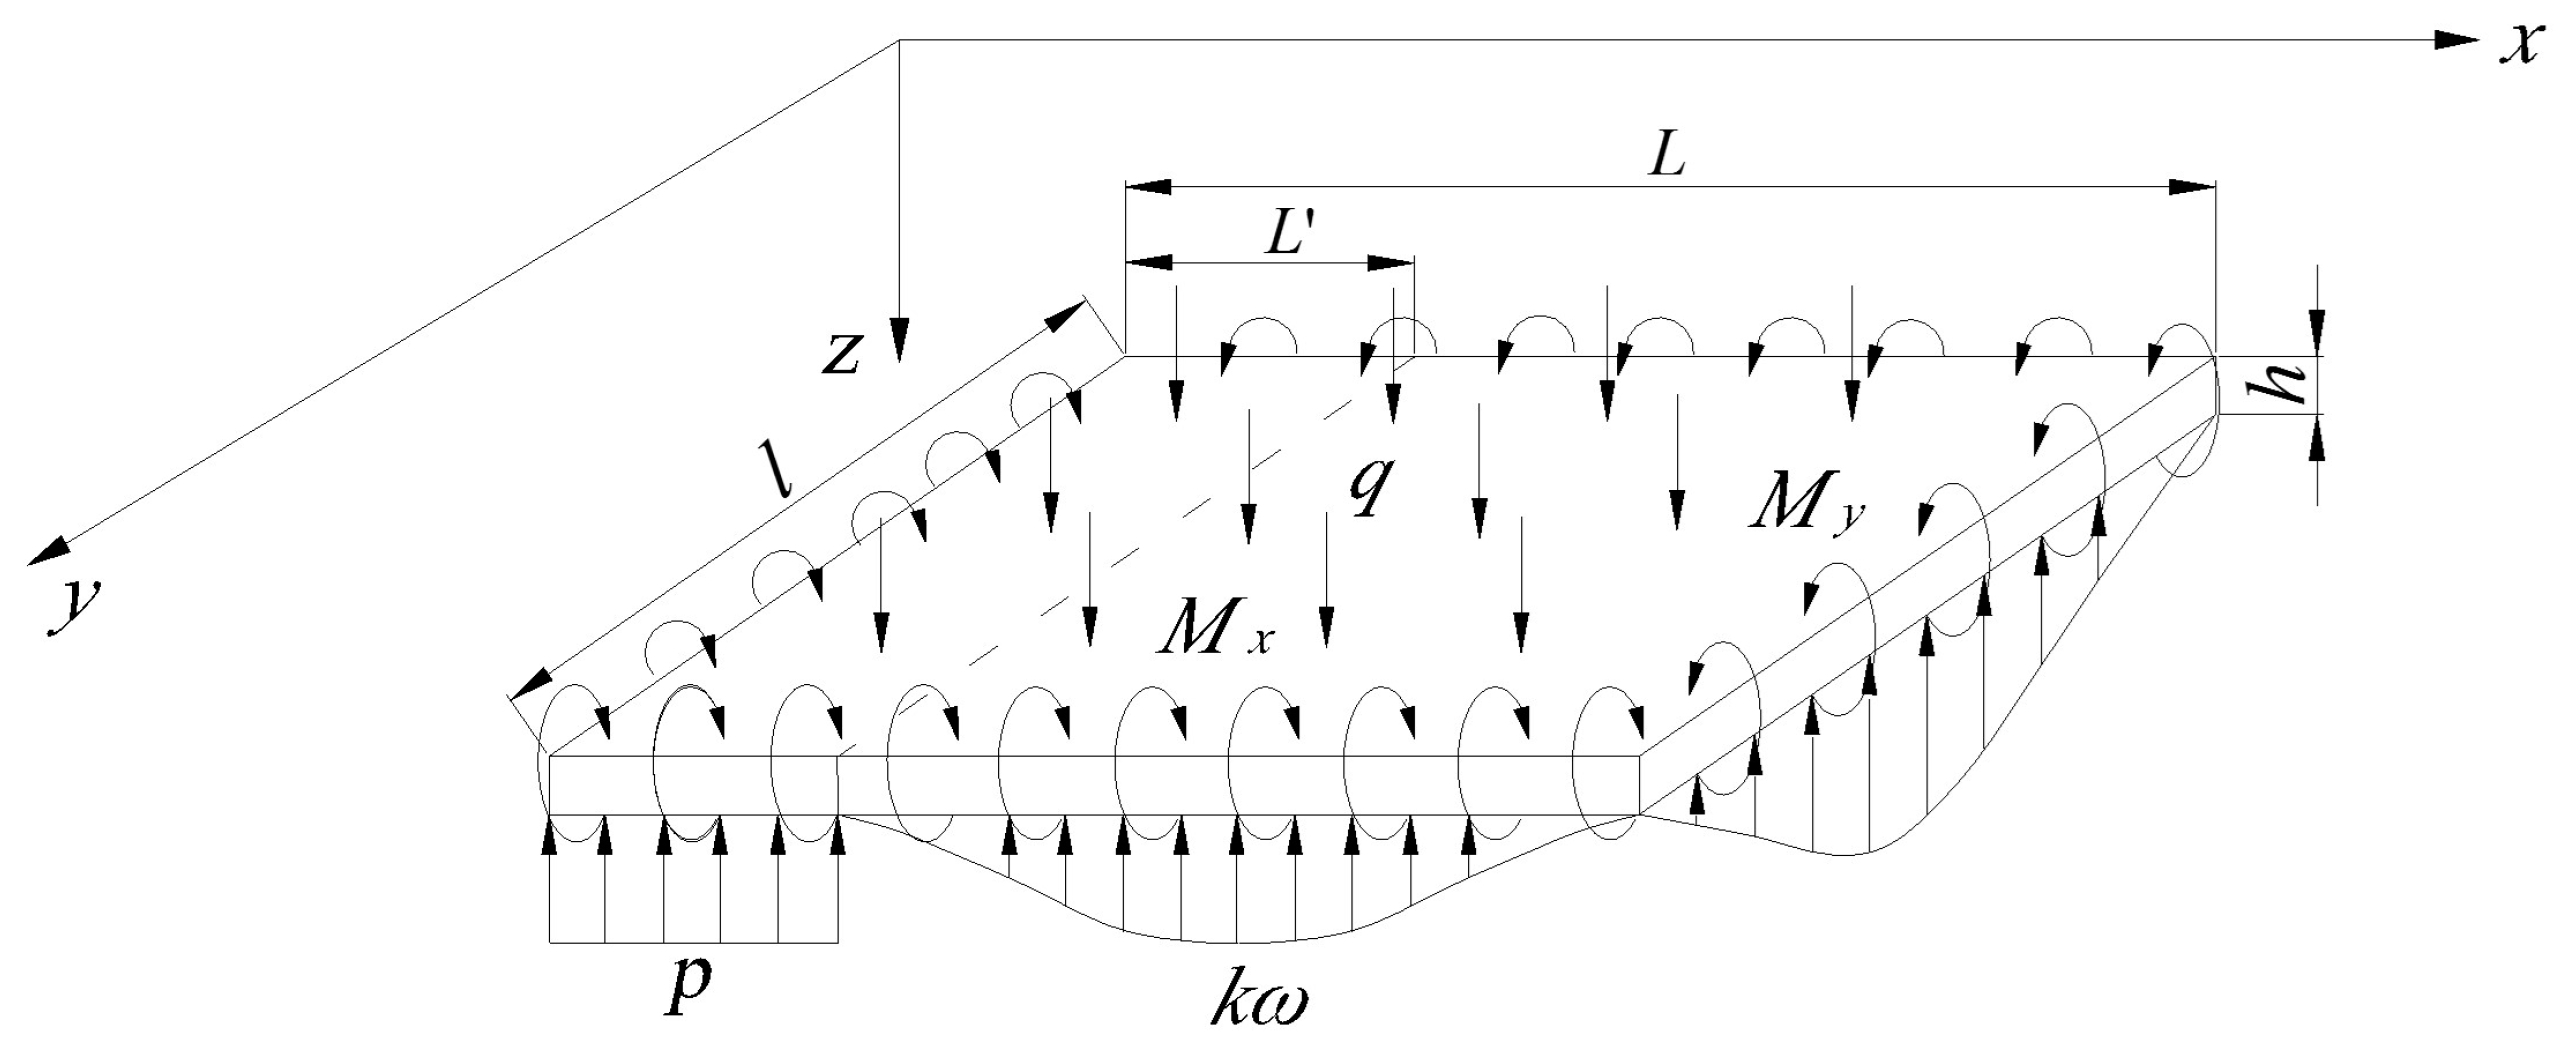
3.1. Establishment of Elastic-Thin-Plate Mechanical Model of Overburden Strata Movement in CMCB
3.2. Solving of the Elastic-Thin-Plate Model
3.3. Critical Conditions of Main Roof Failure
3.4. Application of Analysis Result on an Actual Case
- (1)
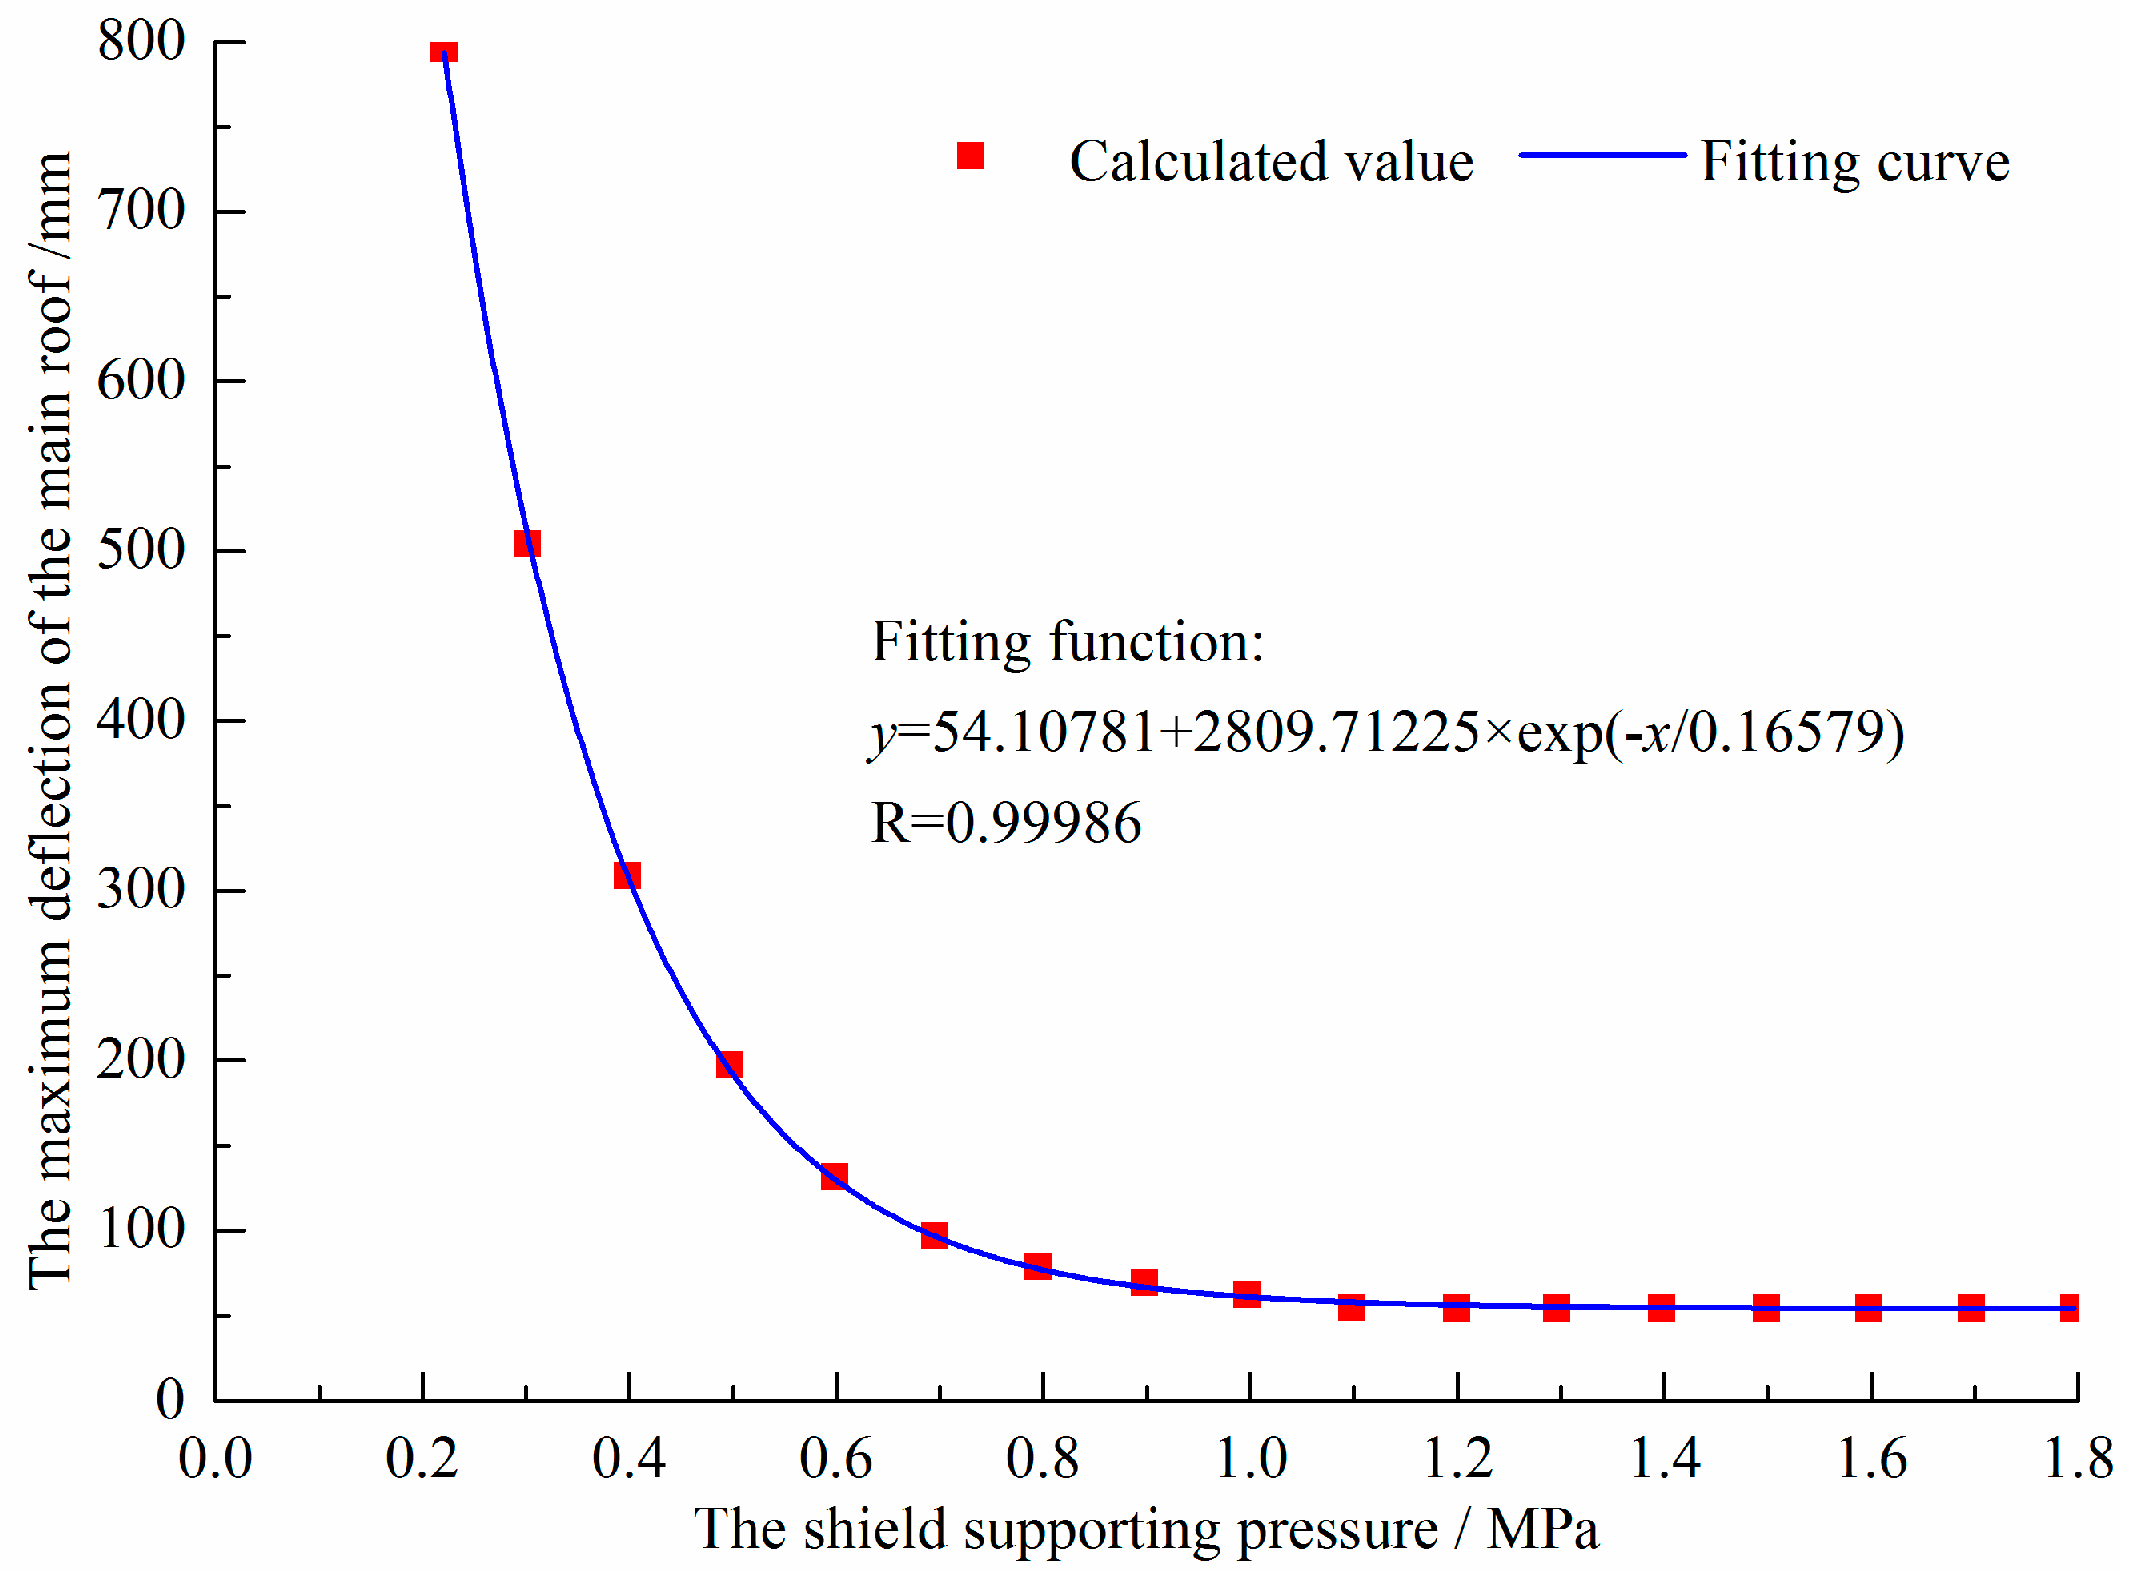
- When the filling ratio of the gob was constant, the relationship between the maximum deflection of the main roof within shield canopy length before backfilling, and the shield supporting pressure can be represented by a hyperbolic curve, which can be expressed by function y = 54.10781 + 2809.71225 × e−x/0.16579;
- (2)
- The deflection of the main roof within the shield canopy length before backfilling decreases apparently with the increase of the shield supporting pressure. When the shield supporting pressure increases from 0.4 MPa to 0.9 MPa, the deflection of the main roof decreases by 77%, dropping from 350 mm to 80 mm, which would highly increase the backfilling height, and promote the filling ratio to a large extent. While the shield supporting pressure increases from 0.9 MPa to 1.8 MPa (implying high investment of shield), the decrease in roof deflection is relatively small, dropping from 80 mm to 54 mm, indicating a low increase of backfilling height and filling ratio. Based on this observation, it can be concluded that shield supporting pressure has a significant influence on the roof sagging within the shield canopy length, and adversely affect the filling ratio.
4. The Numerical Simulation of the Overburden Movement in CMCB
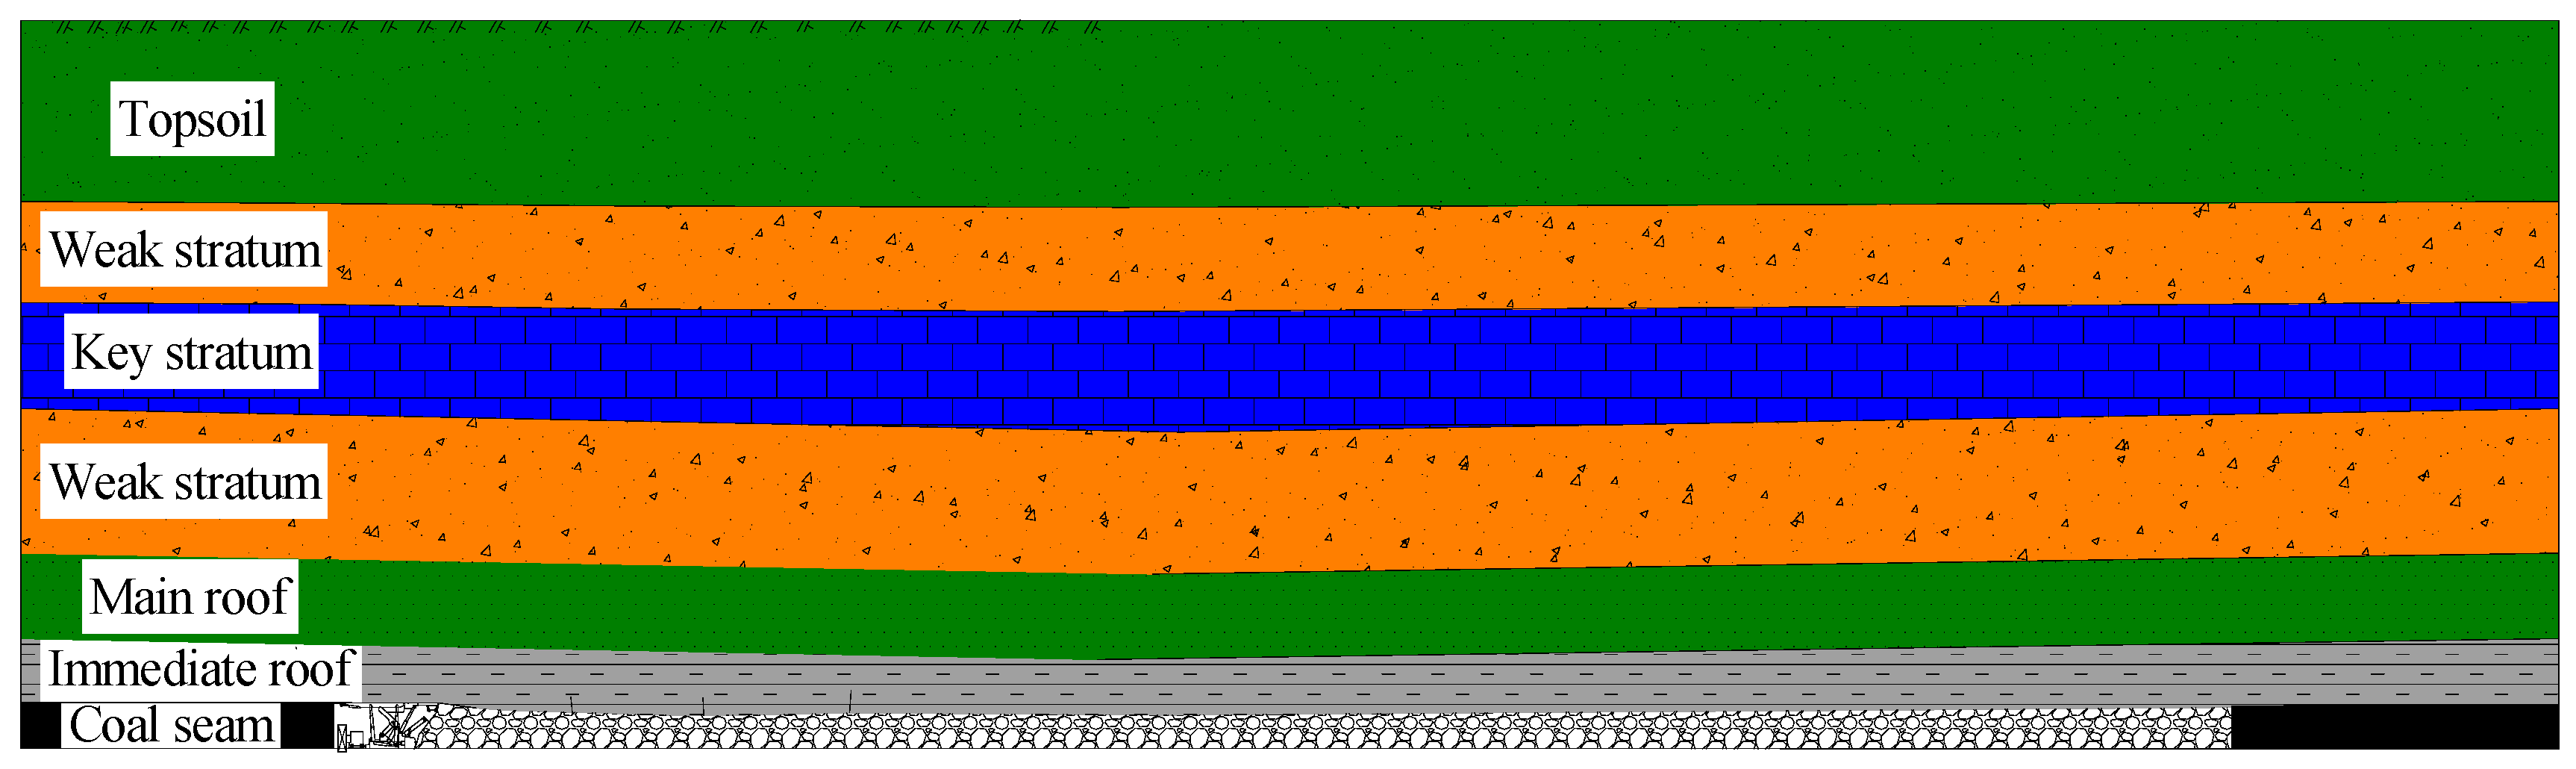
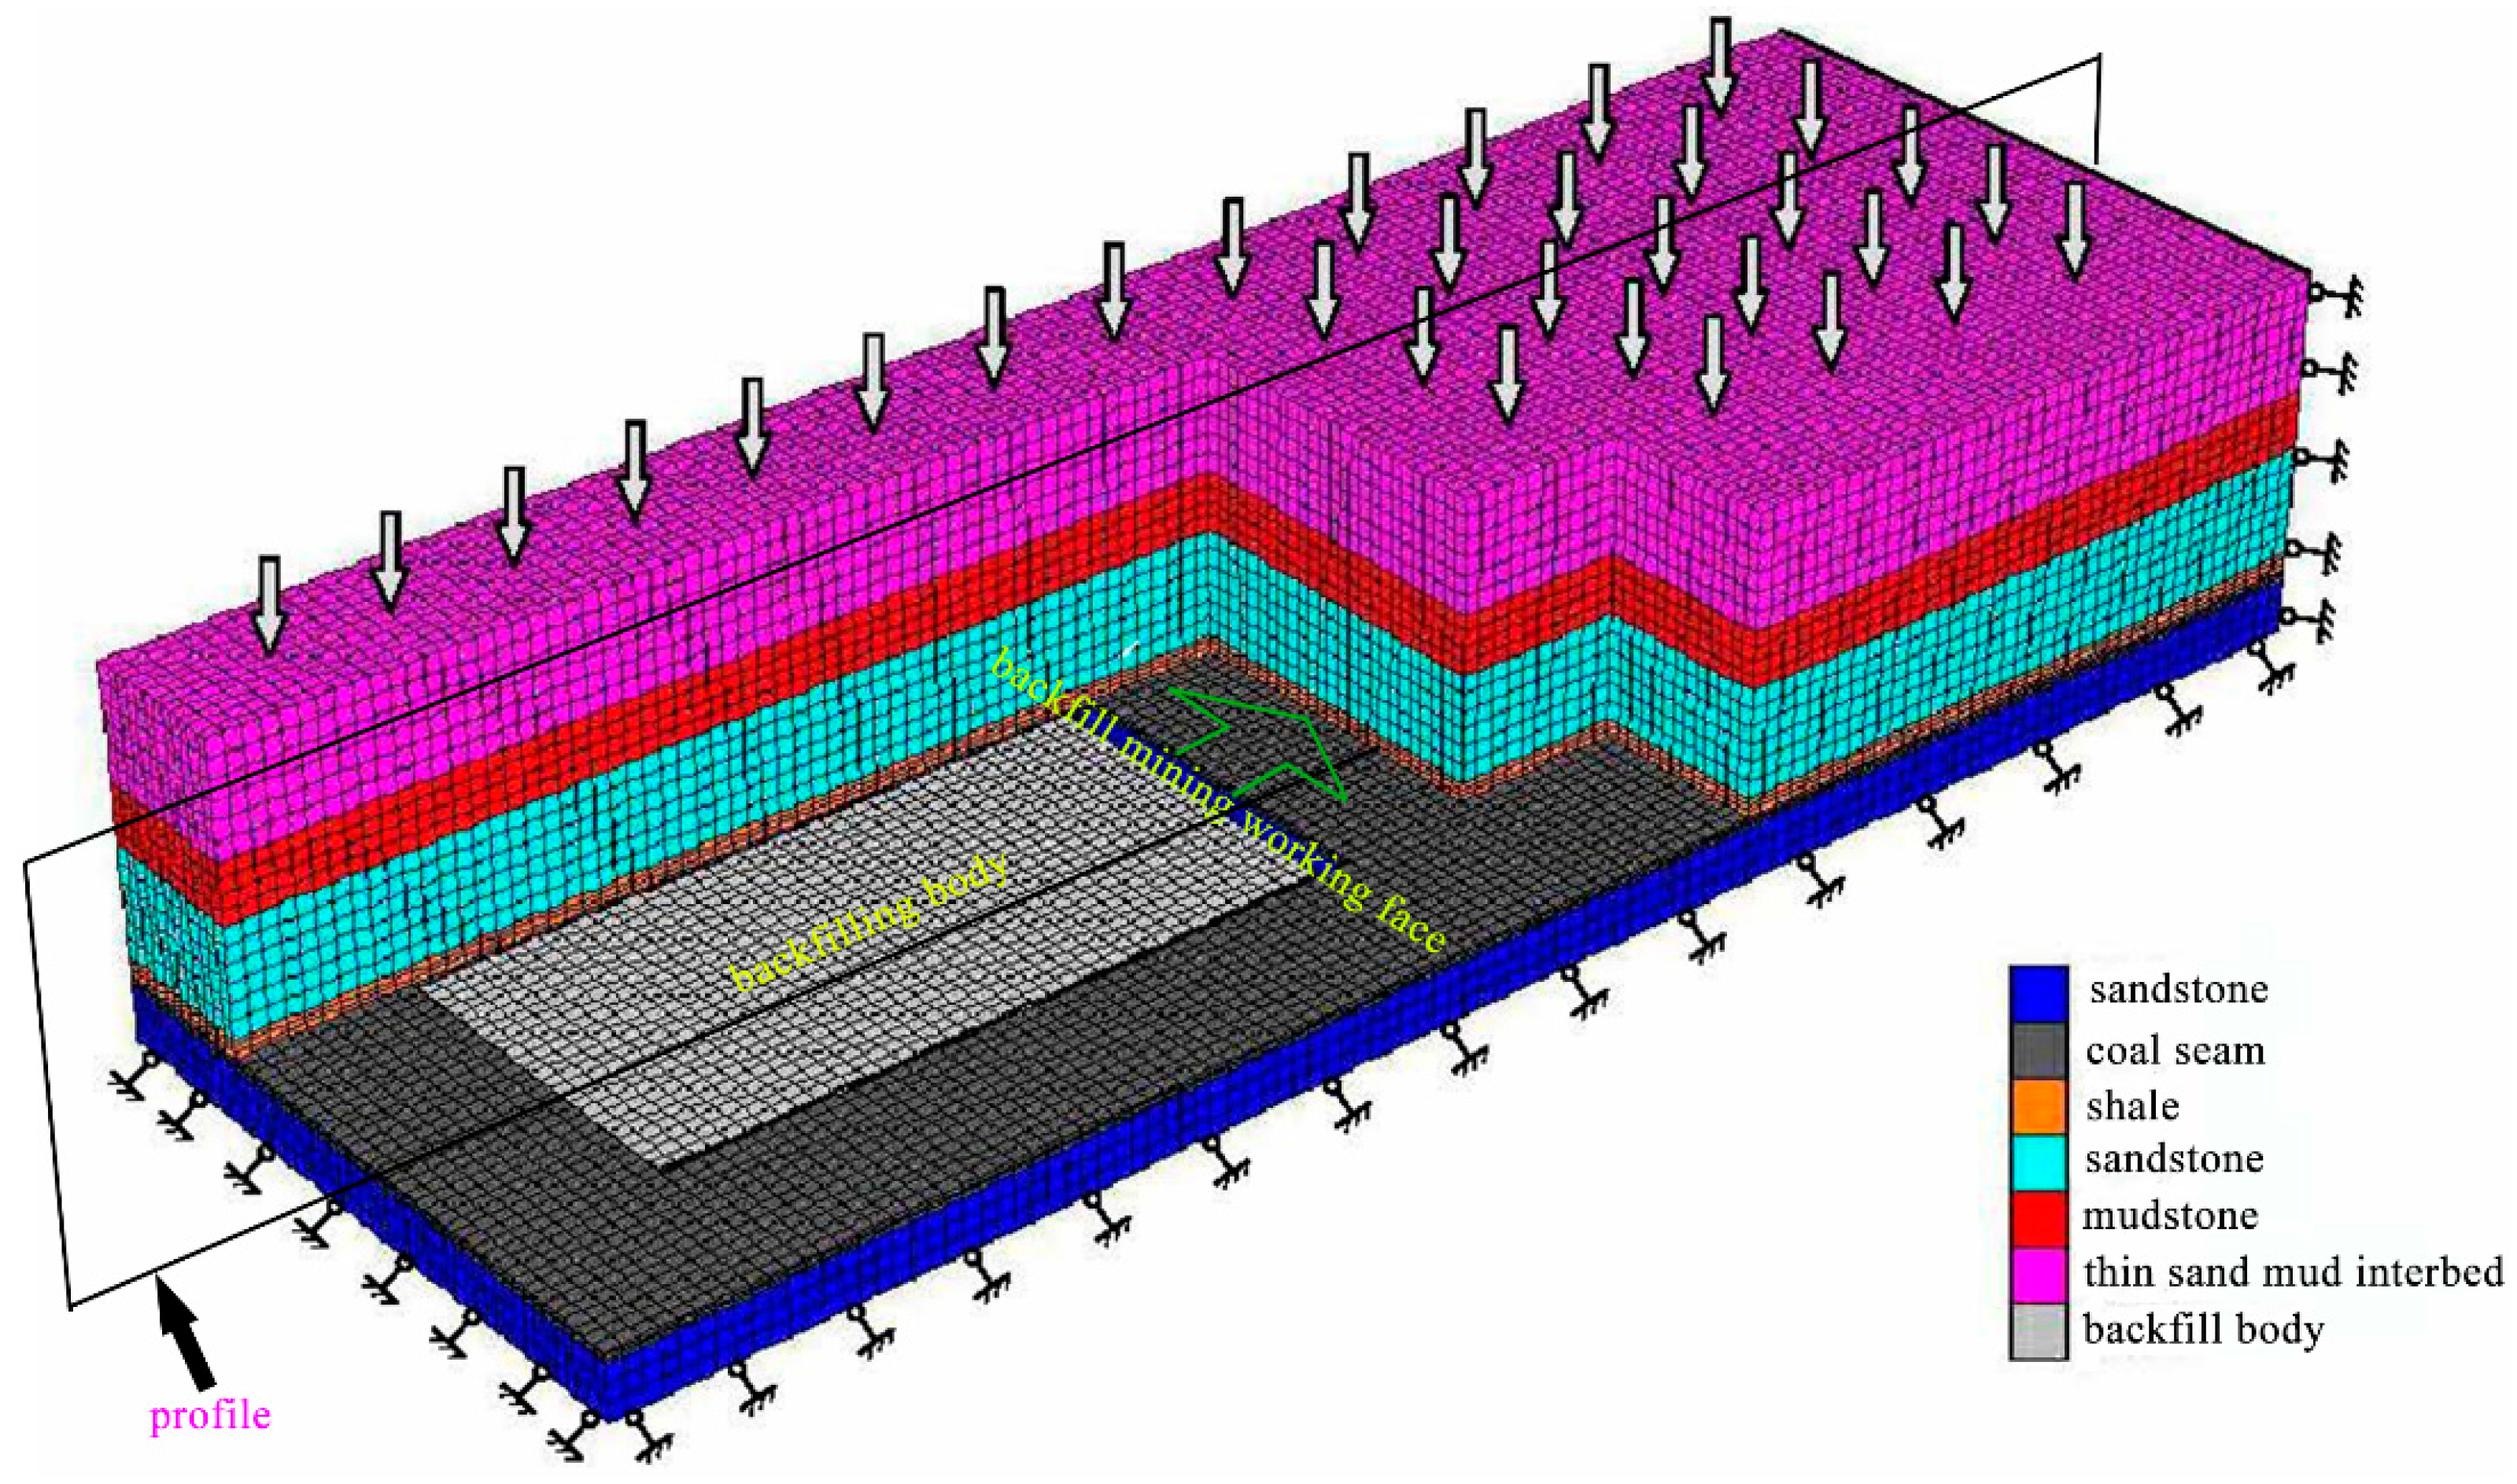
4.1. Establishment of Numerical Model
4.2. Simulation Results and Analysis
4.2.1. Roof Sagging Characteristics under Different Filling Ratios
- (1)
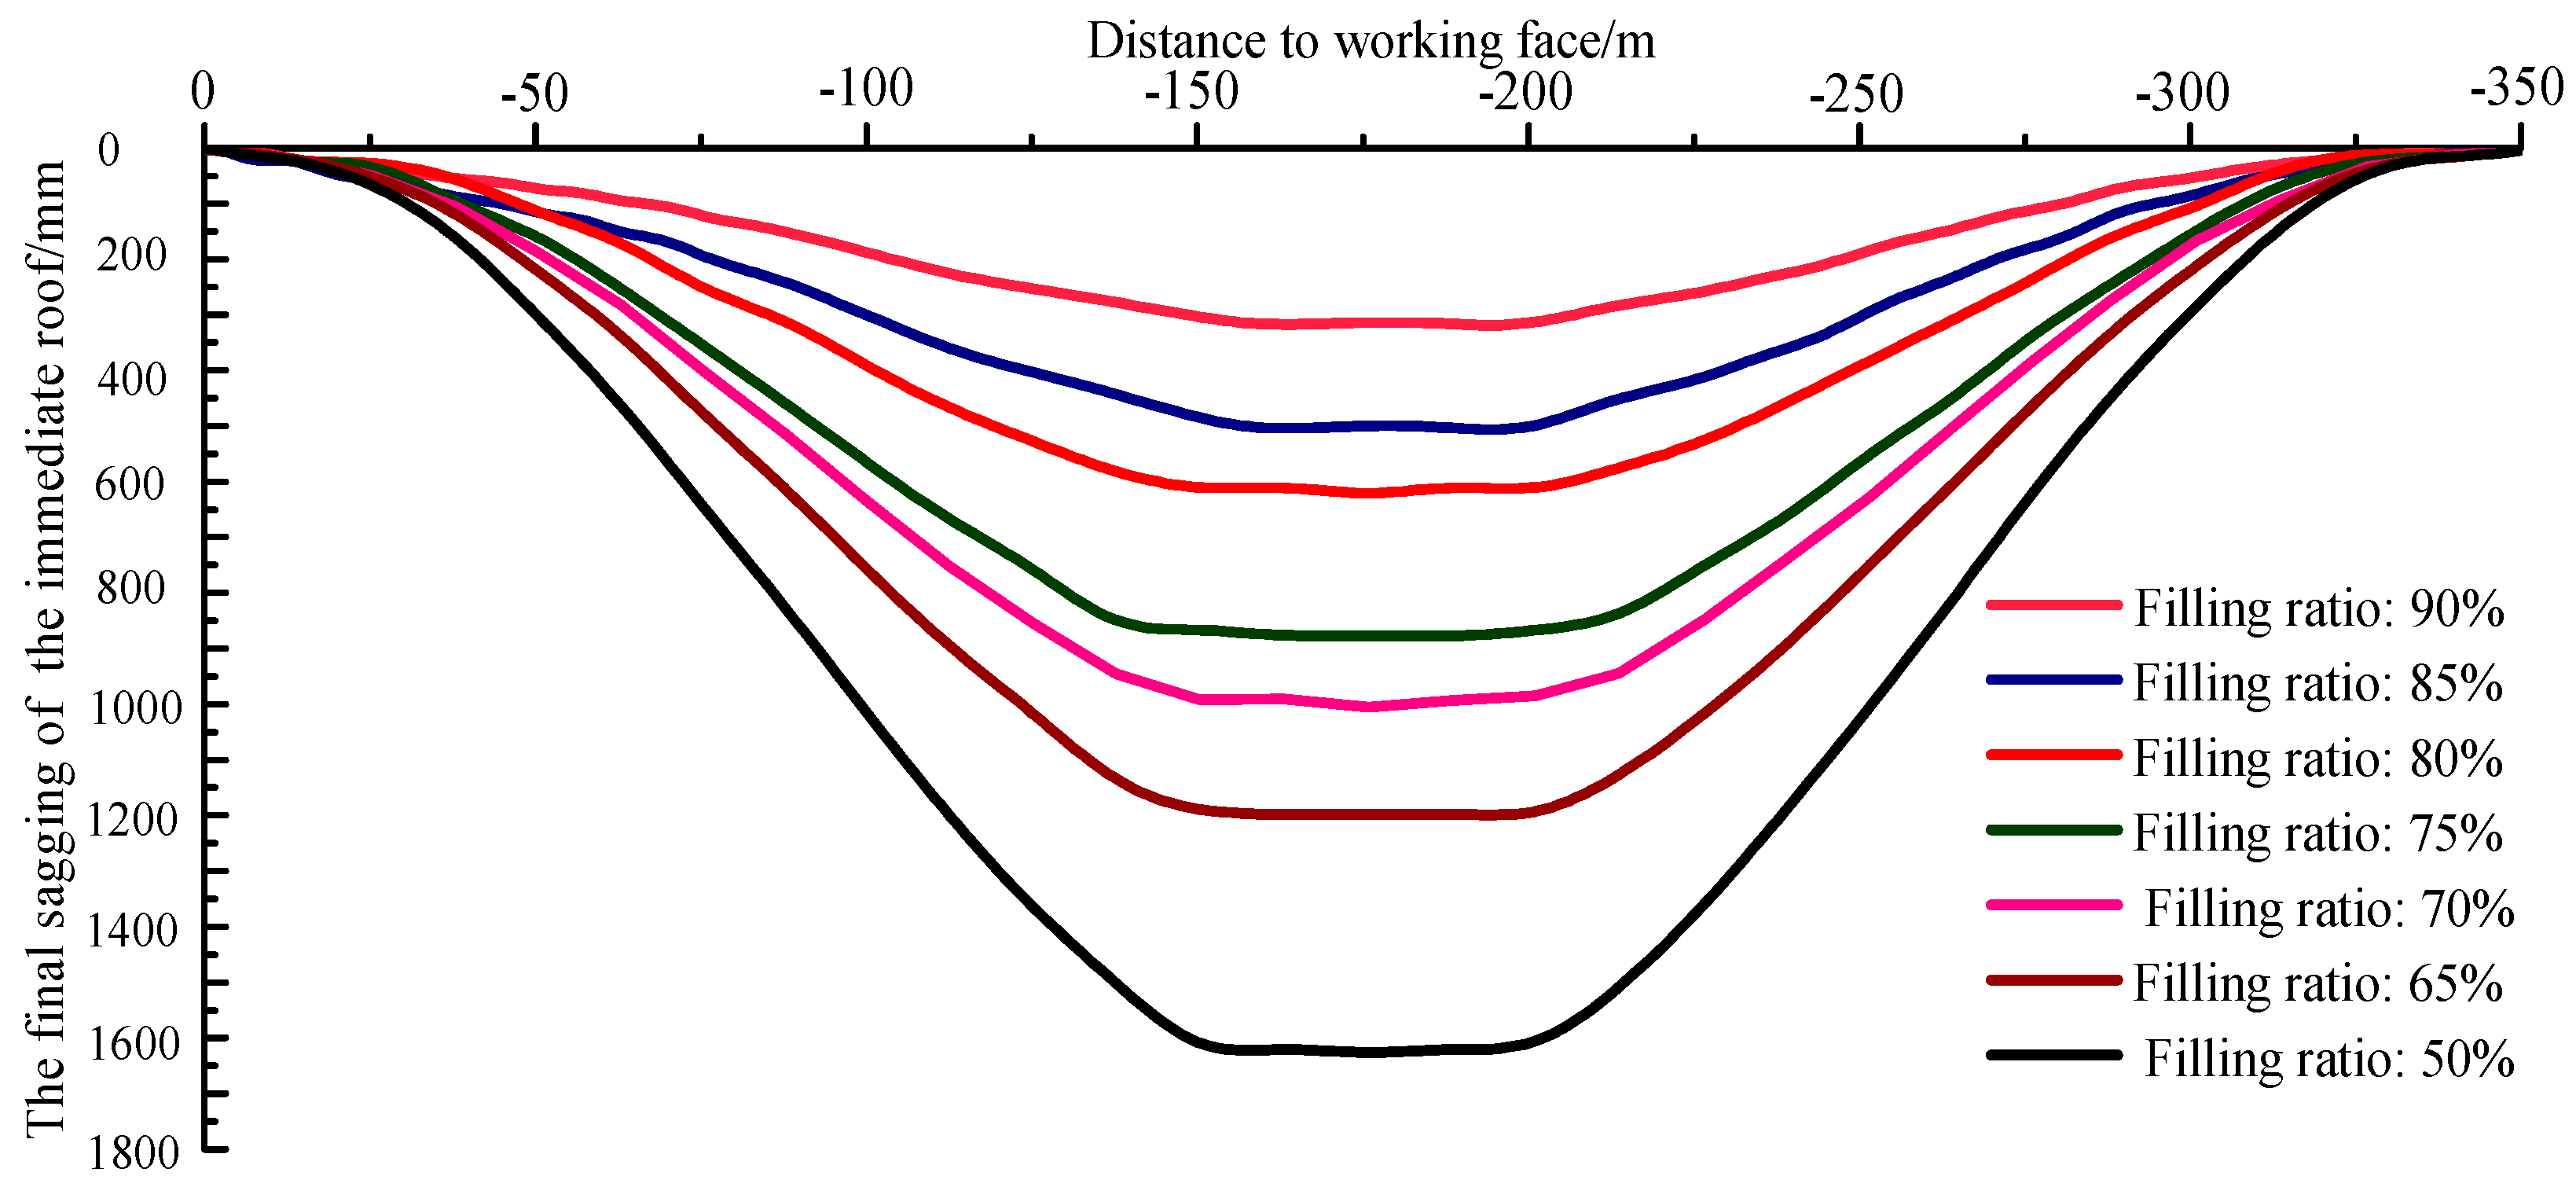
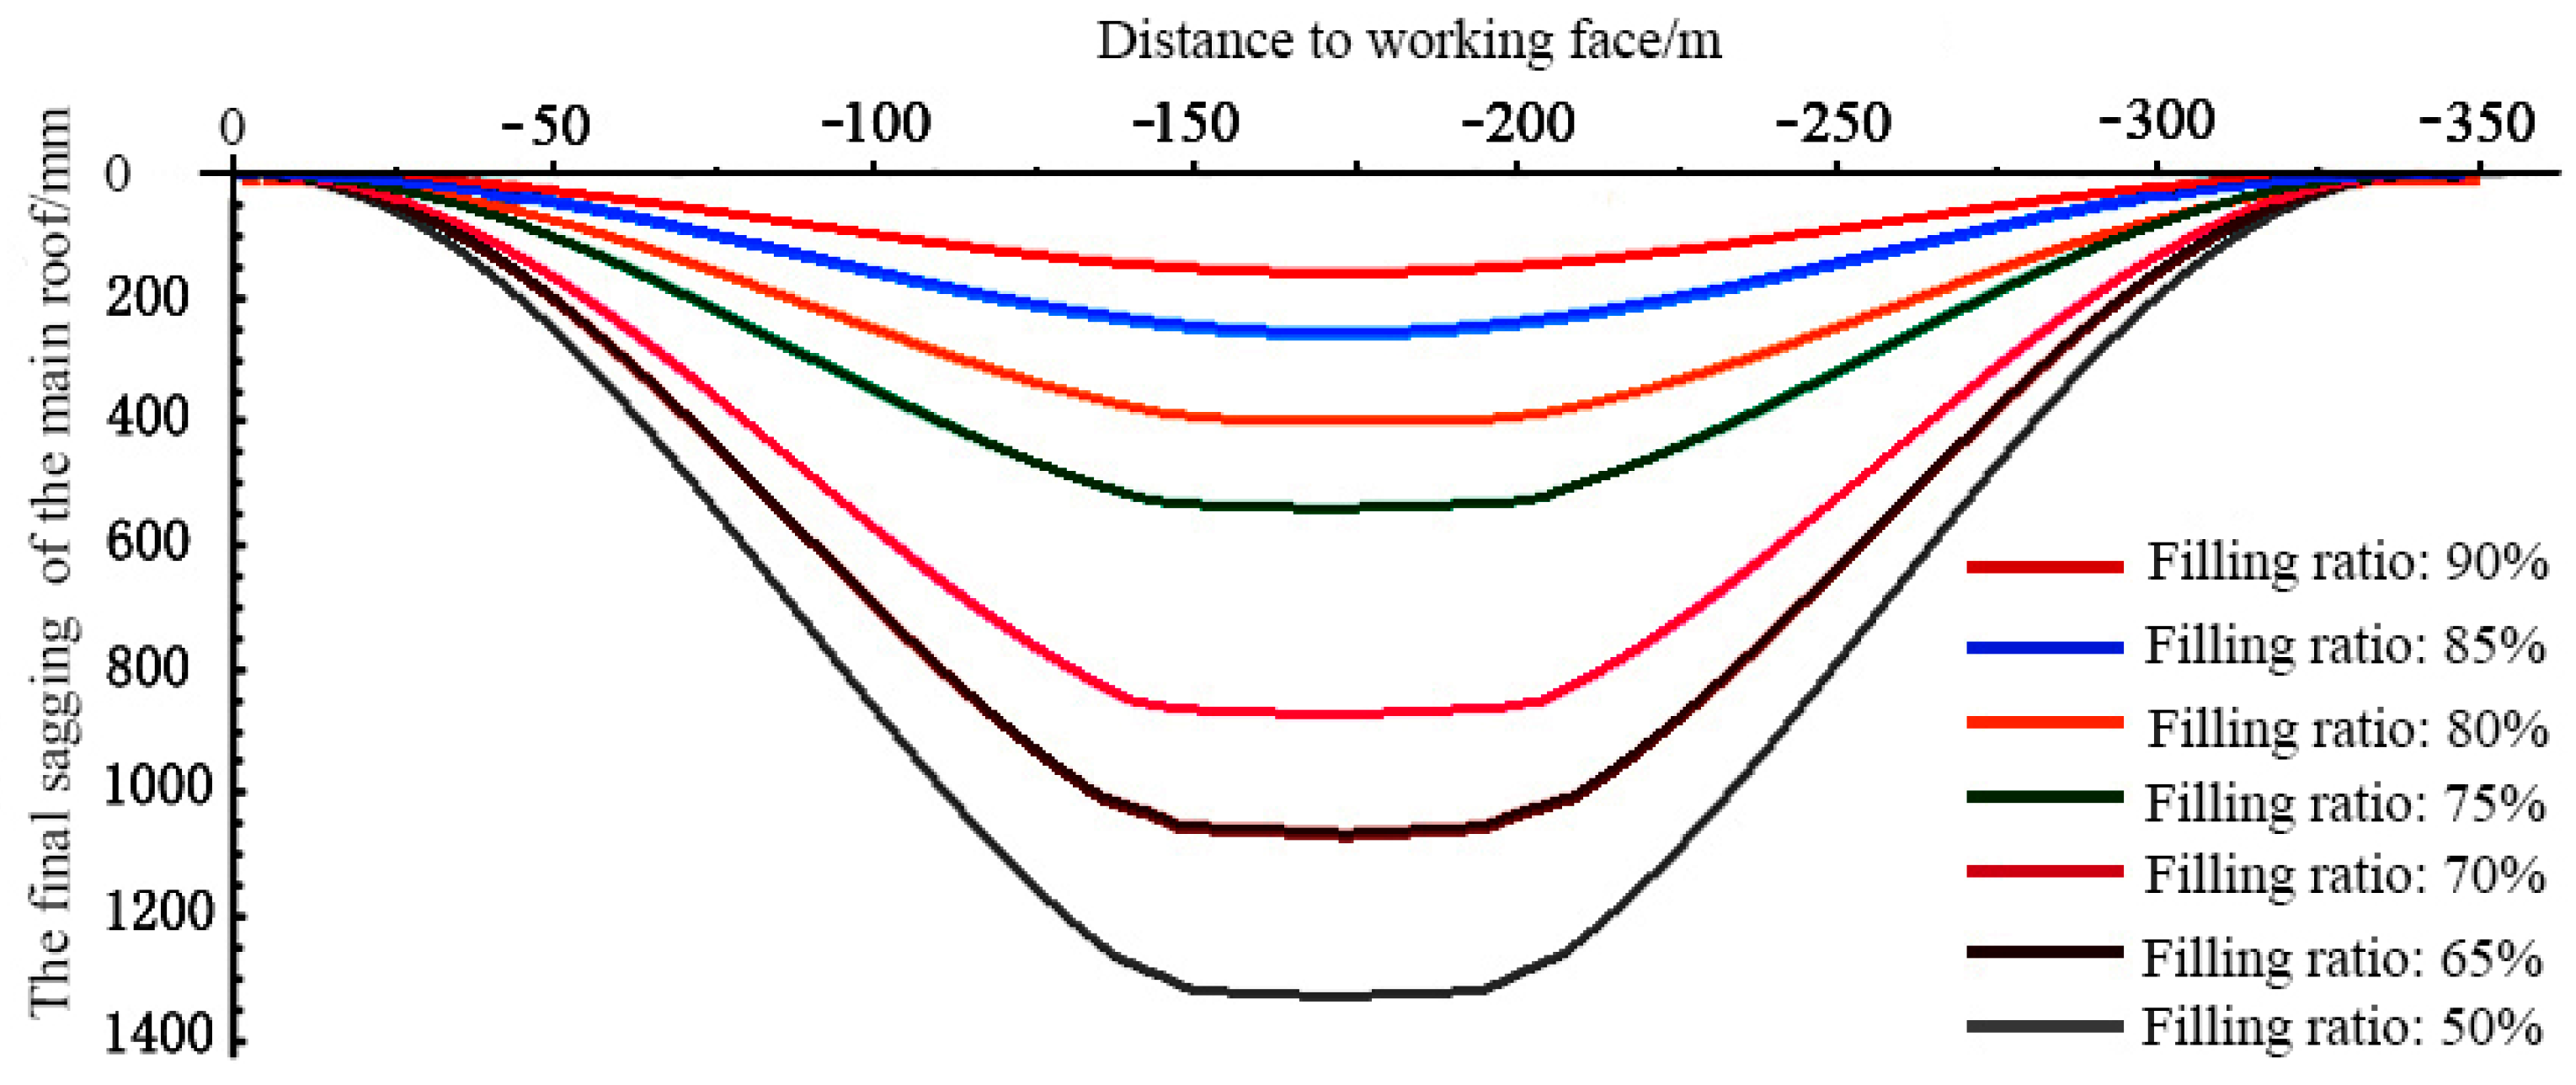
- The final sagging curves of the immediate and main roofs are a bowl shaped along the advancing direction of panel. The maximum sagging of the immediate and main roofs both appeared in the middle of the gob, where the platform area appeared. The final sagging of the immediate and the main roofs gradually decreases from the middle of the gob to the ends and is close to zero at the position of the open-off cut and the stopping line.
- (2)
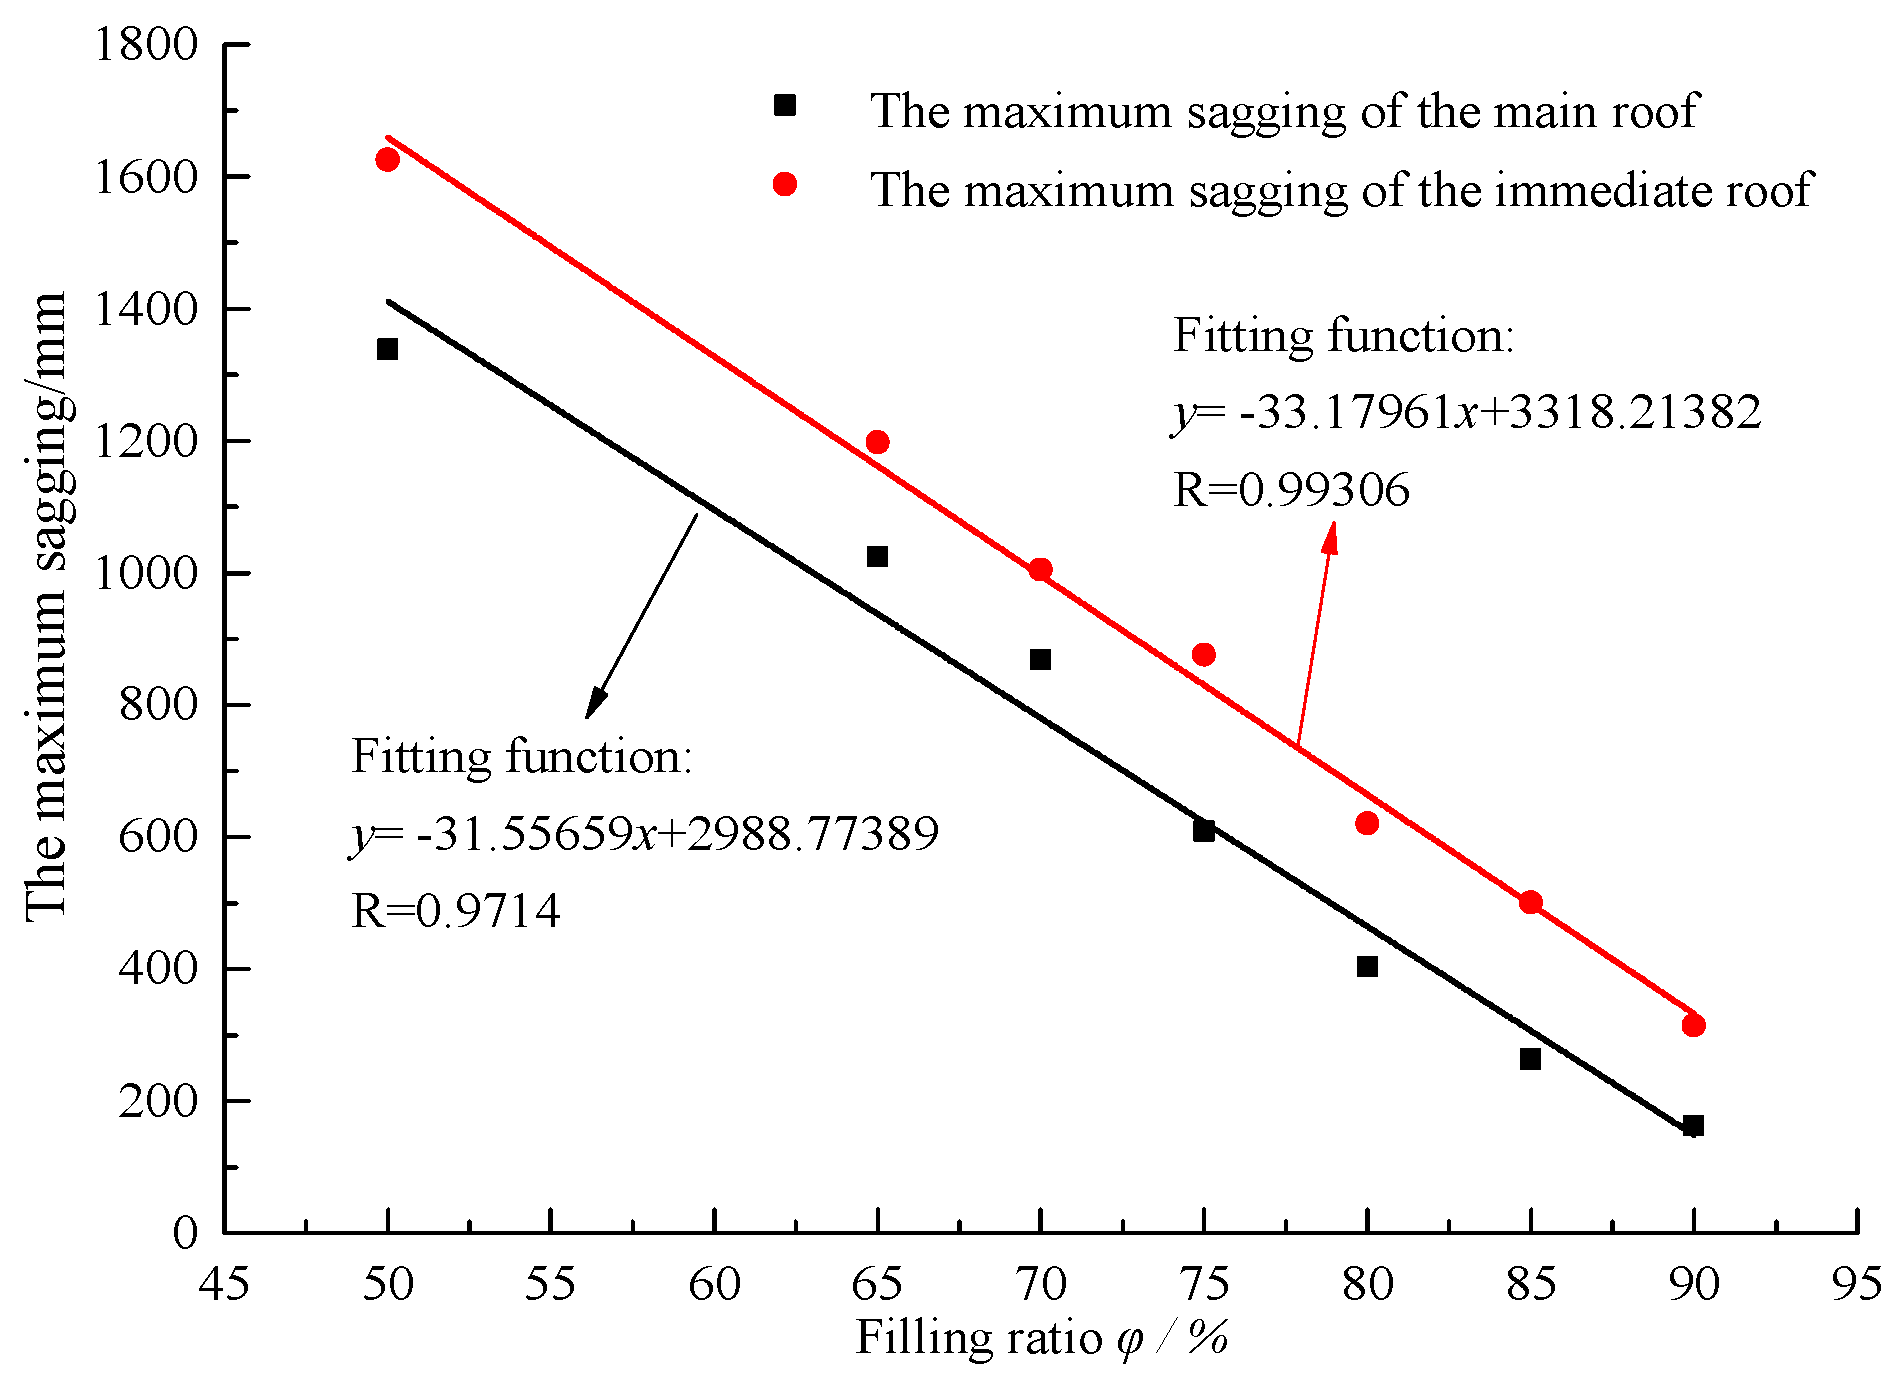
- The maximum sagging of immediate roof decreases with the increase of the filling ratio of gob. When the filling ratio is 50%, 65%, 75%, 85%, 90%, the maximum sagging of immediate roof is 1625 mm, 1198 mm, 876 mm, 501 mm, 315 mm, respectively.
- (3)
- The maximum sagging of main roof decreases with the increase of the filling ratio of the gob. When the filling ratio is 50%, 65%, 75%, 85%, 90%, the maximum sagging of main roof is 1338 mm, 1023 mm, 609 mm, 263 mm, 163 mm, respectively. When the filling ratio increased from 75% to 85%, the maximum sagging is severely decreased from 609 mm to 263 mm. It concludes that the main roof could remain continuously deformed without breaking when the filling ratio is above 85%, which is consistent with the elastic-thin-plate model.
4.2.2. Distributions of Abutment Pressure and Backfill Body Internal Pressure under Different Filling Ratios
- (a)
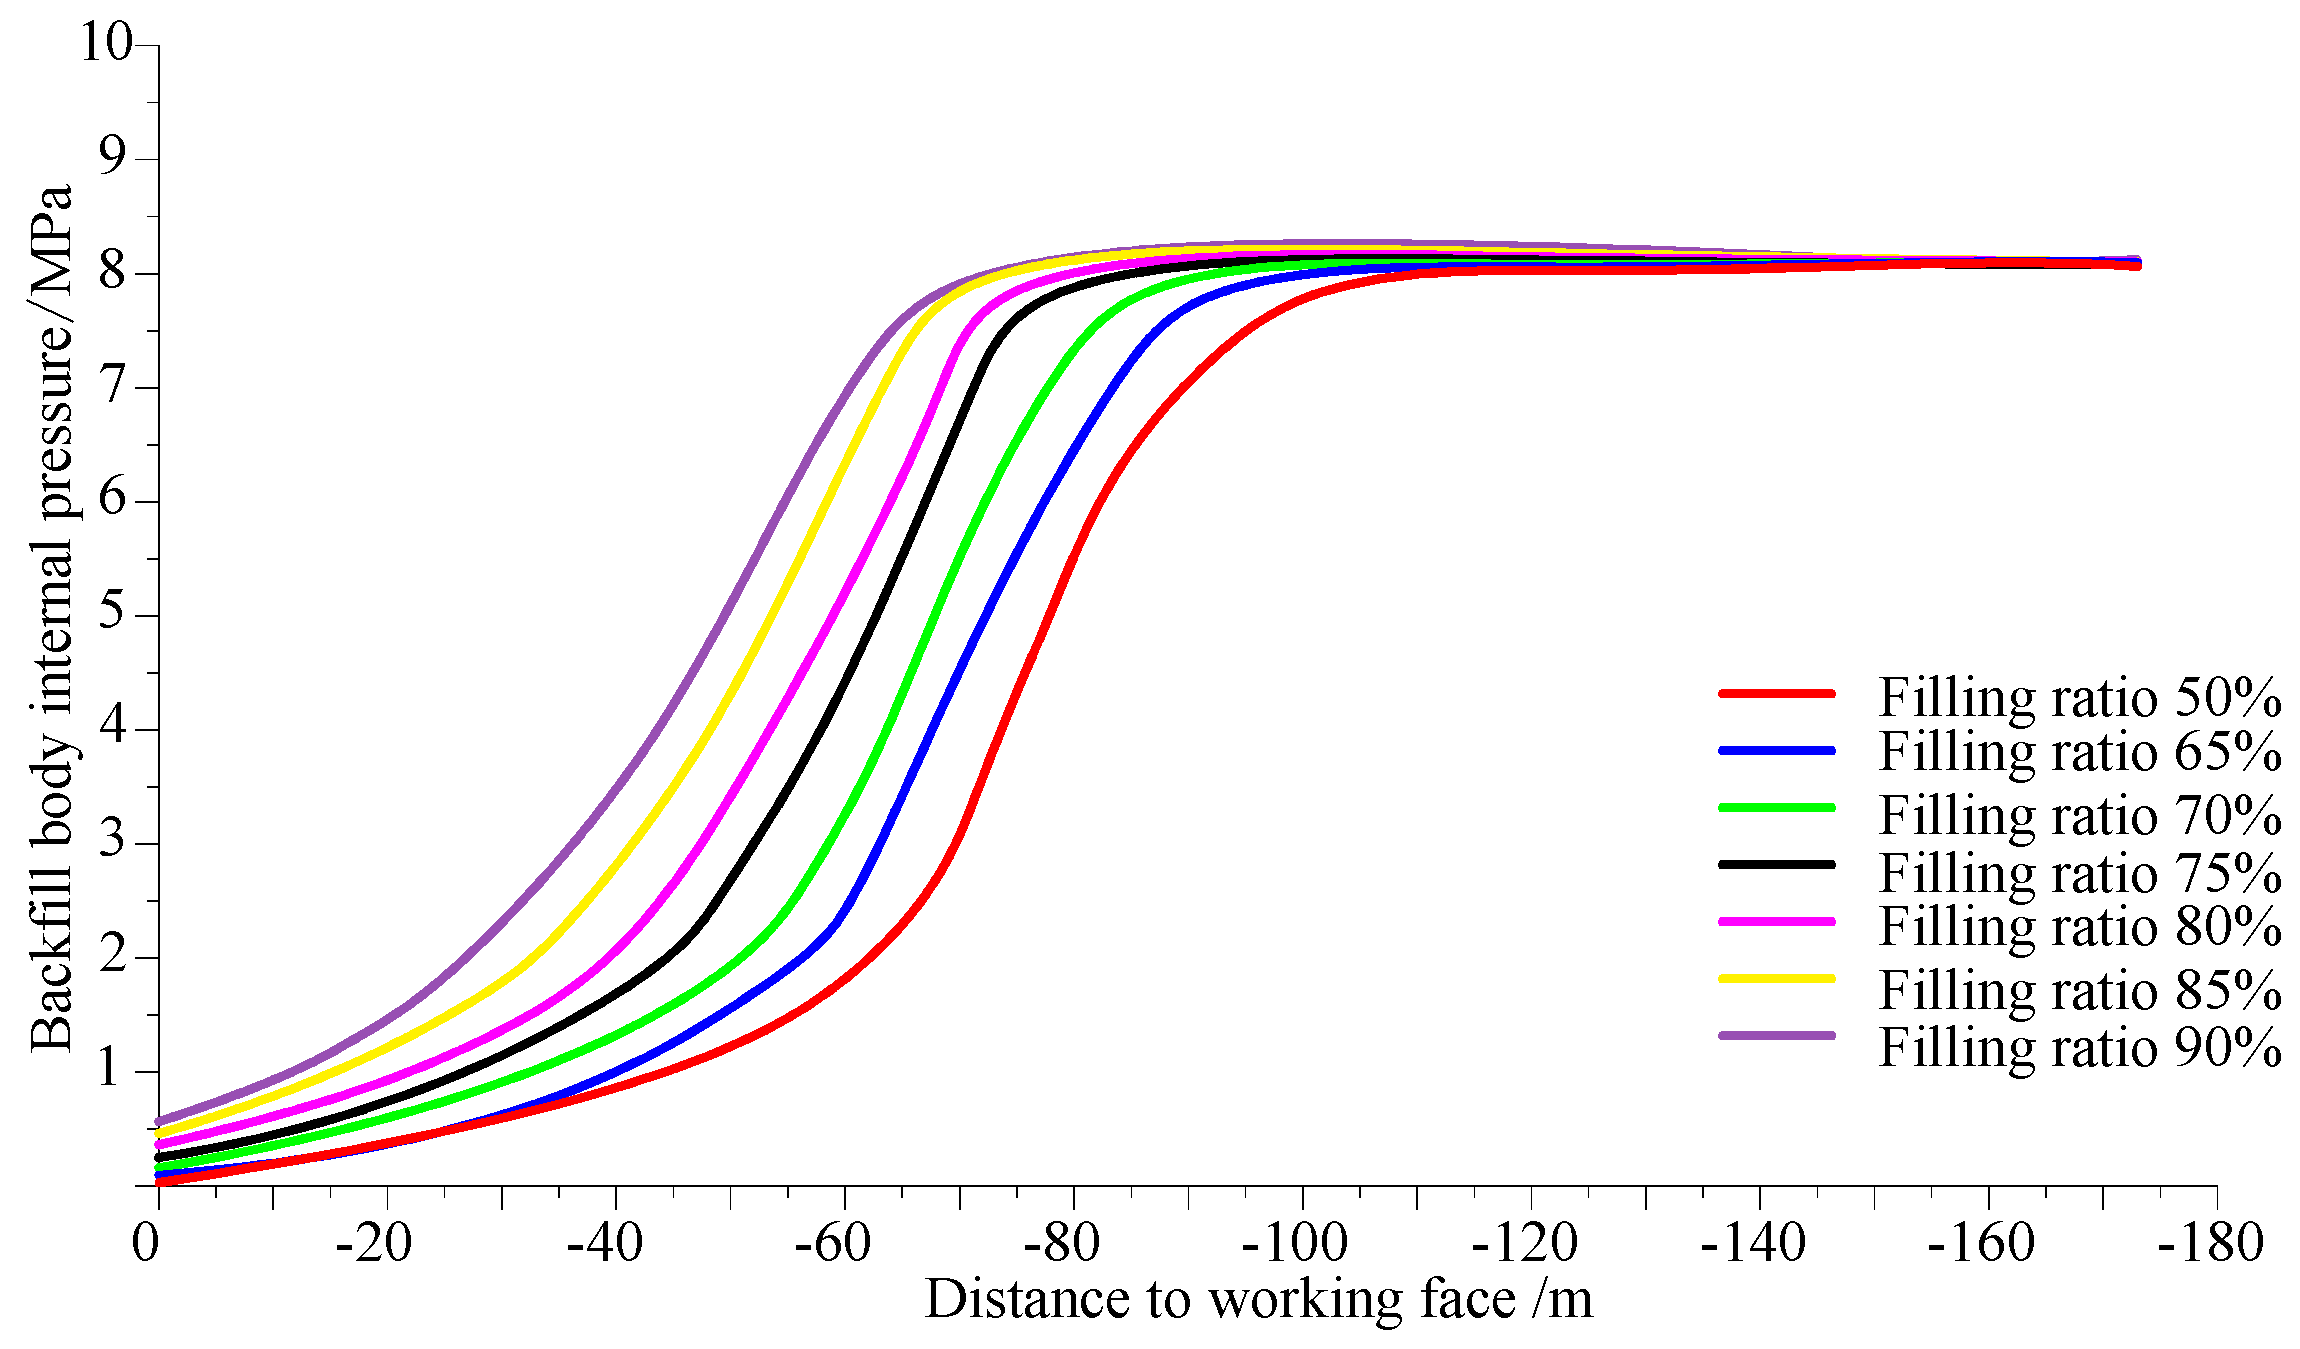
- The backfill body internal pressure gradually increased with the increase of the advancing distance of the working face. The increase pressure curves could be divided into three phases, i.e., initial pressure phase, accelerated increasing phase, and the stable pressure phase. In the initial pressure phase, the backfill body internal pressure slowly increases when the advancing distance of the working face increases, which indicates that the overburden subjected to the supports of front solid coal and rear backfill body bends slowly to the gob. Within the accelerated increasing phase, while the advancing distance of the face and span of the gob increase, the overburden accelerately sags to the gob, leading to the rapidly increase of the backfill body internal pressure. After the accelerated increasing phase, the internal pressure goes into a stable pressure phase, in which the internal pressure gradually approaches to the in-situ stress and the movement of the overburden reaches a new equilibrium.
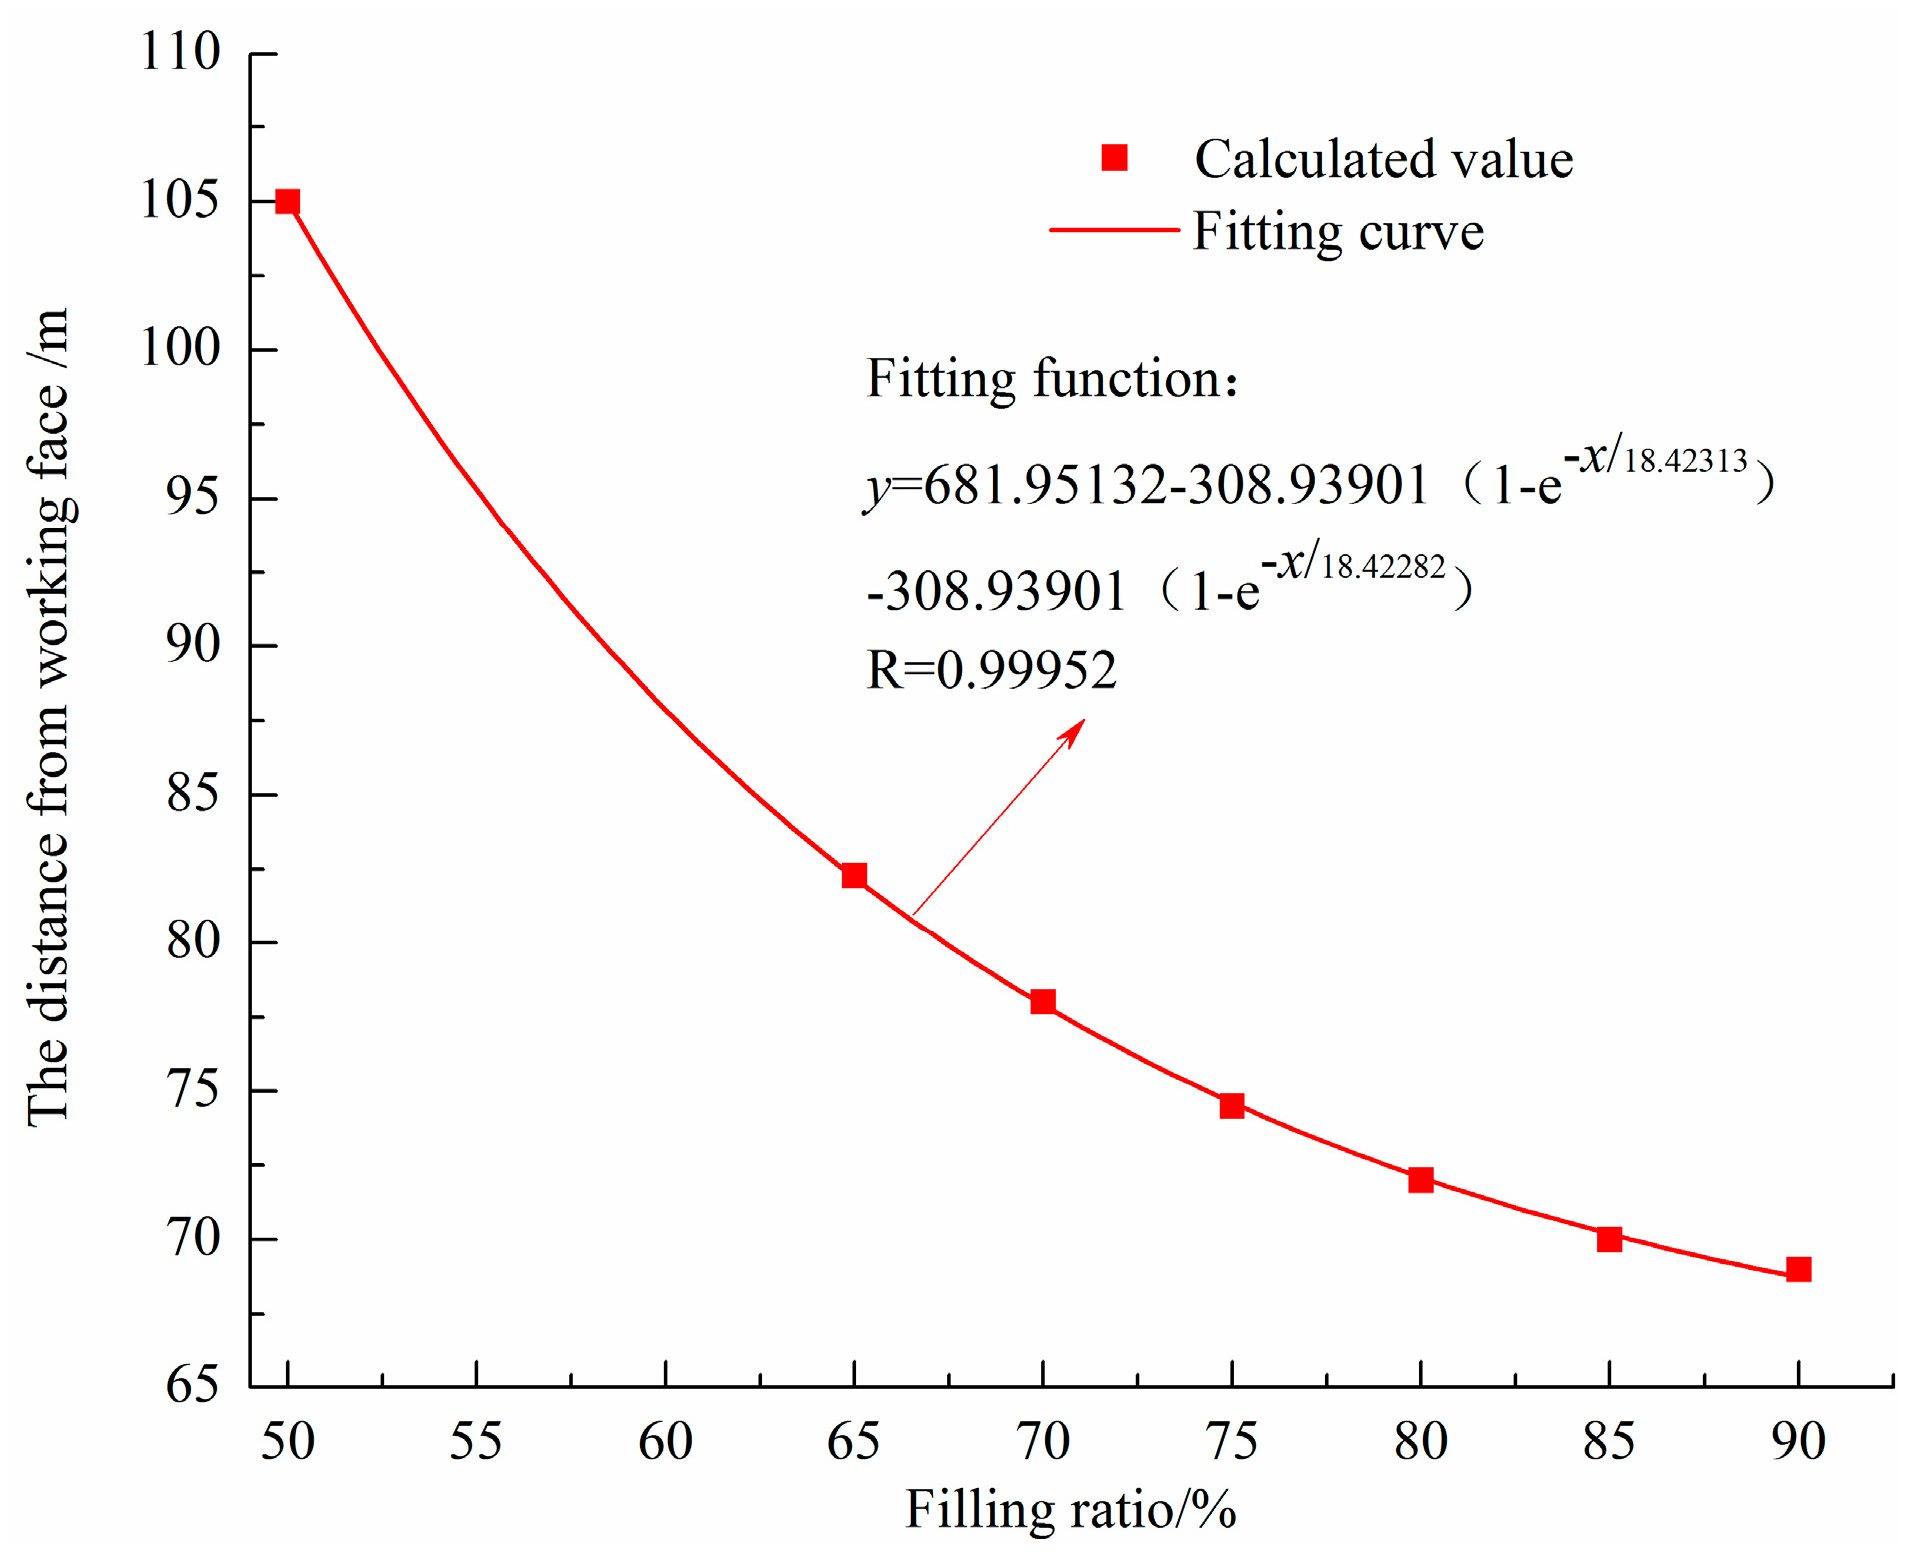
- (b)
- When the filling ratio is 50%, 65%, 70%, 75%, 80%, 85%, 90%, the advancing distance of the initial pressure phase is 68 m, 59 m, 52 m, 46 m, 43 m, 30 m, 20 m, respectively, and the advancing distance at which the internal pressure reaches stable is 105 m, 82 m, 78 m, 74 m, 72 m, 70 m, 69 m. Thus, the bigger the filling ratio is, the faster the backfill body internal pressure reaches stable period.
5. Engineering Test
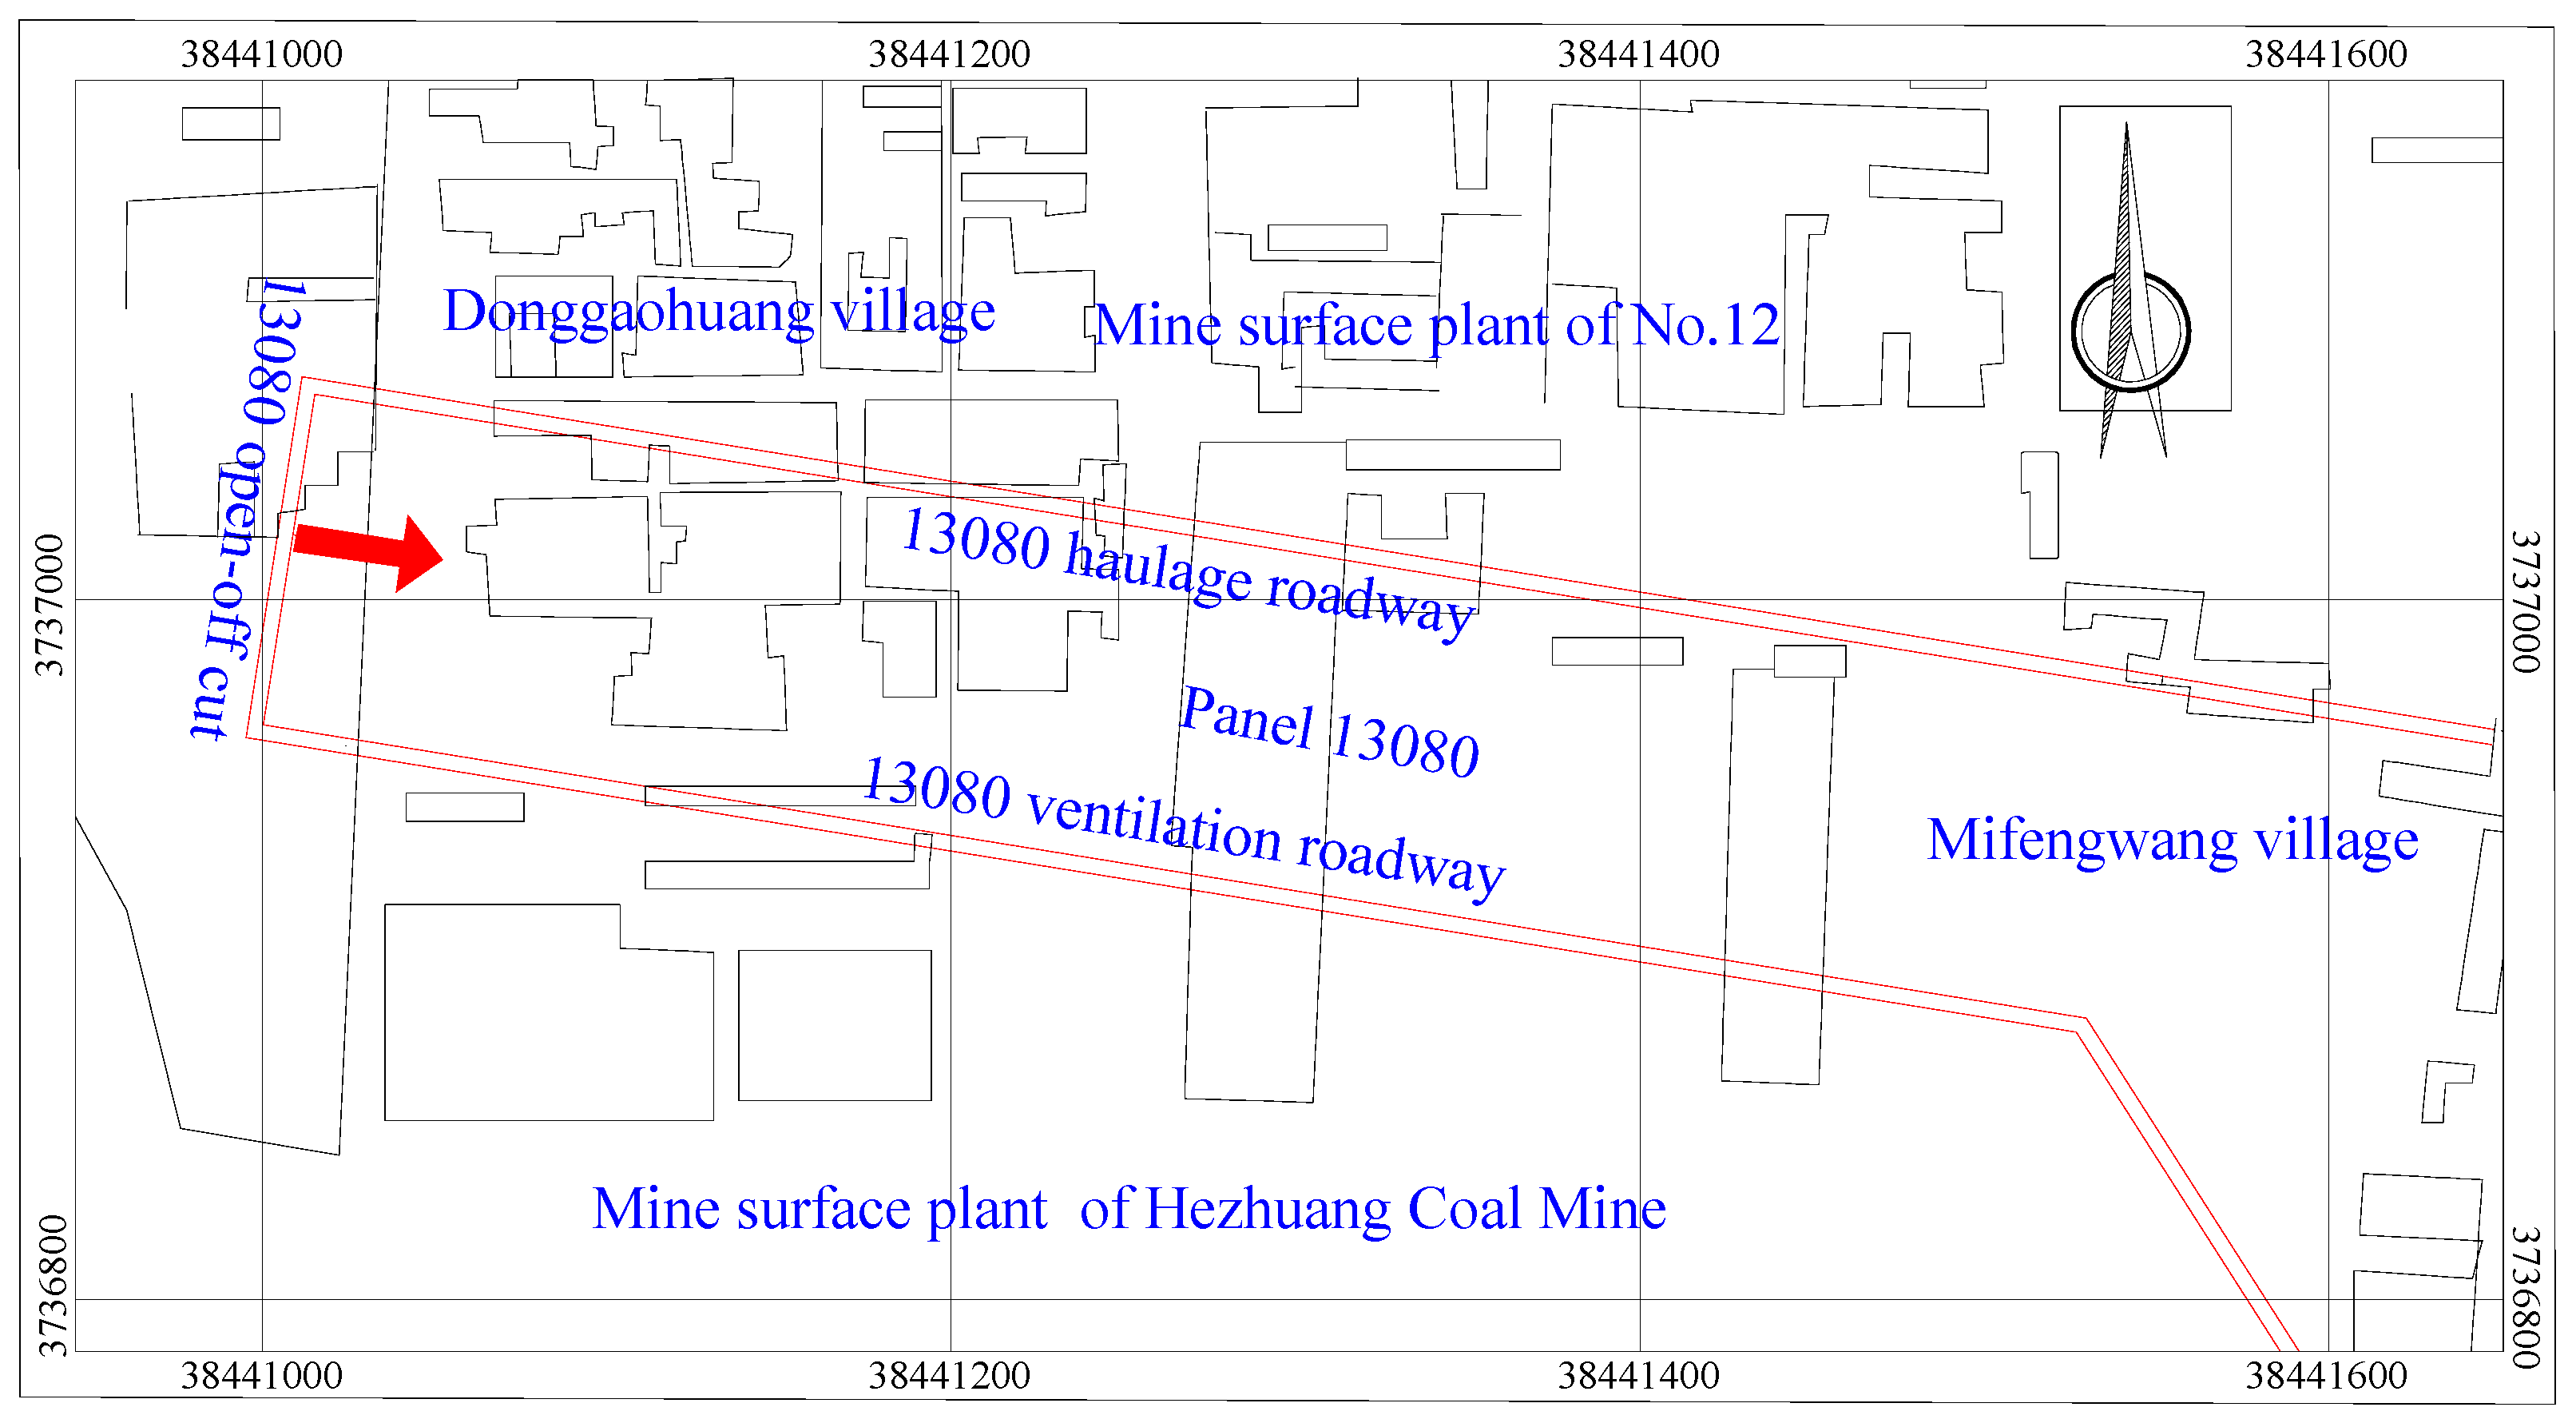
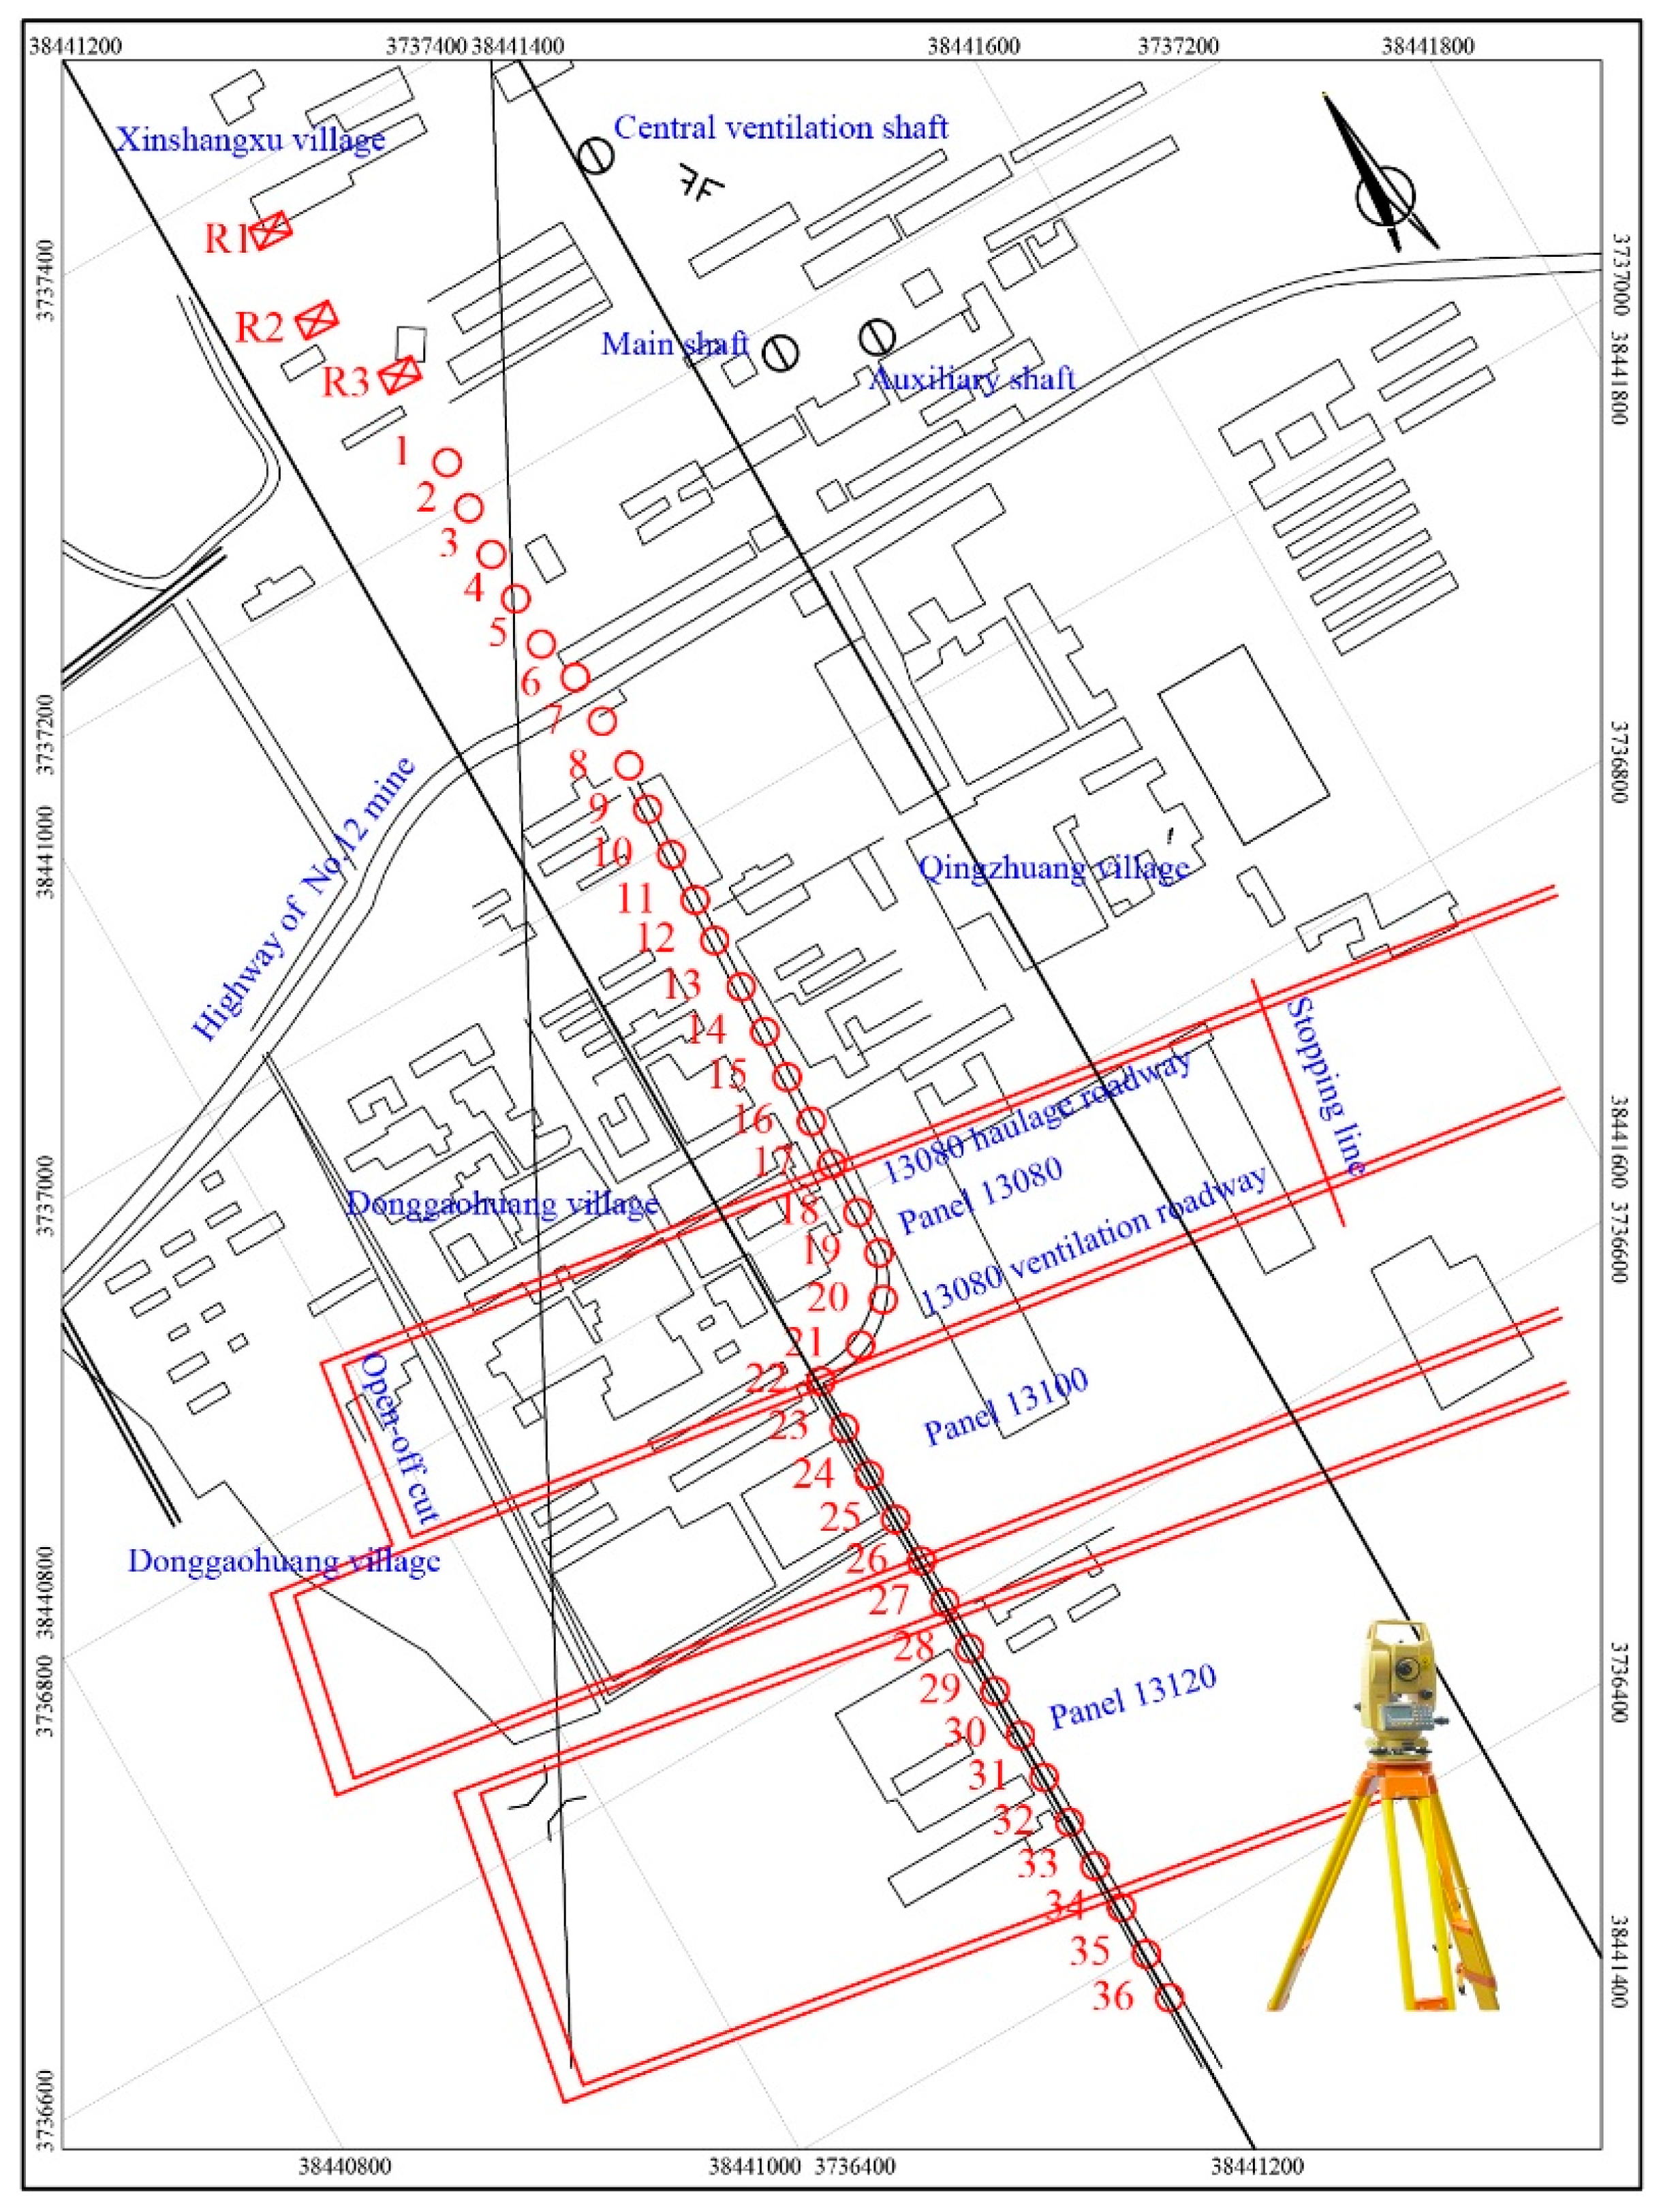
5.1. Background
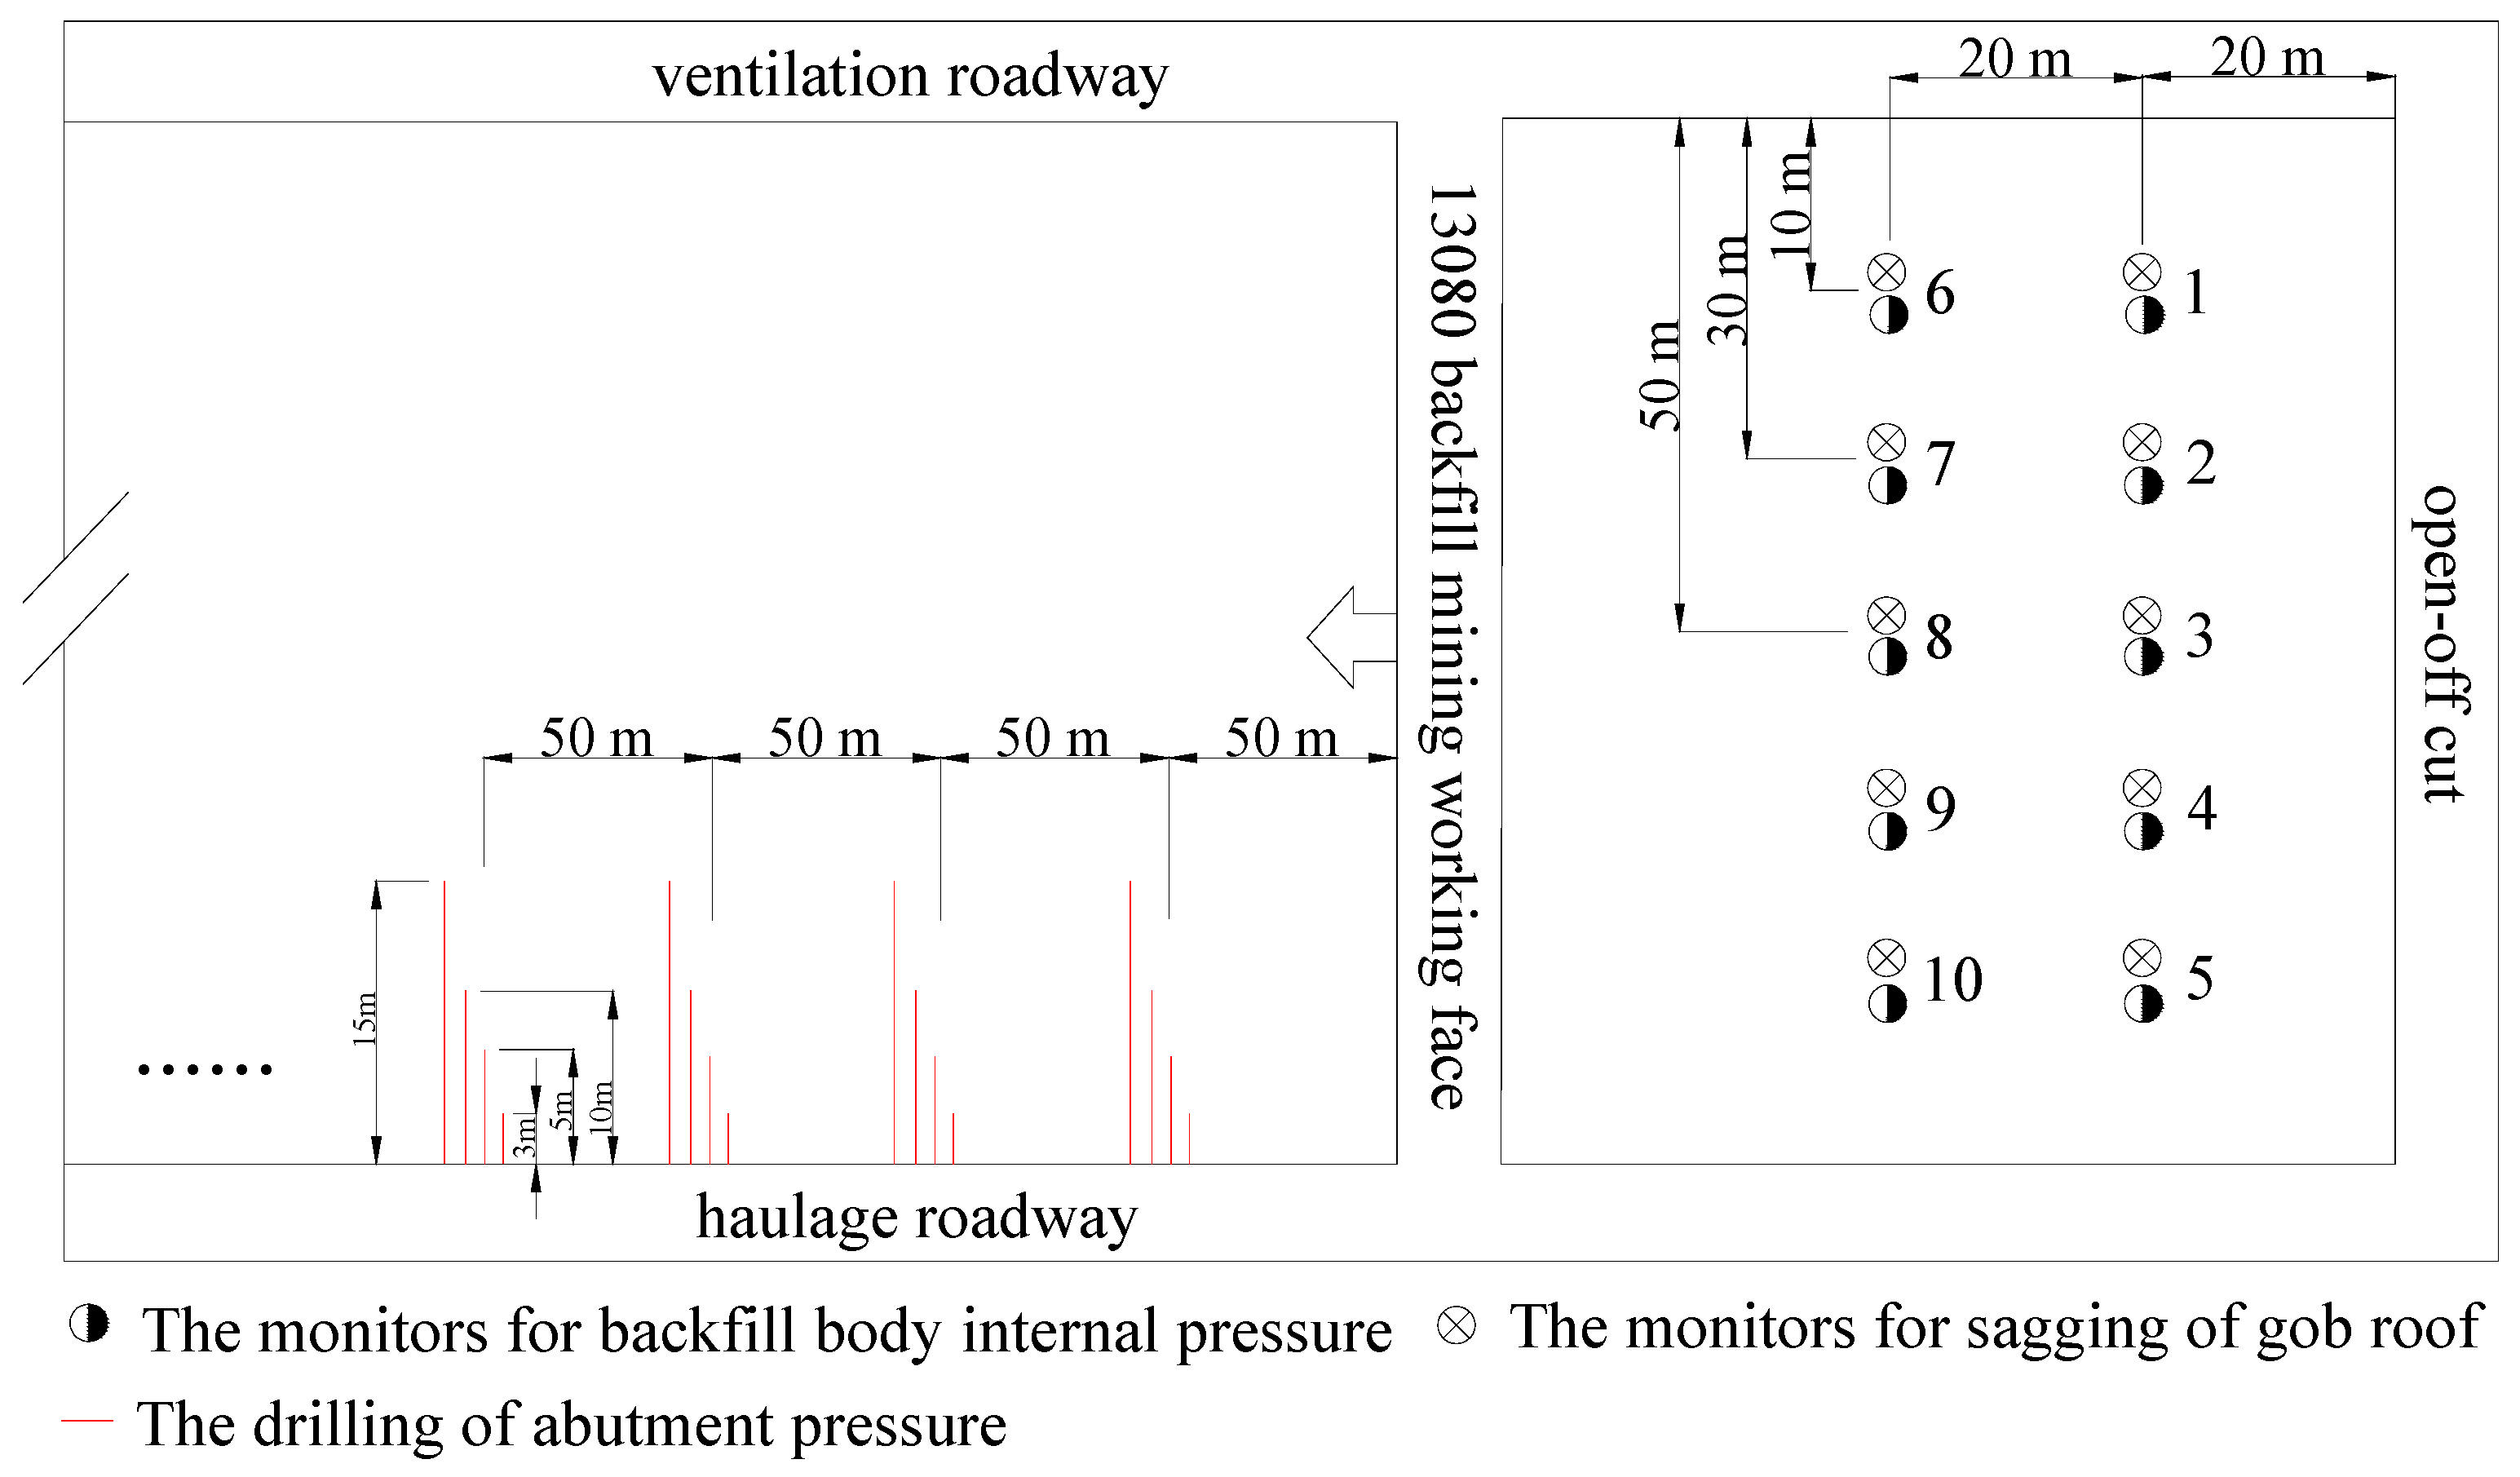
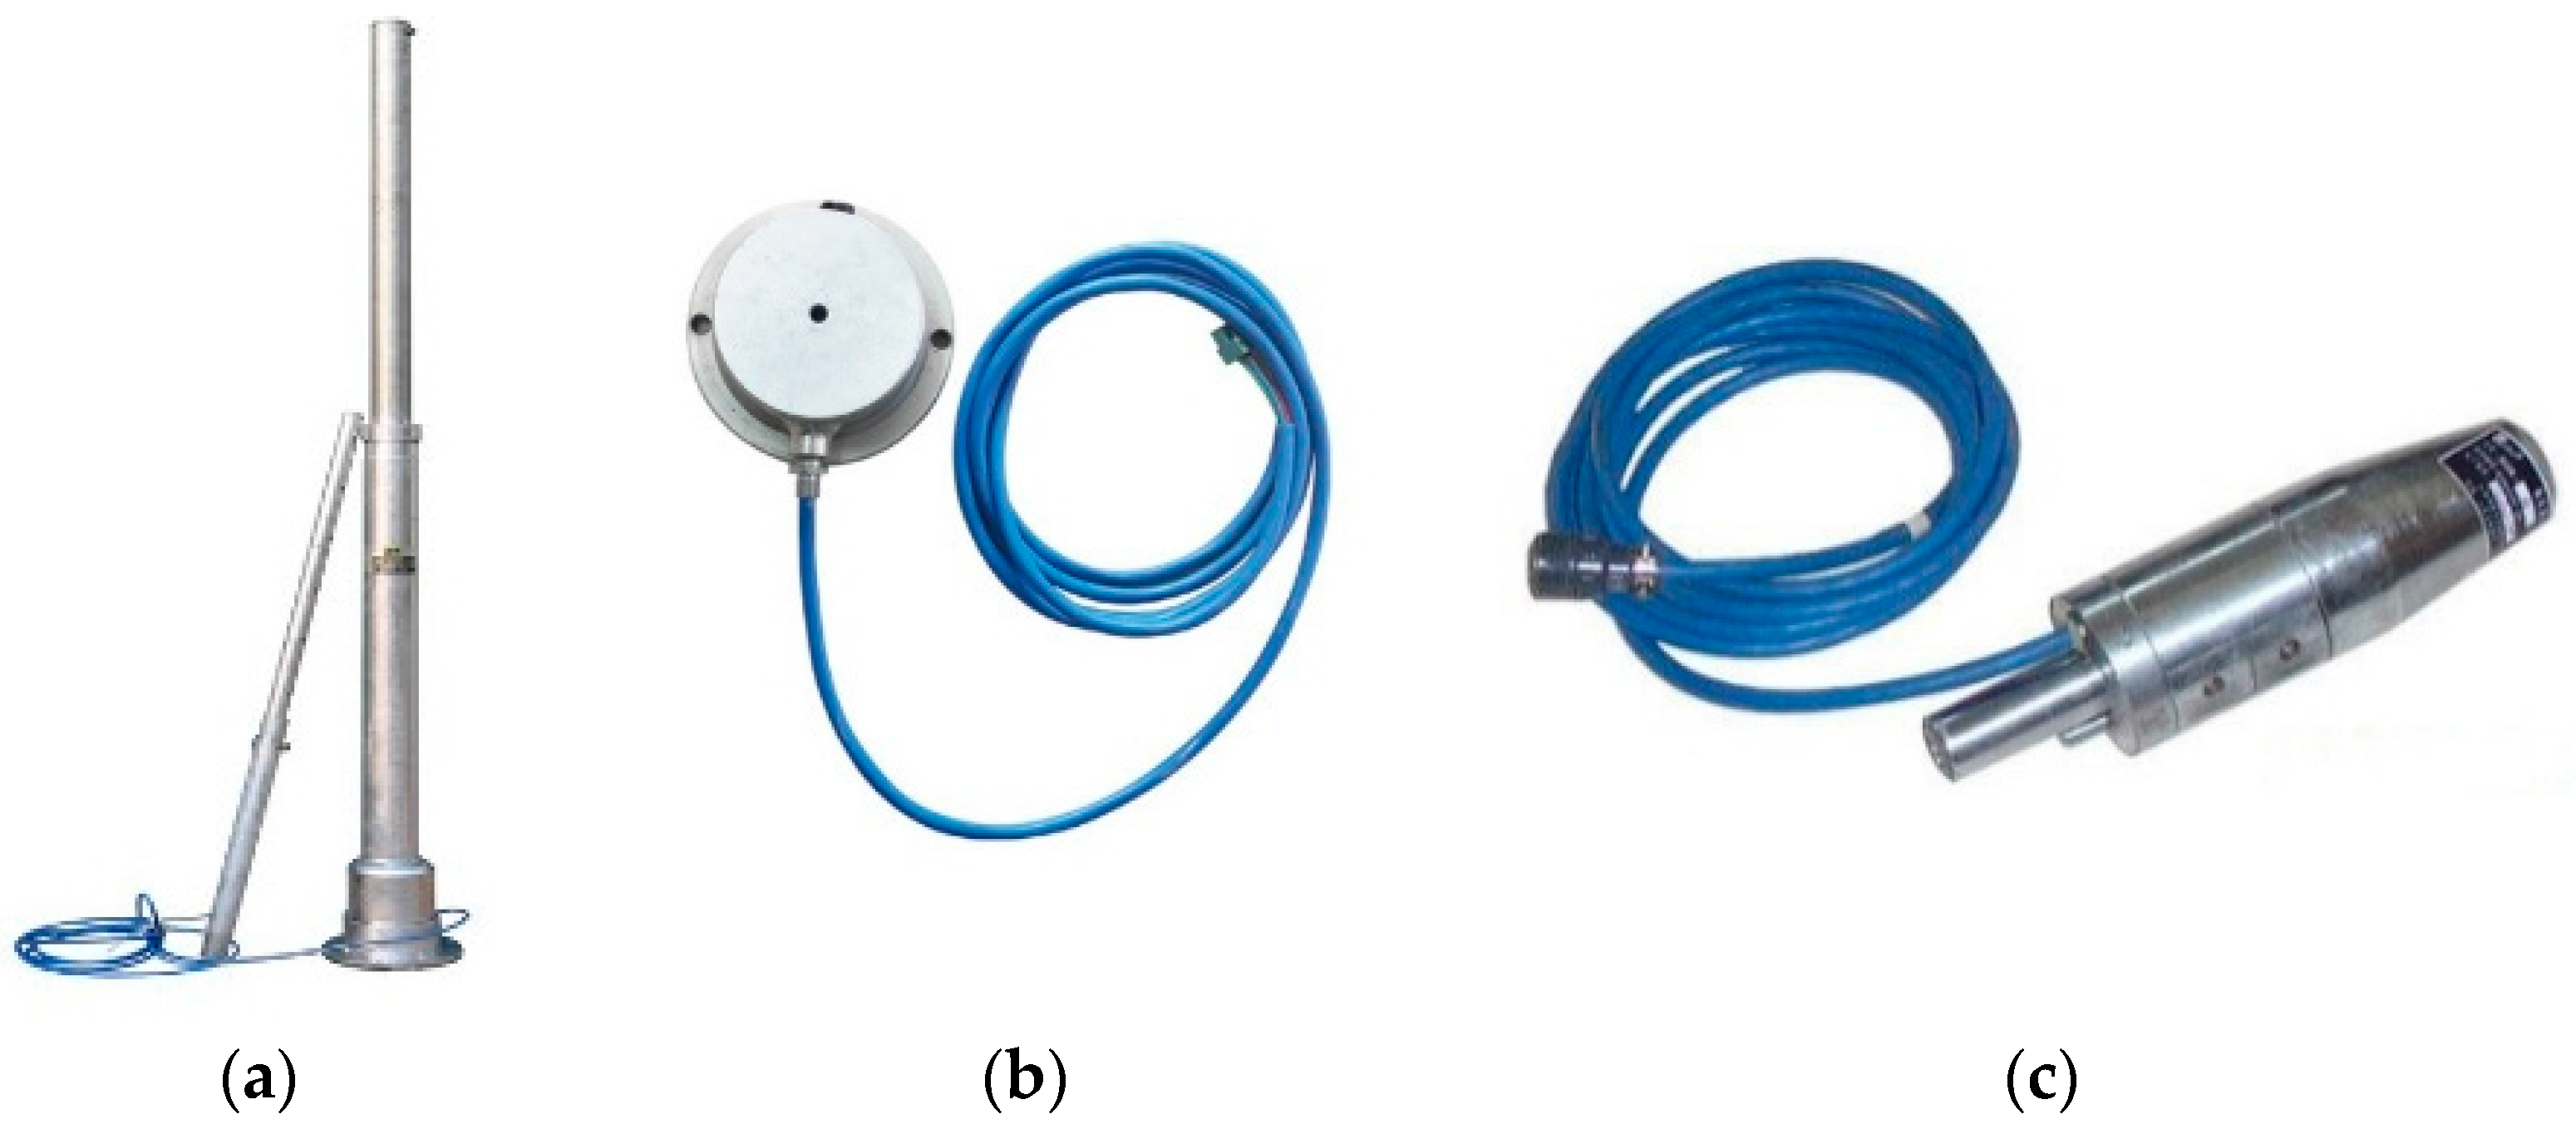
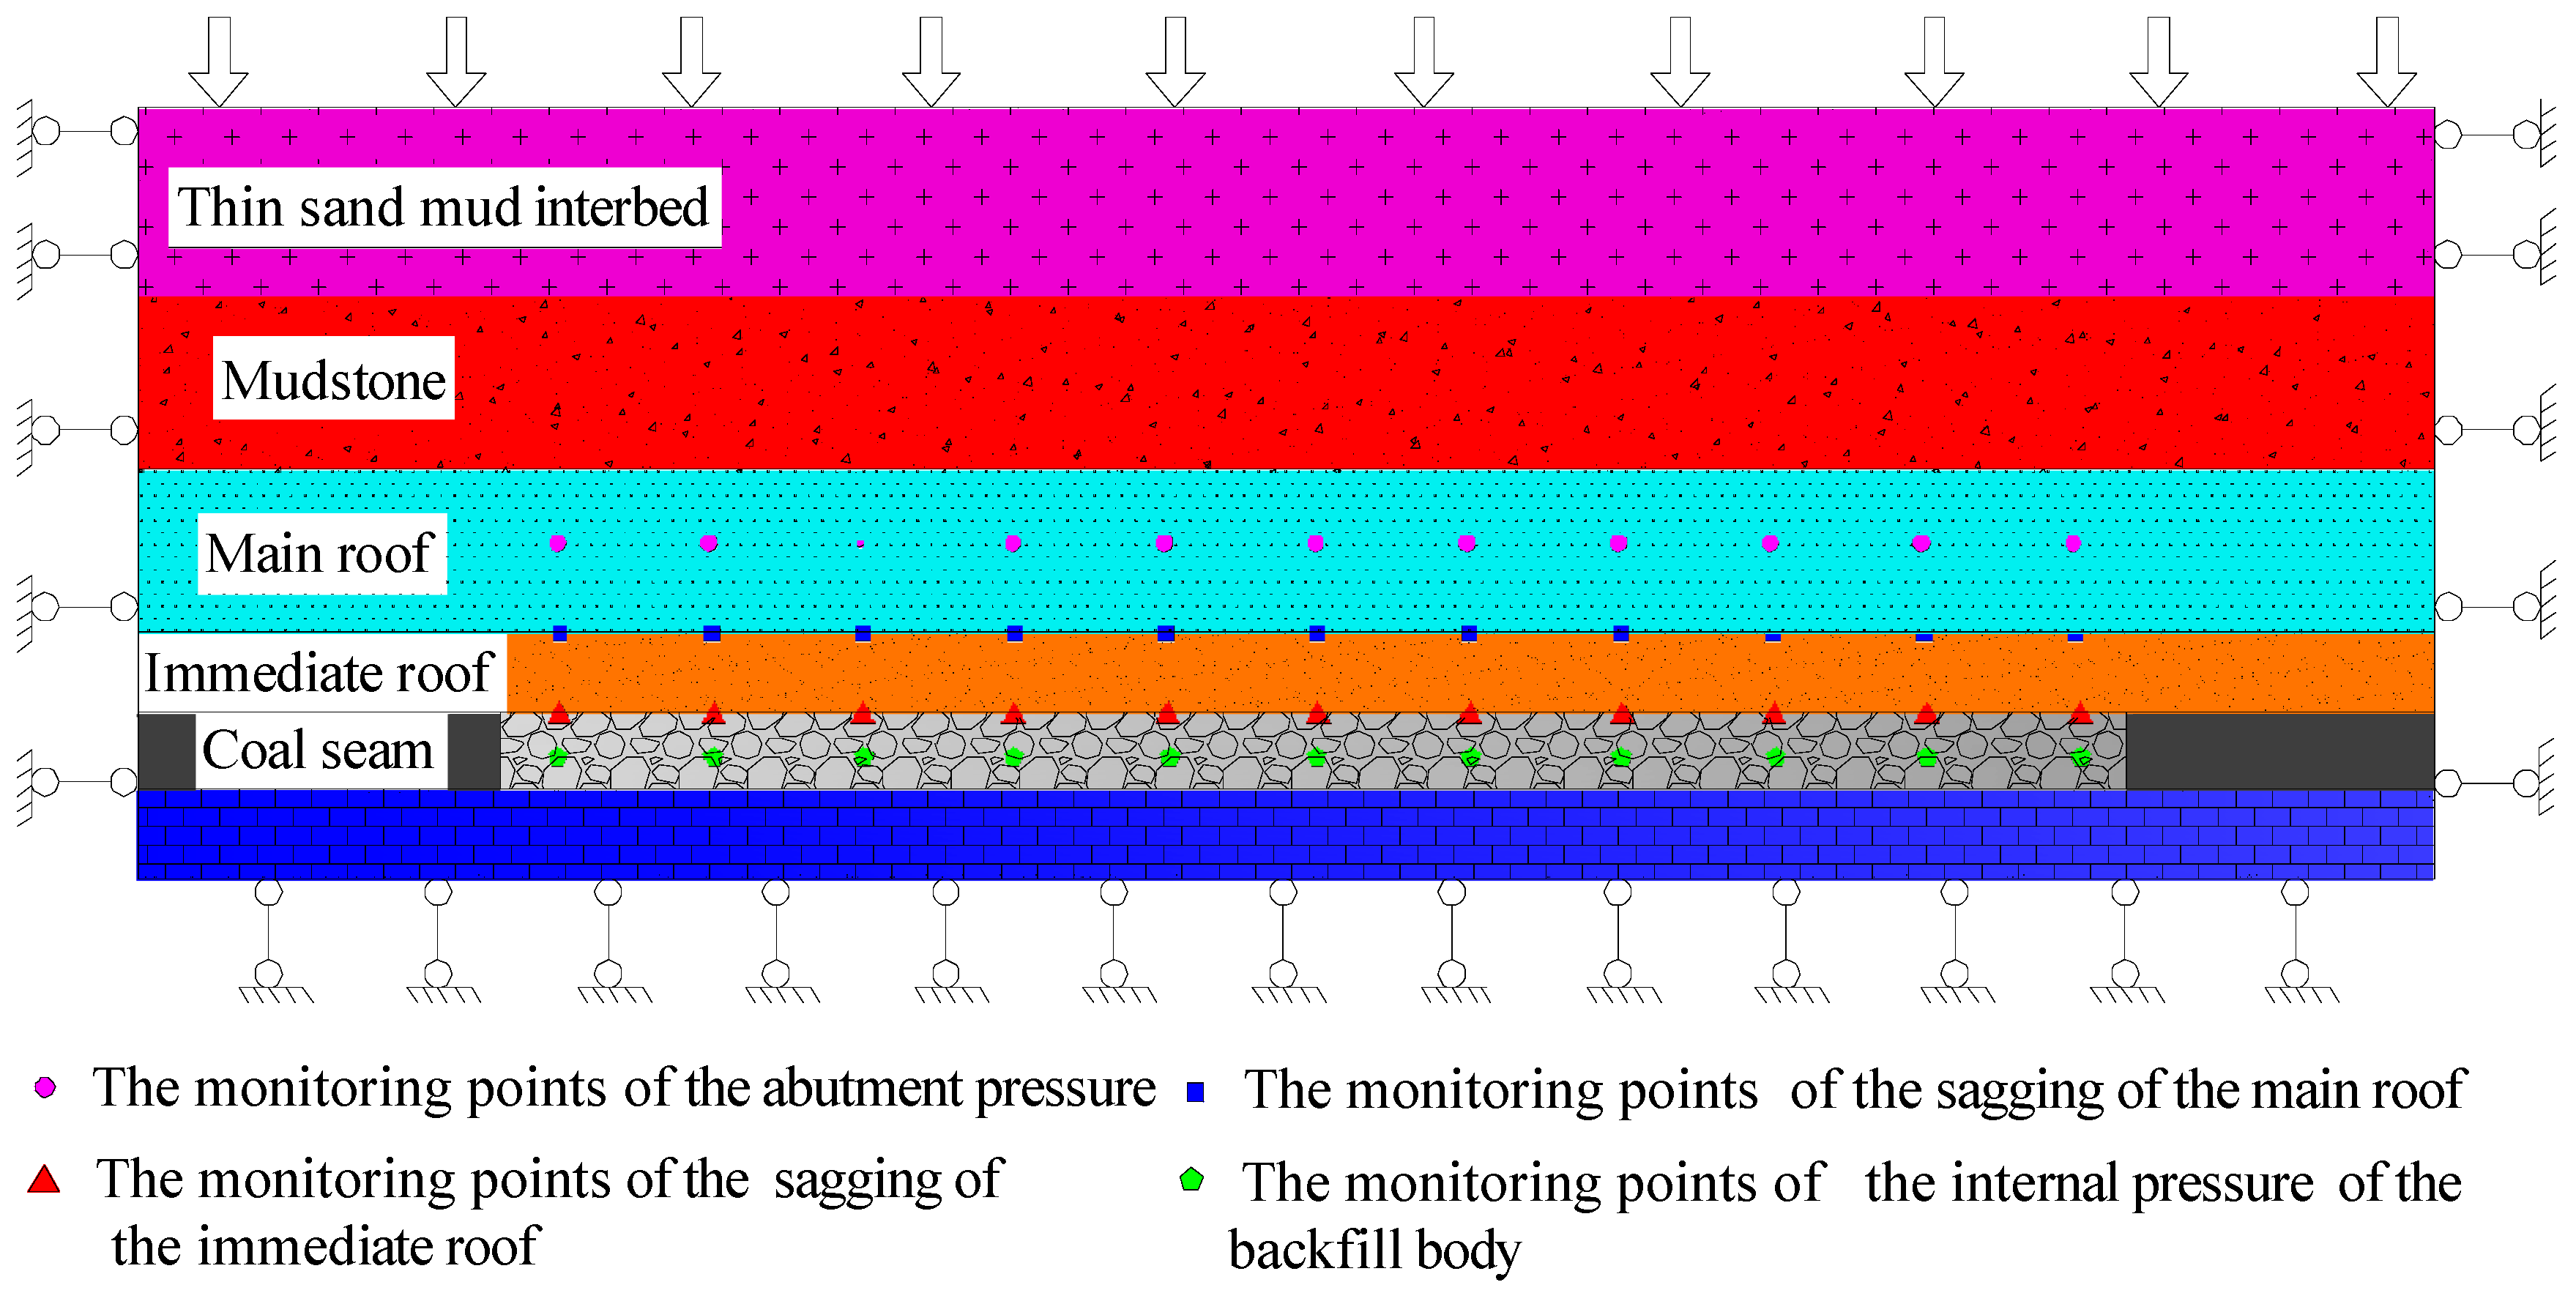
5.2. Monitoring Layouts and Instruments
5.3. Monitoring Results and Analysis
- (a)
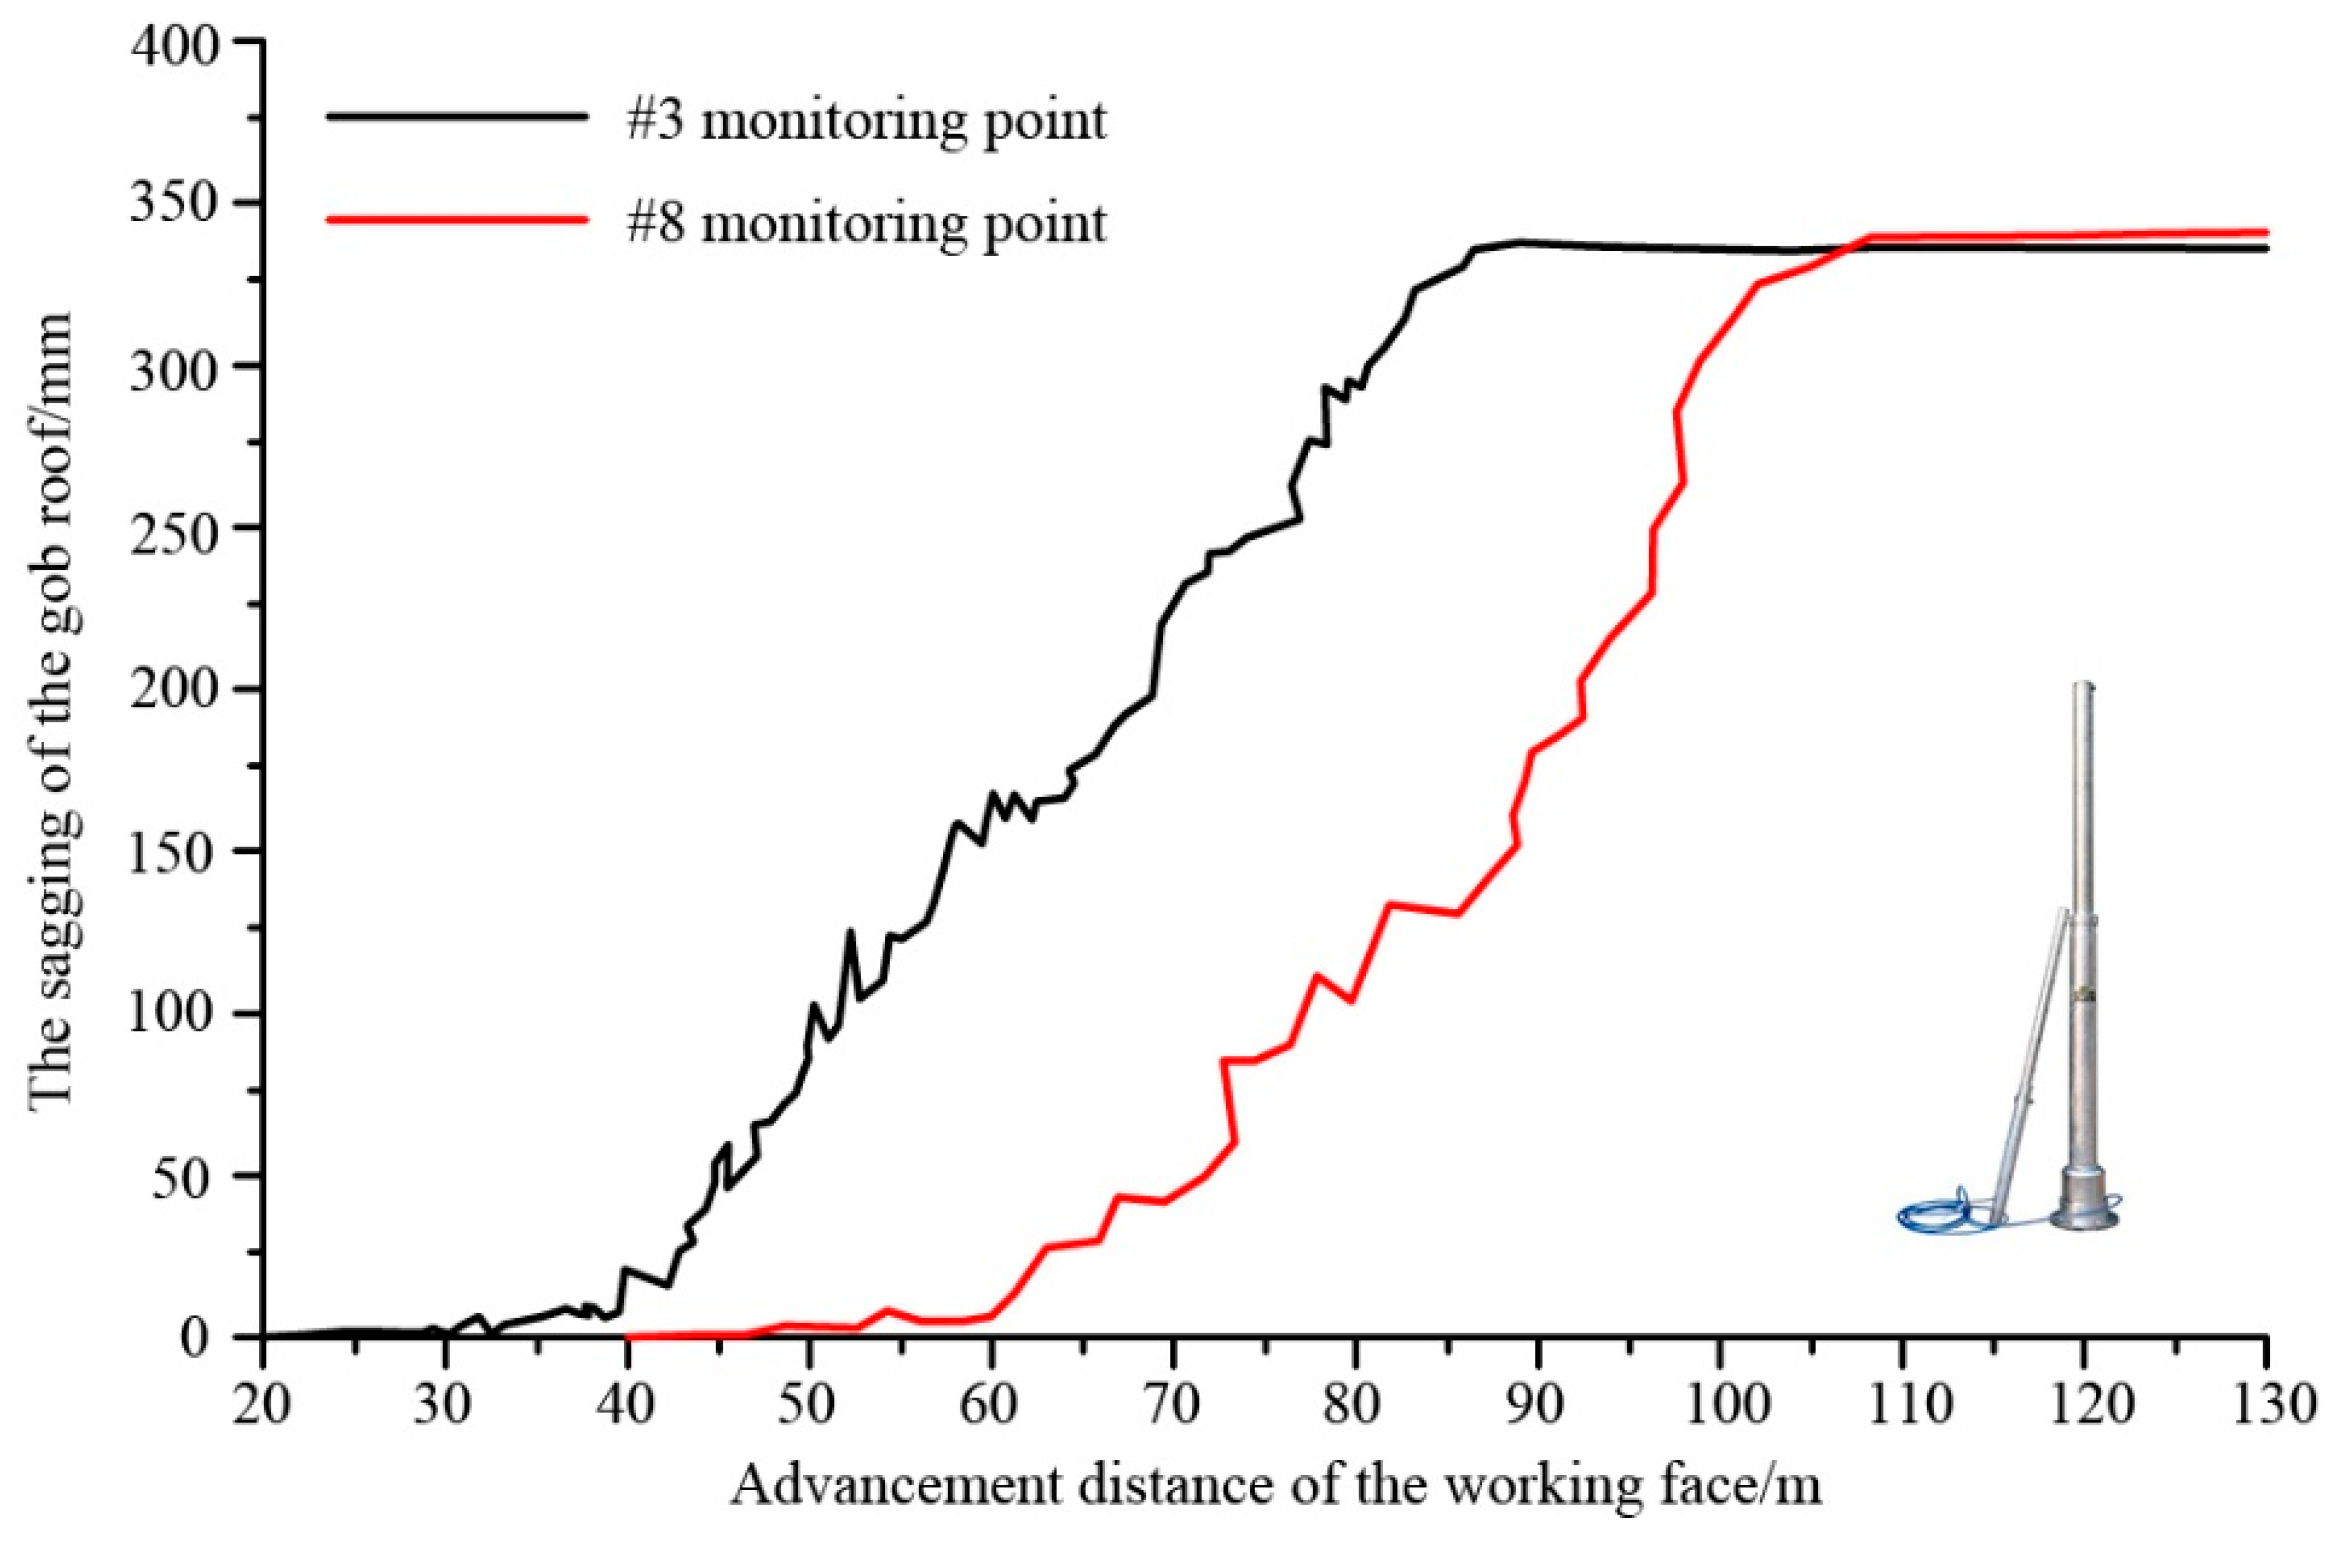
- The curves of the gob roof sagging versus the working face advancement could be divided into three stages, i.e., the slowly sagging stage (0–20 m from the working face), the accelerated sagging stage (20–65 m from the working face) and the stable sagging stage (above 65 m from the working face), representing the three stages of the gob roof movement.
- (b)
- In the slowly sagging stage (0–25 m from the working face), since the distance advancement of the working face was short, the pillar at the open-cut, solid coal subjected to the main load of the overburden, thus, the roof sagged slowly.
- (c)
- With the distance advancement of the working face continue increasing, the gob roof acceleratedly sagged mainly bending as an intact stratum, corresponding to the accelerated sagging stage (20–65 m from the working face).
- (d)
- After the face advancing 65 m, the sagging of the gob roof approximately verged to a stable stage. The backfill body mainly subjected to the overburden load. The maximum sagging of #3 and #8 were 340 mm, with the filling ratio of 89.5%, which was consistent with the theoretical results.
- (a)
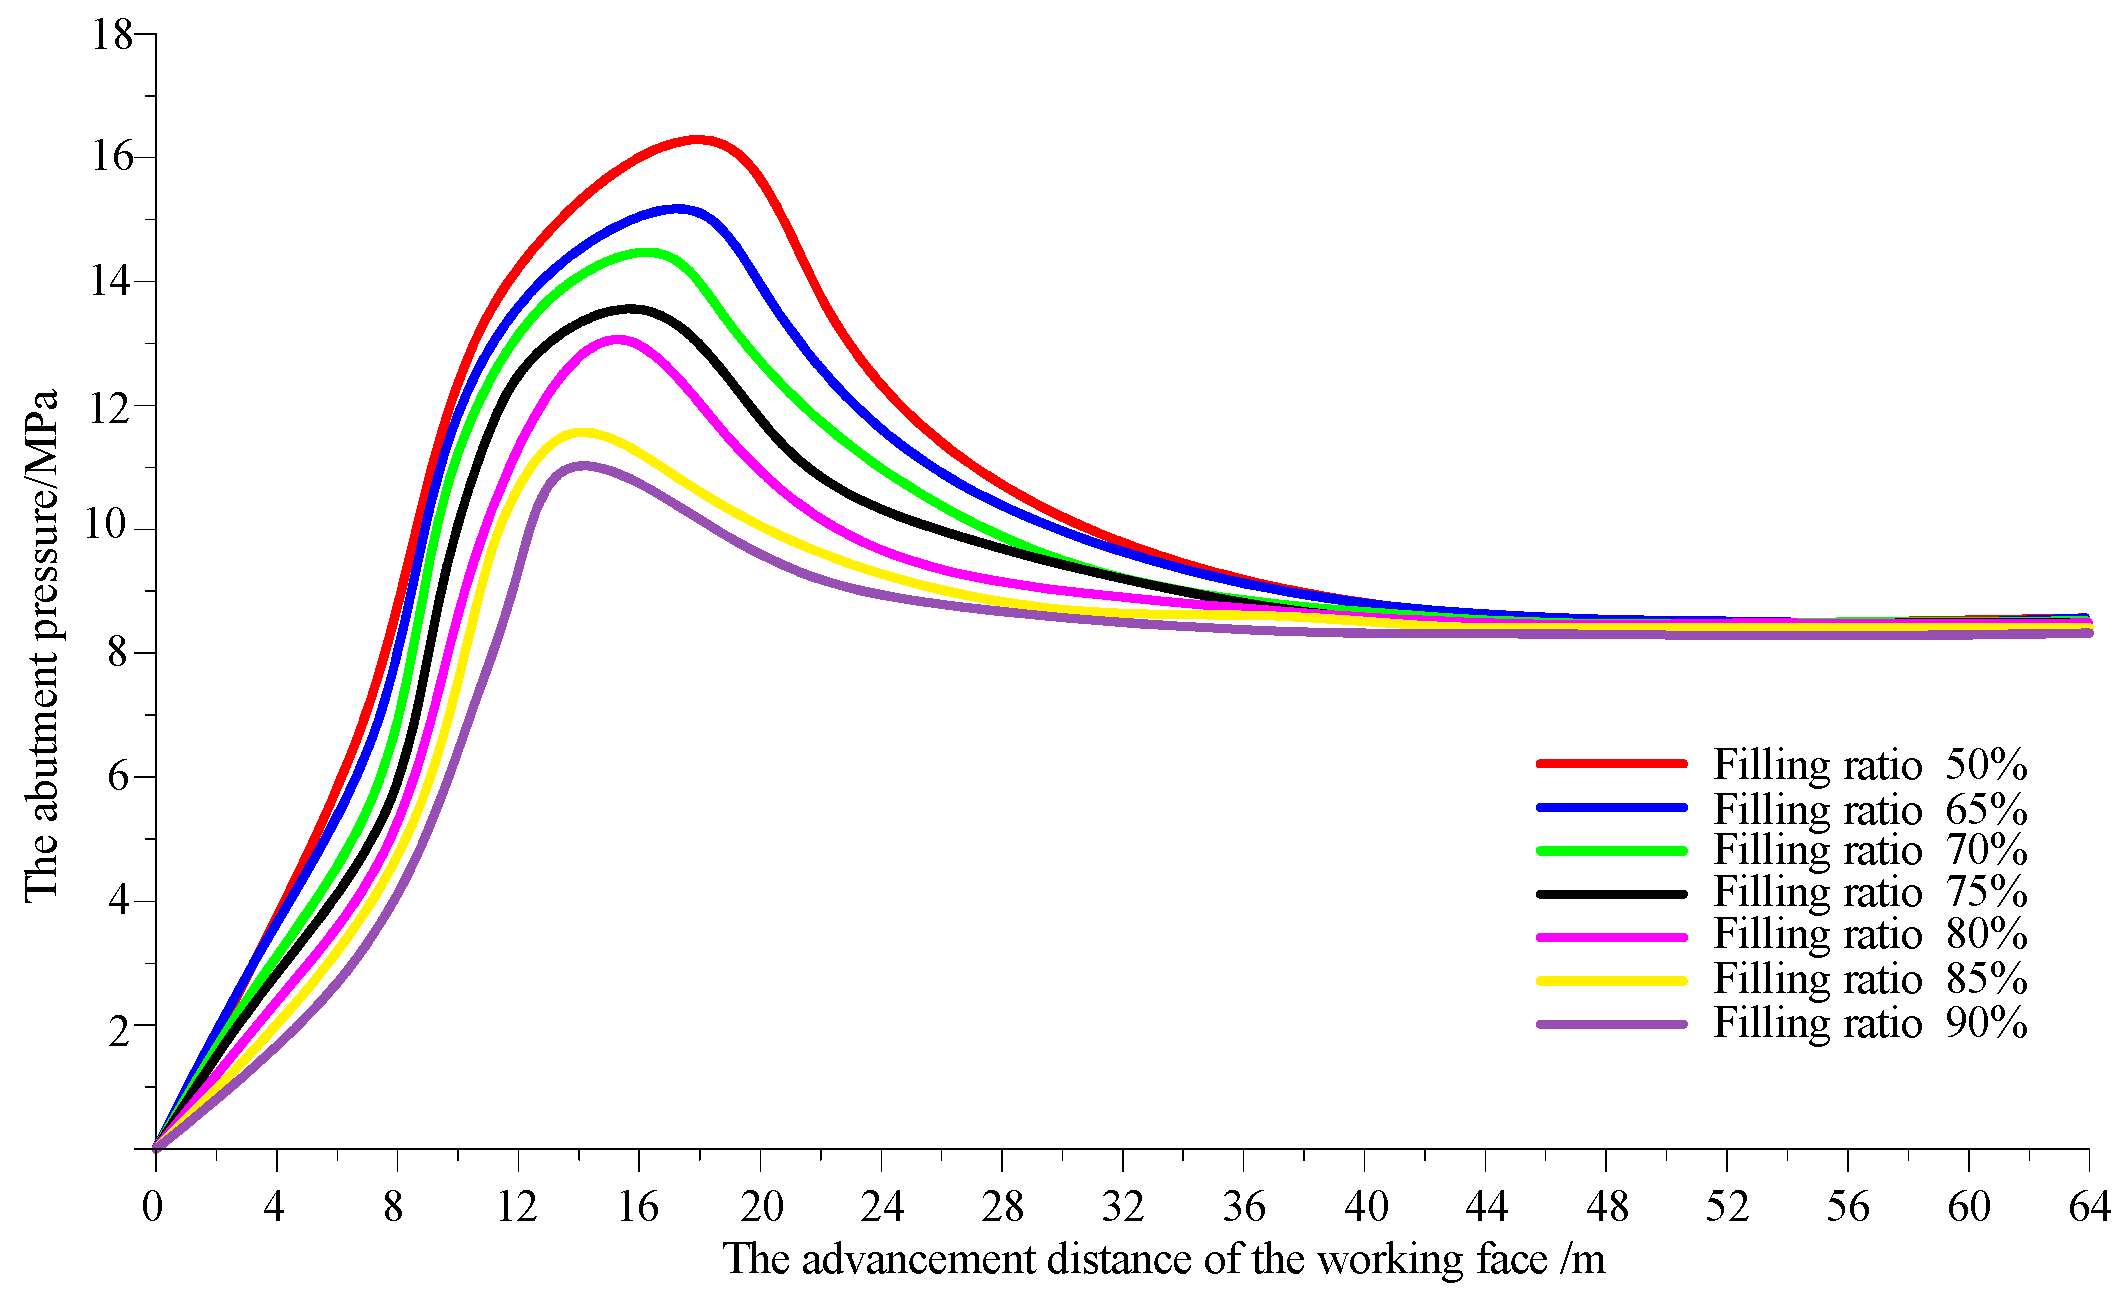
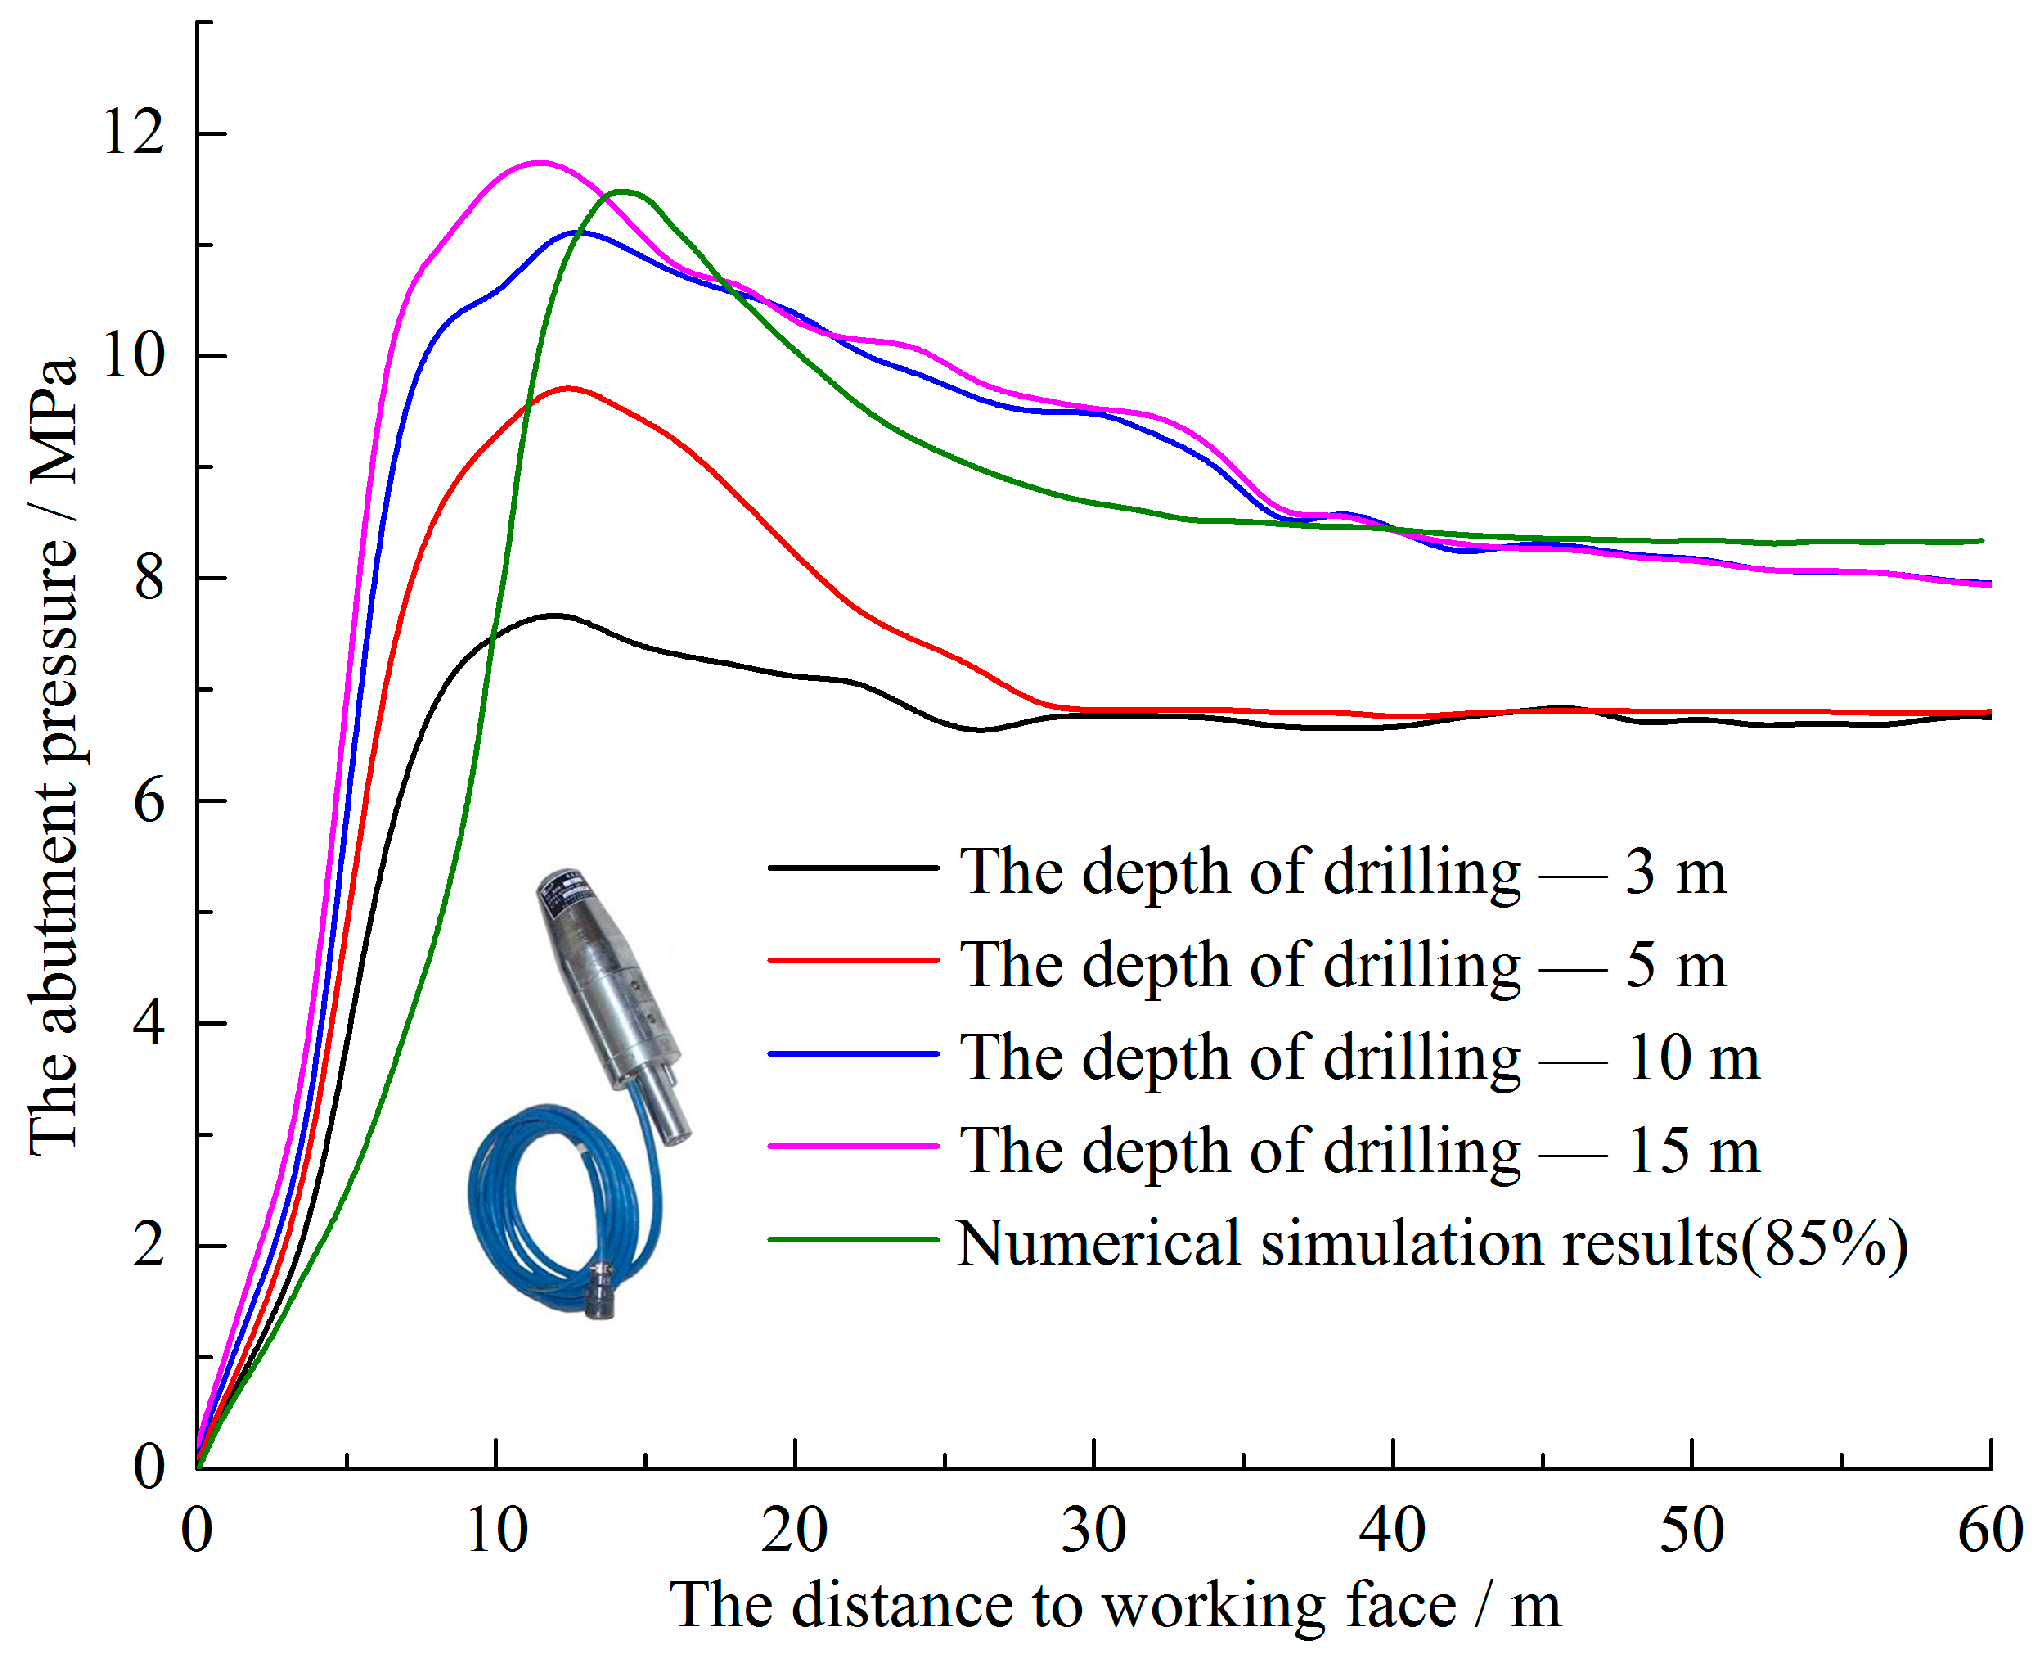
- The abutment pressure distribution of CMCB panels is similar to the caving mining panels, with 4 zones along the advancement of the face, i.e., de-stress zone (0–5 m), stress rapid increase zone (5–15 m), stress decrease zone (15–25 m) and in-situ zone (after 25 m).
- (b)
- However, the peak front and the influence range of the abutment pressures are gradually reduced compared to caving mining method. Furthermore, the maximum stress concentration factor is only 1.3, which is lower than the concentration factor in caving mining panels.
- (c)
- When the drilling depth is 15 m, the monitoring results of abutment pressures are most close to the numerical simulation results. But the peak value of abutment pressures are slightly lower in numerical simulation, and the distance of peak position to the working face is large. It is considered that the numerical simulation cannot completely reproduce all the complicated mining geological conditions in engineering practice, but the error is still within the acceptable range.
- (a)
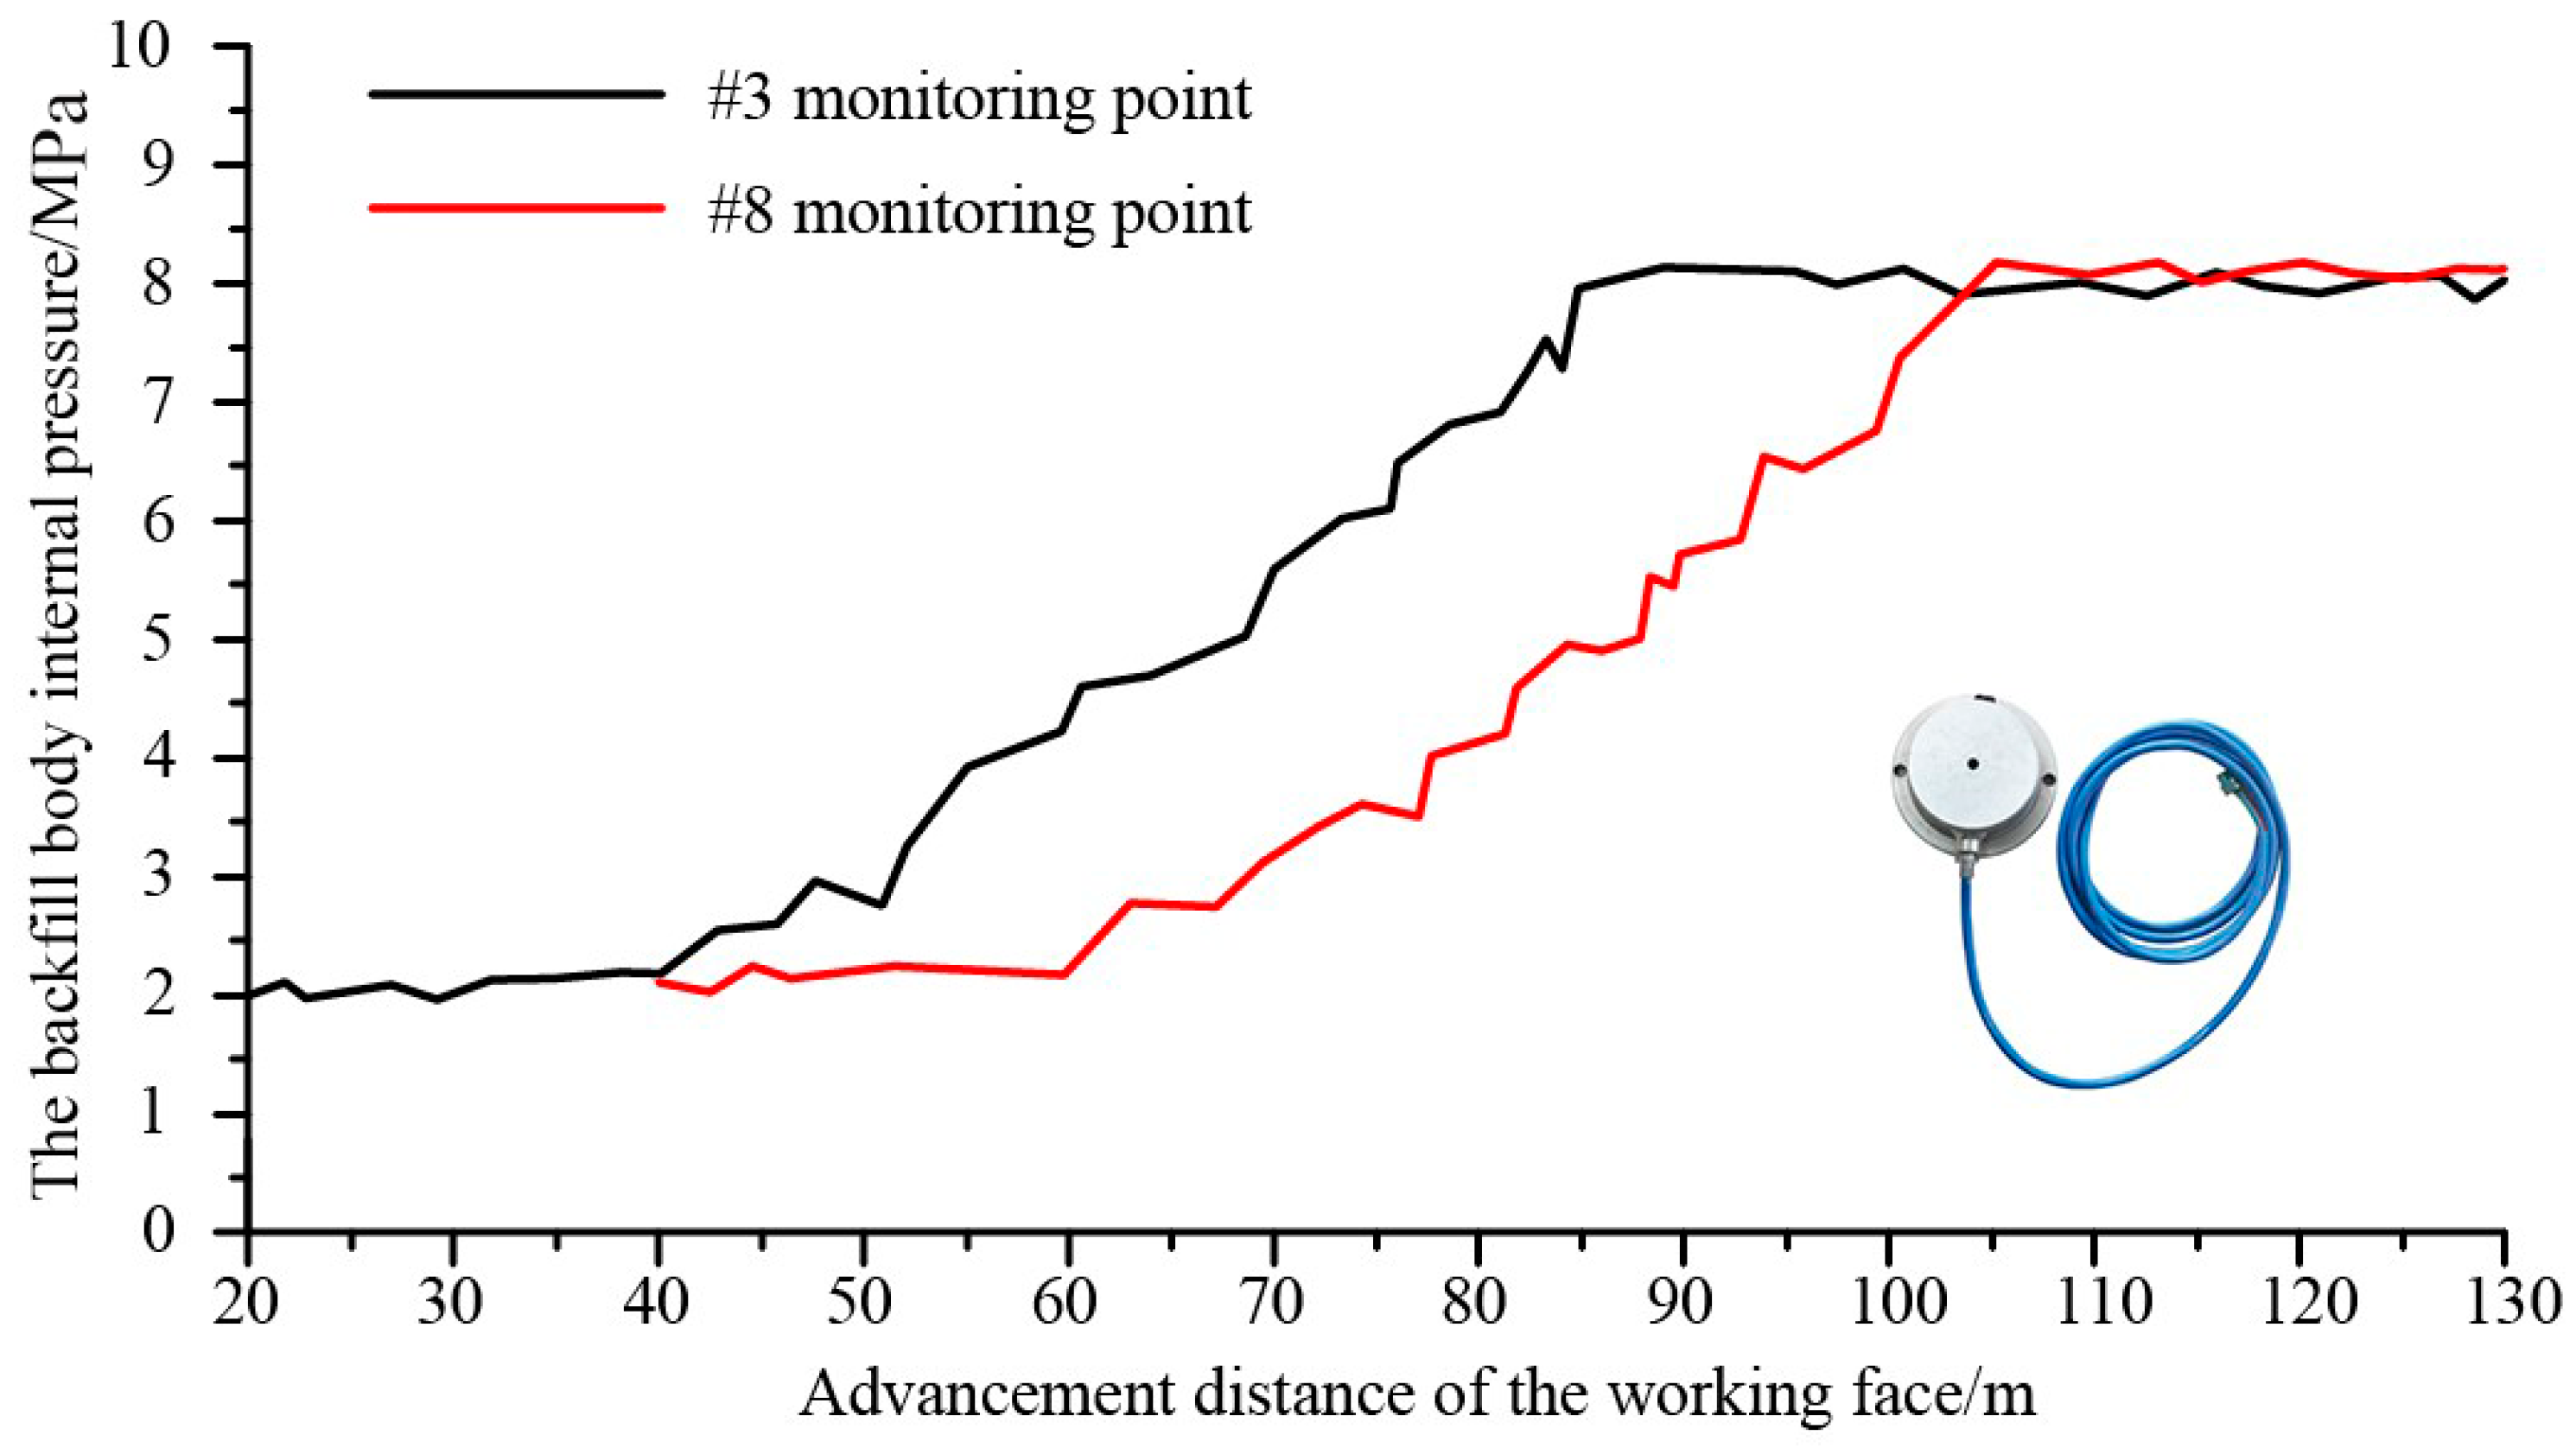
- The backfill body internal pressure curves versus the advancement distance of the working face could be divided into three stages: the initial stress stage (0–20 m from the working face), the stress rapidly increasing stage (20–65 m from the working face) and the stress stability stage (after 65 m from the working face), in correlation with the three stages of gob roof sagging, i.e., the slowly sagging stage, the accelerated sagging stage and the stable sagging stage.
- (b)
- In initial stress stage, the backfill body internal pressure varied from 1.8 MPa to 2.5 MPa, while in the stress rapidly increasing stage, it increase rapidly from 2.5 MPa to approximate 8.5 MPa. It indicated that the main carriers of the overburden load changed from the solid coal of the face and the open-cut pillars in the initial stage to backfill body in the stress rapidly increasing stage.
- (c)
- After 65 m, the backfill body internal pressure was gradually stabilized with the distance advancement of the working face, with a maximum value of approximate 8.6 MPa which is close to the in-situ stress. It shows that the movement of the overburden at this stage was close to stable under the support of the backfill body.
6. Conclusions
- (1)
- The elastic-thin-plate mechanical model for overburden in coal mining with compacted backfilling (CMCB) was established according to the deformation characteristics of the surrounding rocks. The deflection equation, bending moment equation, and maximum tensile stress equations associated with the main roof in CMCB were derived from virtual displacement principle. The critical conditions of main roof failure were also obtained.
- (2)
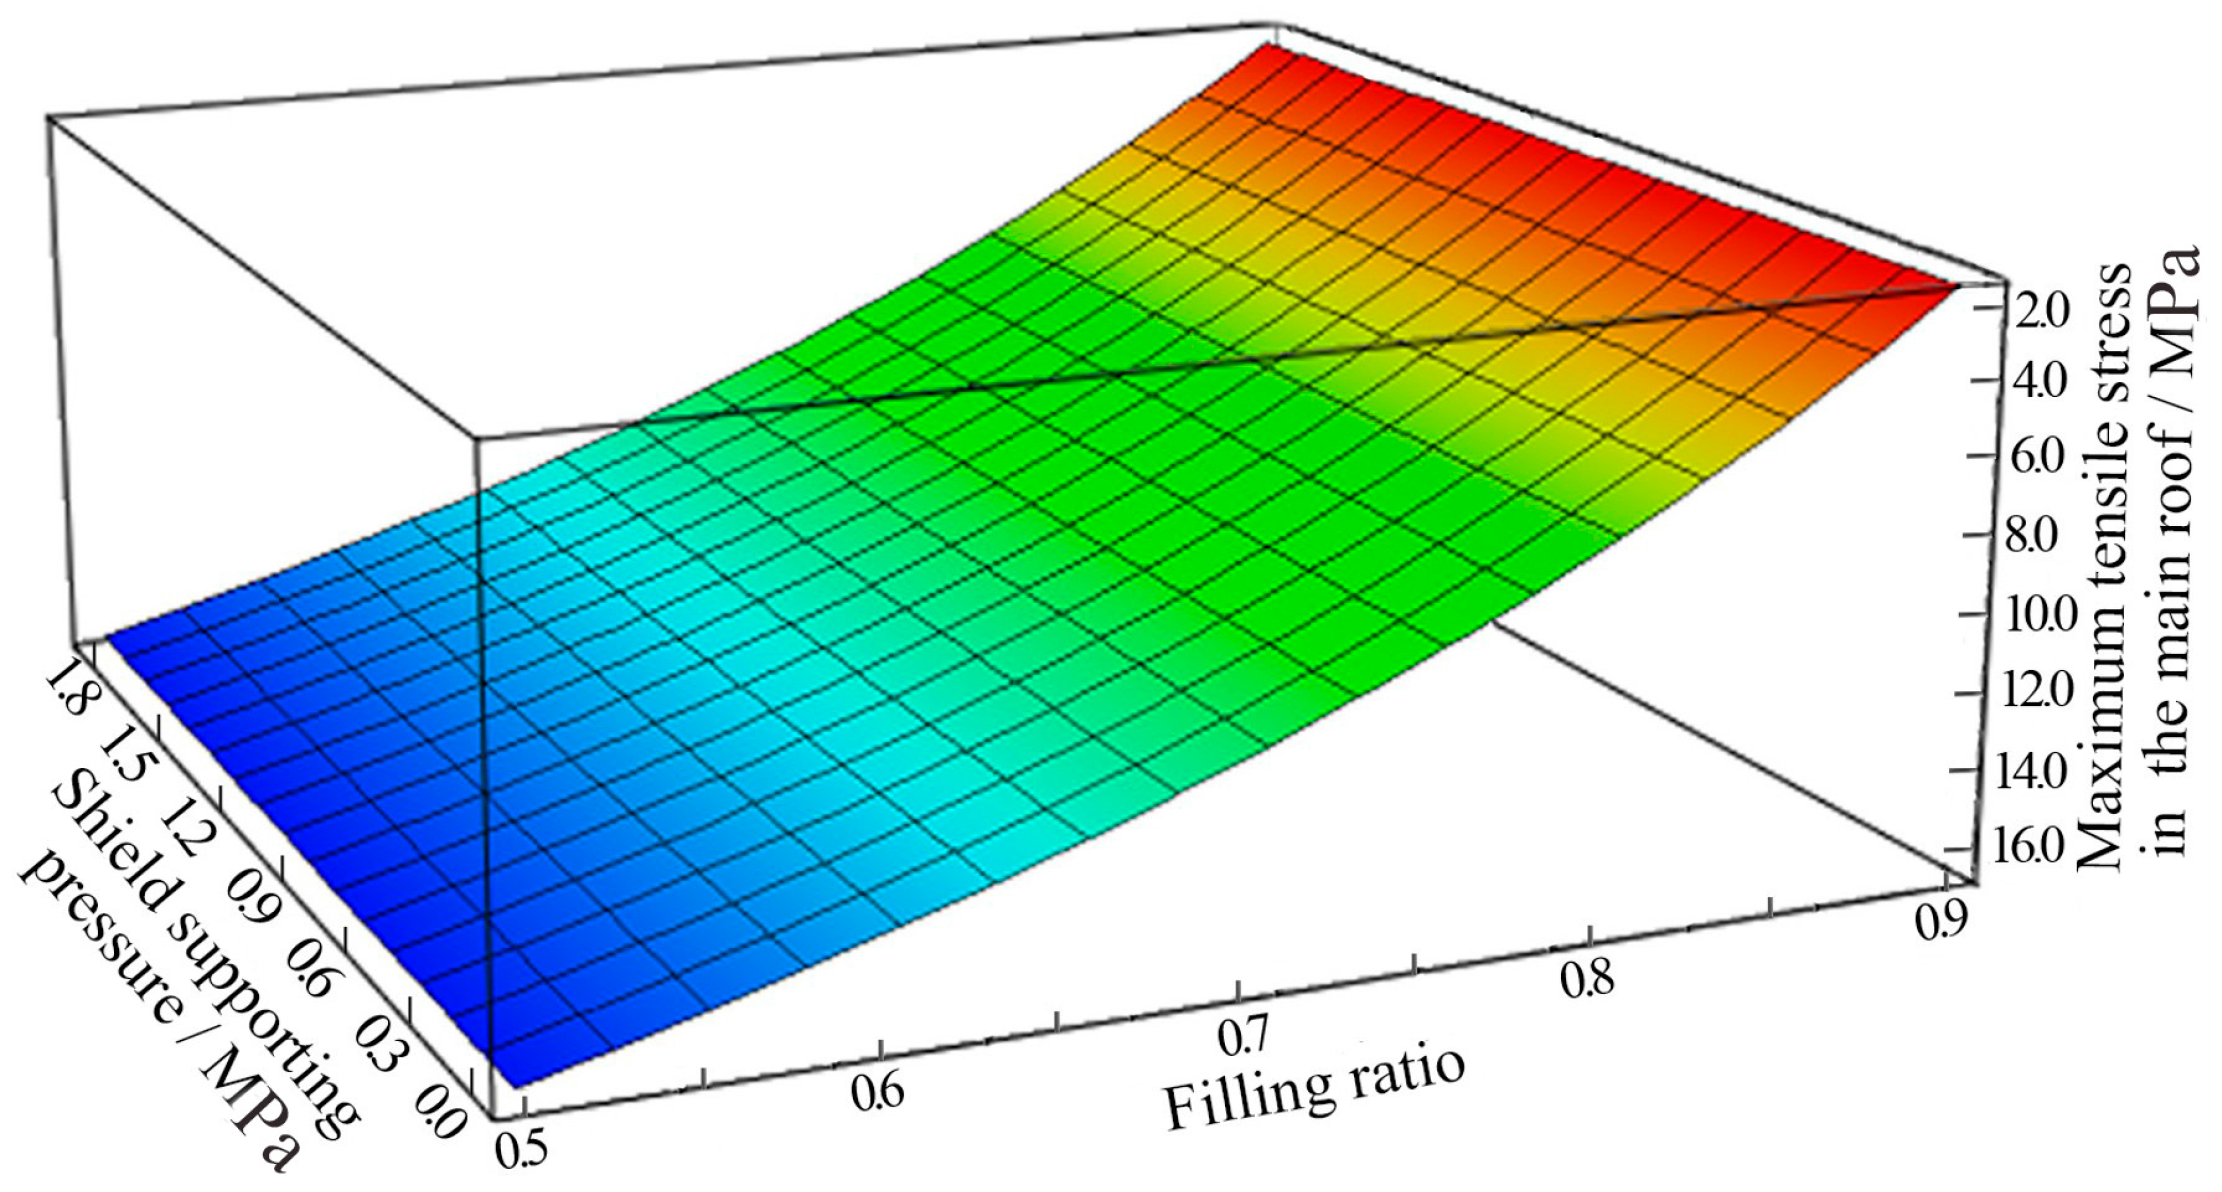
- By theoretical analysis, the main roof stability is primarily controlled by the filling ratio φ and is non-correlated to the shield supporting pressure p. The relationship between the maximum sagging of main roof within the shield canopy and shield supporting pressure was given, which shows that the support pressure has a significant control effect on the sagging of the roof within the shield canopy length, and adversely affects the filling ratio.
- (3)
- The numerical simulation results show that the maximum sagging of immediate roof and main roof decreases with the increase of the filling ratios of gob. When the filling ratio increased from 75% to 85%, the maximum sagging is decreased from 609 mm to 263 mm, respectively. With the increase of the filling ratio of gob, the peak value and the influence range of the abutment pressure are gradually reduced, and the stability period of backfill body internal pressure is shortened gradually.
- (4)
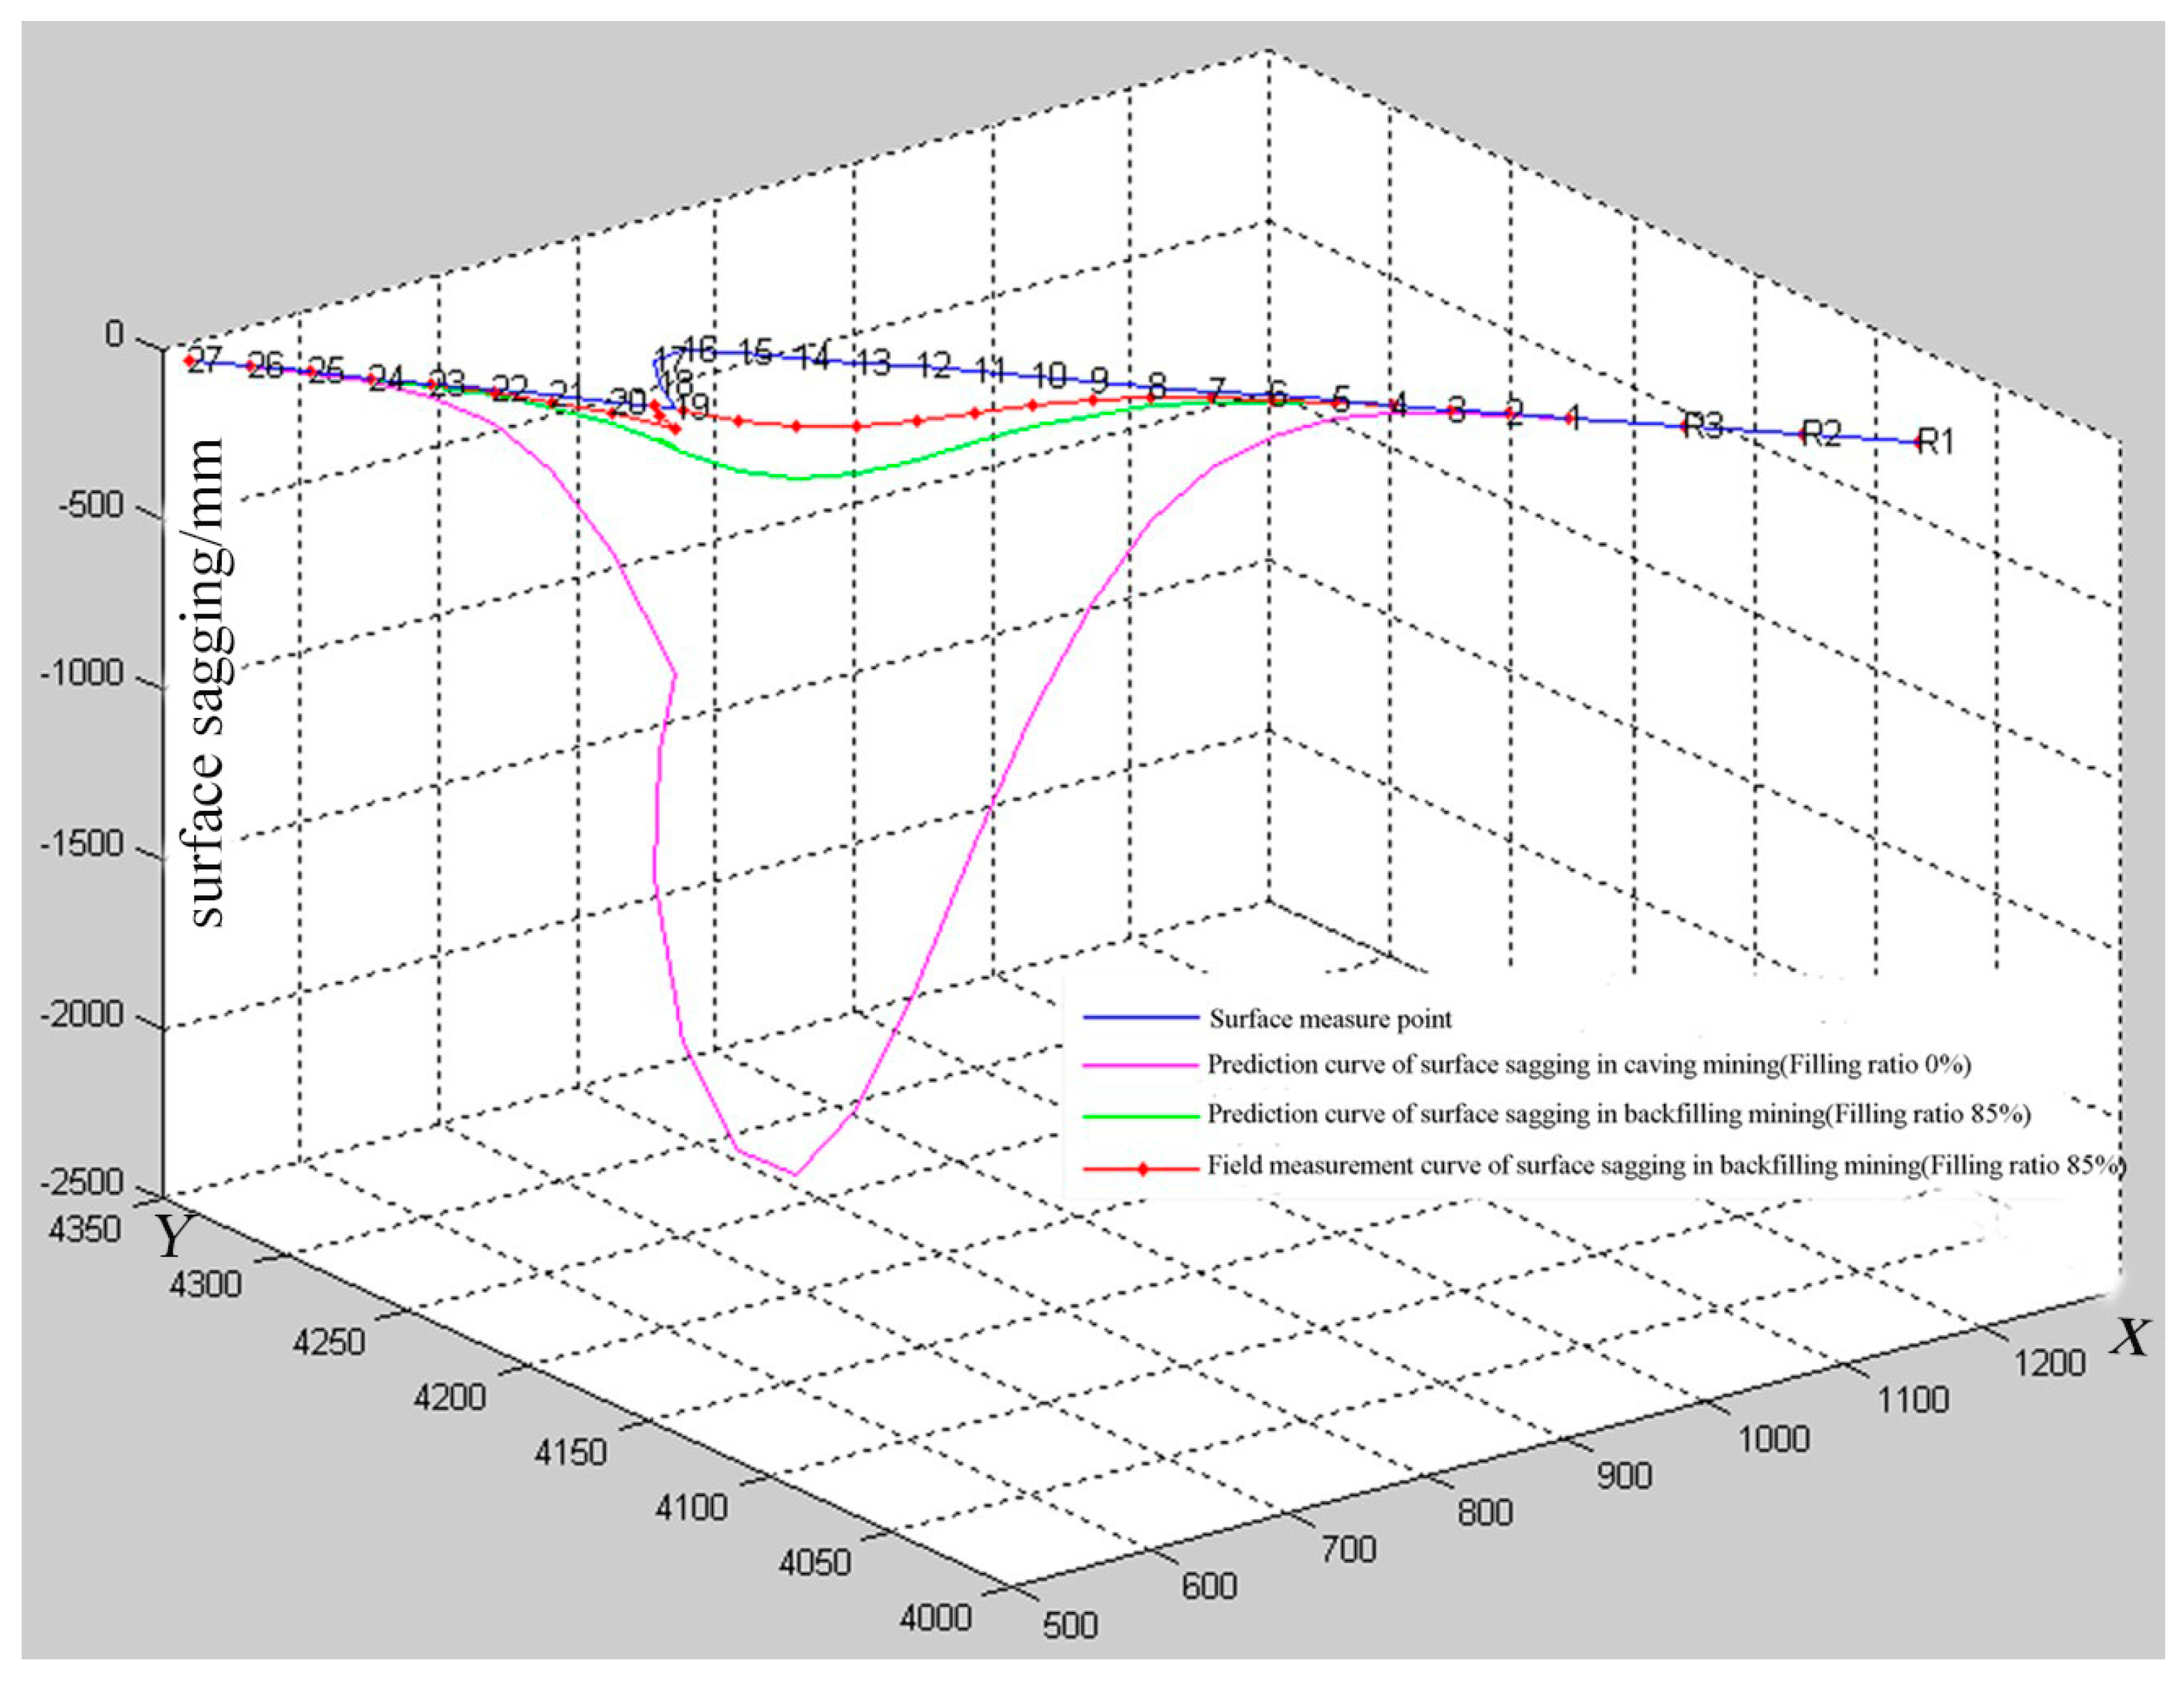
- Filling ratio of working face was determined to be 85% according to the theoretical analysis and the numerical calculation results. The abutment pressure, the sagging of roof, the backfill body internal pressure, surface sagging were monitored and analysed. Monitoring results show that the measured data are consistent with the theoretical analysis and numerical simulation results.
Acknowledgments
Author Contributions
Conflicts of Interest
References
- Morteza, S. A review of underground mine backfilling methods with emphasis on cemented paste backfill. Electron. J. Geotech. Eng. 2015, 20, 5182–5208. [Google Scholar]
- Yao, Y.; Cui, Z.; Wu, R. Development and challenges on mining backfill technology. J. Mater. Sci. Res. 2012, 1, 73–78. [Google Scholar] [CrossRef]
- Potvin, Y.; Thomas, E. Handbook on Mine Fill; Australian Centre for Geomechanics: Crawley, Australia, 2005. [Google Scholar]
- Pokharel, M.; Fall, M. Combined influence of sulphate and temperature on the saturated hydraulic conductivity of hardened cemented paste backfill. Cem. Concr. Compos. 2013, 38, 21–28. [Google Scholar] [CrossRef]
- Ghirian, A.; Fall, M. Coupled thermo-hydro-mechanical–chemical behaviour of cemented paste backfill in column experiments: Part II: Mechanical, chemical and microstructural processes and characteristics. Eng. Geol. 2014, 170, 11–23. [Google Scholar] [CrossRef]
- Yao, Y.; Sun, H. A novel silica alumina-based backfill material composed of coal refuse and fly ash. J. Hazard. Mater. 2012, 213, 71–82. [Google Scholar] [CrossRef] [PubMed]
- Miao, X.X.; Zhang, J.X.; Guo, G.L. Study on waste-filling method and technology in fully-mechanized coal mining. J. China Univ. Min. Technol. 2010, 35, 1–6. [Google Scholar]
- Zhang, J.X.; Miao, X.X.; Guo, G.L. Development status of backfilling technology using raw waste in coal mining. J. Min. Saf. Eng. 2009, 26, 395–401. [Google Scholar]
- Al Heib, M.M.; Didier, C.; Masrouri, F. Improving short- and long-term stability of underground gypsum mine using partial and total backfill. Rock Mech. Rock Eng. 2010, 43, 447–461. [Google Scholar] [CrossRef]
- Zhang, J.; Zhang, Q.; Huang, Y.; Liu, J.; Zhou, N.; Zan, D. Strata movement controlling effect of waste and fly ash backfillings in fully mechanized coal mining with backfilling face. Min. Sci. Technol. 2011, 21, 721–726. [Google Scholar] [CrossRef]
- Huang, Y.L.; Zhang, J.X.; Zhang, Q.; Nie, S.J.; An, B.F. Strata movement control due to bulk factor of backfilling body in fully mechanized backfilling mining face. J. Min. Saf. Eng. 2012, 29, 162–167. [Google Scholar]
- Bock, S.; Prusek, S. Numerical study of pressure on dams in a backfilled mining shaft based on PFC3D code. Comput. Geotech. 2015, 66, 230–244. [Google Scholar] [CrossRef]
- Yu, B.; Zhang, Z.Y.; Kuang, T.J. Stress changes and deformation monitoring of longwall coal pillars located in weak ground. Rock Mech. Rock Eng. 2016, 49, 3293–3305. [Google Scholar] [CrossRef]
- Zhang, J.X.; Li, J.; An, T.L.; Huang, Y.L. Deformation characteristic of key stratum overburden by raw waste backfilling with fully-mechanized coal minning technology. J. China Coal Soc. 2010, 35, 357–362. [Google Scholar]
- Chen, J.; Du, J.P.; Zhang, W.S.; Zhang, J.X. An elastic model of overlying strata movement during coal mining with gangue back-filling. J. China Univ. Min. Technol. 2012, 41, 14–19. [Google Scholar]
- Zhou, Y.J.; Chen, Y.; Zhang, J.X.; He, Q. Control principle and technology of final compression ratio of backfilling materials. J. Min. Saf. Eng. 2012, 29, 351–356. [Google Scholar]
- Qian, M.G. Mining Pressure and Strata Control; China University of Mining and Technology Press: Xuzhou, China, 2003. [Google Scholar]
- Guo, G.L.; Zhu, X.J.; Zha, J.F.; Qiang, W.A. Subsidence prediction method based on equivalent mining height theory for solid backfilling mining. Trans. Nonferrous Met. Soc. China 2014, 24, 3302–3308. [Google Scholar] [CrossRef]
- Seryakov, V.M. Mathematical modeling of stress-strain state in rock mass during mining with backfill. J. Min. Sci. 2014, 50, 847–854. [Google Scholar] [CrossRef]
- Li, S.Q.; Zheng, G. Analytic solution of beams on Winkler foundation under complex conditions. Chin. J. Geotech. Eng. 2008, 30, 873–879. [Google Scholar]
- Wu, L.Y. Theory of Plate and Shell; Shanghai Jiaotong University Press: Shanghai, China, 1989. [Google Scholar]
- Al-Tholaia, M.M.; Al-Gahtani, H.J. RBF-based meshless method for large deflection of elastic thin plates on nonlinear foundations. Eng. Anal. Bound. Elem. 2015, 51, 146–155. [Google Scholar] [CrossRef]
- Li, L. Analytical solution for determining the required strength of a side-exposed mine backfill containing a plug. Can. Geotech. J. 2014, 51, 508–519. [Google Scholar] [CrossRef]
- Sargsyan, A.H.; Sargsyan, S.H. Dynamic model of micropolar elastic thin plates with independent fields of displacements and rotations. J. Sound Vib. 2014, 333, 4354–4375. [Google Scholar] [CrossRef]
- Xu, Z. Elasticity; Higher Education Press: Beijing, China, 1990. [Google Scholar]
- Liu, J.H. Elastic-thin-plate bending method for evaluating reducing-subsidence effectiveness by injecting grout into separated strata in coal mine. Eng. Mech. 2009, 26, 252–256. [Google Scholar]
- Qian, M.G.; Miao, X.X.; Xu, J.L. The Theory of Key Strata in Ground Control; China University of Mining and Technology Press: Xuzhou, China, 2003. [Google Scholar]
- Peng, S.S. Coal Mine Ground Control; John Wiley & Sons Inc.: Hoboken, NJ, USA, 1978. [Google Scholar]
- Miao, X.X.; Huang, Y.L.; Ju, F.; Mao, X.B.; Guo, G.L.; Zhang, J.X. Strata movement theory of dense backfill mining. J. China Univ. Min. Technol. 2012, 41, 863–867. [Google Scholar]


| Stratum | Thickness/m | Elastic Modulus/GPa | Poisson’s Ratio | Tensile Strength/MPa | Cohesion/MPa | Internal Friction Angle/° | Density/kN·m−3 |
|---|---|---|---|---|---|---|---|
| thin sand mud interbed | 33.6 | 23 | 0.27 | 2 | 6 | 31 | 24 |
| mudstone layer | 17.4 | 20 | 0.21 | 1.5 | 5 | 26 | 23.6 |
| sandstone layer | 31.5 | 28 | 0.25 | 2 | 7 | 28 | 26.3 |
| shale layer | 5.3 | 25 | 0.24 | 3.5 | 8 | 32 | 25.4 |
| coal seam | 3.3 | 3.5 | 0.33 | 0.1 | 1 | 25 | 14 |
| sandstone layer | 15.9 | 23 | 0.27 | 2 | 8 | 32 | 24 |
| Monitoring Items | Instruments | Model | Range |
|---|---|---|---|
| sagging of gob roof | Monitor for sagging of gob roof | GUD500 | 0–500 mm |
| backfill body internal pressure | Monitor for backfill body internal pressure | GPD30 | 0–30 MPa |
| abutment pressure | Borehole stress meter | GZY25 | 0–25 MPa (adapt to the borehole of 45–50 mm) |
| Compared Items | Prediction | Field Measurement | |
|---|---|---|---|
| Filling ratio | 0% | 85% | 92.2% |
| Equivalent mining height/mm | 3300 | 580 | 340 |
| Maximum sagging/mm | 2040 | 220 | 173 |
| Maximum horizontal deformation/mm | 9.5 | 0.66 | 0.2 |
| Damage level of building | III level, ponding | I level (very slight) | I level (very slight) |
© 2016 by the authors; licensee MDPI, Basel, Switzerland. This article is an open access article distributed under the terms and conditions of the Creative Commons Attribution (CC-BY) license (http://creativecommons.org/licenses/by/4.0/).
Share and Cite
Huang, Y.; Li, J.; Song, T.; Kong, G.; Li, M. Analysis on Filling Ratio and Shield Supporting Pressure for Overburden Movement Control in Coal Mining with Compacted Backfilling. Energies 2017, 10, 31. https://doi.org/10.3390/en10010031
Huang Y, Li J, Song T, Kong G, Li M. Analysis on Filling Ratio and Shield Supporting Pressure for Overburden Movement Control in Coal Mining with Compacted Backfilling. Energies. 2017; 10(1):31. https://doi.org/10.3390/en10010031
Chicago/Turabian StyleHuang, Yanli, Junmeng Li, Tianqi Song, Guoqiang Kong, and Meng Li. 2017. "Analysis on Filling Ratio and Shield Supporting Pressure for Overburden Movement Control in Coal Mining with Compacted Backfilling" Energies 10, no. 1: 31. https://doi.org/10.3390/en10010031