Article

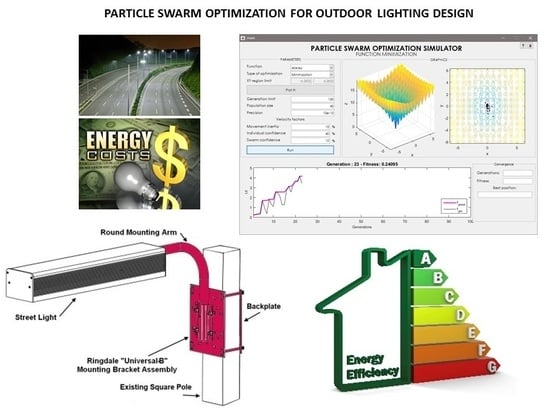
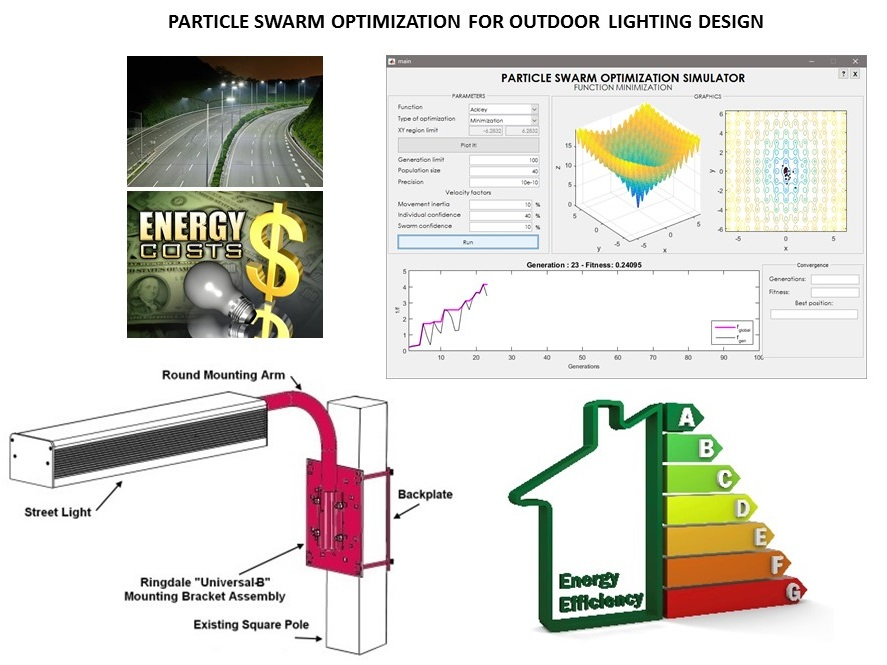
Particle Swarm Optimization for Outdoor Lighting Design

by
Ana Castillo-Martinez
1,
Jose Ramon Almagro
2,
Alberto Gutierrez-Escolar
1,
Antonio Del Corte
3,*,
José Luis Castillo-Sequera
1,
José Manuel Gómez-Pulido
1 and
José-María Gutiérrez-Martínez
1
1
Department of Computer Sciences, Polytechnic School, University of Alcala, Madrid-Barcelona Road, Km 33.6, 28871 Alcala de Henares, Spain
2
Airbus Defence and Space, Gunnels Wood Road, Stevenage, Hertfordshire SG12AS, UK
3
Department of Computer Engineering, Polytechnic School, University of Alcala, Madrid-Barcelona Road, Km 33.6, Alcala de Henares 28871, Spain
*
Author to whom correspondence should be addressed.
Energies 2017, 10(1), 141; https://doi.org/10.3390/en10010141
Submission received: 31 October 2016 / Revised: 11 January 2017 / Accepted: 18 January 2017 / Published: 23 January 2017

Abstract

:
Outdoor lighting is an essential service for modern life. However, the high influence of this type of facility on energy consumption makes it necessary to take extra care in the design phase. Therefore, this manuscript describes an algorithm to help light designers to get, in an easy way, the best configuration parameters and to improve energy efficiency, while ensuring a minimum level of overall uniformity. To make this possible, we used a particle swarm optimization (PSO) algorithm. These algorithms are well established, and are simple and effective to solve optimization problems. To take into account the most influential parameters on lighting and energy efficiency, 500 simulations were performed using DIALux software (4.10.0.2, DIAL, Ludenscheid, Germany). Next, the relation between these parameters was studied using to data mining software. Subsequently, we conducted two experiments for setting parameters that enabled the best configuration algorithm in order to improve efficiency in the proposed process optimization.

Graphical Abstract

1. Introduction

Outdoor lighting is an essential service for modern life, creating a welcoming feeling that is able to increase night activity, reducing crime at the same time [1]. However, its main drawback is the high amount of energy needed to provide this service. Some studies have highlighted that outdoor lighting installations are responsible for 2.3% of the global electricity consumption [2]. Despite this proportion seeming small, in terms of municipalities, outdoor lighting installations consume up to 80% of the amount of electric energy consumed by the entire municipality, being responsible for up to 60% of the energy bill [3].
Analyzing the case in Spain, if we pay attention to the power of the lamps, it can be seen Spain has one of the highest values in the European Union, with an average of 157 W per lamp, well above the 76 W of the United Kingdom or the 61 W of the Netherlands. This high power, together with the growing concern about energy efficiency, has caused the implementation of several regulations to try to raise the energy efficiency of this sort of installation [4]. Despite these efforts, the regulations have not obtained the expected results yet, and the energy consumption of outdoor lighting installations continues to grow [5]. Nevertheless, several studies have highlighted that it is possible to reduce the energy costs up to 45% thanks to different measures such as the reduction of the illumination level; the improvement of the reflection quality of the luminaires; the implementation or upgrade of regulation; or the removal of light pollution [6]. However, most of these improvements are related to the design phase, the reason why this manuscript is focused on that aspect.
One of the main problems with the design of outdoor lighting installations’ is to preserve compliance with existing standards and, at the same time, try to satisfy the desired level of energy efficiency. To study these aspects there are several tools such as AutoCAD or DIALux, among others, which can help the visualization due to their capability to show a virtualization of reality and, in the case of DIALux, the photometric characteristics of an area. The main difficulty in using these tools arises when we try to optimize some of the characteristics of the installation, such as the lamps’ power or the distance between luminaires, due to its impact on multiple final factors. For that reason, it is important to define the most important parameter to optimize.
According to the research performed by Gómez-Lorente [7], who wanted to maximize the overall uniformity and the efficiency of the installations at the same time, it is possible to realize that there is a clear linear relationship between both parameters. This relation shows how the overall uniformity decreases when the energy efficiency increases, making the goal of maximizing both parameters difficult. On the other hand, according to the Spanish Royal Decree [4], to guarantee the quality of the light, the overall uniformity should not be lower than 0.4. Therefore, the best option to improve the quality of the outdoor lighting installation and to maximize its energy efficiency is adjusting the value of the overall uniformity to 0.4 to ensure that the installations comply with the lighting regulations.
There are several algorithms that can help with the optimization of the installations. However, one of the most employed algorithms to optimize engineering problems is called the particle swarm optimization (PSO) algorithm [8,9,10]. Its successful performance, even when it is compared to other modern optimization techniques [11,12], as well as its simplicity and effectiveness in solving optimization problems make this sort of algorithm an interesting option to use to develop an outdoor lighting optimization algorithm which can help in the design phase. Hence, PSO algorithms are useful for simulation optimization approaches where an application-independent algorithm may help with the run time, which is a real concern for practical applications [13]. However, the PSO algorithms sometimes are not effective and accurate for solving nonlinear equations, with other techniques being necessary for hybridization with other algorithms [14,15]. Despite the drawback of this sort of algorithm, this paper presents a new version of a PSO algorithm to help in the search for the configuration of street lighting systems with higher energy efficiency. Furthermore, the algorithm has a flexible configuration and allows us to set the known configuration values of the system, searching for the best configuration which allows us to keep them and increase their energy efficiency.
The paper is organized as follows. Firstly, the most important characteristics of outdoor lighting installations are analyzed in order to identify the best parameter to optimize. Secondly, a description of the selected algorithm is presented. Next, the manuscript includes two experiments with the purpose of obtaining the best configuration of the different algorithm parameters. To summarize, a conclusions section is presented in order to show the most relevant conclusions obtained after the algorithm’s development.

2. Outdoor Lighting

2.1. Energy Efficiency Classification

The main goal of outdoor lighting is to produce a safe environment and comfortable vision when natural light is not enough. Proper lighting helps to protect drivers and observers, creating a welcoming feel to an area as well as thwarting criminal activities [16]. However, an excess of illumination might lead to high energy consumption. To avoid this, illumination must not be excessive. A sustainable lighting installation should minimize electricity consumption per lux, which is the unit of illuminance. This is why the developed algorithm is focused on obtaining the best outdoor lighting installation setting configuration, to ensure the highest value for energy efficiency.
The first point to evaluate the energy efficiency in street lighting installations is to know the sort of lighting areas to ensure that the evaluated system complies with the current regulation. This division is important in order to specify the amount of required light to ensure citizens’ security, adapting the requirements in each context. The areas are divided into two types [17]:
  • Functional street lighting: It encompasses lighting installations for motorways, dual carriageways, urban streets and roads.
  • Ambient street lighting: It is generally placed on low supports in urban areas for lighting pedestrian and commercial areas, pavements, parks and gardens, historic centers and roads with low speeds limits.
Once the type of area is known, it is possible to check the minimum lighting requirements of the system, which are established in the regulations [4].
According to the Spanish Royal Decree 1890/2008 [4], energy efficiency ( ε ) is defined by three parameters: the lit-up area (S), the average illuminance ( E m ) and the active power (P). Equation (1) shows how to calculate this magnitude:
ε =   S ×   E m P ( m 2 × lux W )
As can be seen, two of the three parameters needed, the lit-up area and active power, can be obtained directly from the characteristics of the elements of any installation. To obtain the value of the average illuminance, a measure of the illuminance of the installation in a specific area is necessary. To ensure that these measures follow the Royal Decree [4], it is necessary to measure the illuminance at different points through a 3 × 5 grid placed between two light points. If both streetlights have the same characteristics, this method can be simplified with the measure of only nine points. Figure 1 shows the points of the grid that must be measured to obtain the average illuminance.
Despite the fact that the previous equation allows us to obtain the energy efficiency, to set the energy class, another parameter is used: the energy efficiency index. This value must be calculated as shown in Equation (2):
I ε =   ε ε R
where ε R . is the energy efficiency reference which is set in the regulations. As this value lets us obtain the classification of the energy efficiency of the installation, the algorithm will use this parameter to set the energy efficiency of the installation.
Another important parameter for lighting is the overall uniformity, represented in lighting plans by the U0 symbol. This magnitude is a ratio of the minimum illuminance level to the average illuminance level. An overall uniformity value of 0.4, or 40%, is recommended to ensure that lighting installations do not create dark patches next to lighter patches. This effect makes it difficult for our eyes to adjust quickly enough to see if it is safe to proceed along any route. Furthermore, low uniformity ratios, such as frequent changes of contrasting high- and low-lit road segments, may cause enormous eye discomfort, leading to stress and tiredness which may often have a negative impact on road safety [18]. In other words, uniformity is what distinguishes a good quality road lighting installation from a poor one [19]. Thus, a good lighting system is one that is designed to distribute an appropriate amount of light evenly with uniformity values of 0.40 using lamps with a rating of at least 60 on the color rendering index (CRI) [20].

2.2. Lighting Systems

As can be seen, there many parameters that may change the final result of the energy efficiency index. The outdoor lighting systems are characterized by many parameters, and the design involves a large number of variables [21]. Because lighting designers are not exploiting all of the available possibilities for energy savings [22], the developed algorithm will help them to obtain the best parameter configuration to obtain the highest energy efficiency index, guaranteeing, at the same time, a minimum overall uniformity of 0.4.
The algorithm is based on a linear regression, which has been developed through the data of 500 installations obtained thanks to DIALux software [23], which is used in the design phase of outdoor lighting installations. In this way, the algorithm is able to take into account parameters with high impact on the installations which are impossible to manage in another way, such as the maintenance factor.
To perform the final evaluation, data mining software called WEKA (3.8, University of Waikato, Hamilton, New Zealand) was used. This tool is able to provide the equation to acquire the value of the variable that we wanted to optimize through the data obtained with DIALux. As a result, we have obtained two different equations: one to evaluate the energy efficiency factor ( I ε ), and another to evaluate the overall uniformity (U0). Both equations will be used in the algorithm to search for the configuration with the highest energy efficiency with an overall uniformity at least of 0.4, as is set in the regulations.

3. Particle Swarm Optimization for Outdoor Lighting Optimization

PSO is a metaheuristic optimization technique that was developed in 1995 by Kennedy [24] and Eberhart [25], which is particularly efficient in dealing with numerical optimization problems. This evolutionary optimization algorithm was inspired by the social behavior of groups of insects and animals such as swarms of bees, flocks of birds, and shoals of fish [26]. The base of the PSO algorithm is to mimic the social models of food searching to extrapolate them to optimize real problems.
In PSO, a population called a swarm is generated randomly and it is composed of individuals, named particles. Each particle flies around the search field, where each position represents each potential solution to the problem, adjusting the movements by its own knowledge and that of the entire swarm’s previous best performance in an attempt to identify better positions in a cooperative manner [27]. In every iteration, the particles randomly vary their velocity and follow the particle that finds the best solution in their environment according to a fitness value of the optimized function. This particle is called the leader. The particle position X is updated with each iteration, varying, at the same time, its velocity. This velocity is added to the position of each particle to move it from a time t − 1 to t [8].
The PSO algorithm can be divided into the following steps:
1.
First of all, the algorithm has to initialize the population with random positions, as in Equation (3), and velocities, as in Equation (4), in the search space.
x i = ( x , x i 2 , , x i d , , x i n )
v i = ( v i 1 , v i 2 , , v i d , , v i n )
2.
Analyze value of each particle according to a fitness function, selecting the particle with the best solution as the leader.
3.
Update the velocity of each particle according to the following Equation (5):
v k + 1 i ( t ) = w * v k i + φ 1 ( p k i x k i ) + φ 2 ( p g x k i )
As can be seen, the velocity of the particle is formed by three different parts. The first part is the product of the previous particle velocity ( v k i ) and the inertia weight of the particle ( w ) , which controls the tradeoff between the different explorations performed. The second part is the difference of the position between the best solution found by the particle ( p k i ) and the last particle position multiplied by the acceleration coefficients that control the relative effect of the personal best solution ( φ 1 ), which form the cognitive part representing the learning through its previous experience. The last part, which represents the social part of the group learning, is the difference between the position of the best solution found by the swarm ( p g ) and the last particle position multiplied by the acceleration coefficients that control the relative effect of the global best solution ( φ 2 ).
4.
Update the position of each particle according to Equation (6):
x k + 1 i = x k i +   v k + 1 i
5.
Evaluate the quality of each particle according to a fitness function, which is also the objective function, in our case the function which calculates the energy efficiency of the outdoor lighting installation.
6.
Check the quality of the particle result. In case the quality of the solution is better than the best particle result, it will be updated with the value of the current particle.
7.
In case one of the solutions reached by any of the particles is better than the current leader, the leader of the swarm is updated.
8.
Check if the maximum number of iterations has been reached or if the best solution fits the fitness value. In case the maximum number of iterations is not reached, the algorithm will go to the third step again.

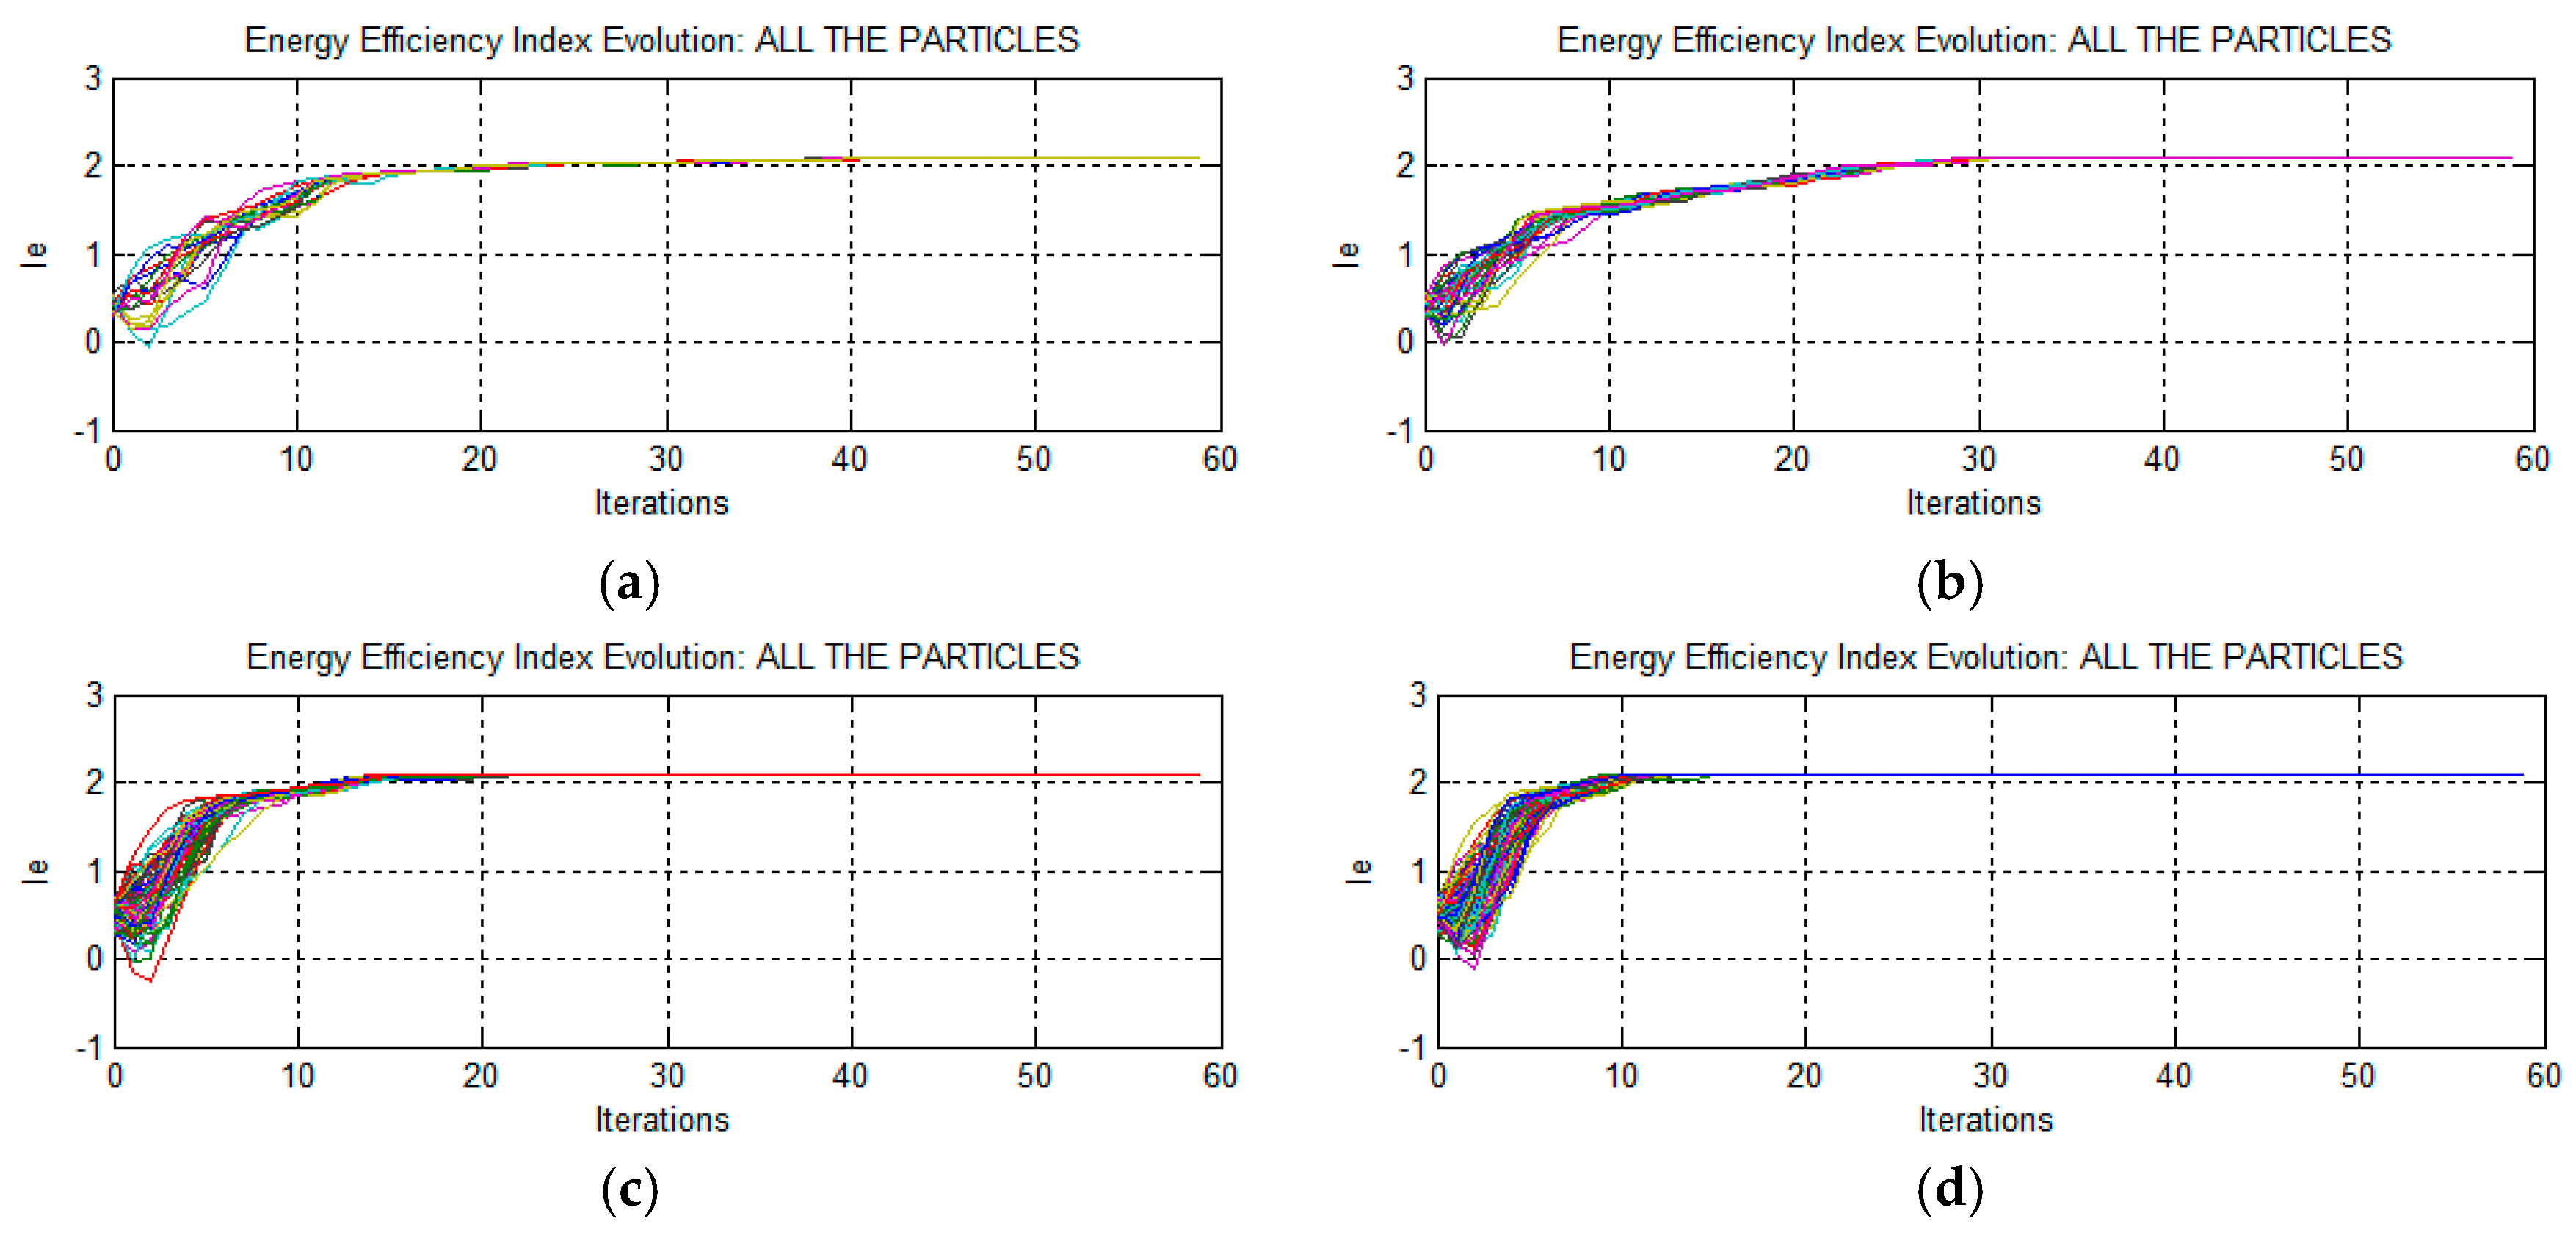
4. Experiments and Discussion

The proposed PSO algorithm is tested in this section. To improve its performance, it is necessary to set the parameter which determines the best algorithm configuration in order to improve its efficacy in optimizing a given problem. To obtain the best configuration, the following parameters were modified:
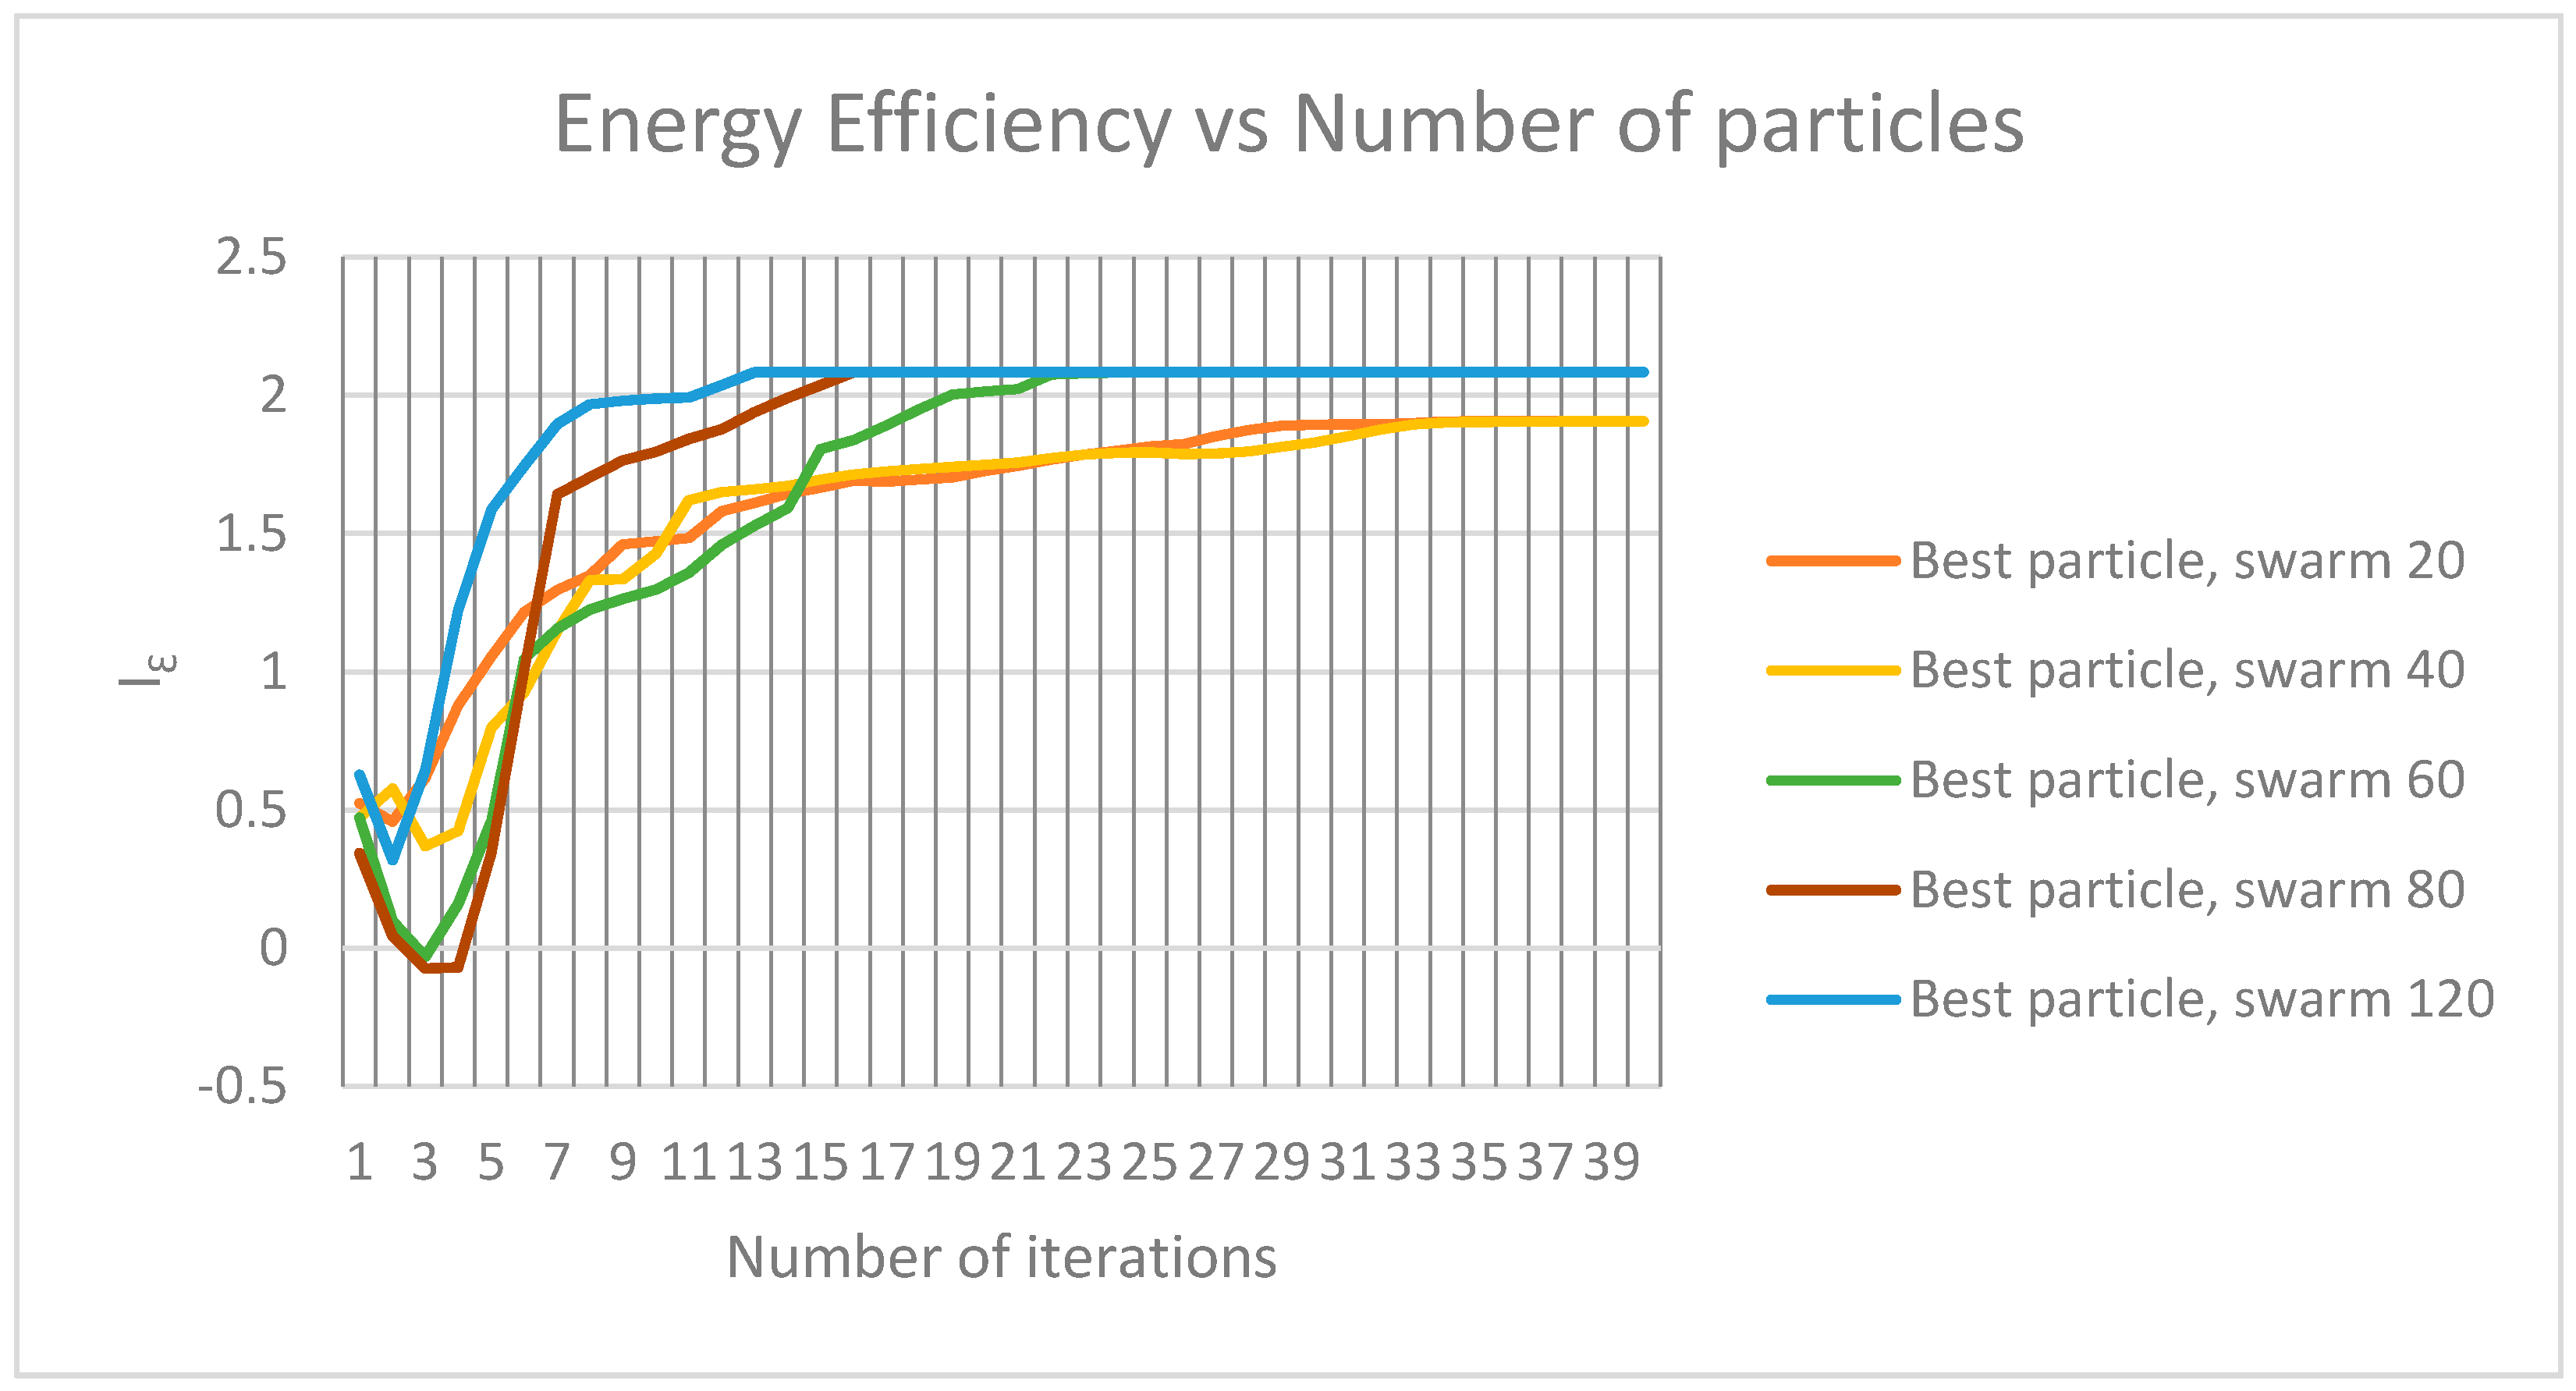
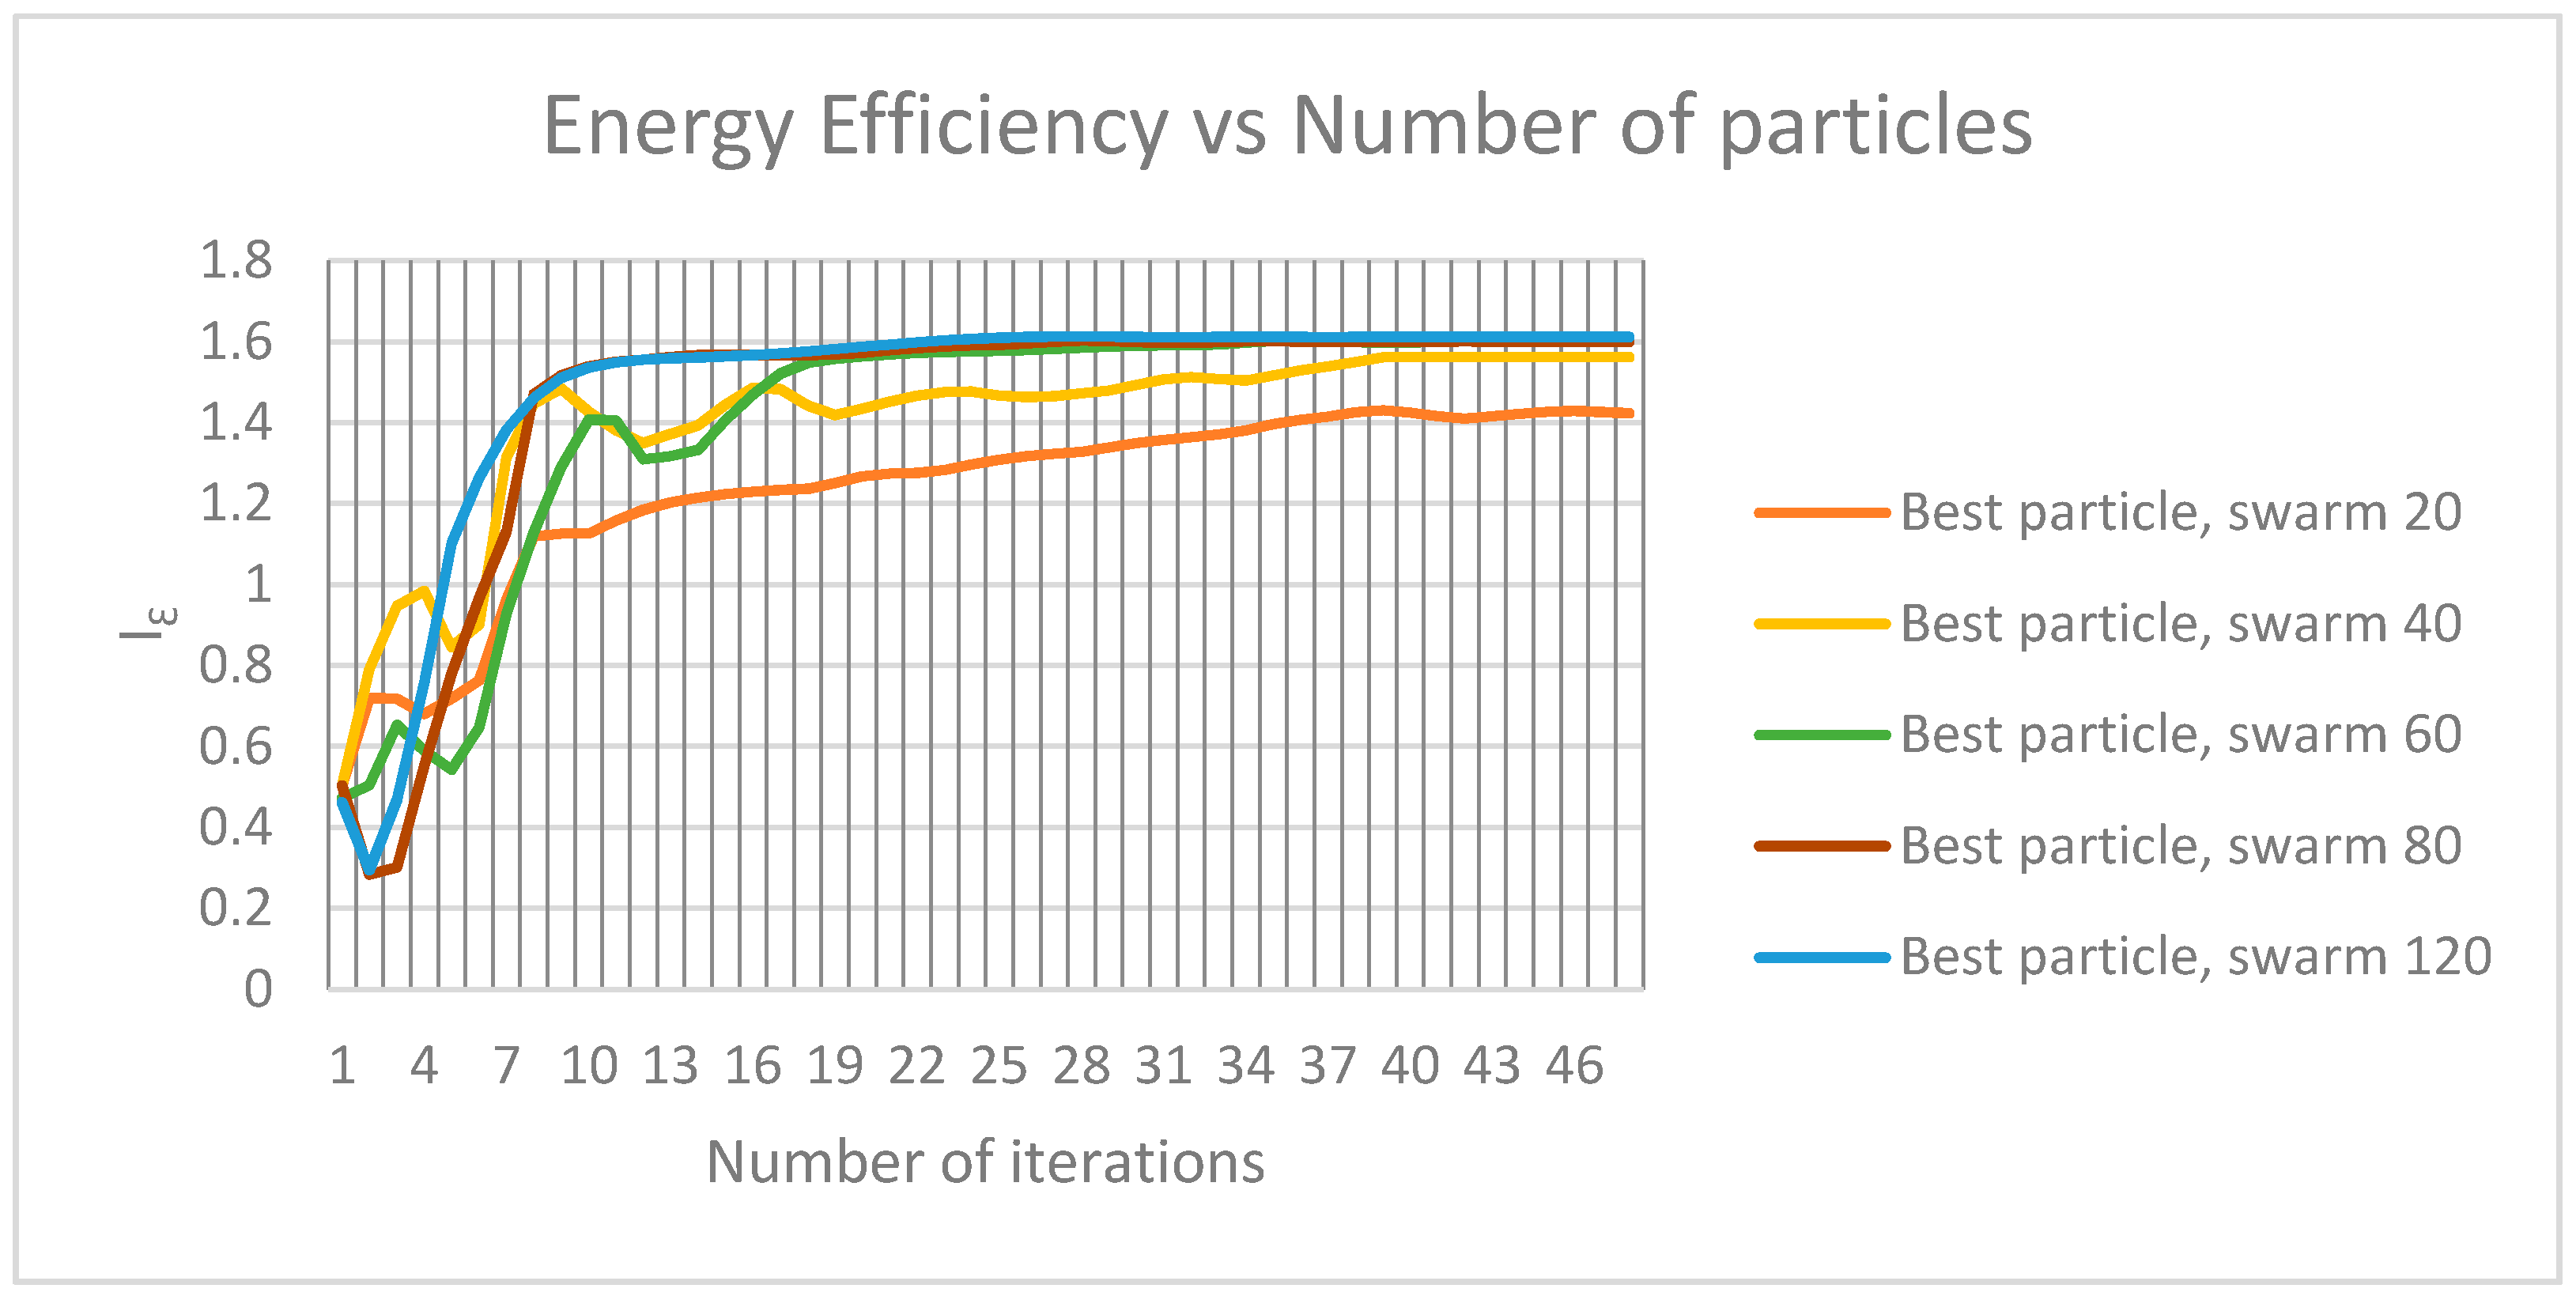
  • Number of particles in swarm = {20, 30, 40, 50, 60, 70, 80, 100, 120}.
  • Number of iterations = {1–60}.
  • Inertia weight (ω) = {0.1, 0.3, 0.5, 0.7, 0.8, 0.9, 1.1, 1.3, 1.5, 1.7}.
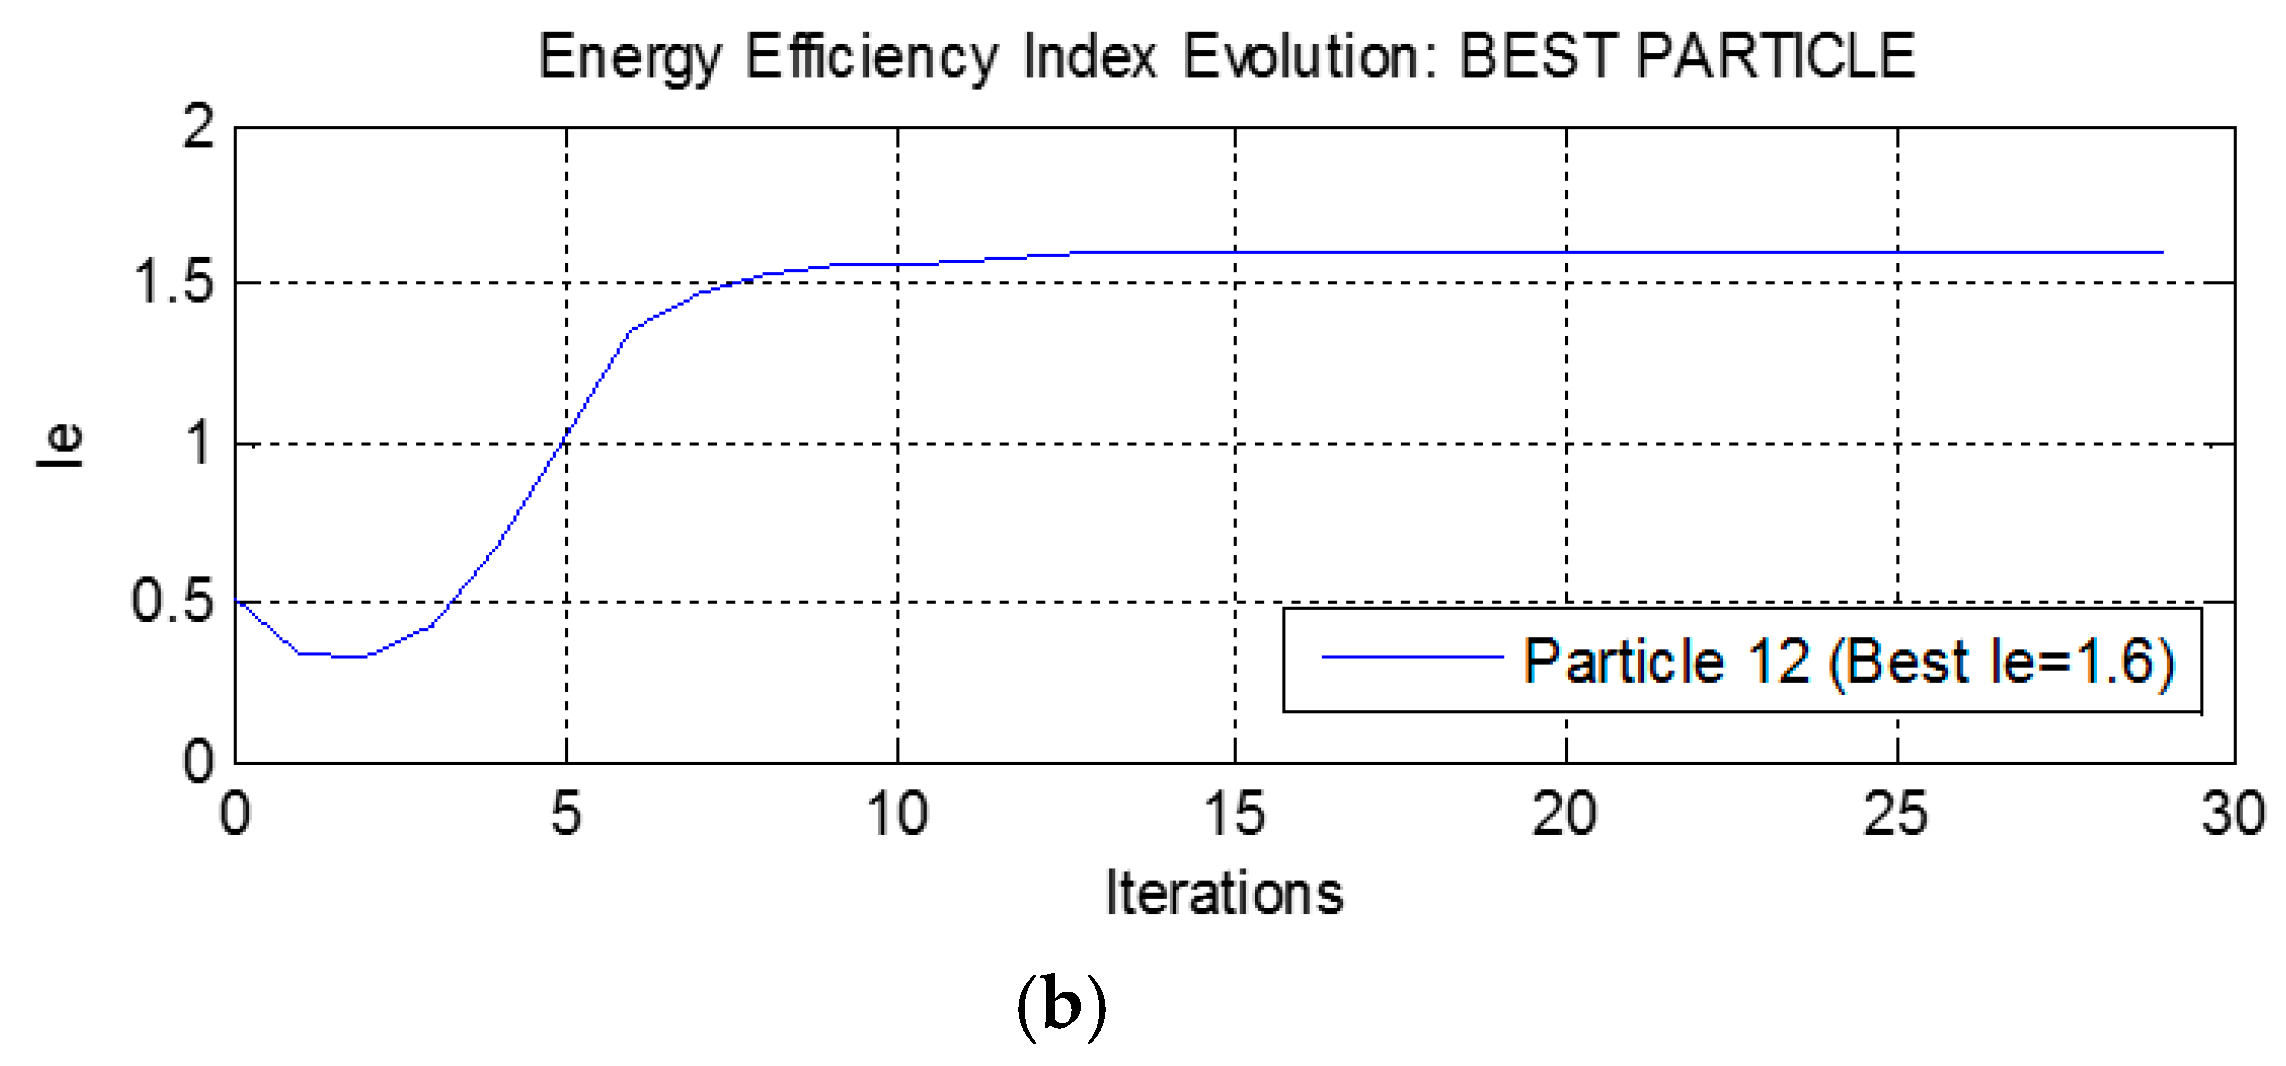
To ensure that the algorithm produces overall good results in different situations, two experiments were carried out in order to determine the effects of the different configurations of outdoor lighting installations on the algorithm behavior. Once all the values of the evaluations were obtained, aspects such as the convergence value or the highest energy efficiency coefficient given by the solution were studied. The results of this experiment are shown in the following sections. Due to this kind of algorithm having a random factor, each simulation was performed 100 times, with the average values of the results obtained from all the simulations used in this manuscript.

4.1. Experiment 1

The aim of this experiment was to find the best configuration for the algorithm when most of the features of the new installation are not known. Although this situation is not the most common, where the elements that compose the installations are unknown, it could be interesting in order to evaluate the algorithm when it has to manage a high number of variables. For that reason, the only fixed parameters are the width of the road and the separation between the luminaire and road.
Analyzing firstly the inertia weight parameter, the algorithm was tested with different inertia weights. Although there are some studies that show that values of inertia weight between 0.4 and 0.9 are widely accepted in the literature [28], the simulations were carried out with values from 0.1 to 1.7 to have more data to contrast with the results of these studies. The goal of these simulations was to obtain the highest energy efficiency index for the installation at the same time that the level of the convergence of the particles was studied. A non-convergence behavior means that the parameter of the inertia weight sets is inadequate due to it being impossible for the particles to reach an absolute maximum. Table 1 shows the results of the simulations performed varying the inertia weight, where it can be seen how the best option, which obtained not only the best value of the energy efficiency index but all its particles converged to this value, is 0.7.
However, the number of iterations needed to reach this value is different in each case. Due to the number of particles and iterations being related to the amount of memory needed to execute the algorithm, a search for the best configuration of these parameters is needed. This configuration must give us the opportunity to save resources without diminishing the effectiveness of the algorithm. Table 2 shows the maximum energy efficiency index obtained for each configuration as well as the iteration number when it was obtained, and the amount of memory required to store all the values.
As can be seen in Table 2, the configuration of the algorithm with less memory requirements was composed by 20 particles and this was also the configuration that needed a high number of iterations to converge. However, the maximum value obtained with this configuration of 20 particles never reached the same value of the other cases. If the behavior of the particles is analyzed deeply, as is shown in Figure 2, it can be seen how the swarm particles’ movements to reach the maximum values were discovered as the simulation progressed. When a particle finds a maximum value it notifies the others to inform them of the need to change their position towards that maximum. The randomness of this algorithm makes the movement of particles in each simulation different. The algorithm must stop when all the particles have converged at the same value. However, to better reflect the particles’ behavior, Figure 2 shows the particles’ searches for different particle swarm sizes. To better observe the convergence of the particles, the algorithm only stops when the number of iterations is 60.
Paying attention to the configurations when the highest value for the energy efficiency index was reached, it can be observed that the best parameter setting was formed by a population of 120 particles due to the algorithm being able to obtain the best solution earlier than the 20th iteration. Figure 3 shows the behavior of the particle that reached the optimal solution in fewer iterations in the different swarm population size simulations. Figure 3 also shows how the swarm particles size is related to the number of iterations needed to reach the highest energy efficiency index value.
In the case of small populations, the slower level of convergence can be appreciated, due to the proportion of the search area per particle being higher, making the particles move more to reach the maximum values. On the other hand, having a small population can also cause the local maximum values to be obtained for each particle, making it more difficult to find an absolute maximum. This situation can be solved using advanced techniques for this algorithm. The use of a higher swarm population could help to minimize these problems but with the drawback of a higher computational cost; this is the reason why it is important to find the best configuration. In the case of this experiment, it is possible to obtain a high level of energy efficiency with a population of at least 60 particles.

4.2. Experiment 2

This second experiment was focused on finding the best parameter setting to configure the algorithm in the case of the user knowing most of the values of the installation. Contrary to the previous experiment, this experiment is the most common situation where users have at least the information about the road to illuminate and the luminaries. The most interesting part of this experiment is to contrast the results of the algorithm configuration with the previous experiment.
Starting with the analysis of the inertia weight, it was realized that the best parameter configuration matched with the experiment 1. That means that the influence of the number of searching parameters has no high influence on the particles’ movement behavior.
In contrast to what happened in the previous experiment, the number of iterations needed to achieve the highest value was the same as in the case of the highest population, as well as both inertia factors.
Studying in-depth the behavior of all experimental populations, it is possible to see some similarities with the previous experiment. Figure 4 shows how a small number of particles caused the optimal solution to fall into a local maximum. However, if we grew the number of particles, the probability of finding an absolute maximum grew, maximizing the efficiency of the variables under study. In this experiment, it can be seen how it was possible to obtain the maximum energy efficiency index value with a population of at least 60 particles. On the other hand, if we increased this population, the convergence to an optimum value was faster, requiring a lower number of iterations.
Figure 5 shows the evolution of each particle in a swarm of 80 particles. It can be appreciated how each particle started at a random value and evolved according to the optimal values found by the particle and also to the optimal values found by the other swarm particles. As the number of iterations grew, all the particles tried to converge at the same value, maximizing the objective function.

4.3. Algorithm Validation

To check if the algorithm’s performance was appropriate, it was necessary to compare the outputs of both experiments. Therefore, we simulated three different cases with DIALux software and the obtained outputs were analyzed with the outputs of the algorithm.
The selected cases have the same characteristics except the distance between luminaires, which was different in the three cases. Table 3 shows the value of the energy efficiency index obtained with DIALux software and the developed algorithm. As can be appreciated, the deviation is reasonably acceptable for using the algorithm as a new design tool.

5. Conclusions

For solving an outdoor lighting energy efficiency optimization model, we presented the use of a PSO algorithm.
One of the most influential parameters studied in this manuscript, and that which had a high impact on the results of the algorithm, was the inertia weight. Despite several studies that have shown that values between 0.4 and 0.9 can reach the maximum values, we consider that the range of values between 0.4 and 0.9 is high and the results obtained with them are too different, which is why we need to find the most optimal value for each case.
Focusing on the number of particles needed in each case, we found that a minimum population of 60 was needed to find the best solution in both experiments. However, the number of iterations required to converge to a maximum value was different in each experiment. It was shown how a lower number of variables require a higher number of iterations because it is more difficult to reach the minimum value of 0.4, which is required by the Spanish Royal Decree for overall uniformity.

Author Contributions

Alberto Gutierrez-Escolar, José Luis Castillo-Sequera and José Manuel Gómez-Pulido have contributed to developing ideas about energy efficiency and collecting the training data. Ana Castillo-Martinez and Jose Ramon Almagro programmed the algorithm, and Antonio del Corte, and José-María Gutiérrez-Martínez tested it. All the authors were involved in preparing the manuscript.

Conflicts of Interest

The authors declare no conflict of interest.

References

  1. Lorenc, T.; Petticrew, M.; Whitehead, M.; Neary, D.; Clayton, S.; Wright, K.; Thomson, H.; Cummins, S.; Sowden, A.; Renton, A. Environmental interventions to reduce fear of crime: Systematic review of effectiveness. Syst. Rev. 2013, 2. [Google Scholar] [CrossRef] [PubMed]
  2. Reusel, K.V. A look ahead at energy-efficient electricity applications in a modern world. In Proceedings of the Energy Climate Technology 2008, Bergen, Norway, 17–18 April 2008.
  3. AAE—Agencia Andaluza de la Energía. Guía de ahorro y Eficiencia Energética en Municipios (Guide for Savings and Energy Efficiency un Municipalities). Aviliable online: https://www.agenciaandaluzadelaenergia.es/sites/default/files/guia_de_ahorro_y_eficiencia_energxtica_web_def1.pdf (accessed on 14 November 2014).
  4. Spanish Government. Royal Decree 1890/2008 Energy Efficiency for Outdoor Lighting Installations; Spanish Government: Madrid, Spain, 2008.
  5. De Miguel, A.S.; Zamorano, J.; Castaño, J.G.; Pascual, S. Evolution of the energy consumed by street lighting in Spain estimated with DMSP-OLS data. J. Quant. Spectrosc. Radiat. Transf. 2014, 139, 109–117. [Google Scholar] [CrossRef] [Green Version]
  6. Herranz, C. Entrevista con Alfonso Beltrán García-Echaniz, Director General del Instituto para la Diversificación y Ahorro de la Energía (IDAE). Física y Sociedad. 2011, Volume 21, pp. 26–29. Available online: http://www.cofis.es/pdf/fys/fys21/fys21_26-29.pdf (accessed on 19 January 2017).
  7. Gómez-Lorente, D.; Rabaza, O.; Estrella, A.E.; Peña-García, A. A new methodology for calculating roadway lighting design based on a multi-objective evolutionary algorithm. Expert Syst. Appl. 2013, 40, 2156–2164. [Google Scholar]
  8. Kennedy, J.; Eberhart, R.C. Swarm Intelligence; Morgan Kaufmann Publishers: San Mateo, CA, USA, 2001. [Google Scholar]
  9. Alba, E.; Garcia-Nieto, J.; Taheri, J.; Zomaya, A. New research in nature inspired algorithms for mobility management in GSM networks. In Applications of Evolutionary Computing; Springer: Berlin, Germany, 2008; pp. 1–10. [Google Scholar]
  10. Parsopoulos, K.E.; Vrahatis, F.M. Unified particle swarm optimization for solving constrained engineering optimization problems. In Advances in Natural Computation; Springer: Berlin, Germany, 2005; pp. 582–591. [Google Scholar]
  11. Alba, E.; Garcia-Nieto, J.; Jourdan, L.; Talbi, E.-G. Gene selection in cancer classification using PSO/SVM and GA/SVM hybrid algorithms. In Proceedings of the IEEE Congress of Evolutionary Computation, Singapore, 25–28 September 2007; pp. 284–290.
  12. Garcia-Nieto, J.; Toutouh, J.; Alba, E. Automatic tuning of communication protocols for vehicular ADOC networks using metaheuristics. Eng. Appl. Artif. Intel. 2010, 23, 795–805. [Google Scholar] [CrossRef]
  13. Martins, M.S.R.; Fuchs, S.C.; Pando, L.U.; Lüders, R.; Delgado, M.R. PSO with path relinking for resource allocation using simulation optimization. Comput. Ind. Eng. 2013, 65, 322–330. [Google Scholar] [CrossRef]
  14. Khare, A.; Rangnekar, S. A review of particle swarm optimization and its applications in Solar Photovoltaic system. Appl. Soft Comput. 2013, 13, 2997–3006. [Google Scholar] [CrossRef]
  15. AlRashidi, M.R.; El-Hawary, M.E. A survey of particle swarm optimization applications in electric power systems. IEEE Trans. Evolut. Comput. 2009, 13, 913–918. [Google Scholar] [CrossRef]
  16. Jeffery, C.R. Crime Prevention through Environmental Design; Sage Publications: Beverly Hills, CA, USA, 1971. [Google Scholar]
  17. De la Paz Gómez, F.; Sanhueza, P.; Díaz Castro, J. Practical Guide for Outdoor Lighting; Instituto de Astrofísica de Canarias (IAC)/Quality Protection Technical Office (OTPC): Tenerife, Spain, 2010. [Google Scholar]
  18. Dully, M. Traffic Safety Evaluation of Future Road Lighting Systems. Aviliable online: http://www.diva-portal.org/smash/get/diva2:667217/FULLTEXT01.pdf (accessed on 14t November 2014).
  19. Jackett, M.; Frith, W. Quantifying the impact of road lighting on road safety—A New Zealand study. IATSS Res. 2013, 36, 139–145. [Google Scholar] [CrossRef]
  20. Lighting against Crime. A Guide for Crime Reduction Professionals. Aviliable online: http://www.securedbydesign.com/pdfs/110107_LightingAgainstCrime.pdf (accessed on 14 November 2014).
  21. Corcione, M.; Fontana, L. Optimal design of outdoor lighting systems by genetic algorithms. Lighting Res. Technol. 2003, 35, 261–280. [Google Scholar] [CrossRef]
  22. Kostic, M.; Djokic, L. Recommendations for energy efficient and visually acceptable street lighting. Energy 2009, 34, 1565–1572. [Google Scholar] [CrossRef]
  23. Sȩdziwy, A.; Kozién-Woၺniak, M. Computational Support for Optimizing Street Lighting Design; Springer: Berlin, Germany, 2012; pp. 241–255. [Google Scholar]
  24. Kennedy, J. The particle swarm: Social adaptation of knowledge. In Proceedings of the IEEE International Conference on Evolutionary Computation, Indianapolis, IN, USA, 13–16 April 1997; pp. 303–308.
  25. Eberhart, R.C.; Kennedy, J. Particle swarm optimization. In Proceedings of the IEEE International Conference on Neural Networks, Perth, Australia, 27 November–1 December 1995; pp. 1942–1948.
  26. Eberhart, R.C.; Shi, Y.; Kennedy, J. Swarm Intelligence; Morgan Kaufmann Publishers: Burlington, MA, USA, 2001. [Google Scholar]
  27. Kennedy, J. Thinking is social: Experiments with the adaptive culture model. J. Confl. Resolut. 1998, 42, 56–76. [Google Scholar] [CrossRef]
  28. Rezaee Jordehi, A.; Jasni, J. Parameter selection in particle swarm optimization: A survey. J. Exp. Theor. Artif. Intel. 2013, 25, 527–542. [Google Scholar] [CrossRef]
Figure 1. Illuminance measurement.
Energies 10 00141 g001
Figure 2. Energy efficiency index evolution for (a) 20; (b) 40; (c) 80 and (d) 120 particles.
Energies 10 00141 g002
Figure 3. Differences in the behavior regarding the number of particles.
Energies 10 00141 g003
Figure 4. Evolution of the best particle for different swarms.
Energies 10 00141 g004
Figure 5. Energy efficiency for swarm with 80 particles: (a) all particles and (b) best particle.
Energies 10 00141 g005aEnergies 10 00141 g005b
Table 1. Differences in the behavior of the algorithm according to the inertia weight parameter.
Inertia Weight (ω)Maximum Energy Efficiency Index ( I ε )Do the Particles Converge?
0.10.85Yes
0.31.32Yes
0.51.66Yes
0.71.71Yes
0.91.69Yes
1.11.69No
1.31.68No
1.51.67No
1.71.64No
Table 2. Maximum I ε with different particle swarm sizes.
Particle Swarm Size I ε Maximum Value (Mean)Convergence IterationMemory Used (Bytes)
201.90435–40127,192
301.95430–35147,856
402.01730–35168,552
502.03020–25189,216
602.08320–25209,912
702.08315–20230,576
802.08315–20251,272
1002.08415–20292,632
1202.08410–15333,992
Table 3. Energy efficiency index obtained with DIALux and the algorithm.
Spacing between Luminaires I ε (DIALux) I ε (algorithm)Deviation
170.7630.747−2.09%
270.8210.799−2.67%
300.8200.814−1.21%

