1. Introduction
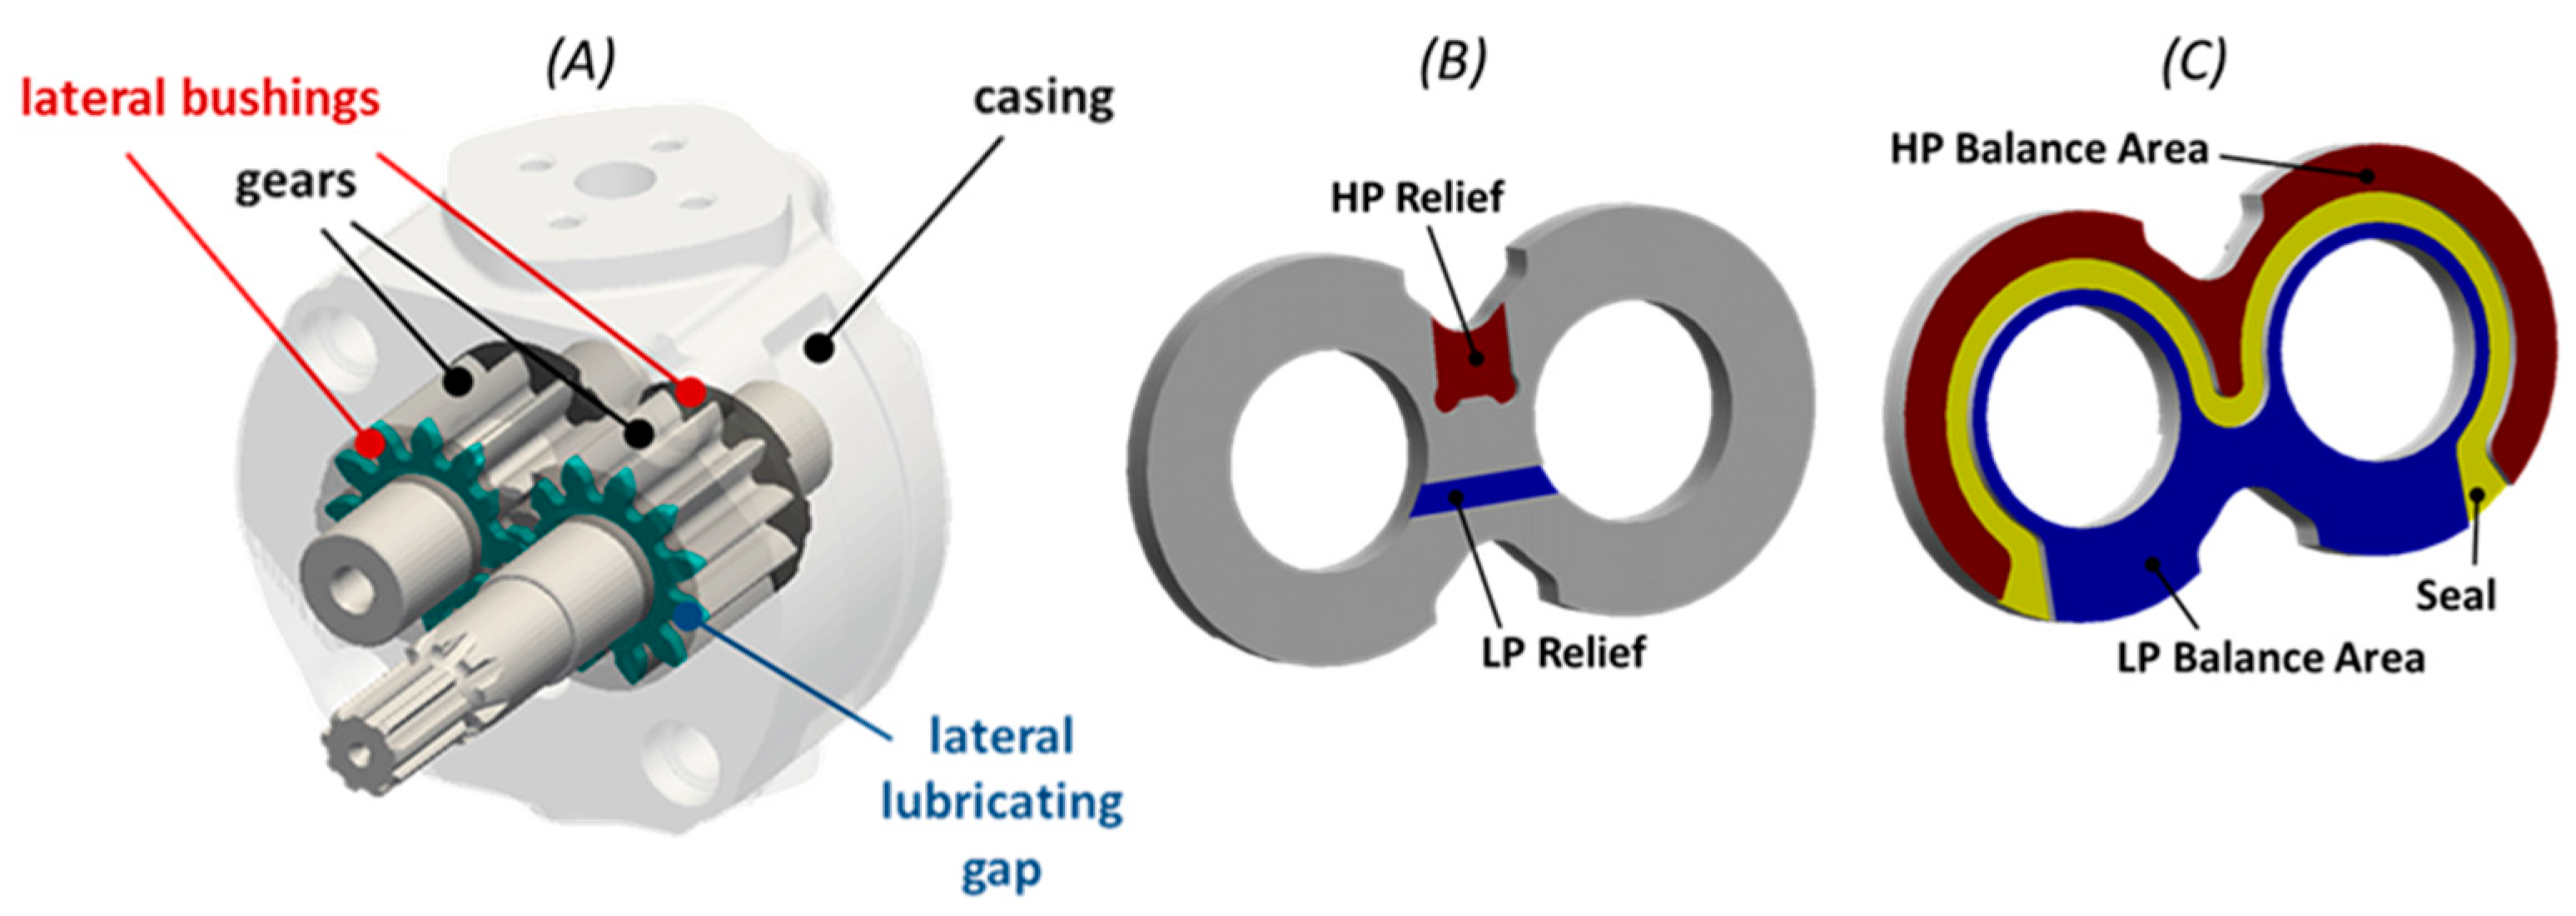
External gear machines (EGMs) are an integral part of many applications in areas which include the aerospace, automotive, construction, agricultural and fluid handling industries. These units have a relatively simple principle of operation, where the meshing of the gears displaces the low pressure fluid at the inlet to high pressure fluid at the outlet. In pressure compensated EGM designs, lateral lubricating interfaces exist between the gears and the floating bushings (
Figure 1A) which perform important functions of sealing and bearing high pressure loads. The configuration of the floating lateral bushings includes HP and LP relief grooves, as shown in
Figure 1B, which are responsible for preventing pressure peaks near the meshing zone and for the timing of the connection between the fluid and the ports. The rear side of the bushing has the balance areas at high and low pressures (
Figure 1C) which are separated by a seal. These balance areas are responsible for determining the performance of the lateral lubricating interface between the gears and the lateral bushings. Improperly designed lateral lubricating interfaces can potentially result in increased wear on the bushings and the gears, which in turn can affect the unit’s reliability and operating life. Due to the high pressures in the lateral gaps, structural and thermal deformations of the gears and the lateral bushings along with the axial forces need to be considered while designing these interfaces, since they affect the fluid flow and consequently, the film thicknesses in the gap (typically on the order of microns). Hence, owing to the complexity of the physical phenomena of fluid-structure interaction in the lateral gap, an intricate numerical tool accounting for all its features needs to be developed.
Numerical modelling of the lateral lubricating interface in EGMs considering the rigid body tilt of the lateral bushing at different operating conditions was studied by Hooke and Koc [
1,
2,
3], Borghi et al. [
4] and Zecchi, Vacca [
5]. The work of Morgridge et al. [
6] introduced EHD and simplified surface roughness effects for a lateral gap model on a single gear tooth. However, the first comprehensive lateral lubricating gap model considering the coupled effects of the fluid, structural and thermal domains was presented in the works of Dhar and Vacca [
7,
8,
9]. This model was also validated with the help of drain leakage measurements [
8] as well as direct capacitive film thickness measurements [
9]. The detailed experimental validation in these works indicate the importance of considering EHD as well as the hydrodynamic effects in the lateral gap in predicting accurately the lubrication performance of this interface. Although this is the most advanced lateral gap model for EGMs in the current state of the art known by the authors, there are some inherent limitations of this model which is predominantly related to the assumption of a full film lubrication at all times of operation and this aspect is also noted in Dhar [
7].
Under the severe operating conditions of EGMs which include extreme operating pressures as well as speeds, this full film lubrication assumption where the surface features of the solid components are neglected, becomes insufficient to accurately predict the features of the interface. This results in lower film thicknesses in the interface, which are in the order of surface roughness heights. At these conditions, the surface features play a substantial role in sharing the high pressure loads in the gap, which directly influences the prediction of the film thickness as well as the related shear losses and leakages that are consequently important for predicting the performance of the entire EGM unit. This warrants mixed lubrication modelling where the surface topography of the interacting surfaces in the interface needs to be coupled with the fluid, structural and thermal effects in the gap.
In the present article, a novel mixed-thermoelastohydrodynamic (TEHD) model for the lateral lubricating interfaces incorporating the influence of surface asperities on all of the aforementioned physical phenomena, especially at severe operating conditions is developed. The numerical model presented in this article is an advancement of the full film-TEHD model developed in the author’s research team (Dhar and Vacca [
9]) to account for the effects of surface features in predicting the performance of the lateral gap. Experimental efforts performed on a prototype EGM (a pump of displacement 11.2 cc/rev) to validate the predictions from this model using leakage measurements is also presented in this article. The article also investigates the performance of the mixed film model when compared against the previously developed TEHD gap model in the authors’ research team [
9], which has an assumption of full film lubrication at all times of the EGM operation.
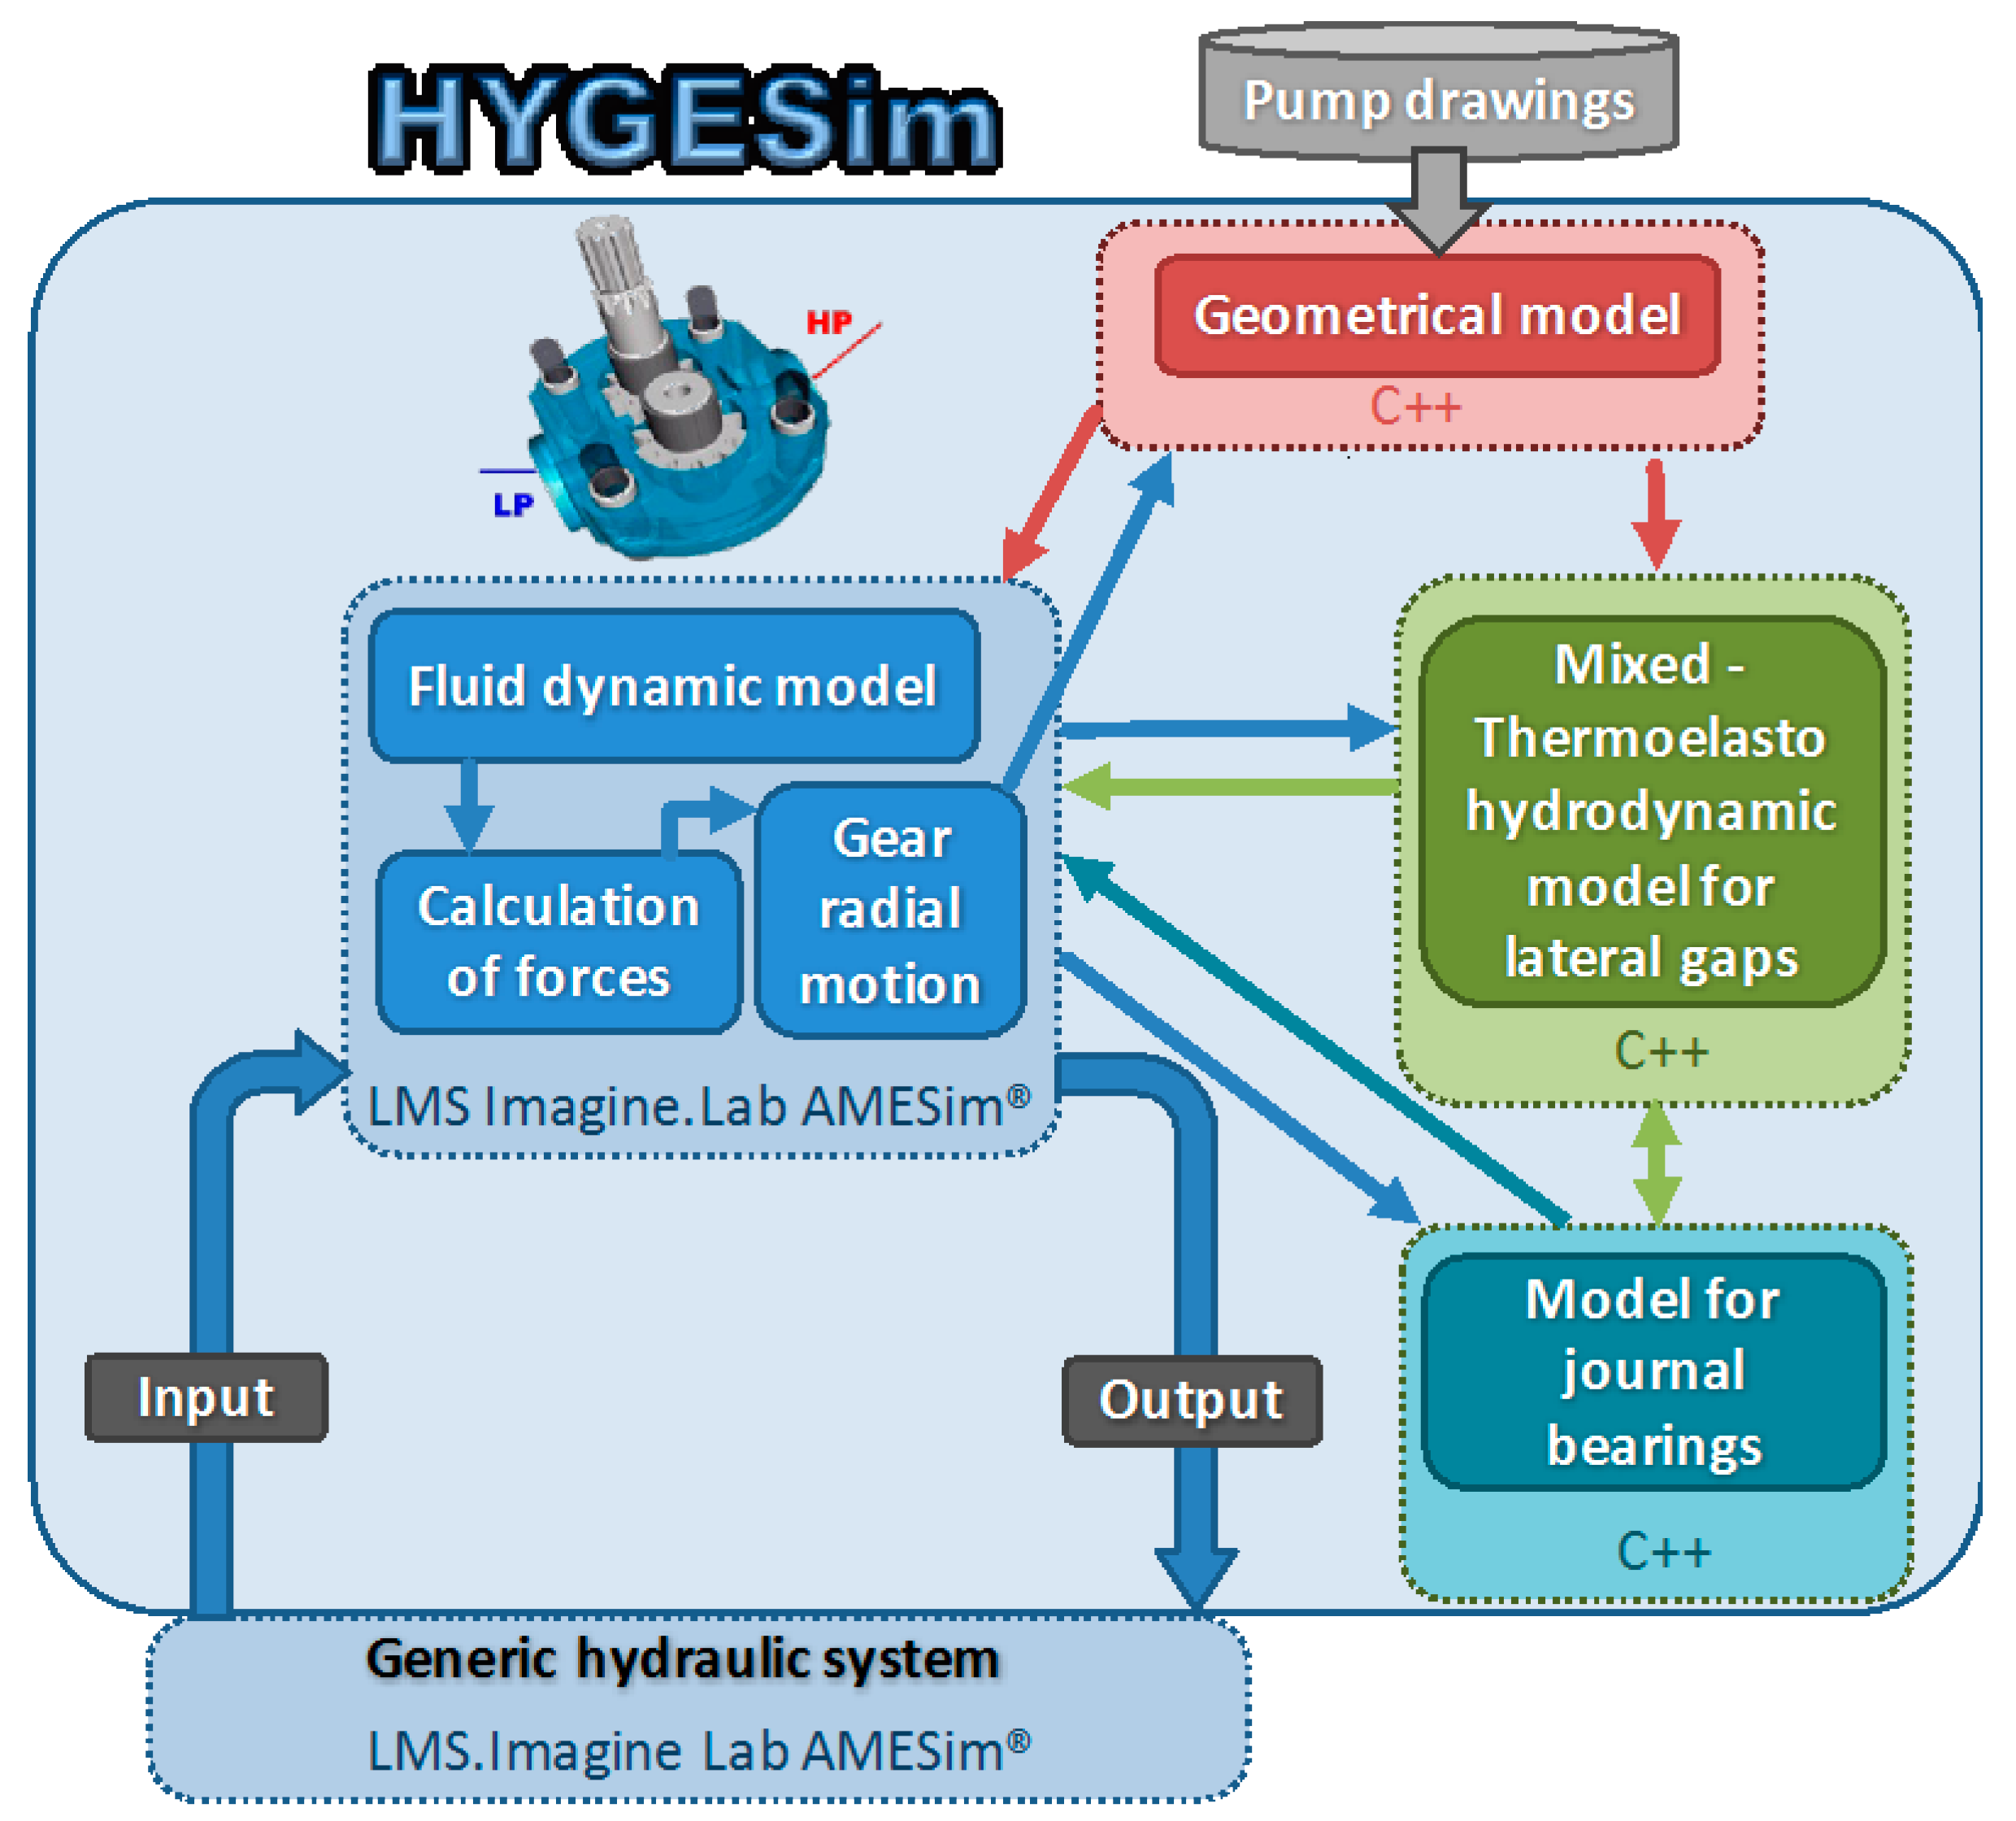
The mixed film lateral gap model is incorporated in a broader numerical EGM simulation tool, HYdraulic GEar machine Simulator (HYGESim) developed and validated previously in the authors’ research team (Vacca and Guidetti [
10]). A schematic representation of the different sub-models in HYGESim is shown with the help of
Figure 2. While the geometric sub-model evaluates the various geometrical areas and volumes directly from the CAD drawings of an EGM which are necessary for the gap model [
11], the fluid dynamic model of HYGESim calculates the pressures in the different TSVs which are used as the boundary conditions for the lateral gap model through an exchange of pressure and leakage information across the interface of these sub-models (Vacca et al. [
12]). Additionally, the fluid dynamic model also evaluates the radial micro-motion of the gears along with their associated forces with the help of a coupling with a lubricating gap model to simulate the journal bearing interfaces in EGMs (Pellegri and Vacca [
13]).
2. Mixed-TEHD Model for the Lateral Gaps
The lateral lubricating gap model for EGMs has been developed in the programming language C++ while leveraging the capabilities of open source libraries such as OpenFOAM [
14] and GSL [
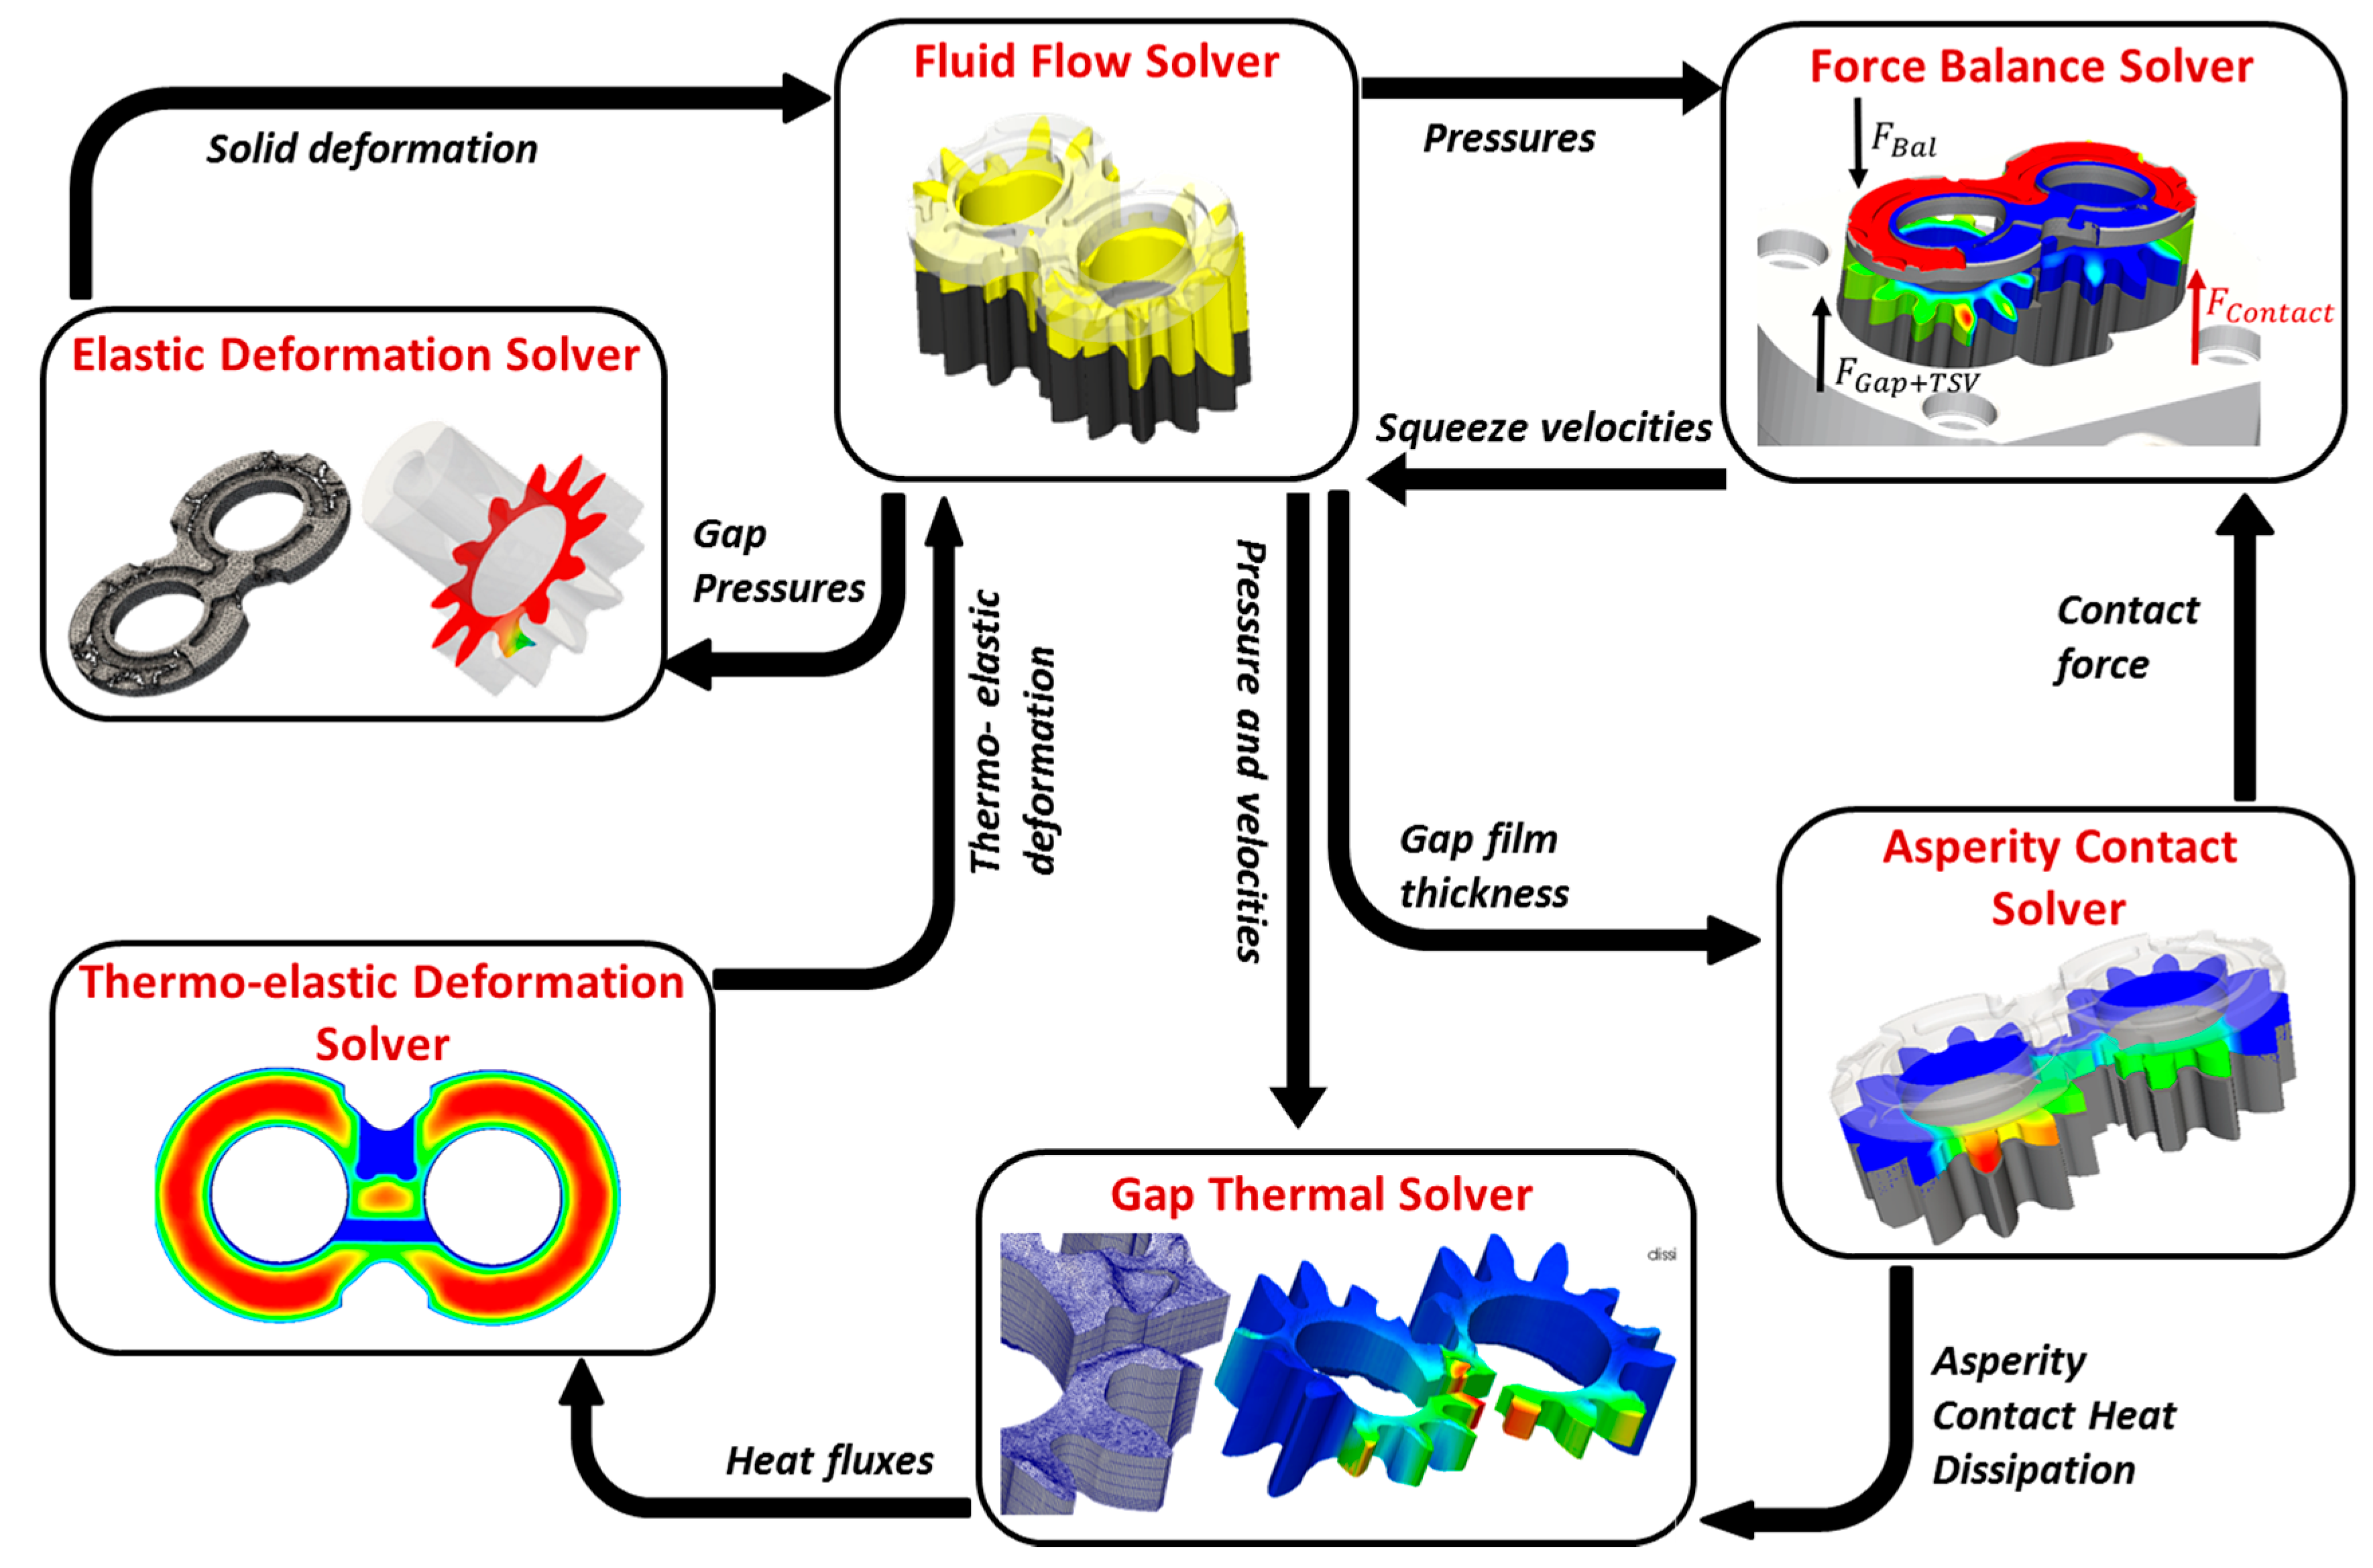
15]. The sub-models constituting the mixed-TEHD model is schematically represented in
Figure 3. The description of the formulation and implementation of these sub-models will be detailed in the following sections.
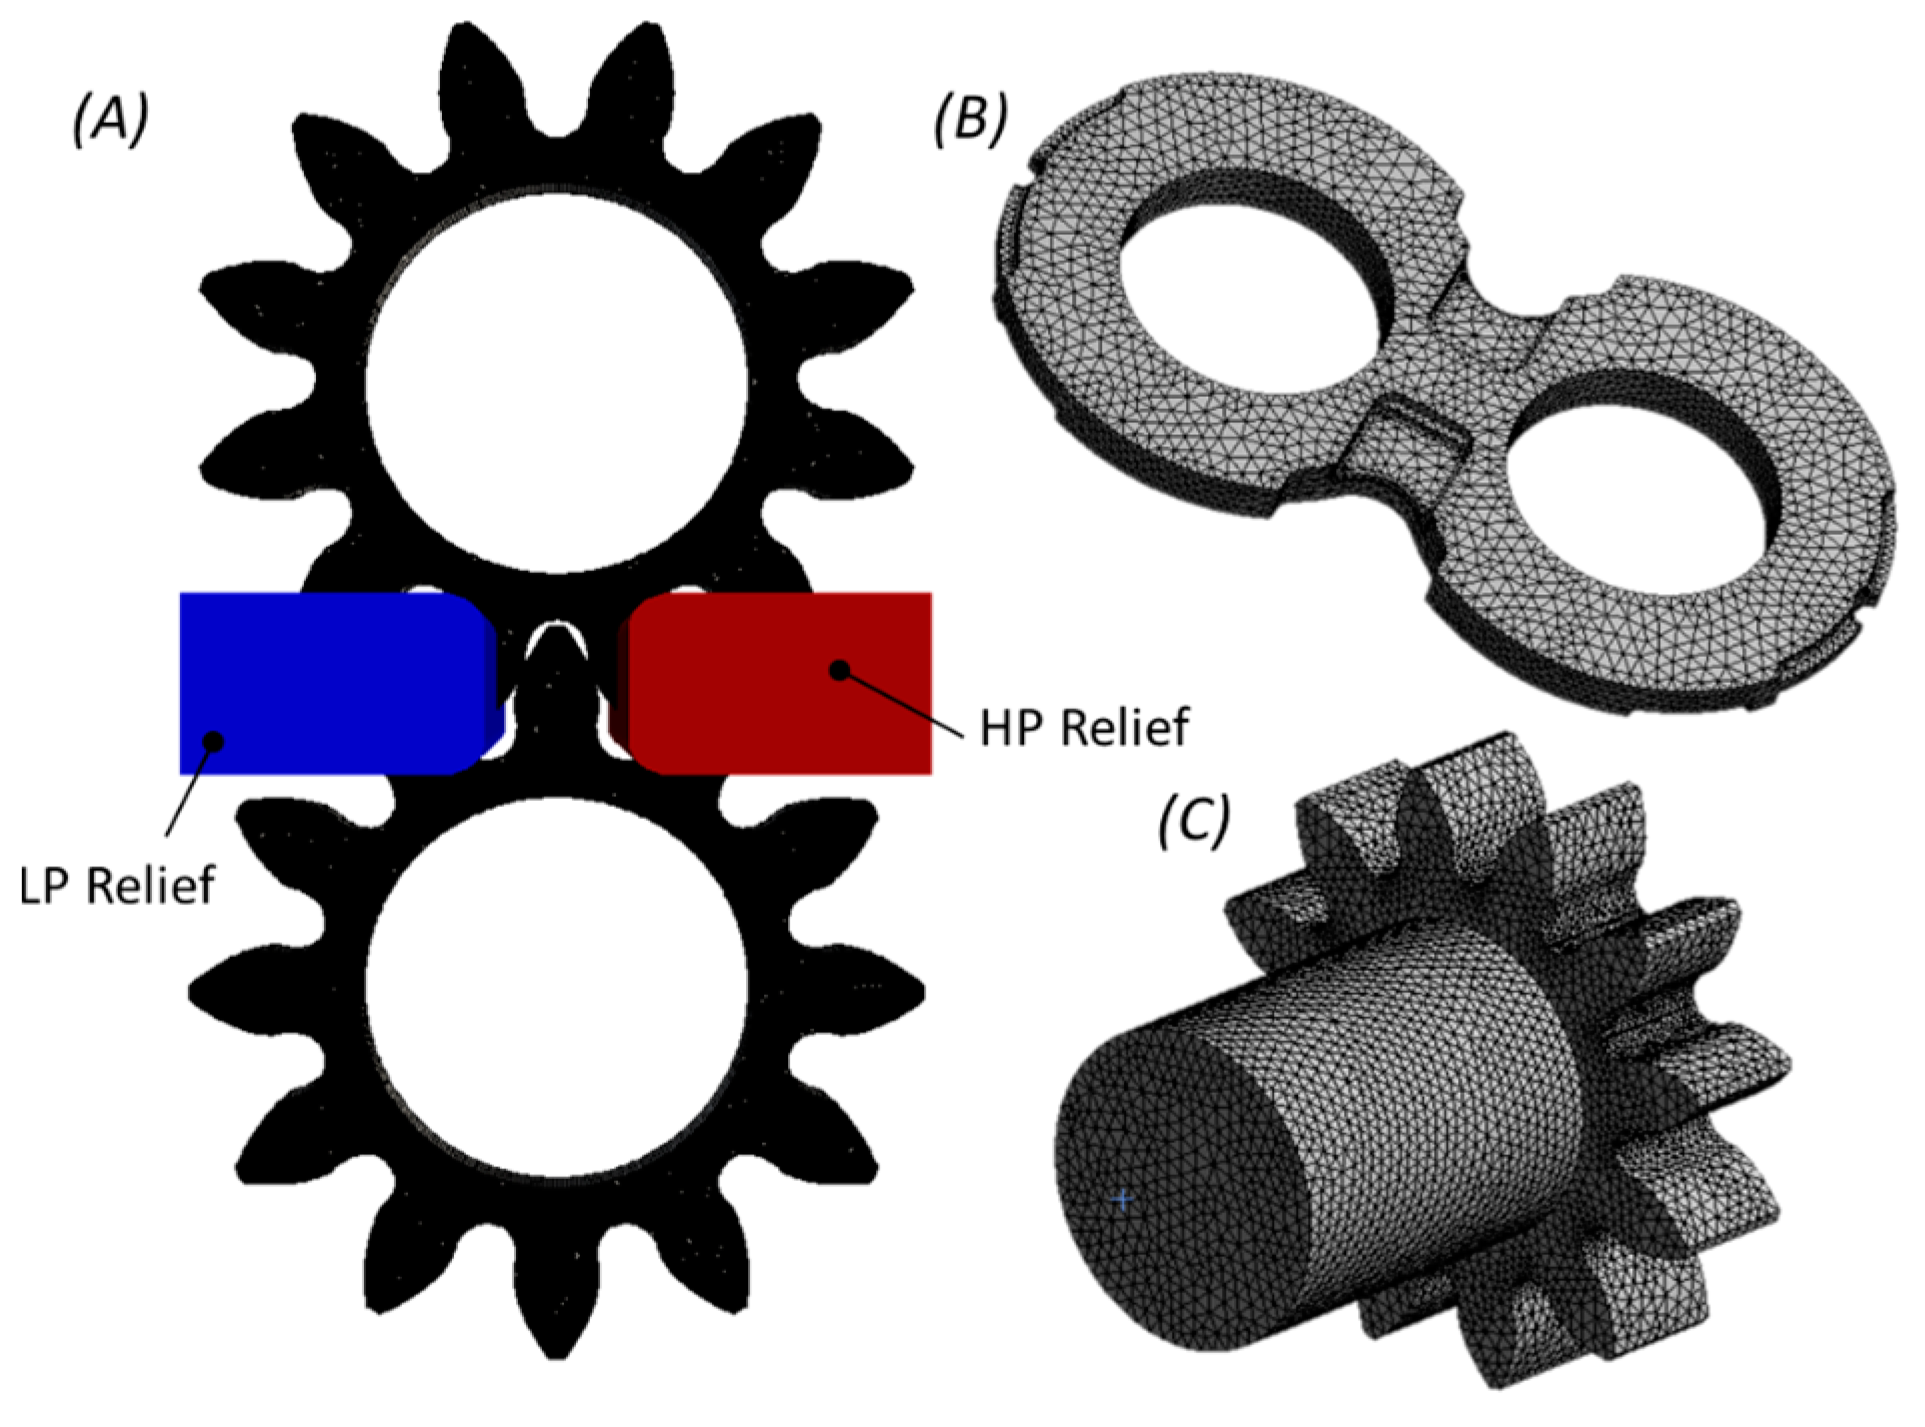
Dynamic 2D rotating FV fluid meshes (as shown in
Figure 4A) for the solver were created as part of a previously developed meshing tool based on C++ (Zecchi et al. [
5]) after extensive mesh convergence studies to account for the interaction of the relief grooves in the computational gap domain where the lubrication assumption is not valid. As part of the pre-processing component of the lateral gap model, 3D solid meshes for the lateral bushings and the gears as shown in
Figure 4B,C respectively, were generated using ANSYS [
16] after calibrating the number of mesh elements for evaluating the structural and thermal deformation of these components (Dhar and Vacca [
8]). Further details regarding the generation of the different meshes required for the lateral gap model can be found in Dhar [
7].
2.1. Fluid Flow Solver
The average flow Reynolds equation, which was first developed in the work of Patir and Cheng [
17,
18], is used in the present research to model the fluid flow through the lateral lubricating gap in the partial lubrication regime while also incorporating the effects of surface asperities on the lubricant flow. A composite roughness parameter
is defined for the lateral gap which considers the RMS surface roughness
and
of the lateral bushing and the gears respectively according to the following equation:
The average flow Reynolds equation evaluates the average pressure in the lateral lubricating domain based on the film thickness distribution, composite surface features of both the gears and the lateral bushings and the sliding velocities of the gears. The original form of the average flow Reynolds equation was modified for the case of EGMs, to incorporate the deformation effects of both the participating surfaces (Dhar and Vacca [
8]) and by considering the differential relationship between gap compliance (
) and local film thickness introduced by Wu and Zheng [
19] as shown in Equation (3). In this equation,
represents the pressure flow factor,
is the contact factor and
indicates the shear factor which were introduced in the works of Patir and Cheng [
17,
18] and Wu and Zheng [
19] to model the influence of surface features on the lubricant flow through the gap:
A Gaussian distribution of asperity heights have been assumed for both the gears and lateral bushings in the gap and such an assumption has proven to be sufficient to model these surfaces through profilometer measurements performed in the authors’ research team. Thus, the relationships for the various flow factors (used in Equation (2)) to evaluate the gap pressure with non-dimensional film thickness (
have been obtained from the works of Patir and Cheng [
17,
18] and Wu and Zheng [
19]. The pressure in Equation (2) is solved using a Preconditioned Conjugate Gradient algorithm, with a Diagonalized Incomplete Cholesky preconditioner. The following viscosity and density relationships with pressure and temperature for the reference working fluid in this study (ISO 46 mineral oil) is obtained from Ivantysyn and Ivantysynova [
20]:
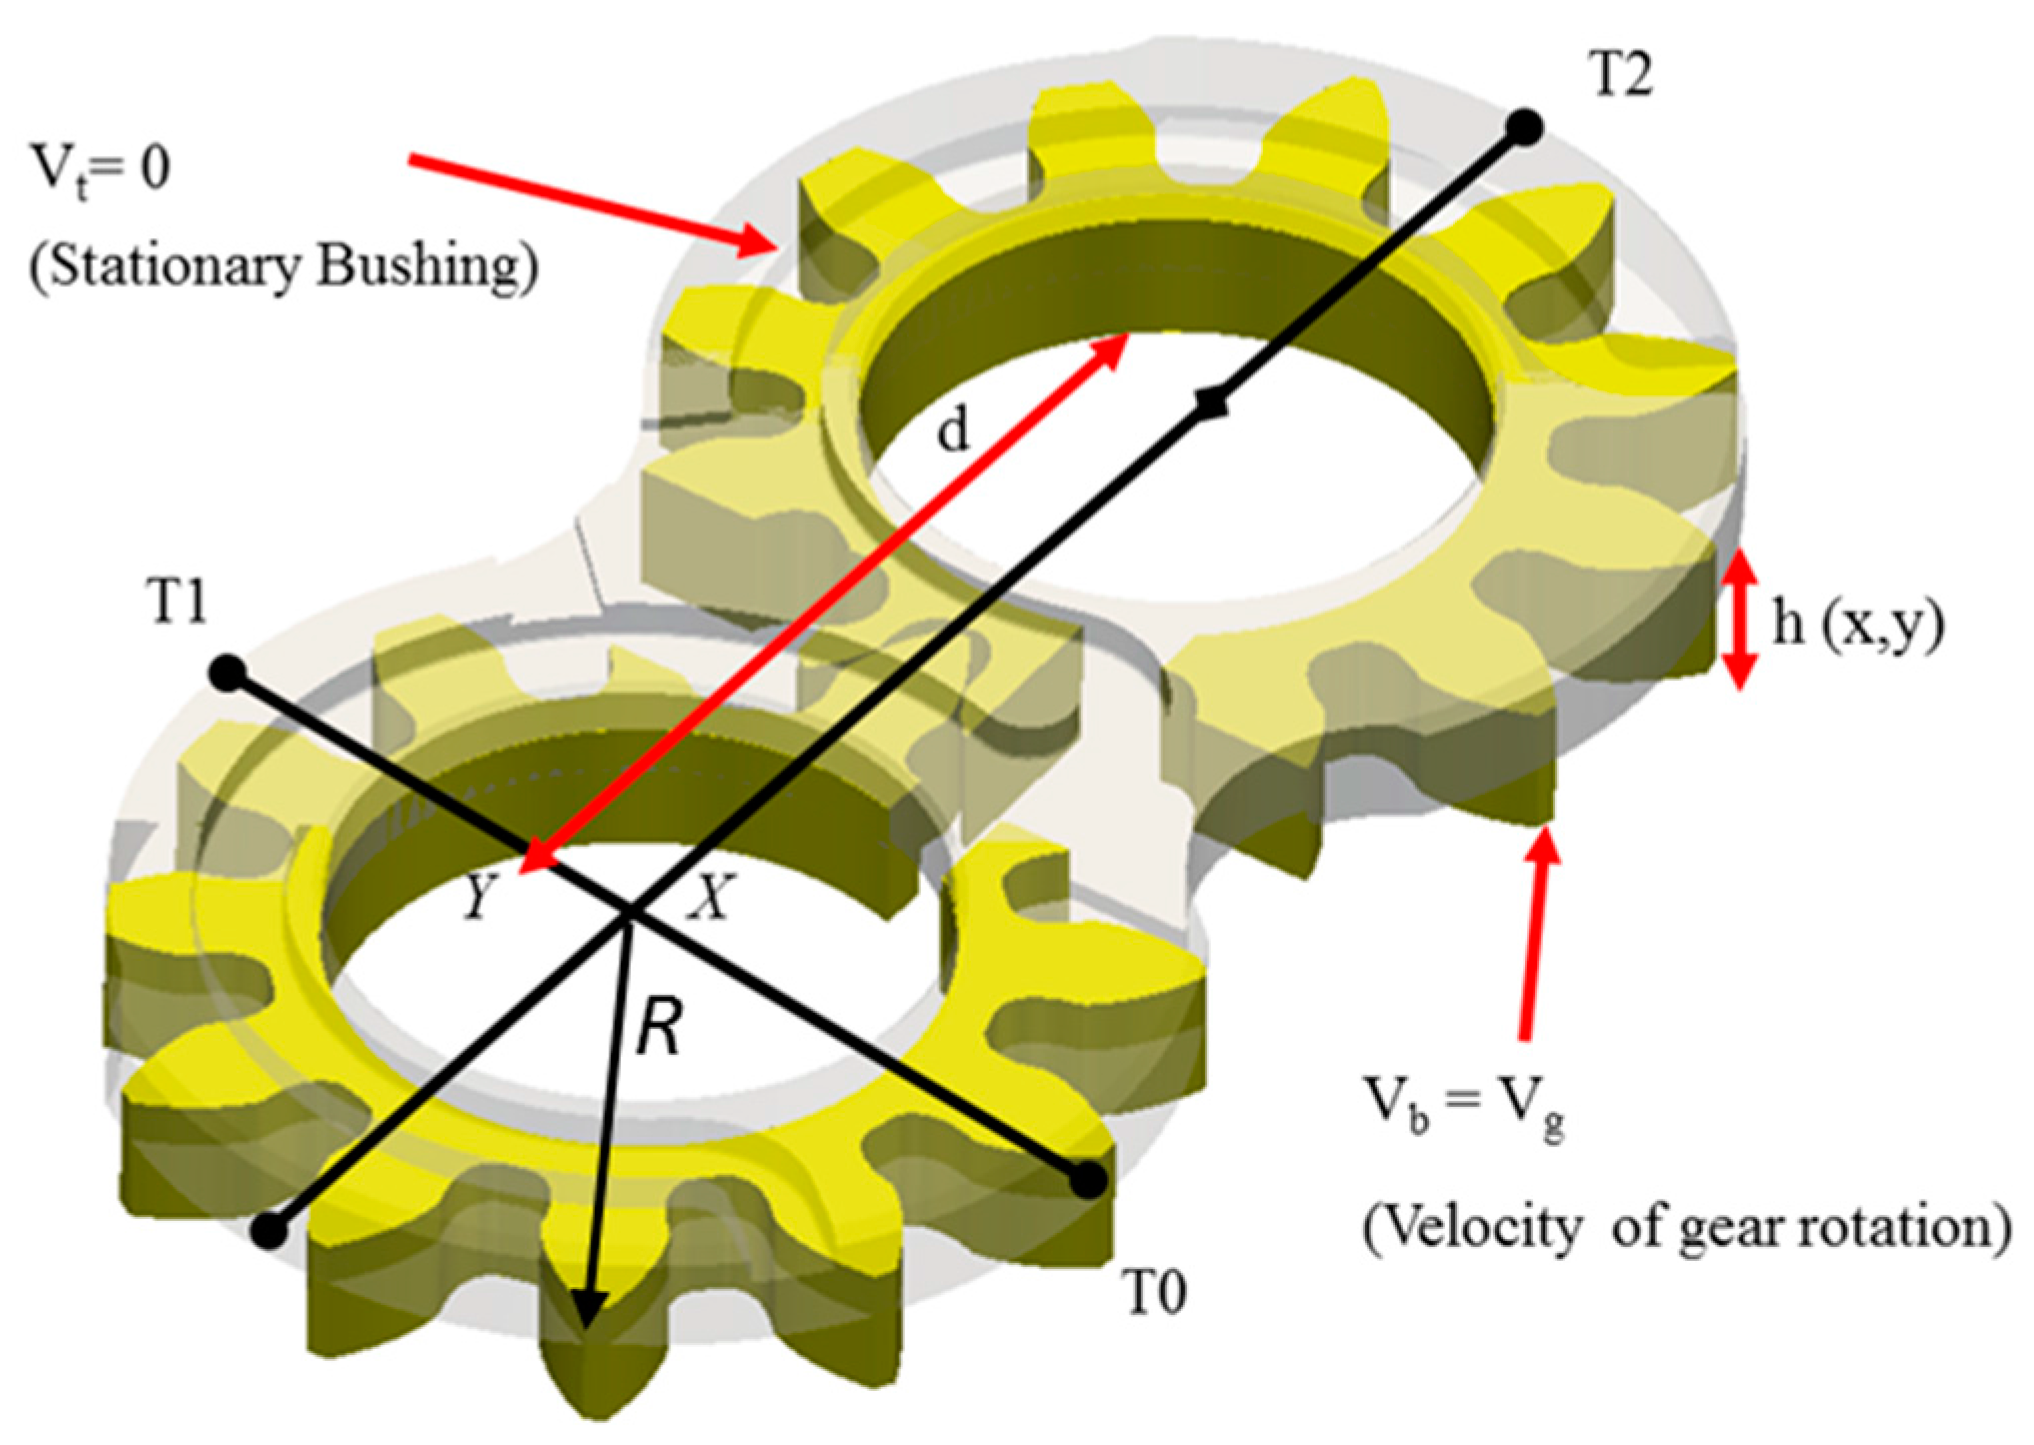
The lubricating gap geometry (shown in
Figure 5) in an undeformed two dimensional XY plane on the lateral gap domain and can be fully defined with the help of the coordinates of the three points T0, T1 and T2. Thus, the following equation can be derived to describe the gap heights at any given point in the computational domain Zecchi et al. [
5]:
2.2. Elastic Deformation Solver
The structural deformation of the gears and lateral bushings due to the high pressure loads in the interface contribute to the EHD lubrication regime in these units. A finite volume discretization of these solid components to evaluate their resulting deformation is achieved using the following formulation of the elasticity equation (Jasak and Weller [
21]) and the discretized linear system is solved using a geometric multi-grid solver:
Detailed description of the implementation of this solver and the various constraints investigated for evaluating the deformation of the solid parts can be found in Dhar and Vacca [
8]. For all the results presented in this work, a LP constraint on the lateral bushing has been used wherein the lateral bushing is assumed to be pressed against the casing in the low pressure side.
2.3. Gap Thermal Solver
The thermal effects on the fluid flow in the lateral gap is accounted in the current model by primarily solving for the temperature in the lubricating gap using the following form of the energy equation (Dhar and Vacca [
9]):
The source term
is composed of two different sources for heat dissipation which are the viscous dissipation through the fluid film
and the heat dissipation through the asperity contact (
). The contribution of these two sources to the total source term is represented as follows:
In the above equation,
represents the differential volume in the element and
indicates the discretized surface area of the cell (Shi and Wang [
22]). A 3D computational mesh for the gap was created (Dhar and Vacca [
9]) to facilitate the evaluation of the variation of the velocity field in the Z direction as indicated in the following equation for viscous dissipation function:
The frictional heat per unit area is represented by
and is computed using the friction coefficient
(assumed to be 0.1 in accordance with the dry friction coefficients for the materials used in this work) with the help of the following equation:
2.4. Solid Thermo-Elastic Model
The heat generated in the gap film due to the viscous and asperity contact dissipation is transferred to the gears and lateral bushings which results in an increase in temperature in these solid components. This temperature variation is determined by a FV solver developed in Dhar and Vacca [
9] which solves the following form of the diffusion equations:
Consequently, the thermo-elastic deformation of the solid components is evaluated after solving their respective temperature fields using the FV formulation of the elasticity equation similar to that in Equation (7). Further details related to the boundary and constraint conditions along with the solution scheme implemented for this solver can be found in Dhar and Vacca [
9].
2.5. Asperity Contact Solver
In order to evaluate the effects of the asperity interactions on the lubrication performance, a rough surface contact model proposed by the work of Lee and Ren [
23] is used in the present research. This contact model assumes that the surface asperities experience a combination of elastic and plastic deformation and numerical contact simulations were performed for surfaces with different surface roughness and material properties. Such approaches to model the load sharing effects of the surfaces along with the implementation of the average flow Reynolds equation have already been presented for conformal contact surfaces of journal bearings in the works of Wang et al. [
24,
25], and the present work extends these methodologies to the present case of lateral gaps in EGMs. Empirical relationships between the gap compliance and the resulting contact pressure were formulated after a series of numerical simulations using regression and are purely based on the statistical surface and material properties of the associated surfaces. The non-dimensional relationship between the gap compliance and the contact pressure from the asperities as obtained from Lee and Ren [
23] is defined with the help of a following fourth order polynomial in terms of the non-dimensional contact pressure
which is also related to the material properties in the following equations:
and
are the parametric matrices which are defined empirically by Lee and Ren [
23] as
and
. In the present case for EGMs, it is assumed that the distribution of the surface asperities on the gears and the lateral bushings is isotropic which results in an asperity aspect ratio of
. The real contact area (
) of the surface asperities to support the loads in the lateral gap is computed from the contact pressure with the help of the following non-dimensional relationships:
where
is the nominal area under full film conditions and the parametric matrix for the contact area calculations can be evaluated as
. The values of the parametric matrices
,
and
used in this research are obtained from the work of Lee and Ren [
23].
The contact pressure in the lubricating interface is solved for each cell in the FV mesh of the computational domain with the help of Equations (13) and (14) after obtaining the current film thicknesses in the gap from the fluid flow model. Since Equation (13) represents a fourth order polynomial in terms of the unknown , an iterative secant method is used to solve for the non-dimensional contact pressure. Using these values of at the end of convergence, the real contact area using Equations (15) and (16) is evaluated for each cell in the gap mesh.
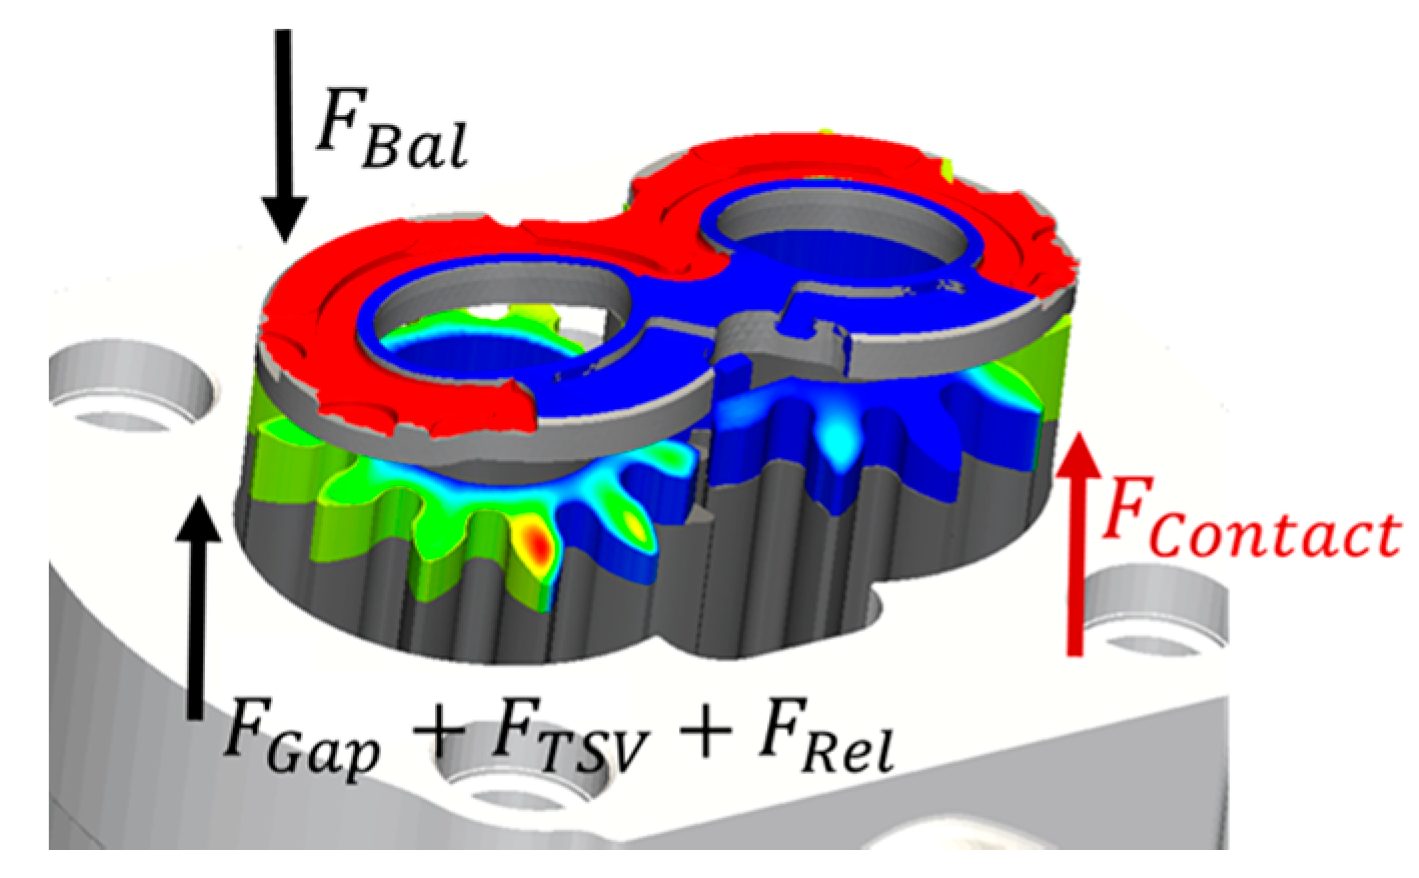
2.6. Force Balance Solver
The force balance solver in the mixed-TEHD model evaluates the hydrodynamic effects on the lateral bushing by solving the force and moment equilibrium conditions (Dhar [
7]). Forces on the bushing primarily originate from various sources of pressure, as represented in
Figure 6. The forces directed away the gears are given by: the contribution of the pressures acting on the HP and LP relief grooves
, the forces due to the pressures of all the tooth space volumes (TSVs),
, and the forces given by the pressure distribution in the lateral gap
. According to the pressure compensation principle of the EGM, these forces are compensated by the force acting on the balance areas
, in the opposite direction with respect to the previous forces. Both
and
are calculated from the pressures evaluated from the fluid dynamic model of HYGESim (
Figure 2), and used as boundary conditions for the gap model. The formulation and implementation of these forces in the solver is similar to the full film lateral gap model which was earlier presented in Dhar and Vacca [
9].
The contact pressures and the real contact area evaluated from the asperity contact sub-model contribute to the contact forces, which is consequently evaluated only at those faces where the contact condition imposed on the model is attained. The contact forces are evaluated through a cumulative addition of the contact pressures in each computational cell and the corresponding real contact area as follows:
It can be observed from the above equation that although the formula is applied to all the faces in the computational gap, the contact pressures are non-zero only at the contact regions where Equation (13) is satisfied. The point of application of the contact force can be obtained with the help of the following equations:
The ‘axial balance’ condition in the lateral bushing is achieved when the forces on the lateral bushing (as shown in
Figure 6) constitute a static force and moment equilibrium at every instantaneous position of the gears when a steady state operation of the EGM is assumed.
In each evaluation of the force balance solver, conditions for the static force and moment equilibrium are satisfied by determining the tilt of the lateral bushing with the magnitude and point of application of the resultant force in the lubricating gap. Thus, the hydrodynamic effects necessary to fulfil the axial balance condition are determined iteratively between evaluating the pressures in the gap domain and the evaluation of its squeeze velocities. In the force balance solver, instantaneous squeeze velocities of the bushing which contribute to the hydrodynamic effects in the lateral gap are determined at the points T0, T1 and T2 (as shown in
Figure 5) using Powell’s multidimensional root finding method from GSL libraries [
15] in order to satisfy the force and moment equilibrium contributed by all the components of forces on the lateral bushing.
2.7. Force Balance Solver
Computation of the shear stresses acting on the gear surface is important in determining the viscous shear losses which directly influence the mechanical efficiency of an EGM. The work of Patir and Cheng [
18] derived an average stress expression for the shear stresses from the same domain used for obtaining the average flow Reynolds equation. Additional correctional factors are used in this equation to account for the disturbance in the velocity fields due to the roughness of the surfaces and the mean shear stress (
for a lubricating interface is given by the following equation:
The shear stress correction factors
are purely dependent on the surface distribution of the gears and lateral bushings in the lubricating interface. Since a Gaussian distribution is assumed in this work, the non-dimensional equations for these factors have been derived in the works of Patir and Cheng [
18]. In the above equations,
and
are two components of the velocity vector obtained from the angular speed of the gear. This results in a torque that opposes the motion of the gears which is given by:
where
i is summed over the cells in the FV domain.
2.8. Evaluation of Lateral Leakages
Leakages from the lateral gap are useful in determining performance of a given EGM design as it is an important constituent of its volumetric efficiency. The average flow Reynolds equation is derived from the assumption that there is a disturbance in flow when the roughness in the surfaces become significant (Patir and Cheng [
17]). This equation is originally derived from the average flow equation in the X and Y directions after introducing the factors for rough and smooth surfaces as follows where
is the average pressure in the interface:
However, for the case of EGMs, the deformation of both the surfaces need to be considered and by integrating the velocity fields given in Equations (25) and (26) and the details of the derivation for the velocity equations can be found in Dhar [
7]:
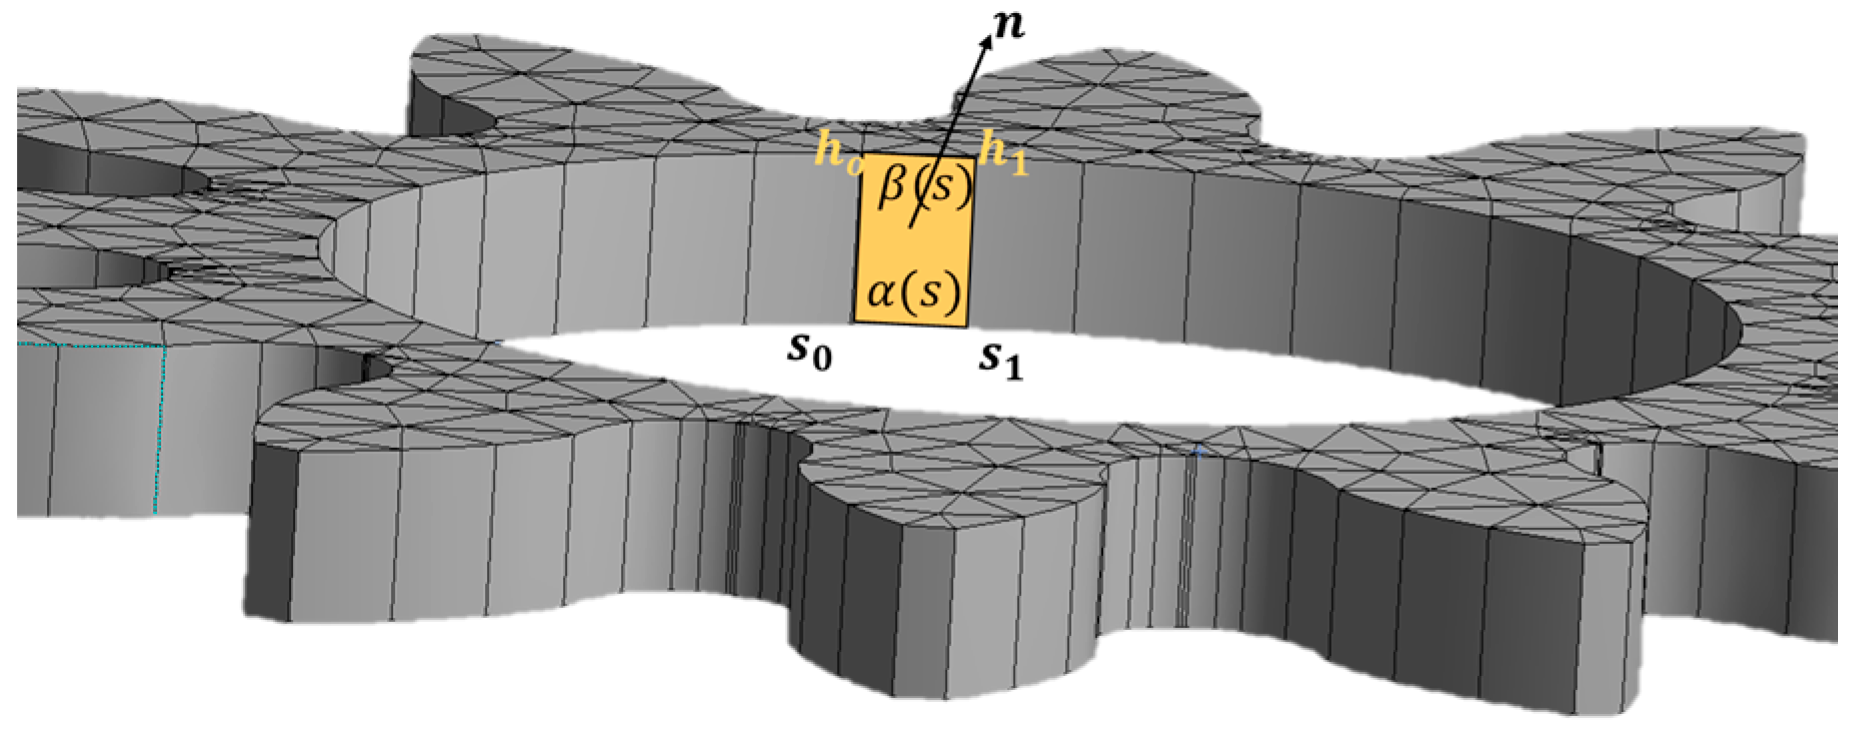
The velocity field obtained from the above expressions can be integrated to give the leakage flow rate in Equation (27). A differential boundary element of the desired region (as highlighted in
Figure 7) is considered for deriving the leakages.
An integral equation for the leakages can be obtained by integrating the velocity fields along the normal to the face of the differential element (as shown in
Figure 7) in the following manner:
After performing the same evaluations and by comparing the flow factors for the terms in Equations (27)–(30), the following equation for evaluating the leakages in mixed lubrication conditions was derived:
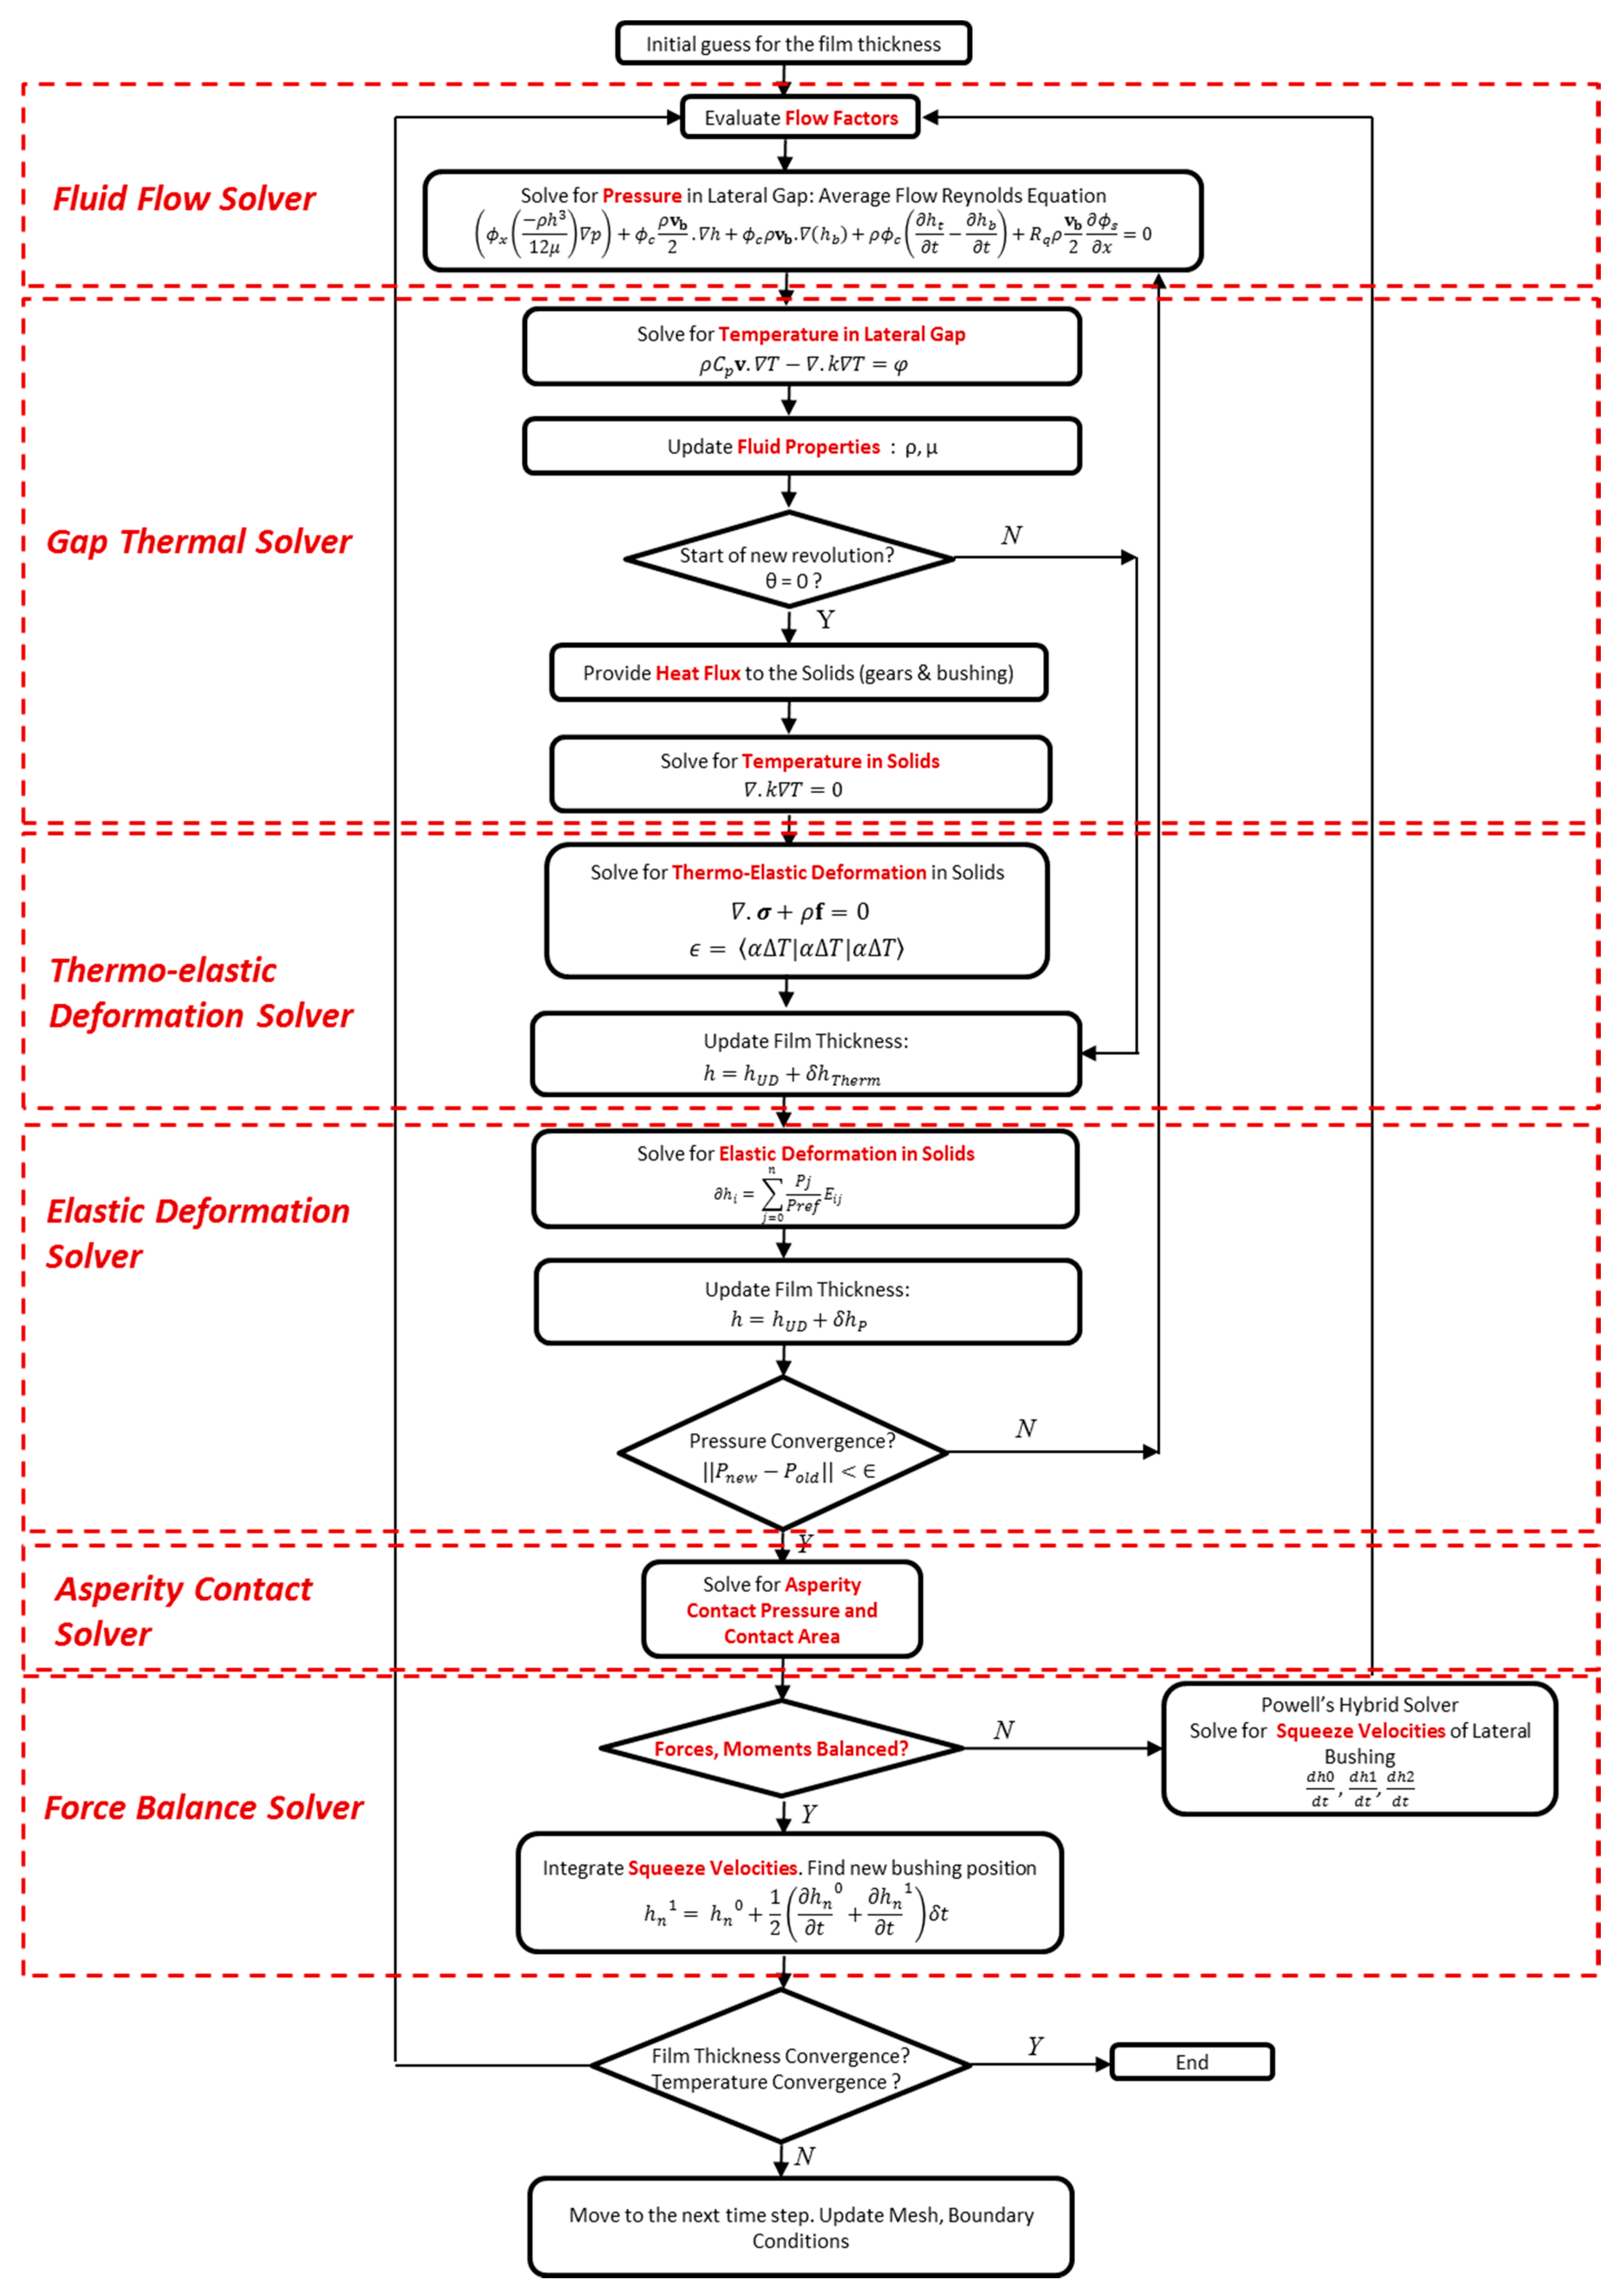
2.9. Numerical Scheme for Mixed-TEHD Lateral Gap Model
A flowchart representing the iterative scheme adopted for solving and coupling the different sub-models outlined in the mixed-TEHD gap model is shown in
Figure 8. An initial guess for the film thickness at the three points pictured in
Figure 5 is made at the beginning of the algorithm. Using the film thickness distribution in the computational domain, the various flow factors required to implement the mixed film model are evaluated using the non-dimensional relationships which are obtained from the works of Patir and Cheng [
17,
18] and Wu and Zheng [
19]. Subsequently, the average flow Reynolds equation is solved to obtain the average pressure in the gap. This allows the evaluation of the velocity fields in the gap and thus, by solving the energy equation in the 3D fluid mesh, the temperature in the lateral gap can be obtained, using which the fluid properties can be updated. Since the thermal effects do not vary as dynamically as the structural effects for the present case, the deformation of the solids due to these effects are evaluated only every revolution. In these steps, the temperature fields in the gap are used to evaluate the resultant heat fluxes at the lateral bushings and the gears. Subsequently, the thermo-elastic deformation of the solids is evaluated after solving the applied temperature on the solids through the diffusion equation. This deformation loop is performed iteratively until a converged pressure is achieved according to a preset criterion.
At the end of the thermo-elastic coupling, the asperity contact sub-model is invoked to evaluate any possible contact pressure and the corresponding contact area in the event that the contact condition is valid. Then, the force balance model solves for the static force equilibrium on the lateral bushing and repeats the entire numerical scheme is repeated until the final squeeze velocities determining the tilt of the bushing is obtained. The resultant squeeze velocities are then integrated to find the new tilt of the bushing. The entire scheme is iterated for every angular step in the computational domain until a steady state convergence in terms of both the film thickness and temperatures in the lateral gap is obtained. In the results reported in this paper, the simulations were performed with an angular step of 1° and convergence was achieved after three revolutions of the reference EGM under study. An average simulation time of 62 h was observed for each operating condition with a 3.30 GHz Intel Xeon processor.
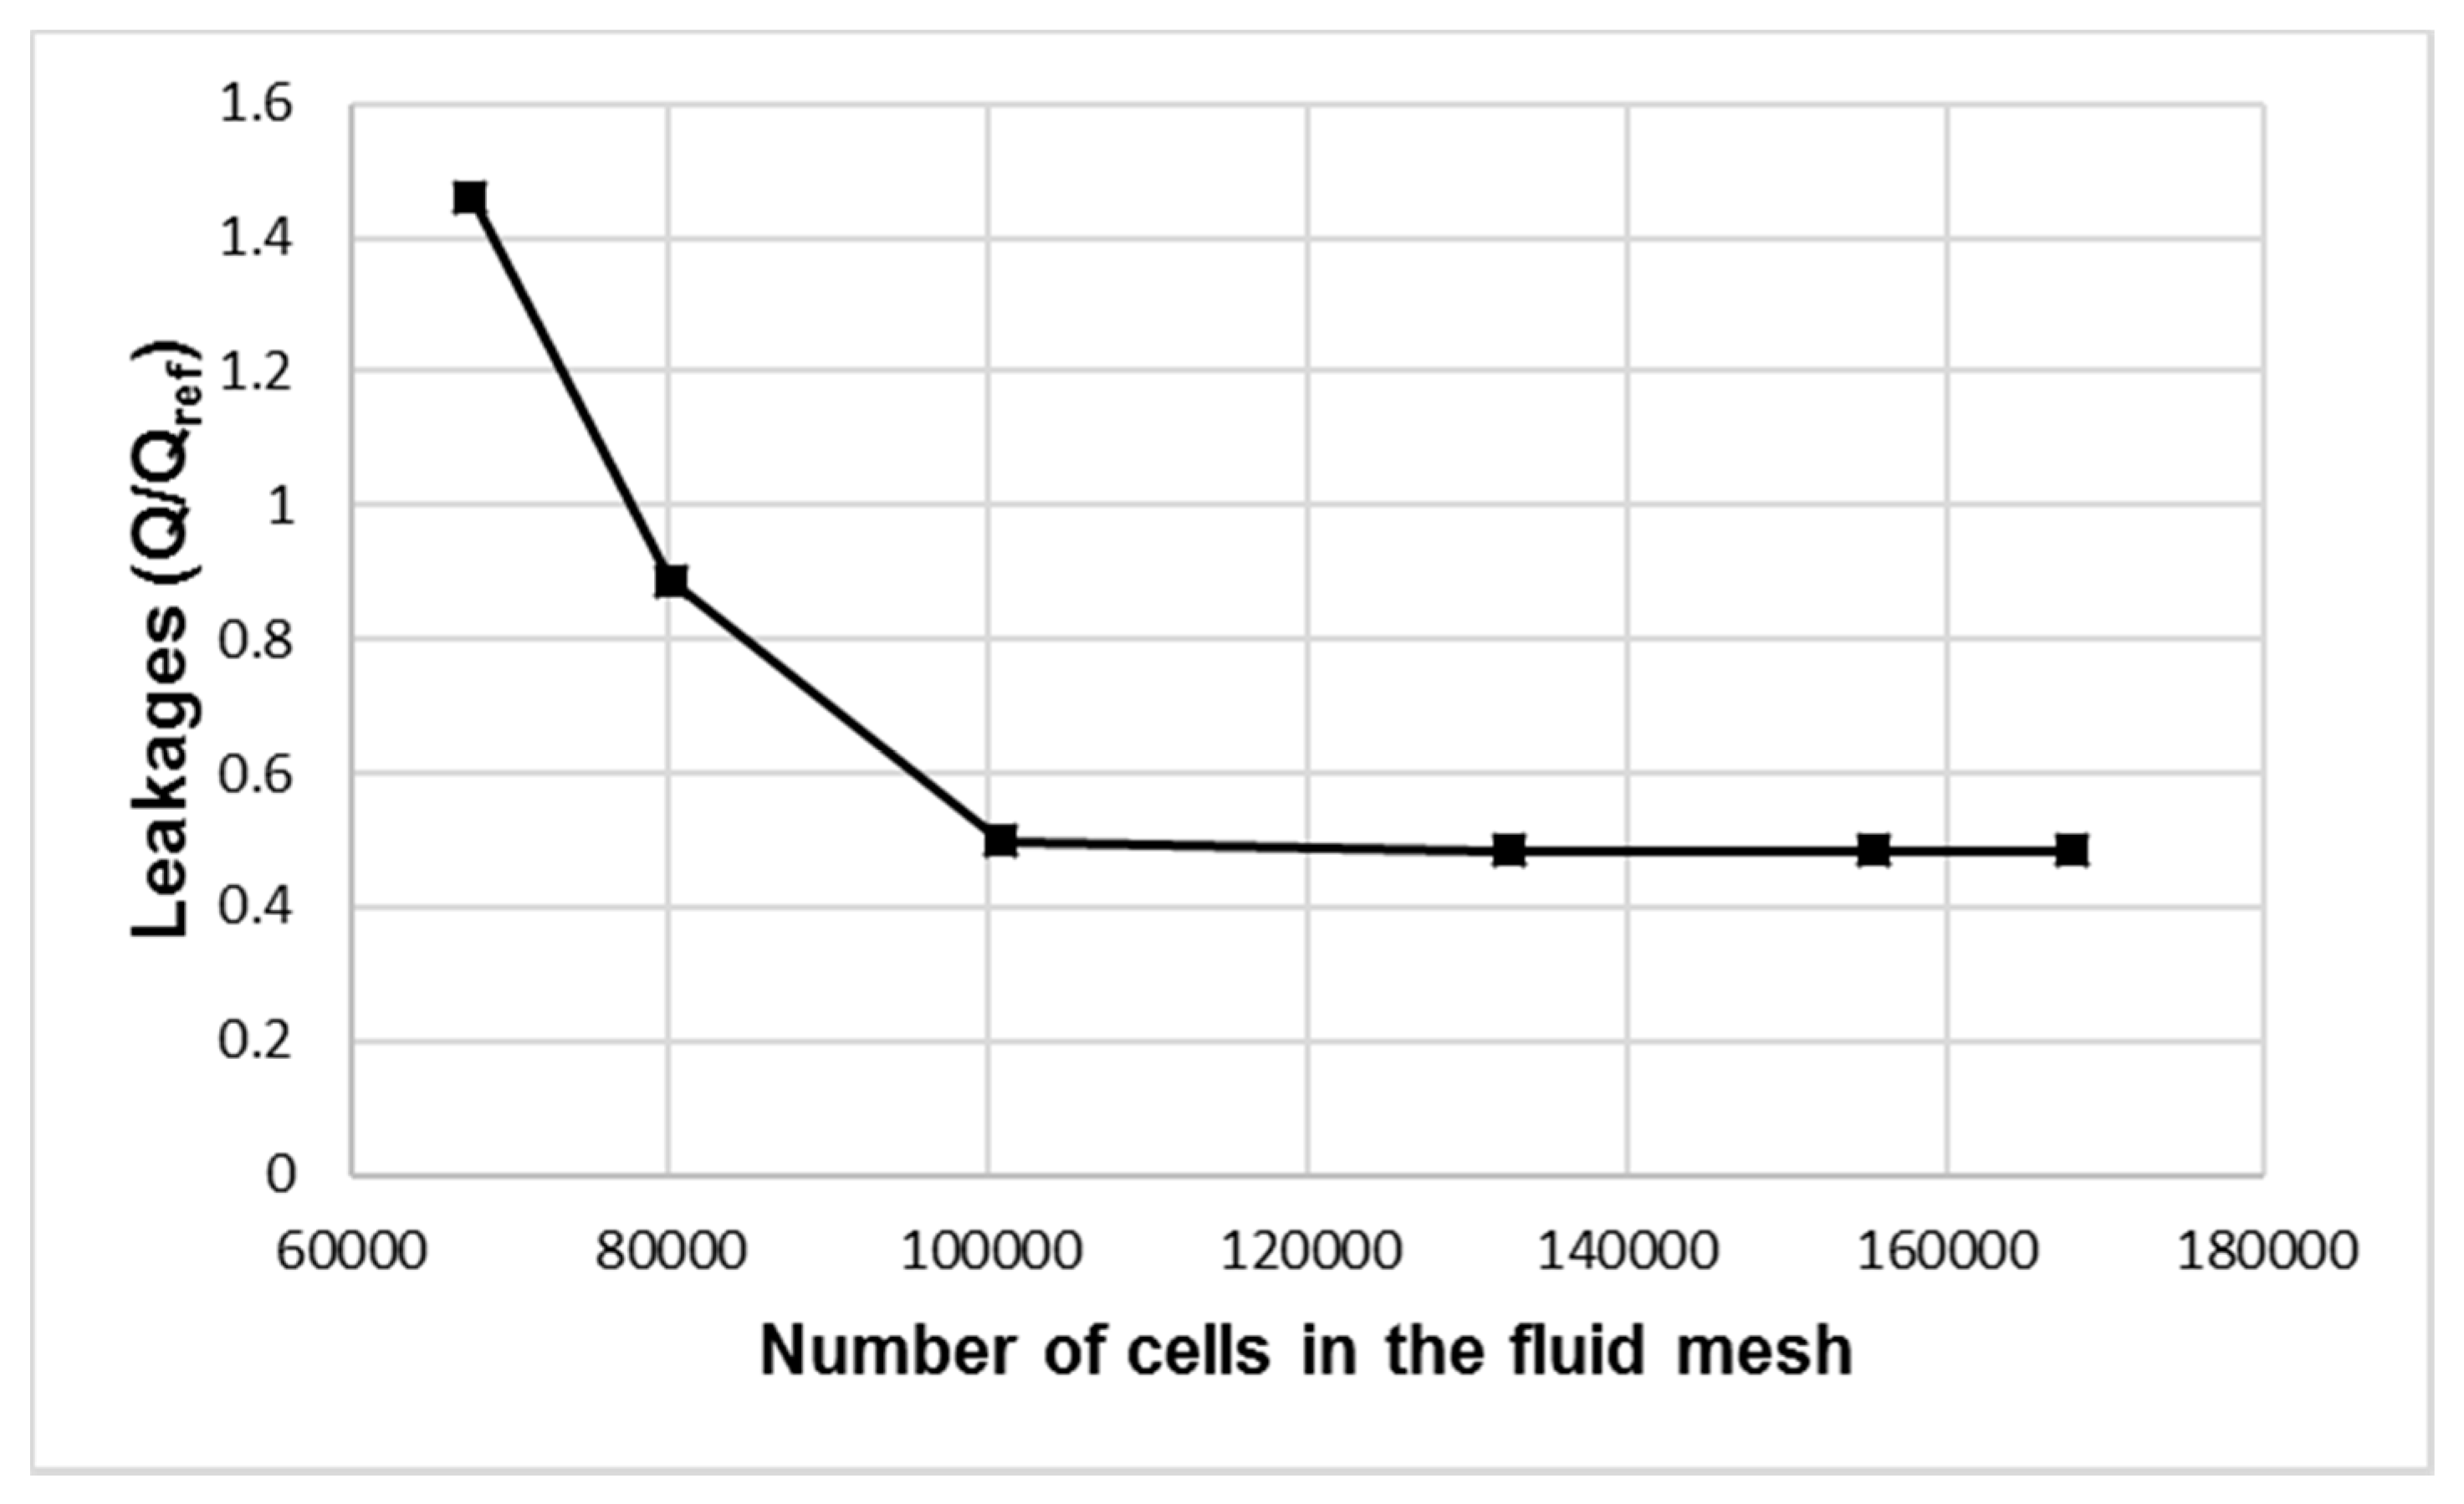
The mesh convergence study has been performed for the fluid and the solid meshes used in the present work. Since the computational mesh for the fluid is the more sensitive in affecting the results than the solid meshes, the convergence study for the fluid mesh is shown below in
Figure 9. The convergence study was performed with the help of the simulated leakages obtained from different number of elements in the fluid mesh as represented in the figure due to the reason that the leakage predictions from the model was the chief parameter studied in this work. Thus, it was decided to use a fluid mesh with ~120,000 cells which was found to be sufficient to capture the lateral gap features in accordance with the convergence study.
3. Experimental Validation
In this section, efforts aimed at experimentally validating the predictions of the mixed-TEHD lateral gap using measured drain leakages from a prototype EGM are presented, along with the comparison of the results between the previously developed full film lateral gap model in the authors’ research team (Dhar and Vacca [
8]) and the mixed film model developed in this work. The leakages from the lateral gap are quite sensitive to the gap heights and have a nearly cubic relationship as indicated in Equation (30), which can aid in distinguishing the results from the two lateral gap models at mixed lubricating conditions.
Drain leakage measurements have already been used to validate the full film lateral gap model in EGMs in the work of Dhar and Vacca [
8]. The reference EGM used in the present study is identical to the one used in this previously performed work and thus, the modelling assumptions used in this work is similar to the former work. This is especially concerning the structural constraint used on the lateral bushing to evaluate its deformation and it was concluded that constraining the bushing at the LP side was the most feasible option.
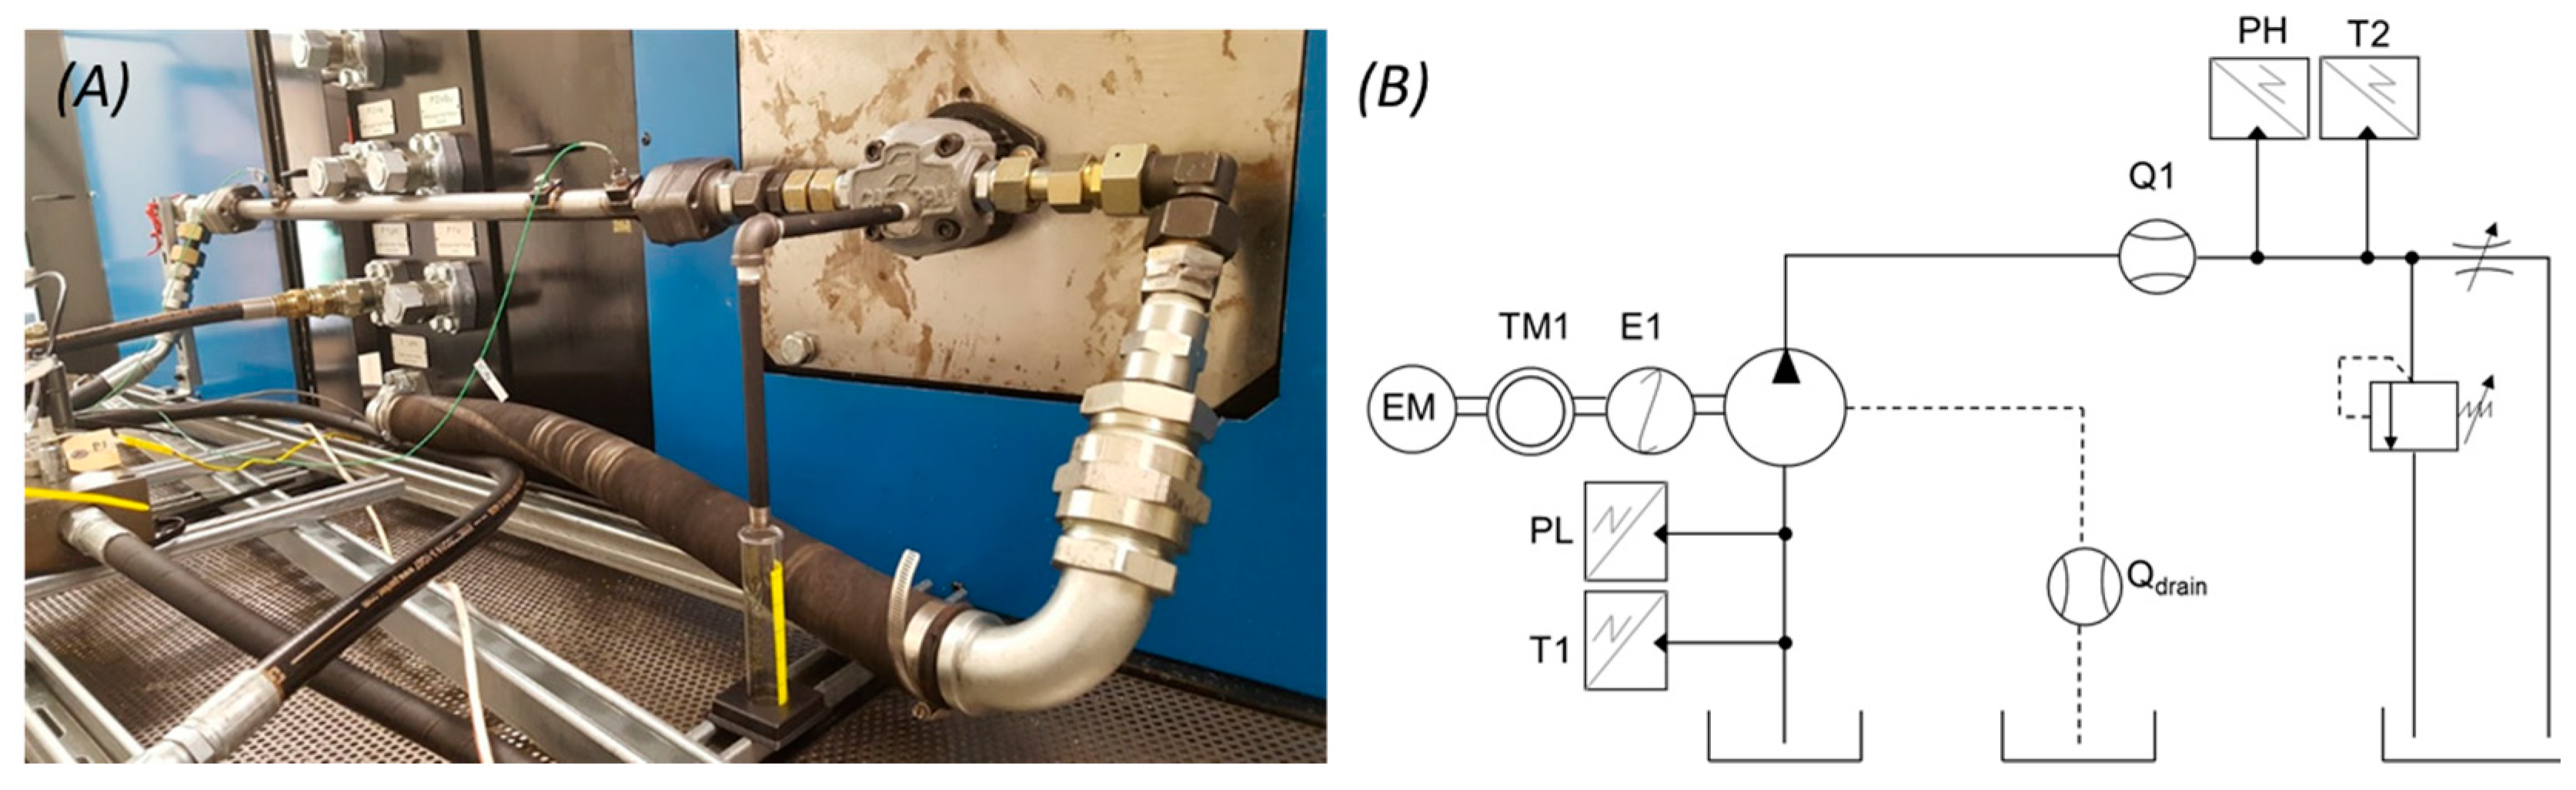
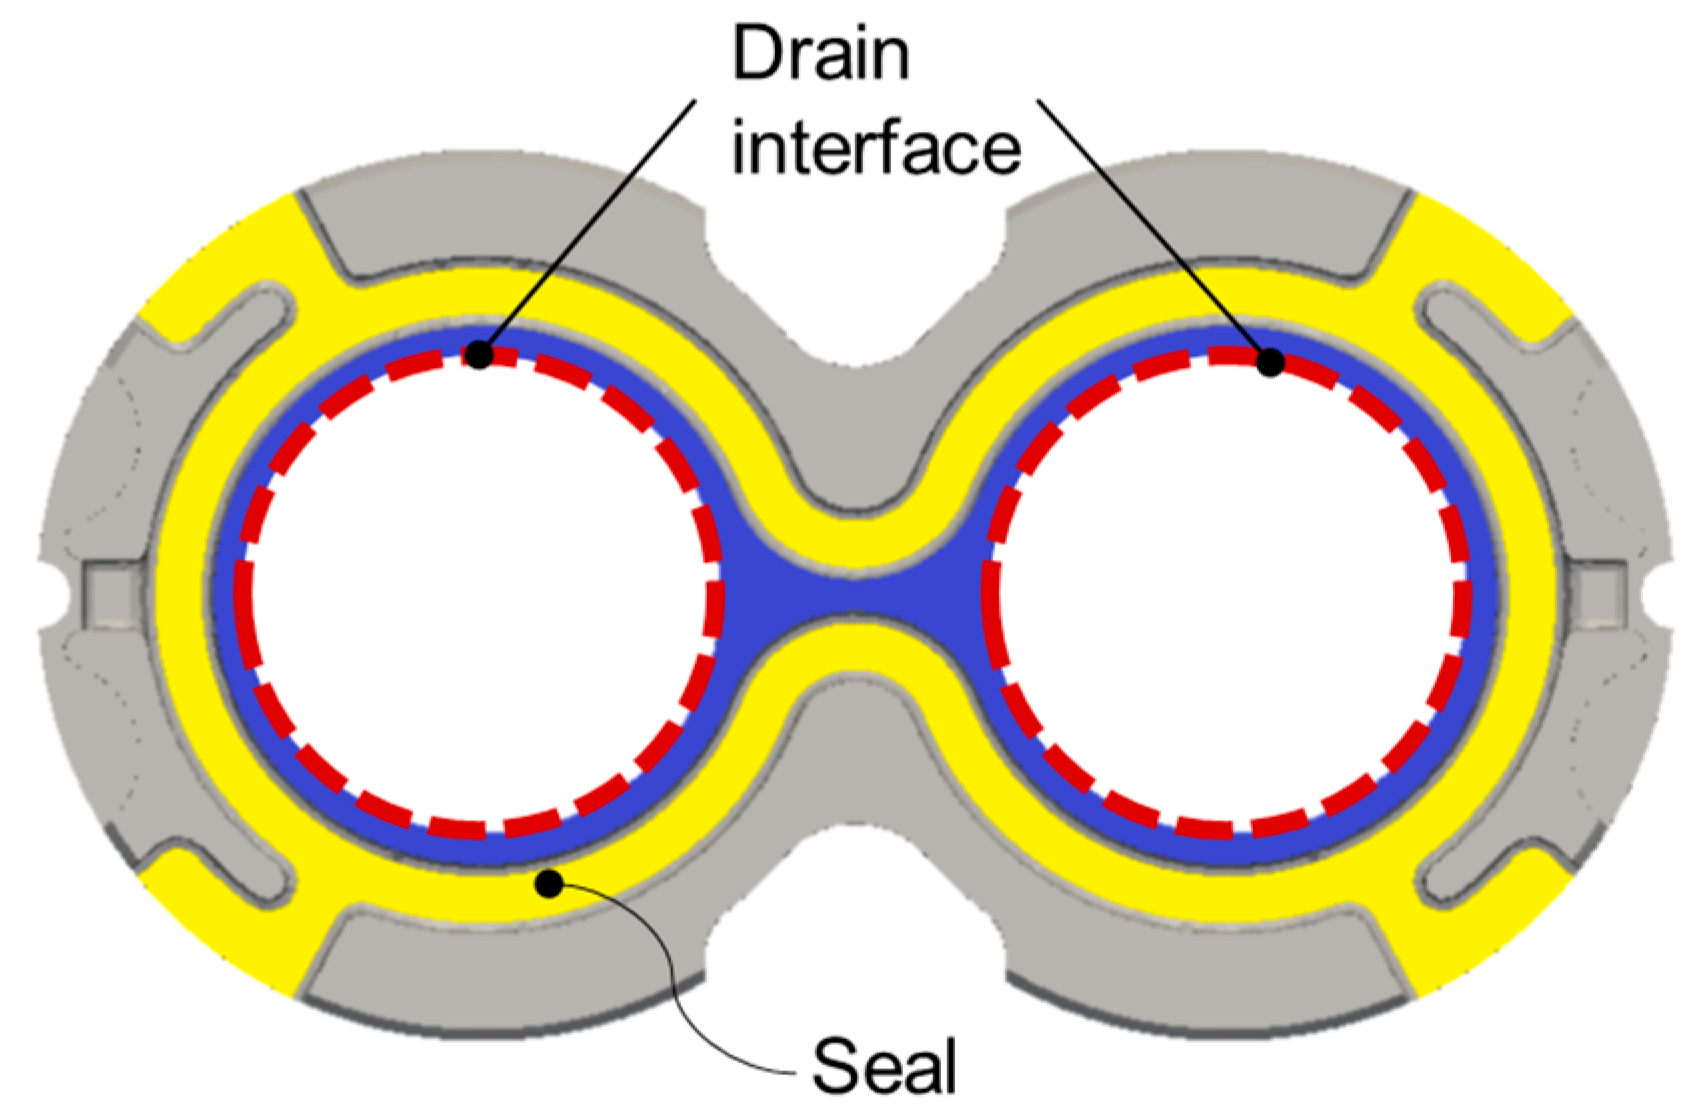
The EGM used for this study was a prototype pump with a specially designed outlet for drain leakages which could flow through the casing. The reference EGM used has the capability of reversible operation with a displacement 11.2 cc/rev. The configuration of the lateral bushing along with the seal is shown in
Figure 10 and it can be seen that the seal (highlighted in yellow) completely isolates the drain interface (marked in dashed red line) (Dhar and Vacca [
8]) which aids positively in the primary aim of these measurements. A graduated cylinder (as indicated as
in
Figure 11) with gradation of 1 mL in the measuring scale was used in the experiment and the drain leakages were recorded for a consistent measured volume (~
O (5 mL)) at different operating points to reduce possible inaccuracies in the experiments.
Figure 11A shows the setup of the test rig with the prototype EGM used for leakage measurements along with the graduated cylinder for measuring the leakage flow. In this manner, the drain leakages from the lateral gap flow through the pump casing directly into the measurement cylinder through an external pipe connection. The ISO schematic hydraulic circuit for the test setup is shown in
Figure 11B and the notations for the different elements used in the circuit can be seen in
Table 1. The operating conditions for the different tests can be obtained from the PH sensor that measures the operating pressure in the delivery line and the E1 speed measurement system which measures the shaft speed at the pump inlet.
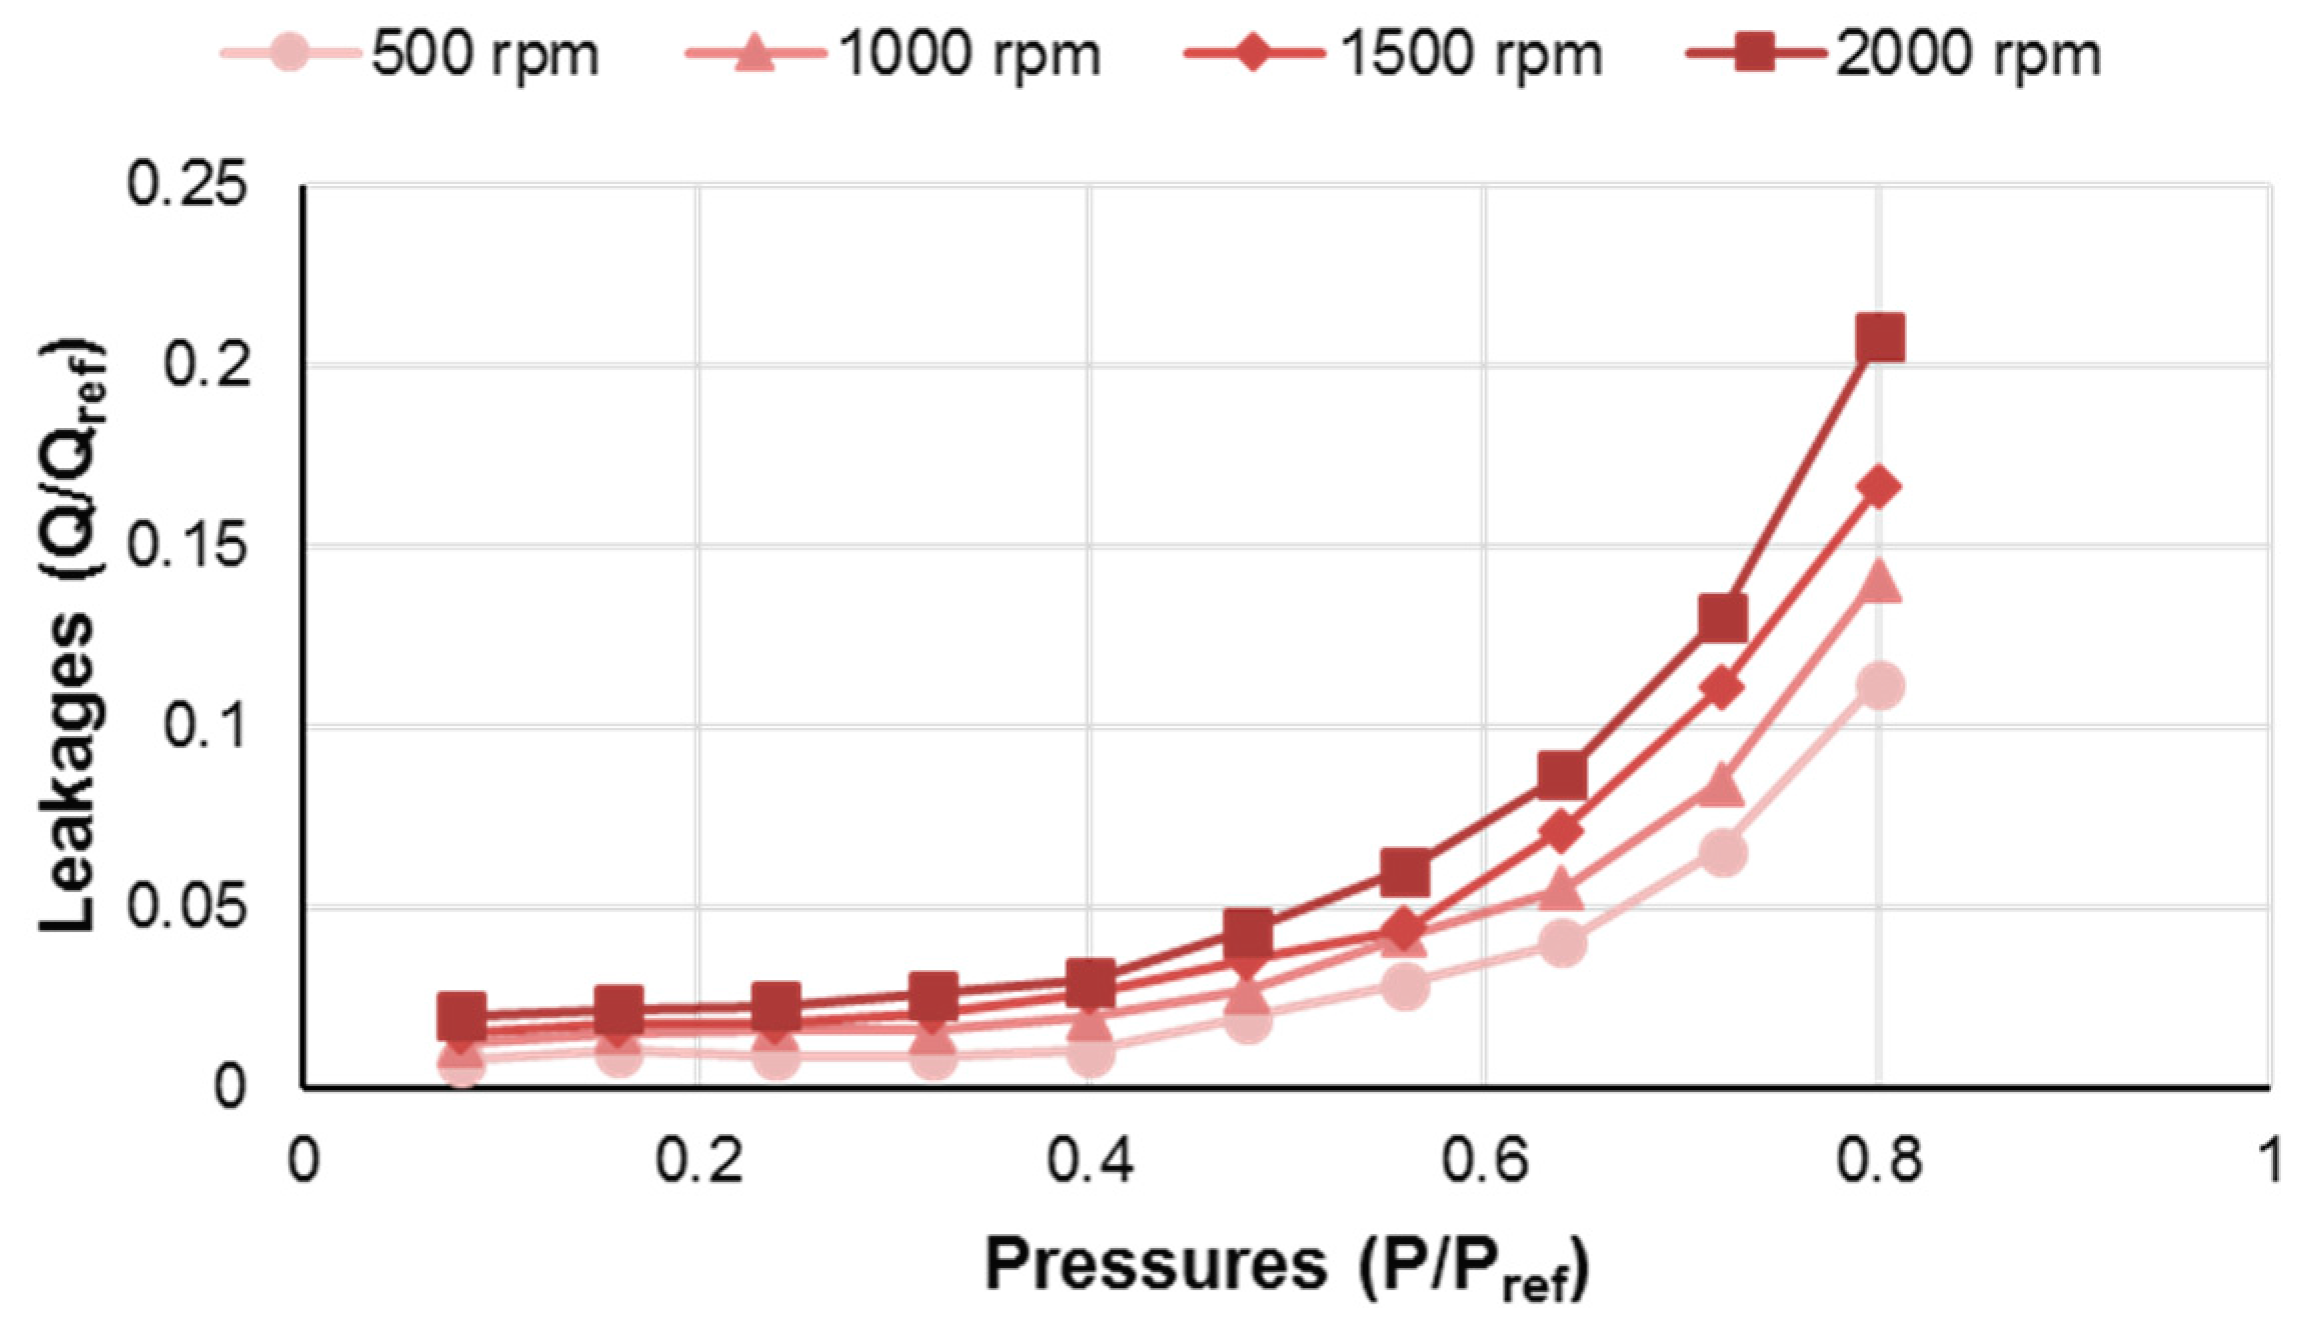
Experimental measurements were conducted for a range of operating pressures from
to
at different operating speeds of 500, 1000, 1500 and 2000 rpm. It must be noted here that a higher number of operating conditions were considered for the present study when compared to the former work in Dhar and Vacca [
8].
Figure 12 shows the measured drain leakages plotted against the delivery pressures for all the tested operating speeds. It is observed that there is a strong tendency of leakages with the pressures as they increase steadily at higher pressures. However, there is only a marginal increase in the leakages with increasing speed. The values of leakages and pressures have been normalized for the sake of confidentiality with
and
.
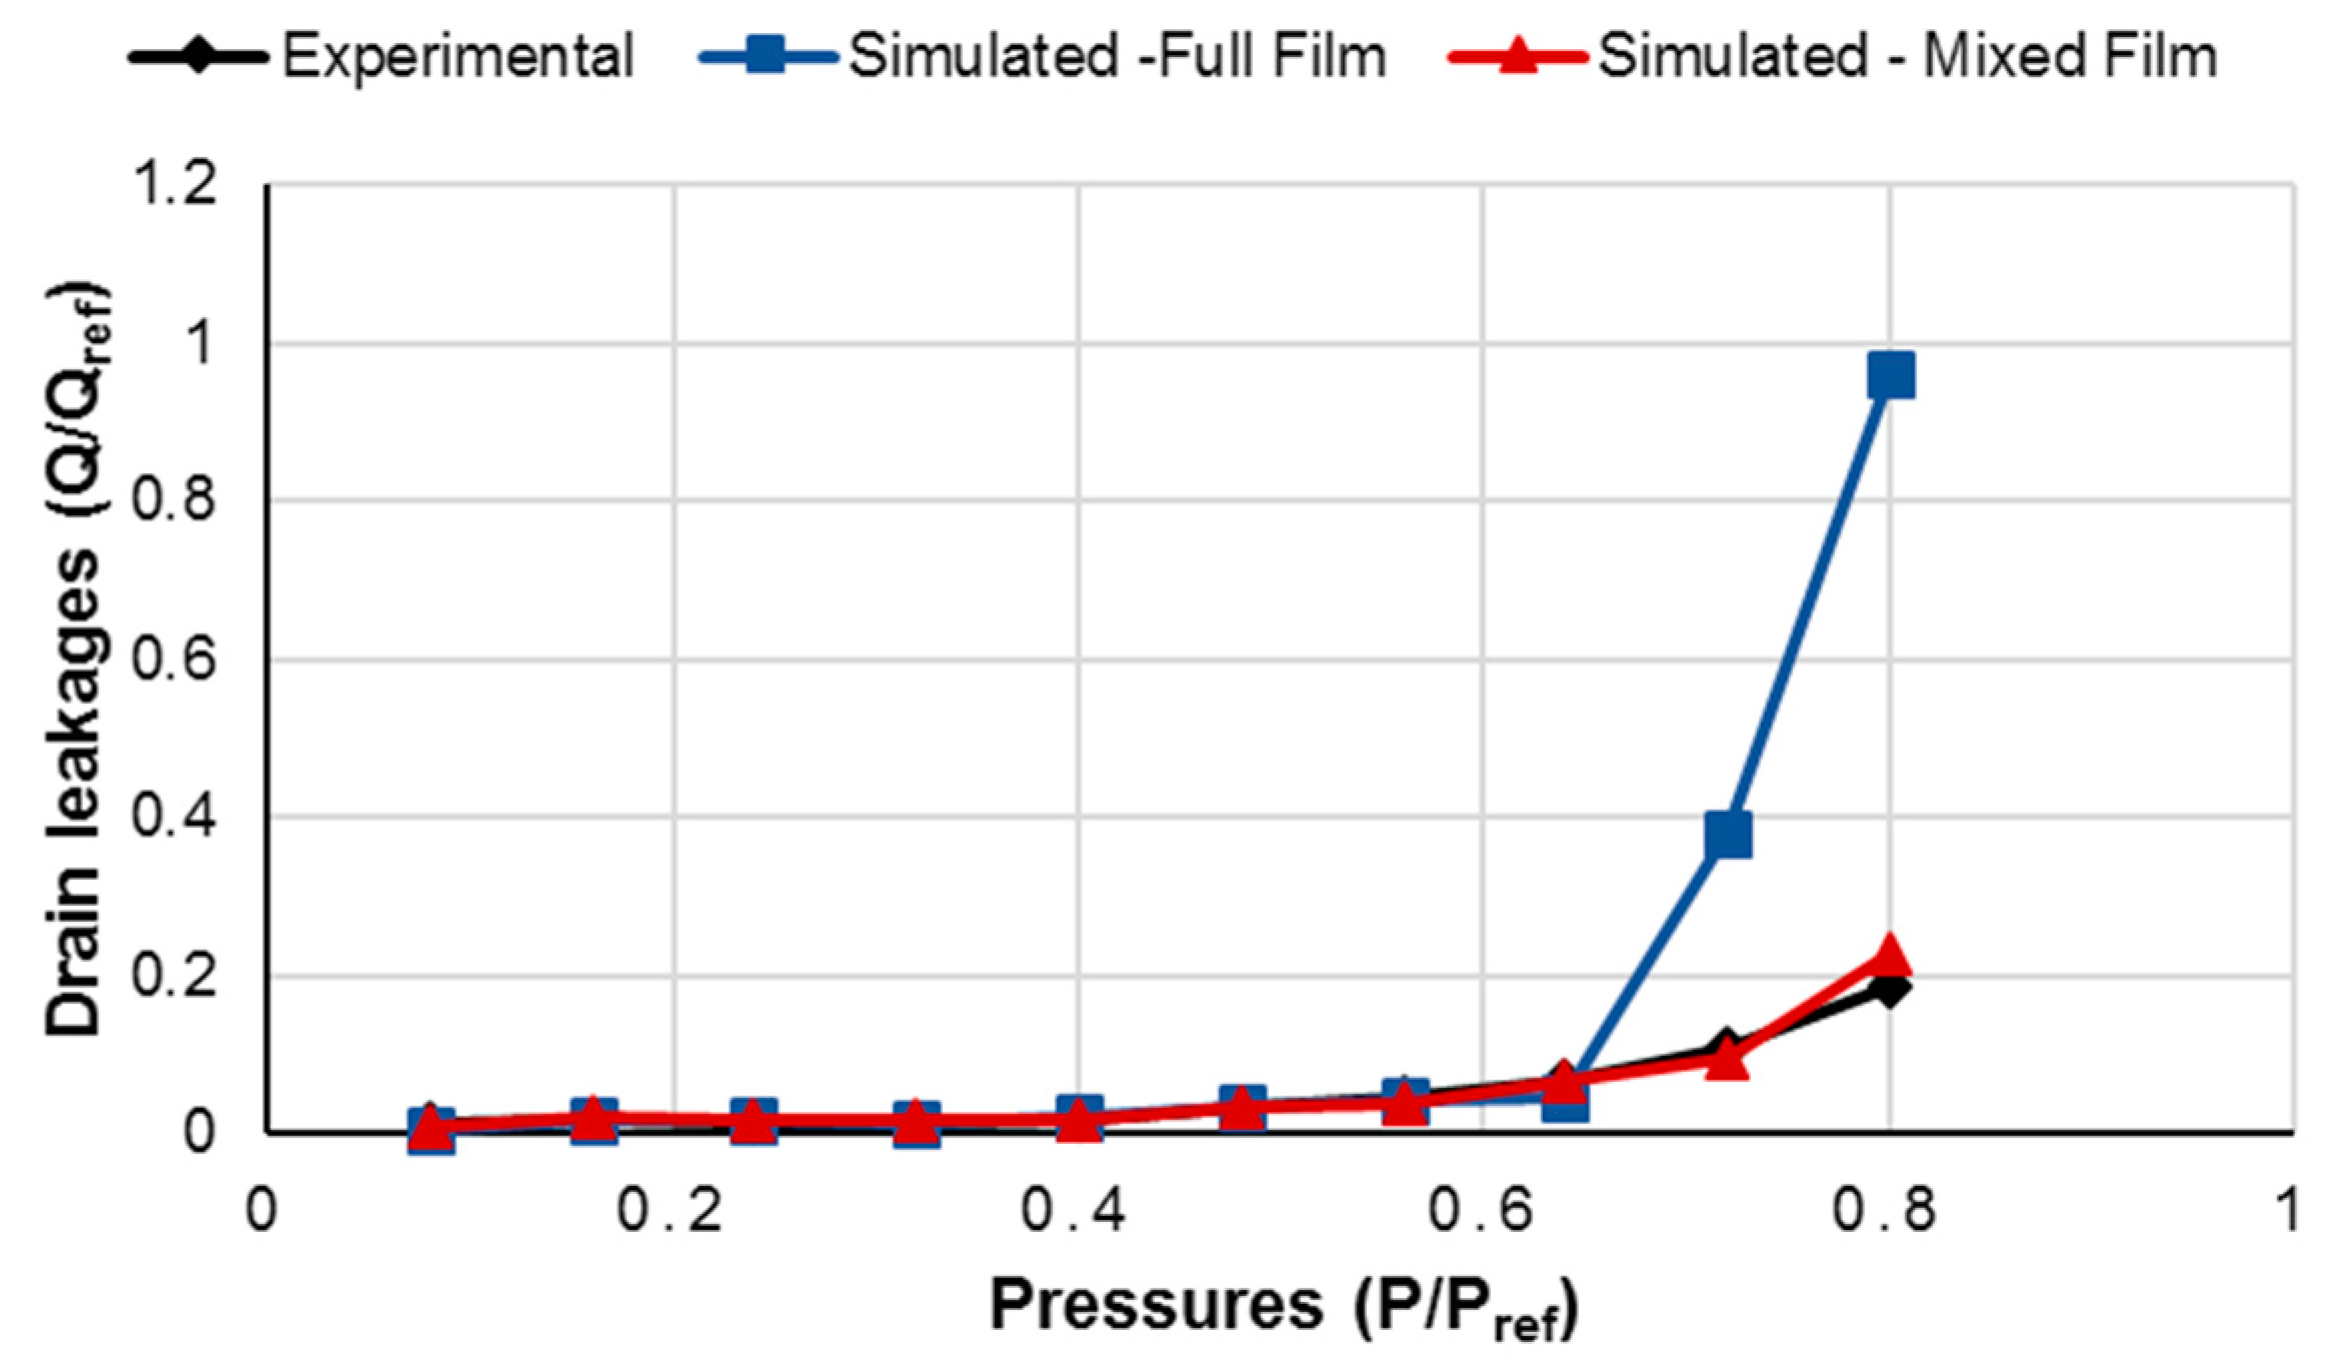
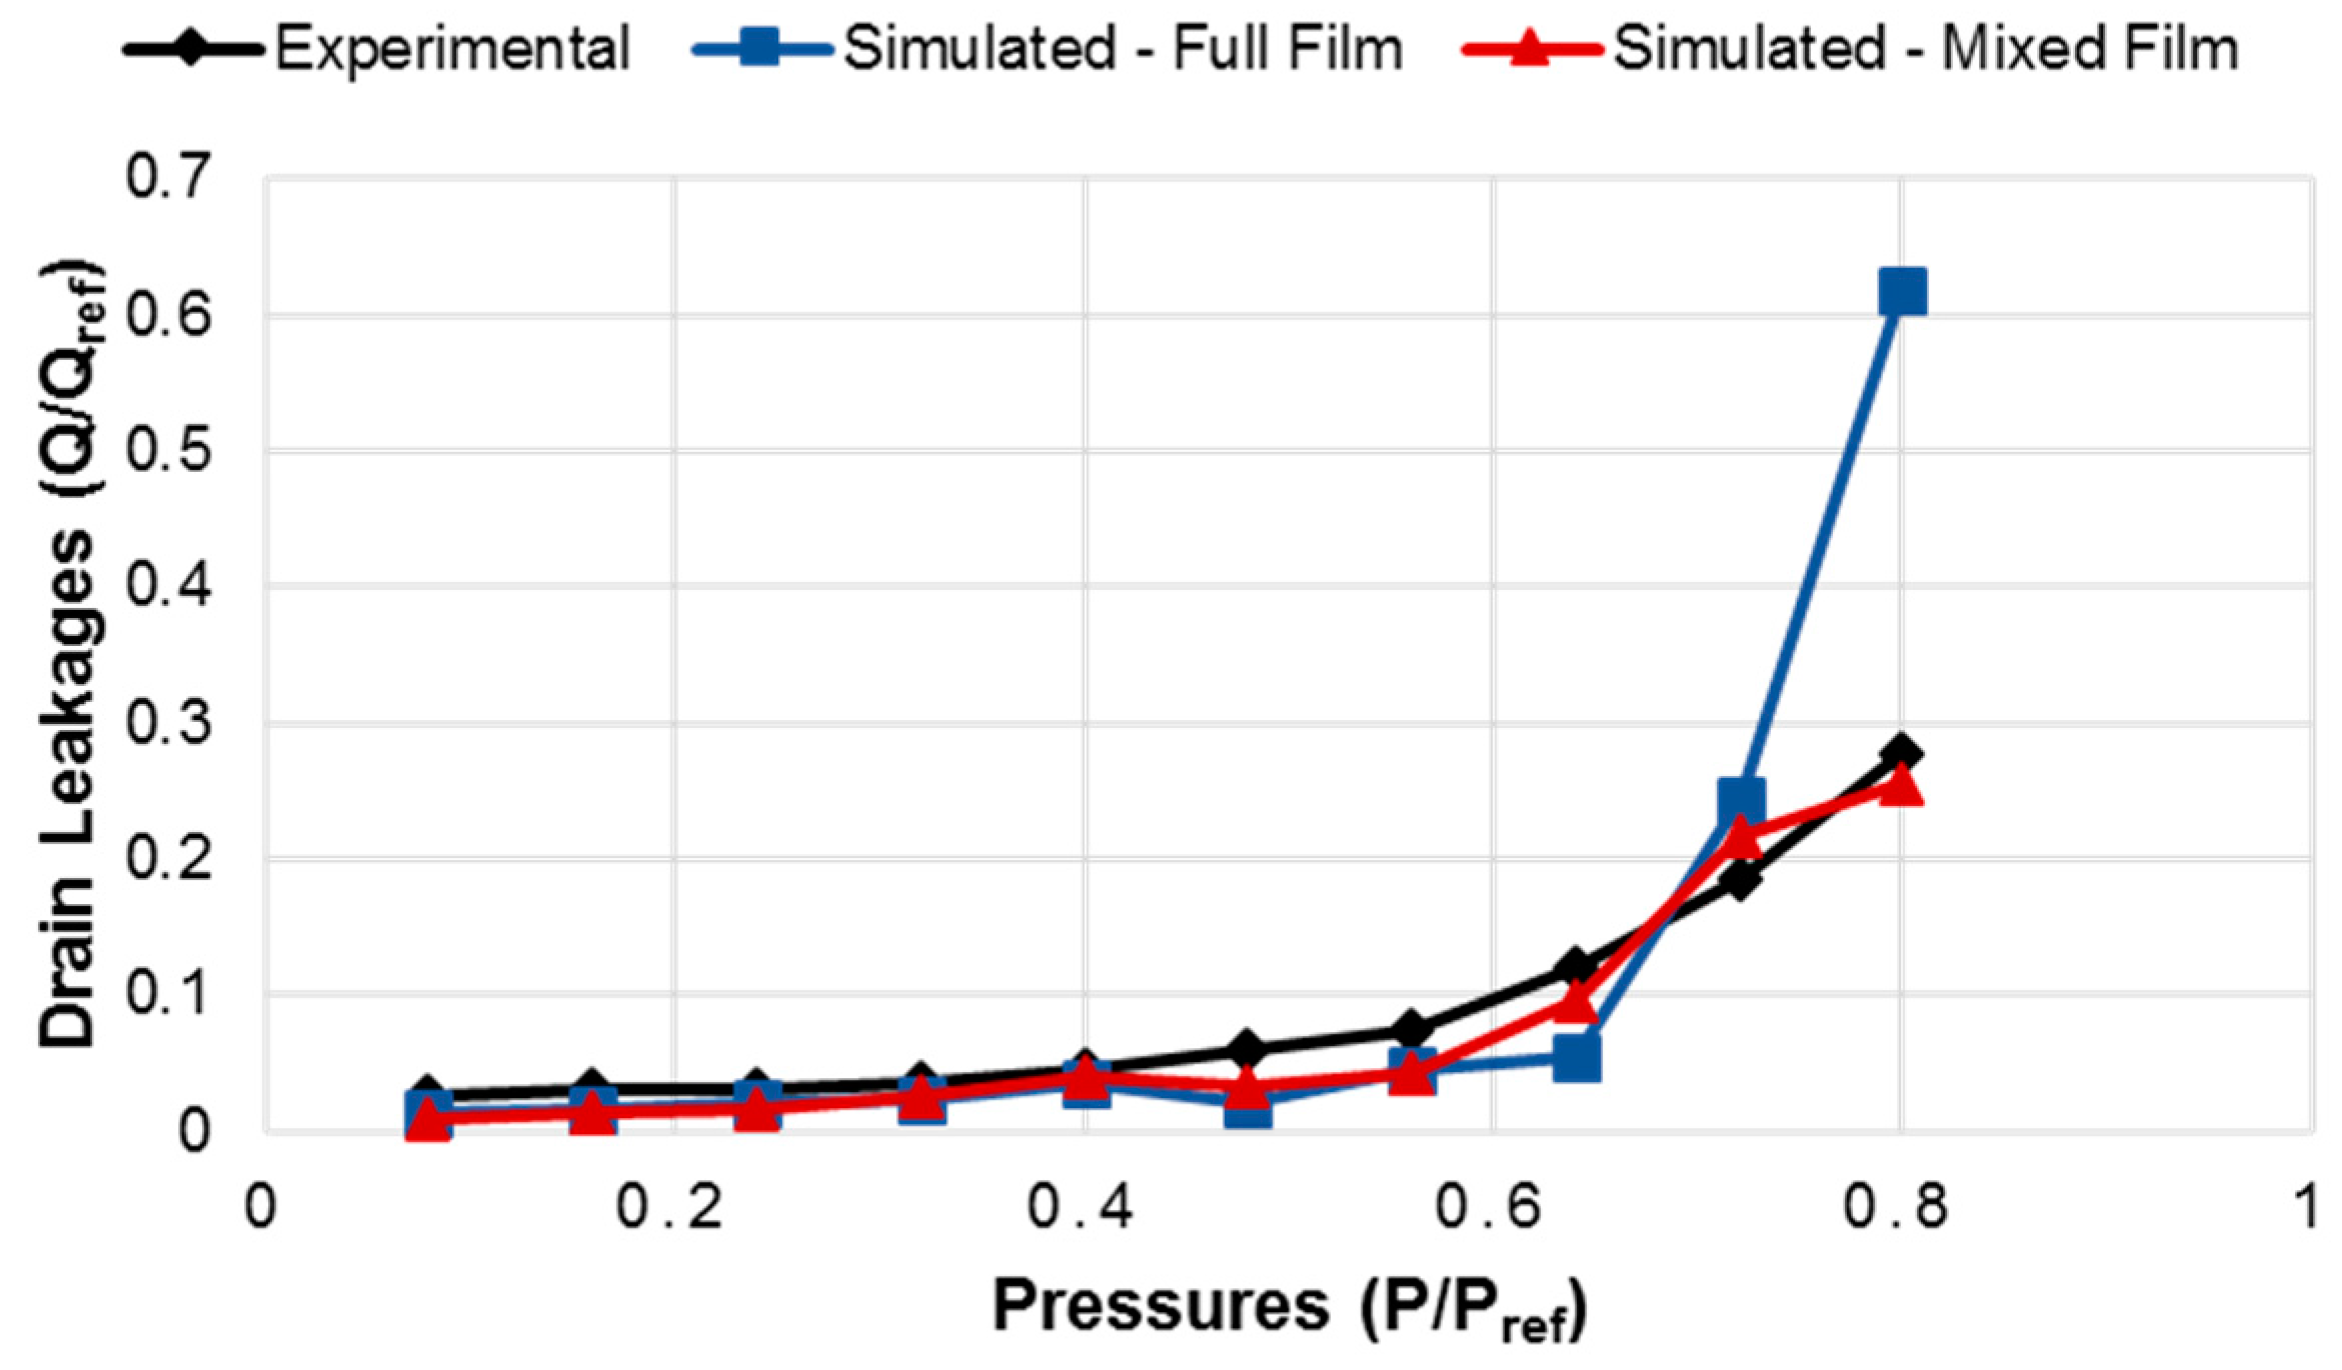
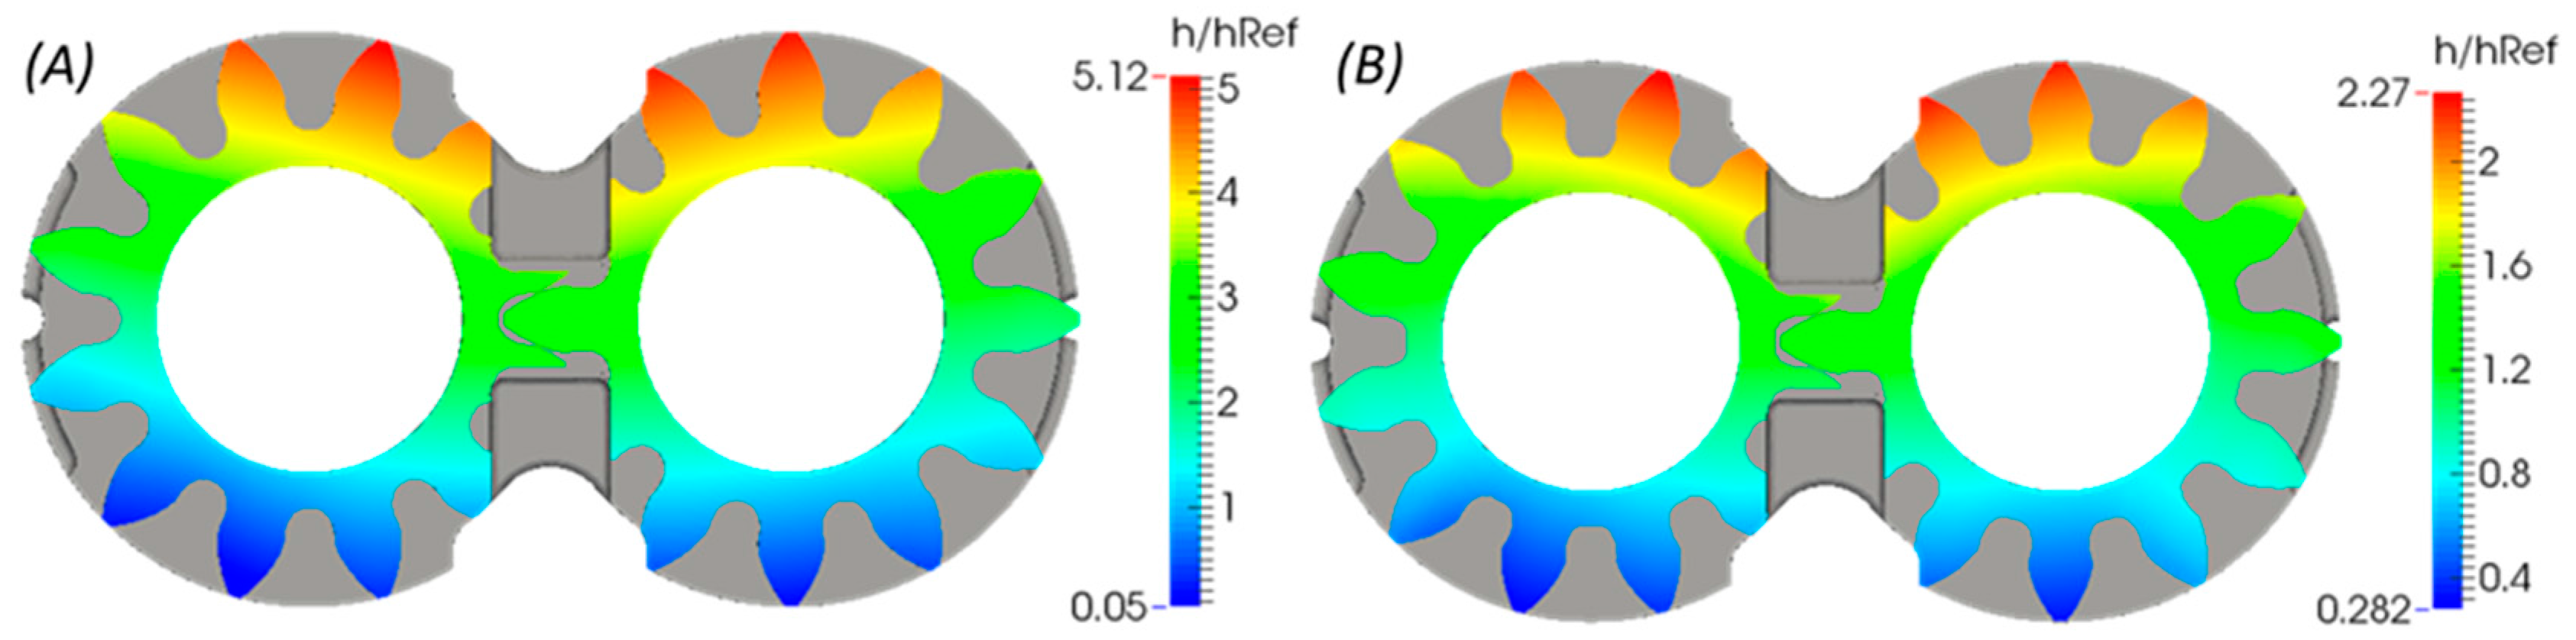
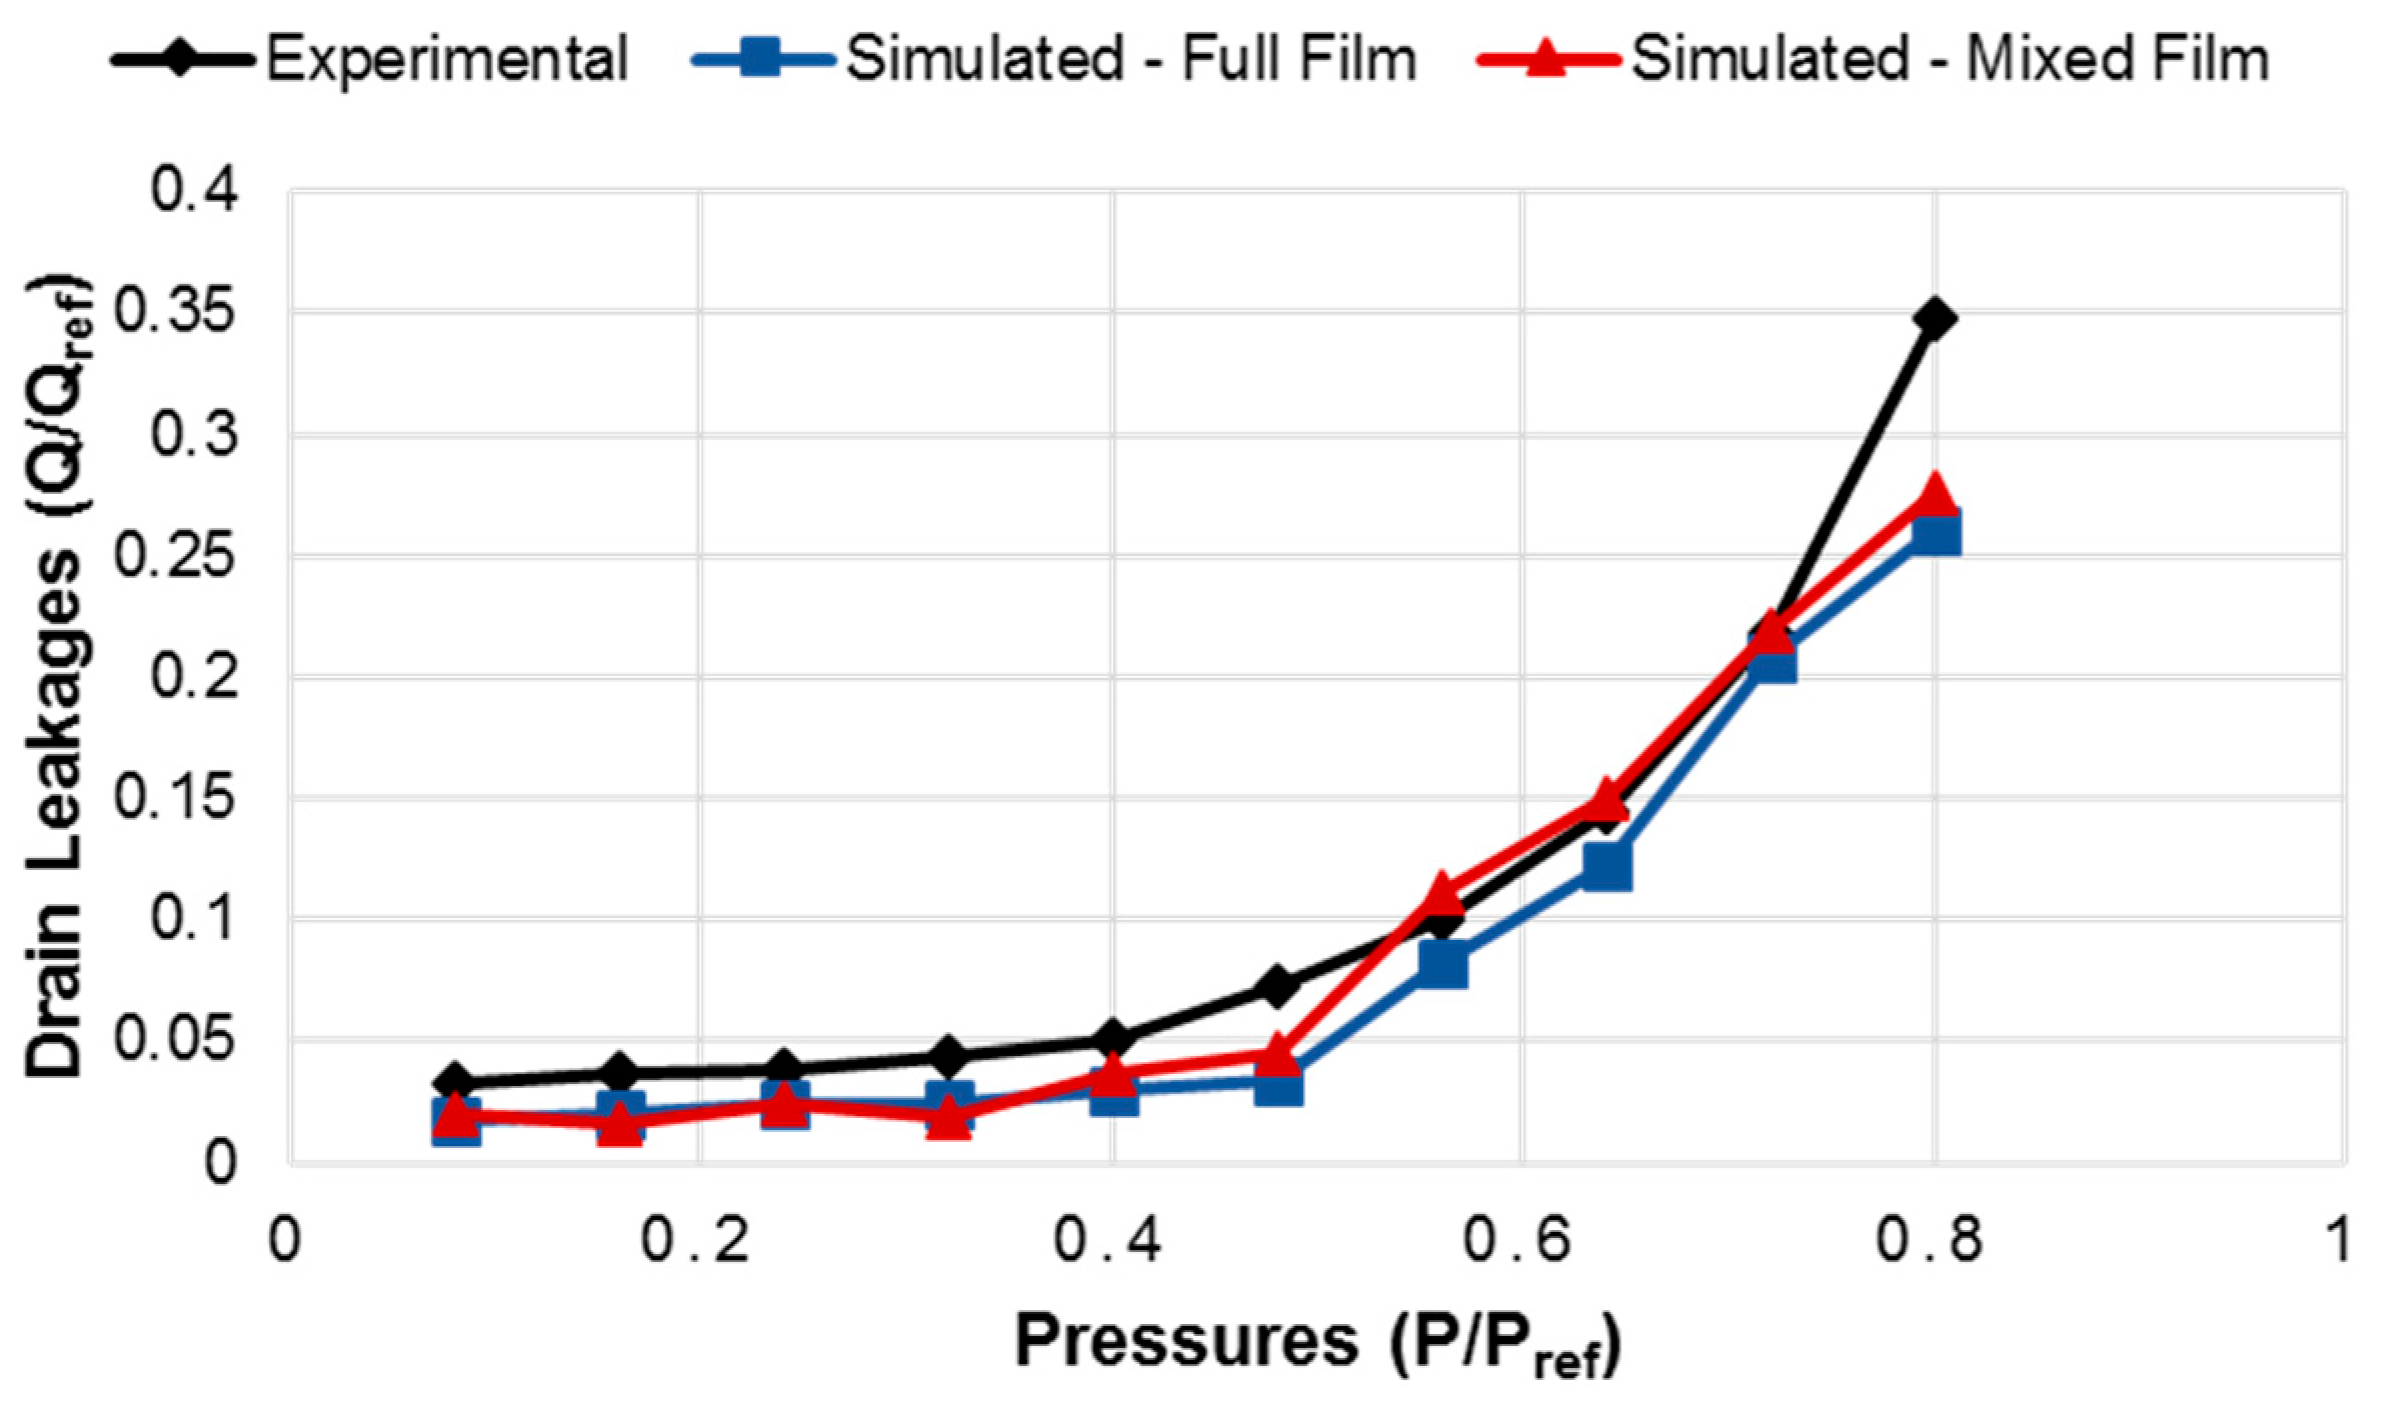
Figure 13 shows the comparison of the experimental drain leakages at an operating speed of 500 rpm with the corresponding results obtained from simulating the lateral interface using the full and mixed film lubricating gap models. It can be seen from the plots that the two models predict quite closely to the experimental measurements for pressures up to
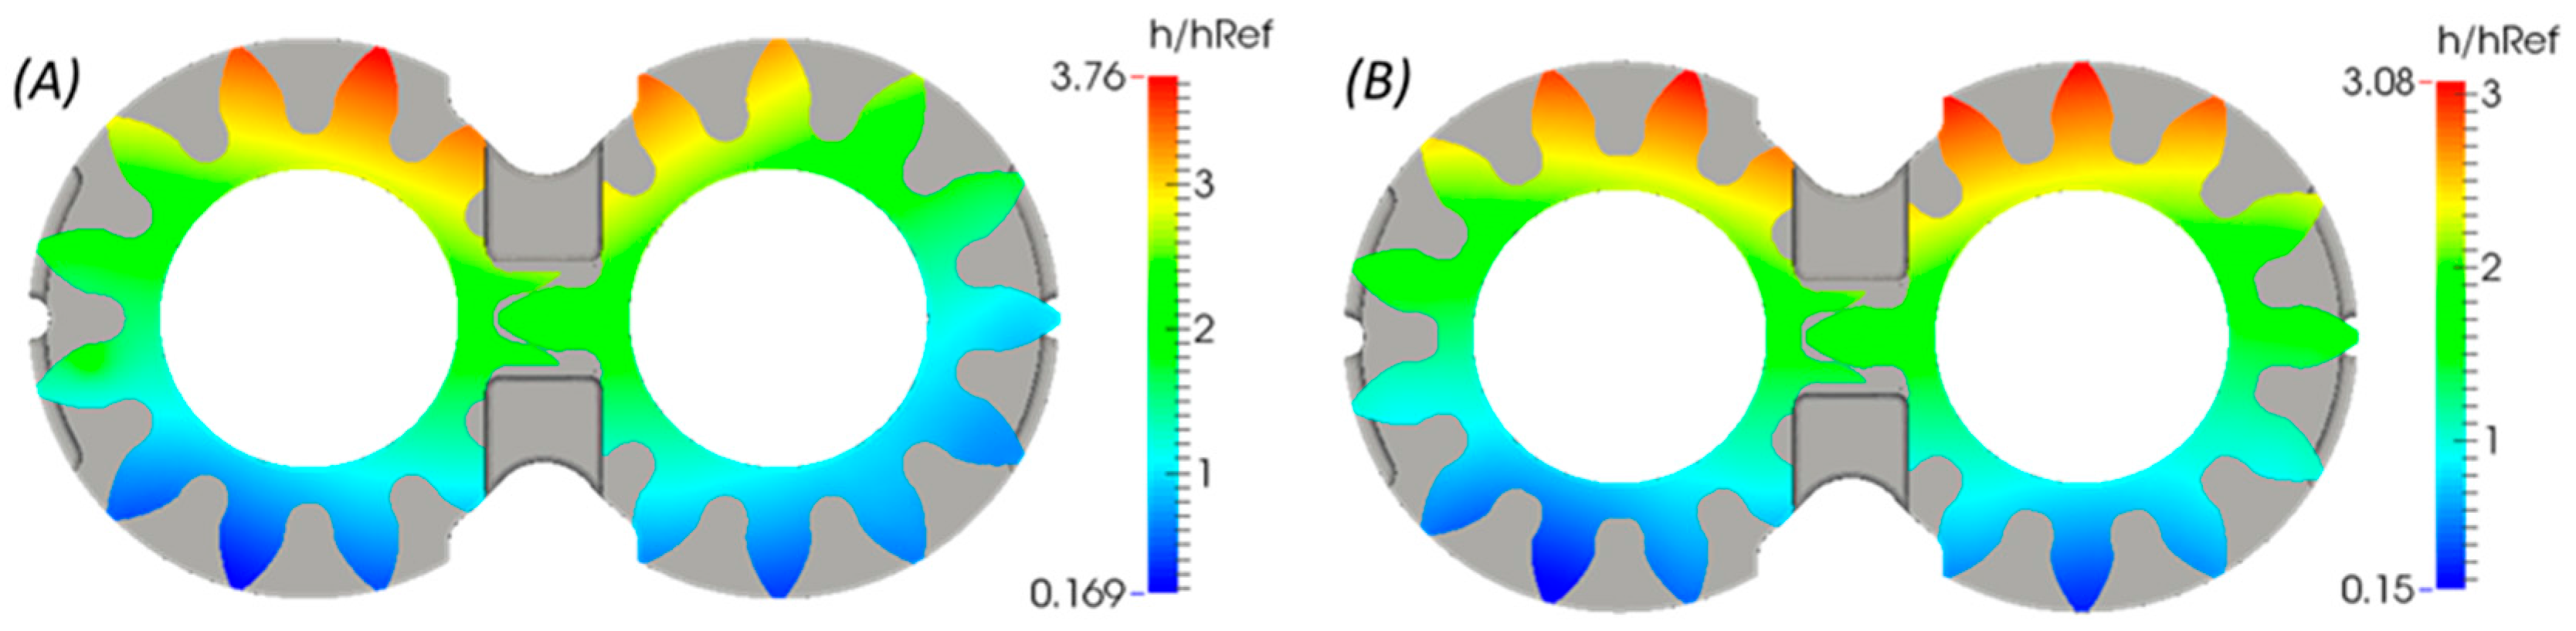
. At higher pressures, the mixed film model is closer to the experiments than the full film model indicating dominant mixed lubricating conditions. This can be supported by observing film thickness plots predicted by the two models in
Figure 14, at 500 rpm and
. The surface roughness for the mixed-TEHD model was set at
and the gap heights shown in the plot are normalized using
.
In
Figure 14, there is a considerable difference in the high and low film thickness predicted by the full film gap model and this results in sharp contact regions near the suction side which indicates mixed film conditions. Although the spatial orientation of the gap predicted by the mixed film model remains similar to its full film counterpart, a considerable difference between the gap height values is present. While the highest film thickness predicted by the mixed film model is lower than the corresponding prediction from the full film model, the minimum gap height is higher. This is due to the load sharing by the surface asperities along with the application point of the resulting contact force which does not reveal sharp contact regions. Thus, the leakages predicted by the mixed film model is lower than the full film model and this is supported by the corresponding experimental measurements.
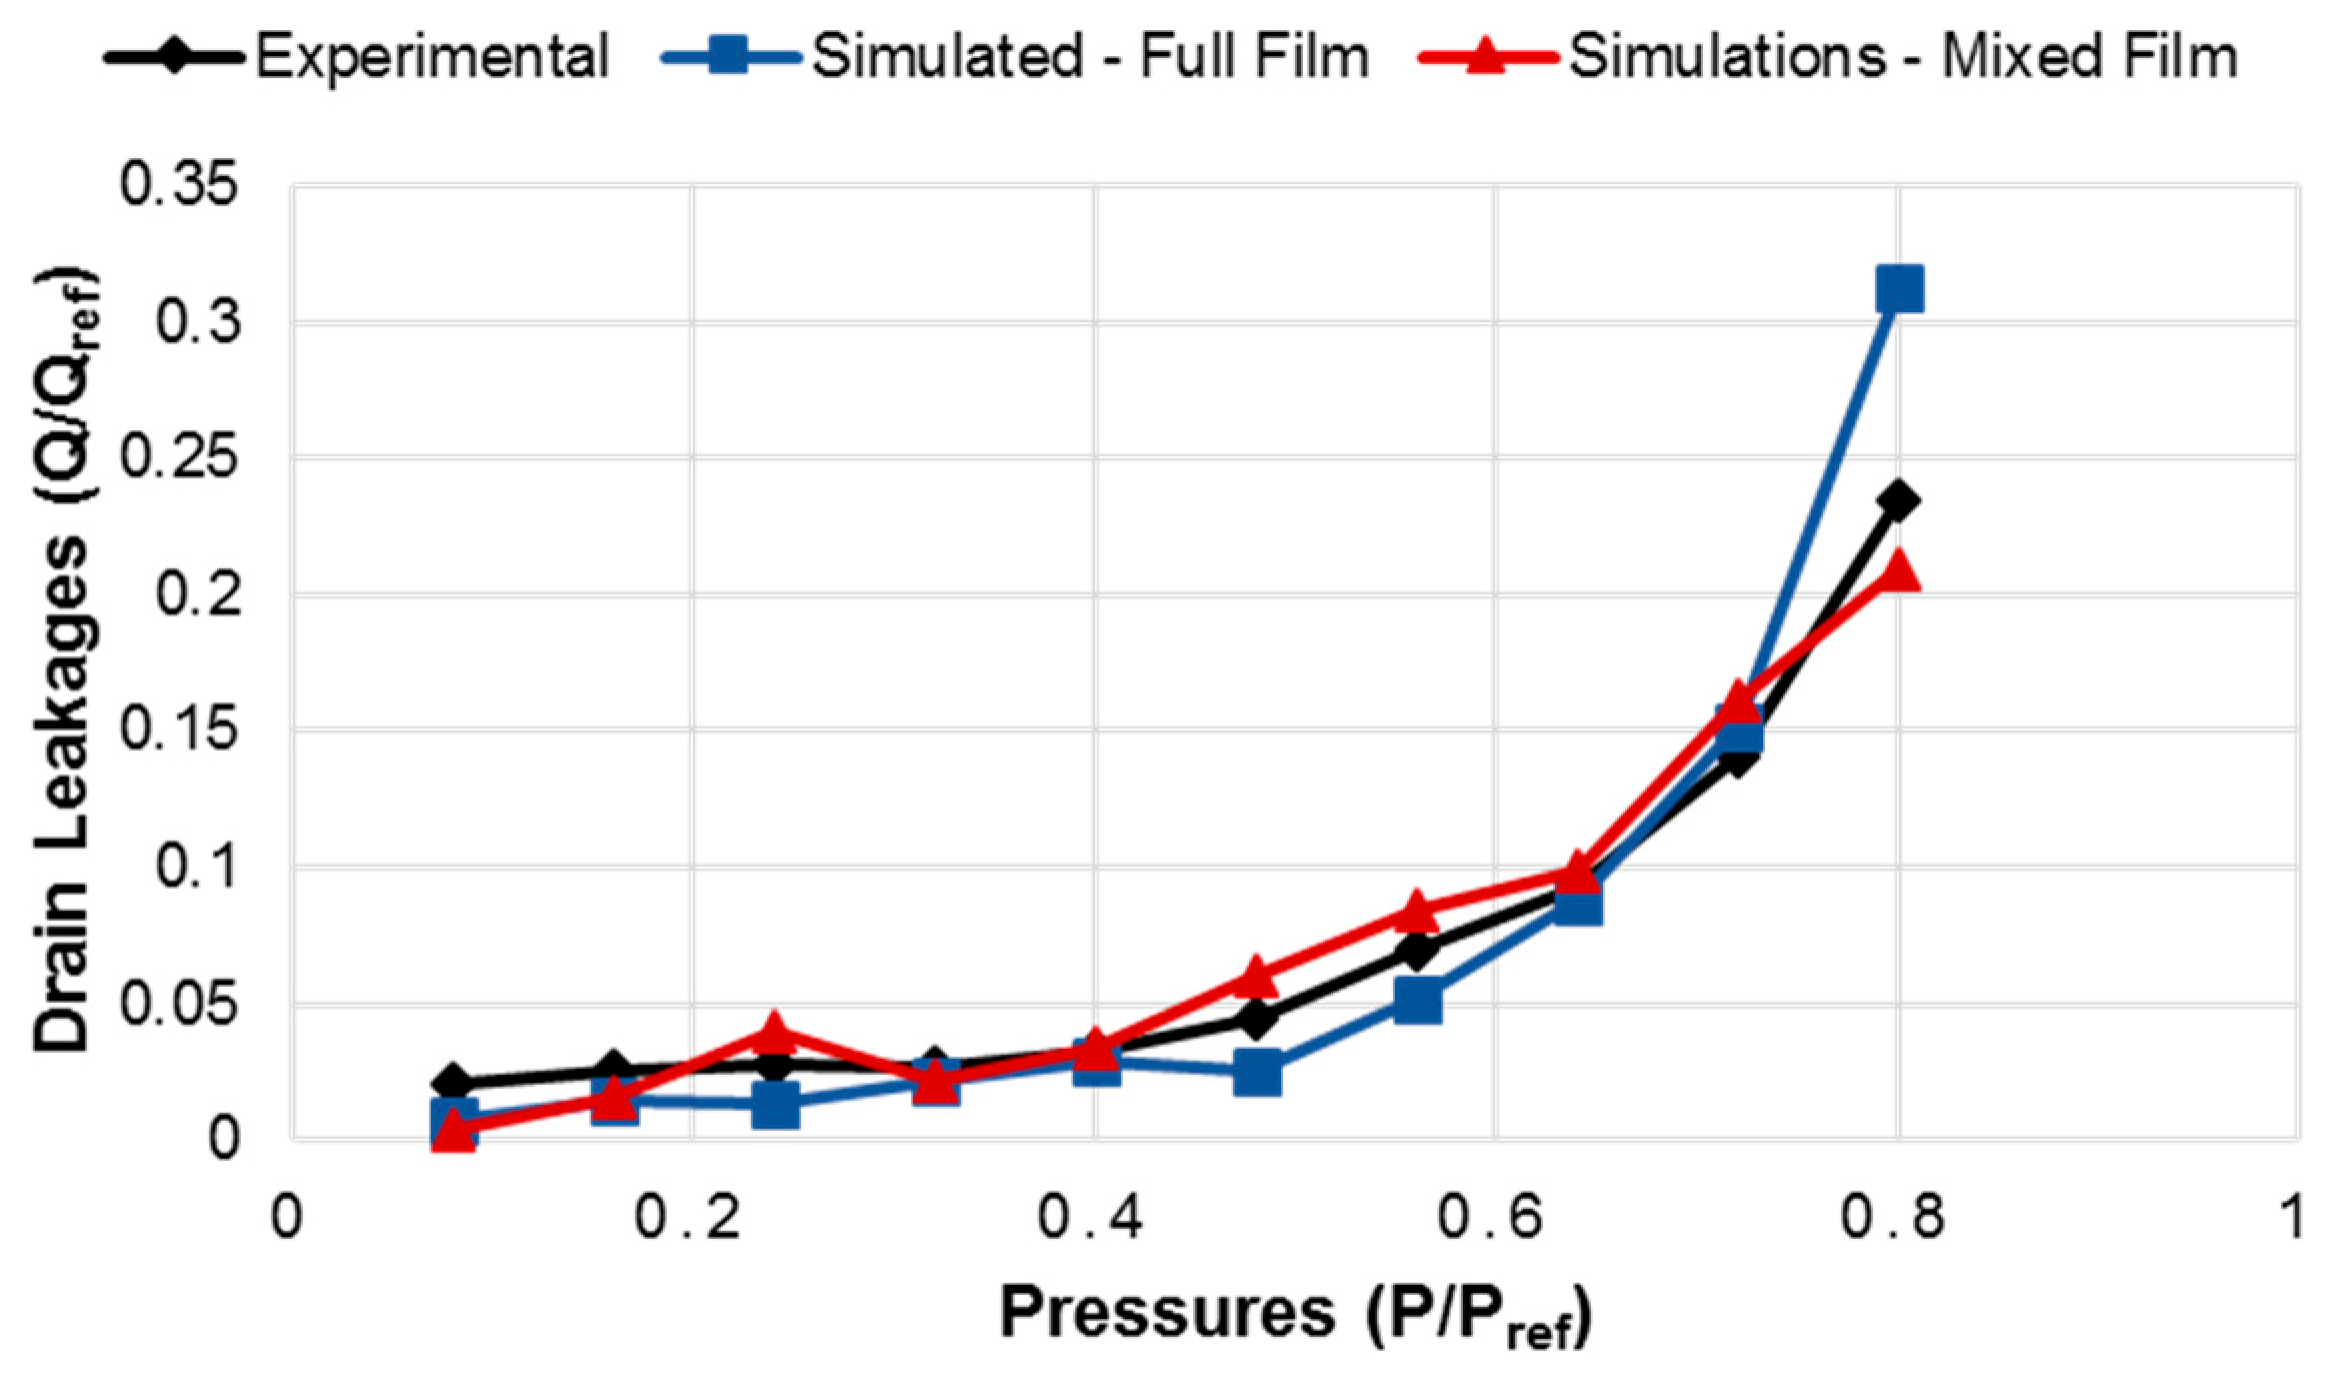
The comparison of the experimental measurements of leakages with the full film and mixed film models for operating speeds of 1000, 1500 and 2000 rpm are shown in
Figure 15,
Figure 16 and
Figure 17, respectively.
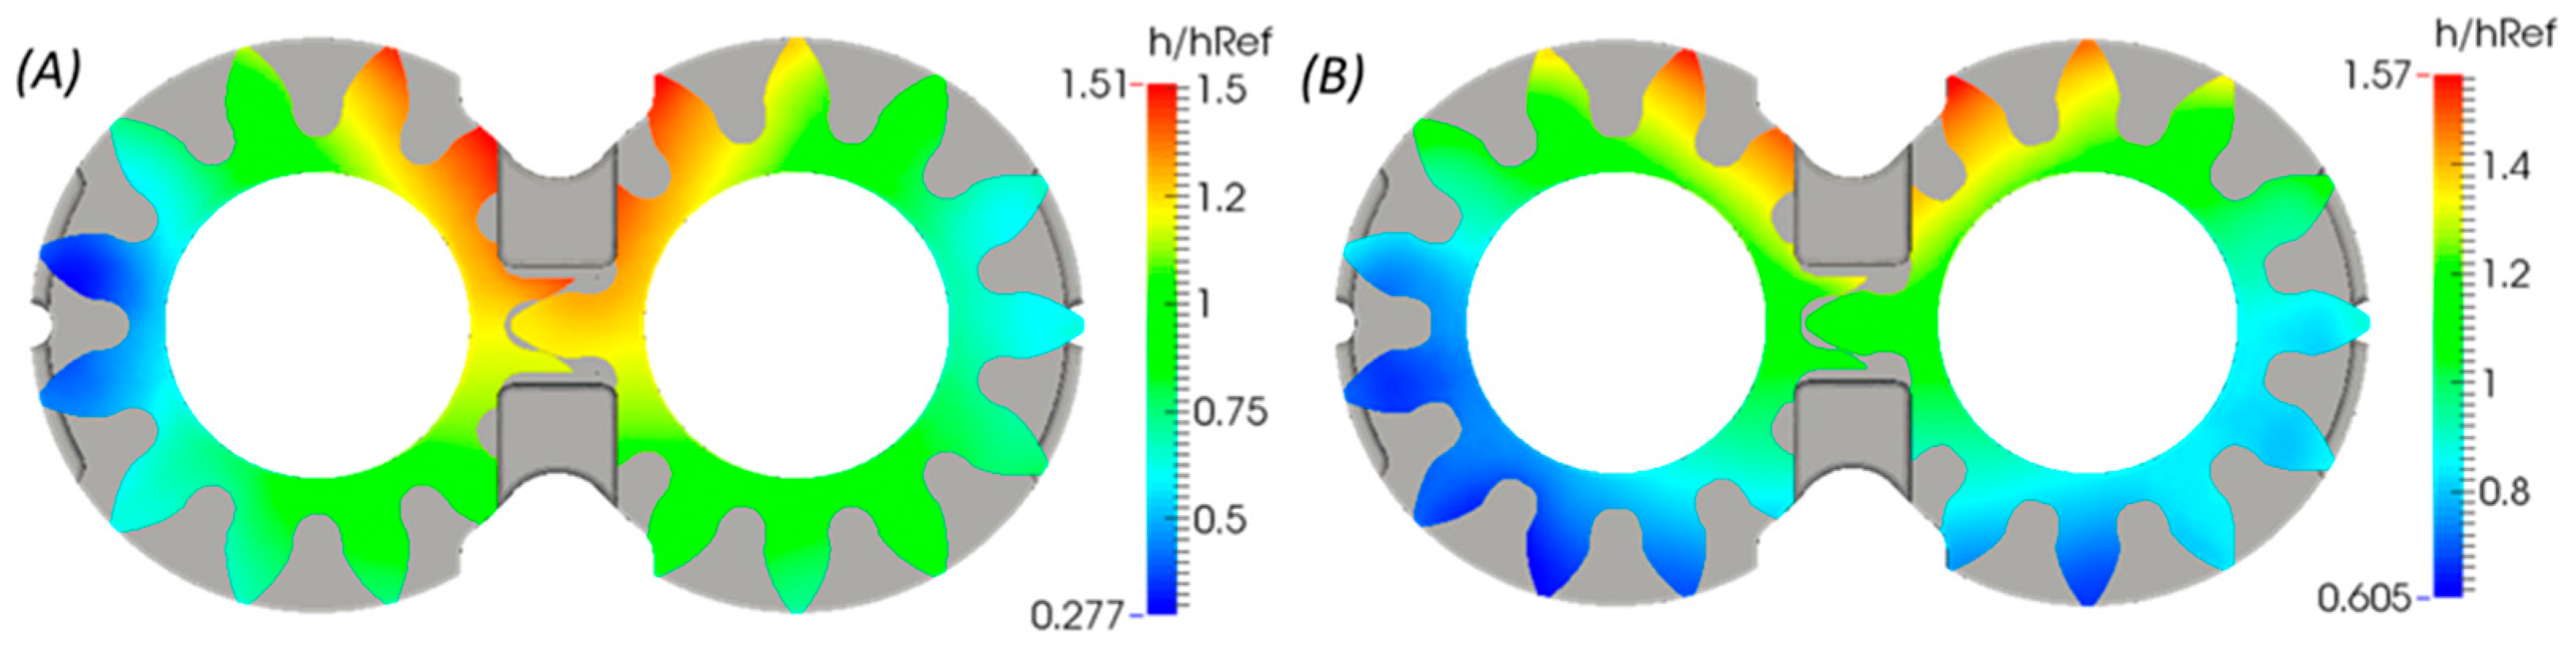
It can be seen from the plots that while the trends in terms of the variation of the leakages with the operating pressures predicted by both the lateral gap models are identical to the experimental values, certain differences exist between them. At higher pressures, these differences between the mixed and full film gap models are more dominant due to the presence of higher film thicknesses in the lateral gap and consequently higher leakages. This difference is especially significant and its magnitude is amplified due to the cubic relationship between gap heights and leakages which was indicated earlier in this section. These reasons can be supported by the gap film thickness plots predicted by both the mixed film and full film models at the same operating speed of 1500 rpm, but at different pressures
and
in
Figure 18 and
Figure 19, respectively.
In the operating condition at higher pressure shown in
Figure 18, there is a considerable variation in the magnitudes of the gap heights predicted by the two models which results in a substantial variation in the leakages predicted by the models at this operating condition as shown in
Figure 16. Some instances of mixed lubrication are also noticed in the operating condition in
Figure 19, where an increase in the minimum gap height prediction from the mixed film model is observed. While this does not result in a dominant variation in the leakages as seen in
Figure 16, the prediction from the mixed lubrication is still closer to the experimental measurements, which further confirms the influence of surface asperities even at these nearly full film conditions. Therefore, these studies support the predictions of the mixed lubrication model developed in this work at a wide range of operating conditions, including those closer to full film behavior of the lateral gap. Since a stronger variation between the full film and mixed film models are found at lower speeds, future work in this research will include investigating other performance parameters of the lateral gap at very low operating speeds, such as the viscous friction losses which affect the hydro-mechanical efficiency of the EGM with the help of the mixed lubrication model.
4. Conclusions
In the present work, a mixed-TEHD model for the lateral lubricating interfaces in EGMs was developed to couple the effects of the surface features with the fluid, structural and thermal effects in the gap. A stochastic approach for modelling the partial lubrication regime was adopted where the average flow Reynolds equation was used to solve the average pressure in the lateral gap. The model also accounts for the influence of surface asperities in sharing the pressure loads in the interface under partial lubrication conditions, by implementing a rough surface contact model which considers the elastic plastic deformation of the asperities. The resulting contribution of the surface contact evaluations to the axial balance of the EGM as well as the heat dissipation in the interface were also taken into account in the mixed film model. The predictions from the developed model were supported with the help of direct leakage measurements in a specially made prototype EGM. Since the sensitivity of the leakages with the film thickness predictions is quite high, the improved prediction by the mixed lubrication model over the full film model was demonstrated using the leakage measurements at higher pressures where increased chances of mixed lubrication were found.
The mixed-TEHD model for the lateral lubricating interface developed in this work further expands the capabilities of the gap model to predict the operation of an EGM at a wider range of delivery pressures, shaft speeds and working fluids, where the chances of occurrences of partial lubrication are dominant. The present work establishes the improved performance of the mixed film model over the previously developed full film model when compared to experimental leakage measurements at a range of operating conditions presented in this study. Such a comprehensive model for the lateral gaps which can predict extended operations of EGM has immense potential to drive novel, efficient and reliable EGM designs. Thus, the future directions of this research will include utilizing this mixed-lubrication model to investigate and improve the overall performance of EGMs at such severe operating pressures and speeds.


