Article

The Effect of Distributed Parameters on Conducted EMI from DC-Fed Motor Drive Systems in Electric Vehicles

1
National Engineering Laboratory for Electric Vehicle, Beijing Institute of Technology, Beijing 100081, China
2
Co-Innovation Center of Electric Vehicles in Beijing, Beijing Institute of Technology, Beijing 100081, China
3
Beijing Institute of Radio Metrology and Measurement, Beijing 100854, China
*
Author to whom correspondence should be addressed.
Energies 2017, 10(1), 1; https://doi.org/10.3390/en10010001
Submission received: 18 August 2016 / Revised: 9 December 2016 / Accepted: 12 December 2016 / Published: 22 December 2016
(This article belongs to the Special Issue Advances in Electric Vehicles and Plug-in Hybrid Vehicles 2017)

Abstract

:
The large dv/dt and di/dt outputs of power devices in DC-fed motor drive systems in electric vehicles (EVs) always introduce conducted electromagnetic interference (EMI) emissions and may lead to motor drive system energy transmission losses. The effect of distributed parameters on conducted EMI from the DC-fed high voltage motor drive systems in EVs is studied. A complete test for conducted EMI from the direct current fed(DC-fed) alternating current (AC) motor drive system in an electric vehicle (EV) under load conditions is set up to measure the conducted EMI of high voltage DC cables and the EMI noise peaks due to resonances in a frequency range of 150 kHz–108 MHz. The distributed parameters of the motor can induce bearing currents under low frequency sine wave operation. However the impedance of the distributed parameters of the motor is very high at resonance frequencies of 500 kHz and 30 MHz, and the effect of the bearing current can be ignored, so the research mainly focuses on the distributed parameters in inverters and cables at 500 kHz and 30 MHz, not the effect of distributed parameters of the motor on resonances. The corresponding equivalent circuits for differential mode (DM) and common mode (CM) EMI at resonance frequencies of 500 kHz and 30 MHz are established to determine the EMI propagation paths and analyze the effect of distributed parameters on conducted EMI. The dominant distributed parameters of elements responsible for the appearing resonances at 500 kHz and 30 MHz are determined. The effect of the dominant distributed parameters on conducted EMI are presented and verified by simulation and experiment. The conduced voltage at frequencies from 150 kHz to 108 MHz can be mitigated to below the limit level-3 of CISPR25 by changing the dominant distributed parameters.

1. Introduction

In the face of the worldwide demand for reduction in greenhouse gas emissions and PM2.5 production [1], recently many countries have adopted policies, mainly in the form of tax incentives for the purchase, to increase the number of electric vehicles (EVs) and thus reduce pollutant emissions and improve the air quality, especially in urban areas [2,3,4,5]. Electromagnetic interference (EMI) considerations in EVs have become increasingly important, as the electromagnetic compatibility (EMC) regulations for EVs (typically defined from 10 kHz to 30 MHz) have become more stringent [6]. The DC-fed motor drive system of EVs, consisting of the electric motor, power inverter, and electronic controller has an essential role in EVs [7]. Large dv/dt and di/dt due to high-speed switching of power devices within a DC-fed voltage-type pulse width modulation (PWM) inverter of high-power-density and high-efficiency motor drive system always introduce unwanted higher-order harmonics currents and high frequency noise currents through parasitic/distributed parameters of the motor system [8,9,10], and are mainly responsible for the conducted and/or radiated electromagnetic interference (EMI) emissions which will greatly affect the behavior of low voltage supply electronic equipment (such as board bus system, sensors, vehicle control units (VCUs), battery management systems (BMSs), power batteries, and the drive motor in EVs [6,11]. Additionally, the unwanted higher-order harmonics current from the motor drive system due to the switching of insulated gate bipolar transistors (IGBTs) can not only generate common mode (CM) EMI and differential mode (DM) EMI emissions, but also increase the motor losses, which may lead to energy transmission losses and thermal problems in the power inverter system.

1.1. Literature Review

Much valuable work involving the EMI emissions of the motor drive system for conventional industrial applications has been widely conducted by many researchers [12,13,14]. However, the EMI from the drive motor system under varying load conditions for EVs is different from that of a conventional industrial motor with no load or invariant load conditions. Previous studies on EMI emissions from vehicle components are based on the measurements specified in the EMC standard CISPR25 (International Special Committee on Radio Interference 25) [15,16], which are implemented for low voltage components in EVs and not suitable for the high voltage applications in EVs (e.g., motor system, charging system), so we cannot correctly predict the EMI emissions from the high voltage motor system in EVs due to the fact few EMC laboratories have the dynamometer needed to study EVs under varying loading conditions, so the present study on the EMI mechanism and propagation path of the motor system is much less than that on the total EMC performance of EVs [17,18]. The EMI emissions from the high voltage cables of the AC motor drive system of EVs under load condition have not been considered in previous works.
Various parasitics and distributed parameters exist inside the motor system and they play a very important role in the generation of EMI. The high-frequency leakage currents flowing to the ground could be generated through distributed parameters between the components of the motor drive system (such as the motor, inverter, cables, etc.) and the chassis of the body of the EV at high frequency, and introduce the radiation of power cables, shaft voltage and bearing currents in the motor [19,20]. Additionally the EMI emission peaks due to resonances caused by distributed parameters may cause some energy losses of the motor drive system and decrease the efficiency of the system [21,22,23], so the distributed parameters at high frequency in the system should not be neglected anymore for EVs. Therefore, the effect of the distributed parameters on EMI emissions is important for identification of EMI propagation paths and the critical distributed parameters of elements responsible for EMI, and mitigation of EMI emissions [24].
Models of the motor drive system are necessary to analyze and predict the EMI sources and propagation inside the motor drive system to find the elements responsible for the EMI. Since the most basic and widely applied full-wave models based on the “black box” approach cannot show the location of the noise source or the propagation path inside the motor power inverter [20,25], some terminal modeling techniques for a two-port network were proposed to predict the conducted EMI [14,21,26]. However, there has never been a theoretical analysis of the parasitic effects of the distributed parameters on EMI noise suppression. An equivalent simulation program with integrated circuit (SPICE)-based model is a better approach to find the parts and elements of the motor inverter system responsible for EMI [12] and analyze the effects of the distributed parameters on the EMI noise. A rather simple measurement-based SPICE model of the motor power inverter has been presented [12] to quickly identify the parts responsible for EMI and help predict resonances between the two ports of the motor power inverter by a straightforward correlation between the system geometry and the parasitic circuit elements [27]. A detailed analysis of current paths and the equivalent circuits at three important resonance frequencies have been presented to determine the EMI propagation path in the motor drive system [6]. A combination of mitigation strategies was designed to mitigate the CM conducted emission by IGBT switching and the radiated emissions of AC cables.
Most of the above work focuses on analyses of CM and DM EMI propagation paths in the system based on a “black box” approach, terminal modeling techniques and SPICE-based models, which have not considered the effect of the distributed parameters of the high voltage motor drive system in EVs on EMI noise, so the previous equivalent circuits of the EMI could not be correctly proposed to accurately and effectively predict the actual source and propagation of the EMI in the system. The effects of the distributed parameters on the conducted EMI noise have not been adequately considered previously because of a lack of the modeling of the conducted EMI from the high voltage motor drive system with suitable parameters and better analysis methods.

1.2. Motivation and Innovation

This study proposes a new method to analyze the effect of distributed parameters on conducted EMI from the DC-fed high voltage motor drive systems in EVs. A complete test for conducted EMI emissions from the AC motor drive system of an EV under load conditions will be set up to measure the conducted EMI of high voltage DC cables and EMI noise peaks due to resonances in a frequency range of 150 kHz–108 MHz. The corresponding equivalent circuits for DM and CM EMI at the resonance frequencies of 500 kHz and 30 MHz are established to determine the EMI propagation paths and analyze the effect of distributed parameters on conducted EMI. The dominant distributed parameters of elements responsible for the resonances appearing at 500 kHz and 30 MHz will be determined. The effect of the dominant distributed parameters on conducted EMI will be verified by simulations and experiments.

1.3. Organization of the Paper

The organization of this study is as follows: Section 2 illustrates the structure of the complete test setup for conducted EMI emissions from the AC motor drive system of an EV. Then, the corresponding current paths and equivalent circuits of DM and CM EMI at resonance frequencies of 500 kHz and 30 MHz, and the effect of distributed parameters on CM EMI will be presented in Section 3. After that, the simulation verification and discussion will be illustrated in Section 4. The experiment verification will be discussed in Section 5. Finally, conclusions are provided in Section 6.

2. System Conducted Emission Measurement

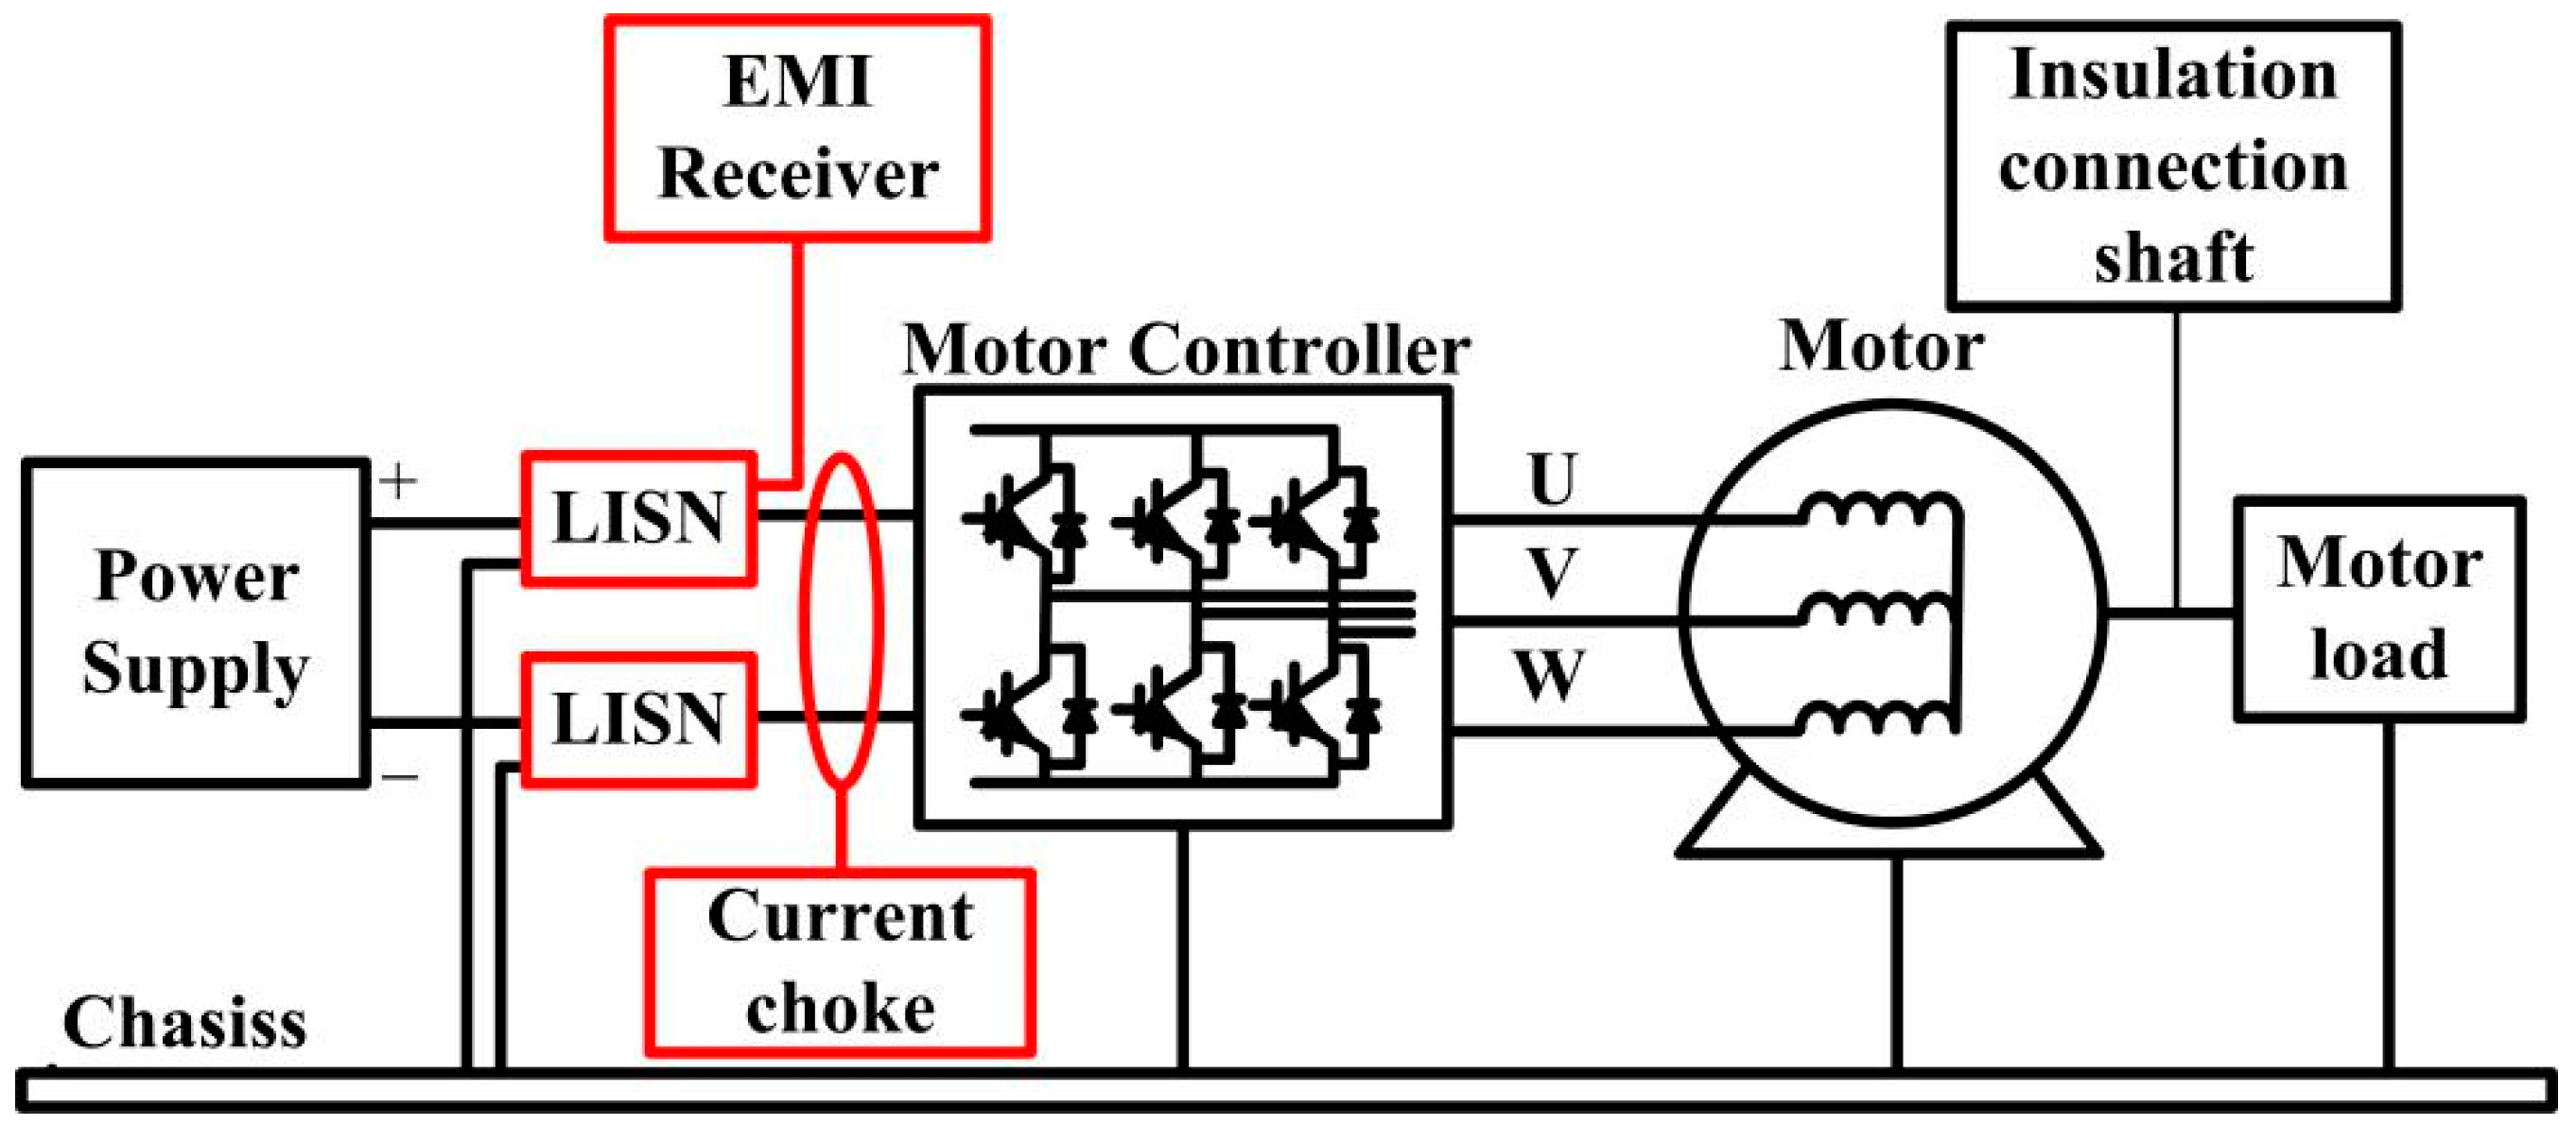
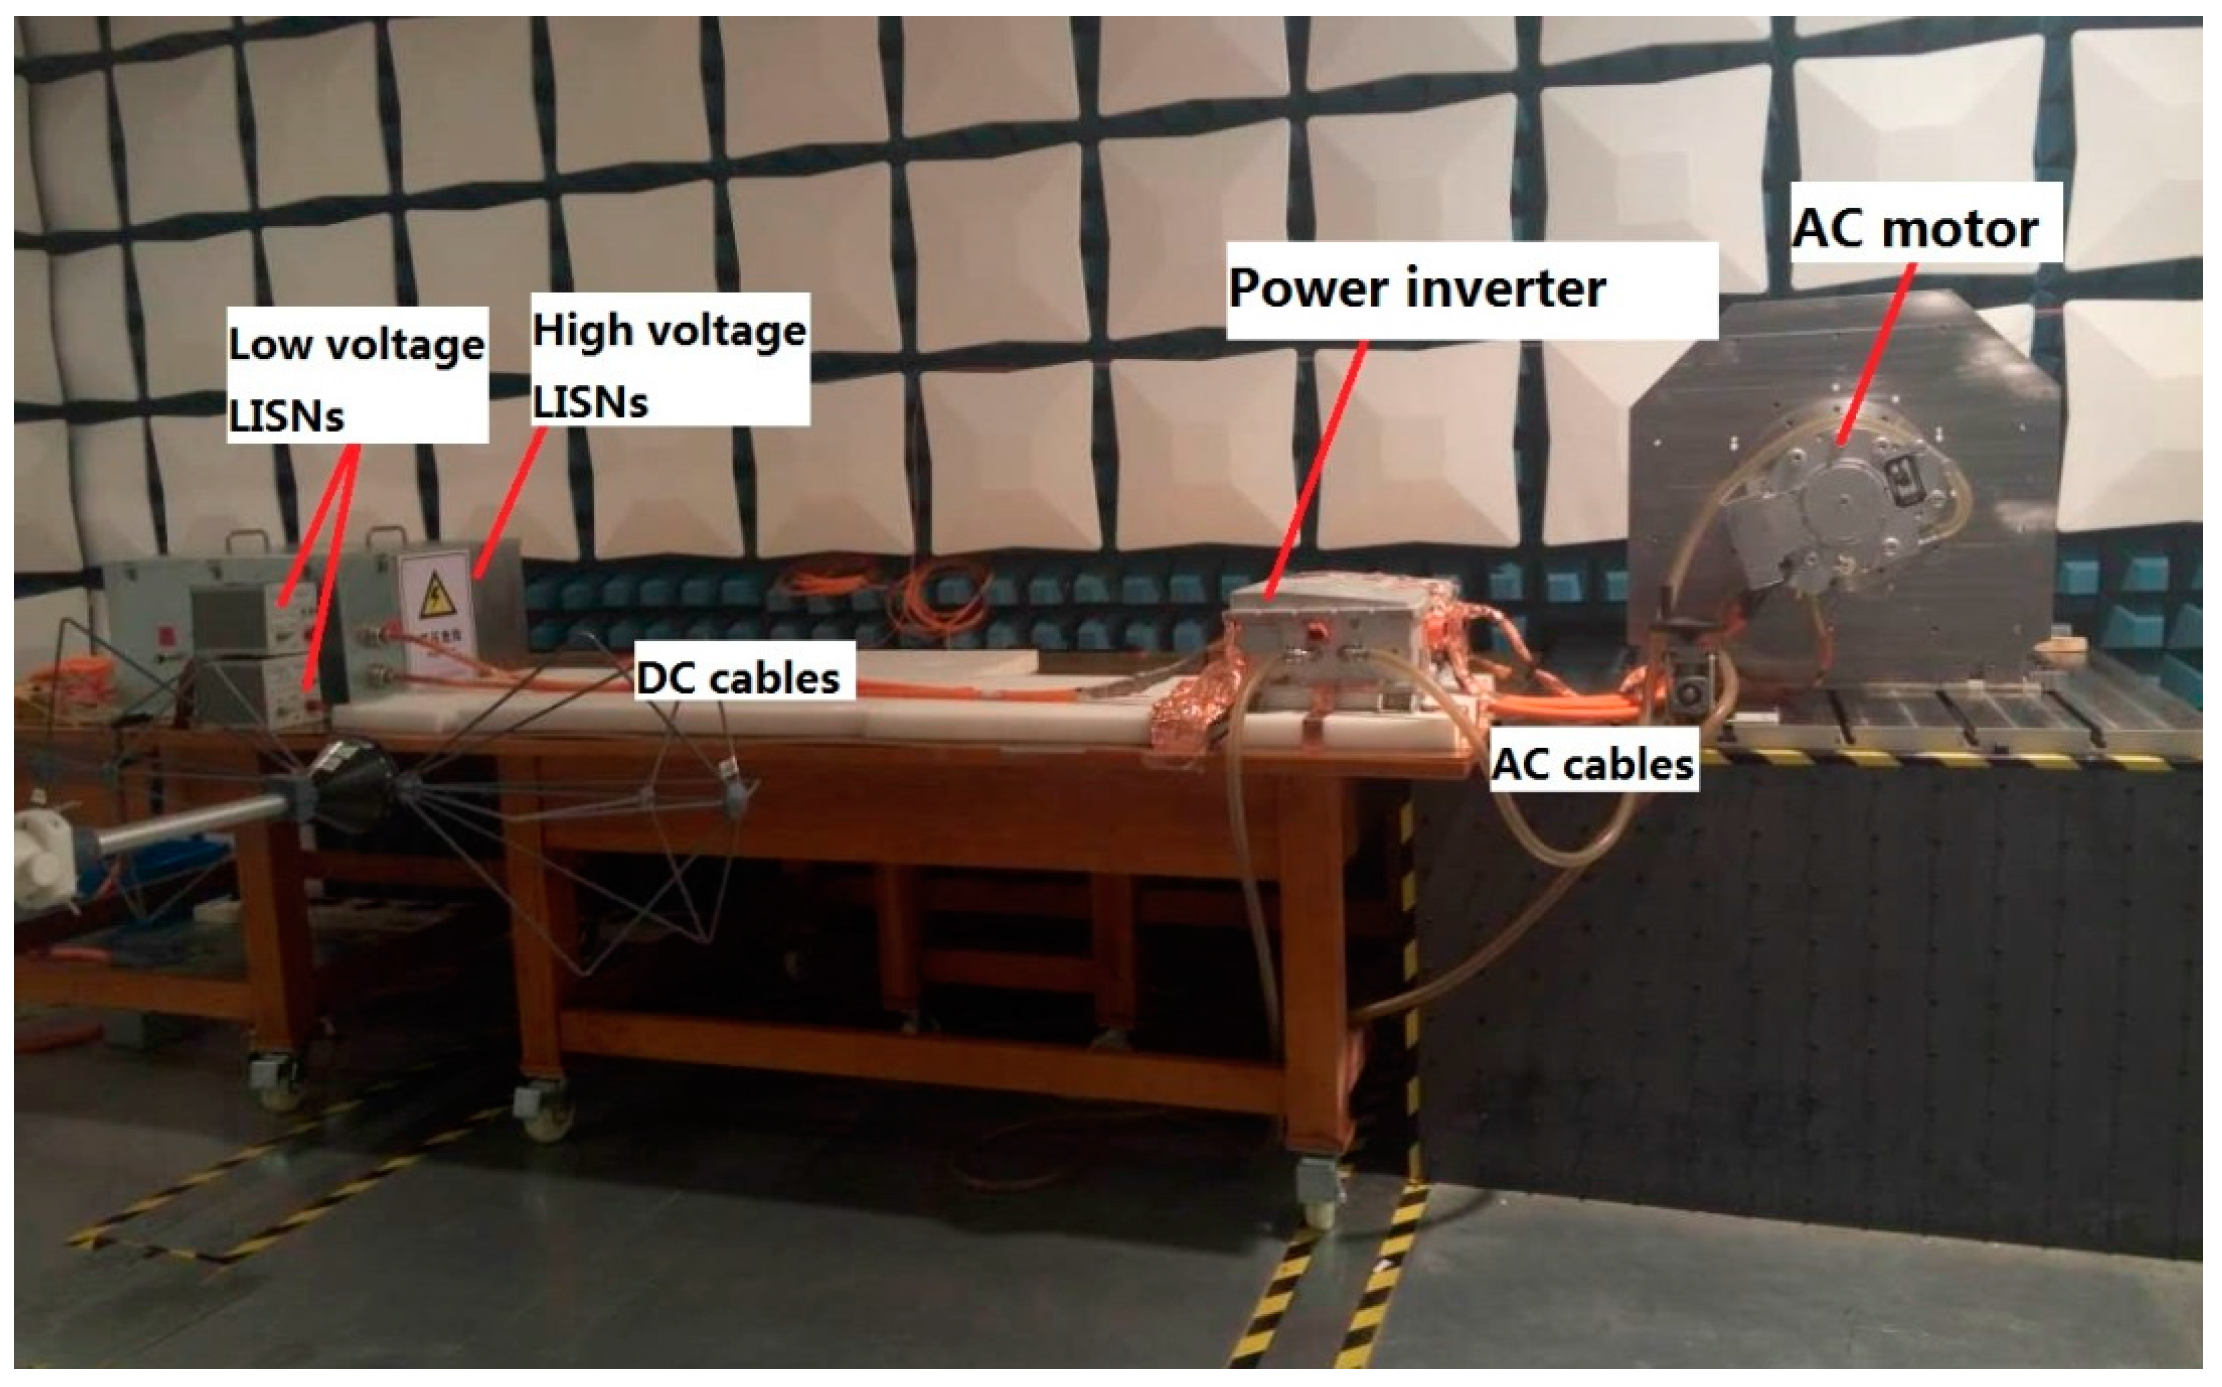
2.1. Conducted EMI Emission Setup

The complete test setup for conducted EMI emissions from the DC-fed AC motor drive system on an EV in an EMI laboratory is shown in Figure 1 and mainly consists of a DC power supply such as a Li-ion battery, DC cables, a DC-fed voltage-type PWM three-phase power inverter, AC cables, and an AC motor. Measurements were performed to comply with the CISPR 25 standard which provides conducted EMI emission limits for vehicle components in a frequency range of 150 kHz to 108 MHz [28]. Two standard line impedance stabilization networks (LISNs) terminated with 50 Ω resistances provide DC power from a battery or DC power supply to the three-phase power inverter using two shielded cables (2 m). The power inverter with 330 V DC input is connected to a 50 kW/100 kW permanent magnet synchronous motor (PMSM) using three shielded cables (1 m). As required by the EMC regulations of CISPR 25, all components are connected to a large copper sheet as ground reference plane, except for the AC motor which is located on an insulated bench covered with ferrite material and connected to an electric dynamometer supplying a mechanical load. The output speed and torque of the AC motor can be measured by a meter between the dynamometer and the insulated output shaft of the AC motor. With this configuration, the total conducted EMI noise voltage signals in DC cables can be picked up by any one of the line impedance stabilization network (LISN) impedances connected to an EMI receiver [29].

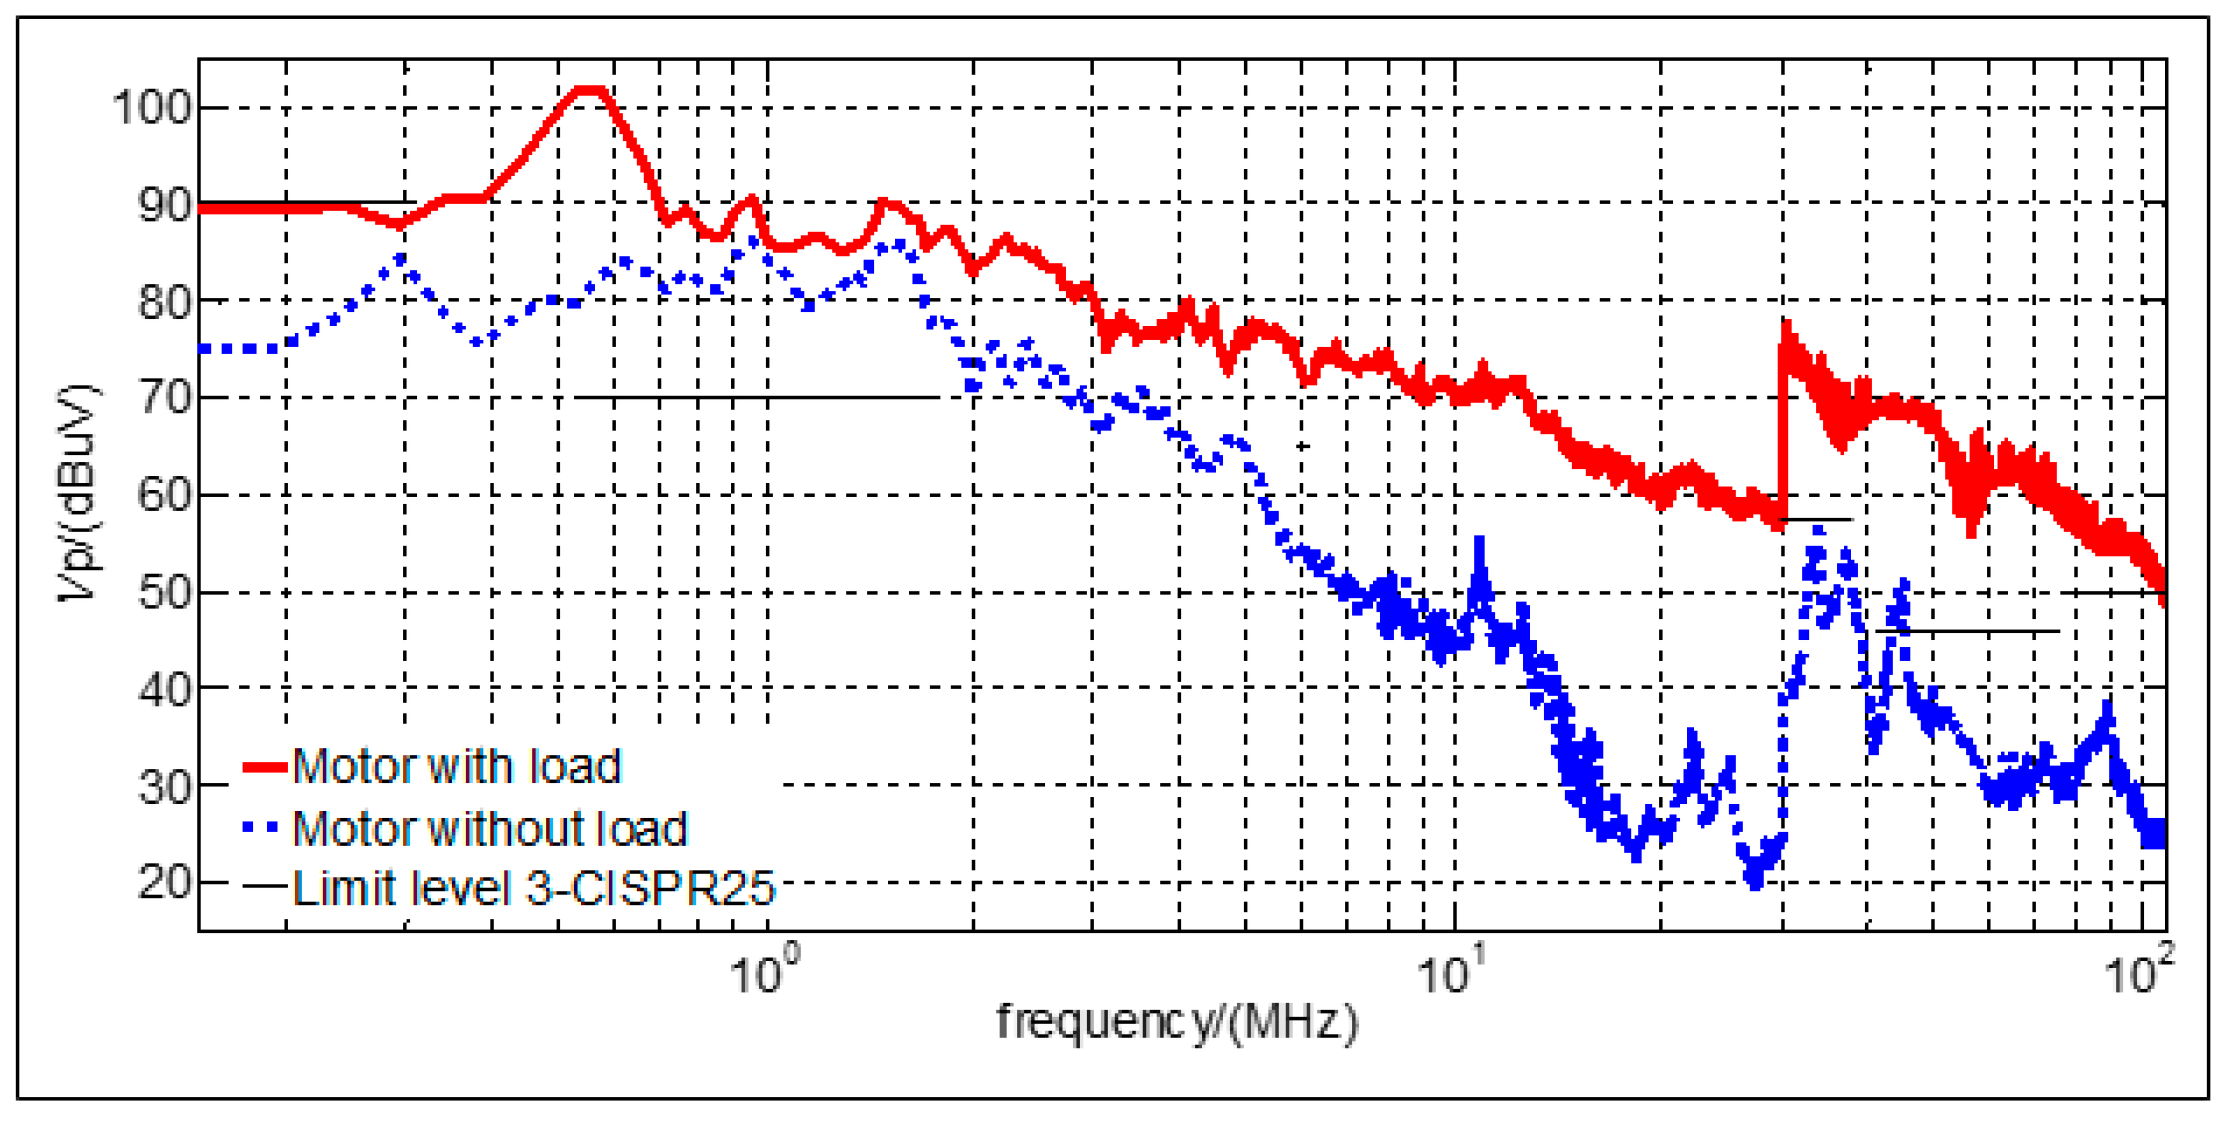
2.2. Conducted EMI Experiment Results

The AC motor is operated continuously at 2000 rpm speed with no-load and 60 N·m loaded torque, as shown in Figure 2. Figure 3 shows the experimental comparison in conducted EMI emission levels between the no-load and load conditions. This experimental result indicates that the conducted EMI noise voltage of the power inverter is dominant in a frequency range of 150 kHz to 108 MHz and is not compliant with CISPR25, as shown in Table 1. Therefore the conducted EMI emission levels in the load condition are more severe and higher than those in the no-load mode. Two noise voltage peaks at frequency around 500 kHz and 30 MHz can be observed and may mainly be caused by PWM switching harmonics or parasitic resonances due to the distributed parameters of the motor system [30]. It is critical to analyze the source and propagation mechanism of EMI to predict the conducted EMI emissions and determine the dominant distributed parameters of the elements in the motor system responsible for the resonances.

3. System Conducted Emission Analysis
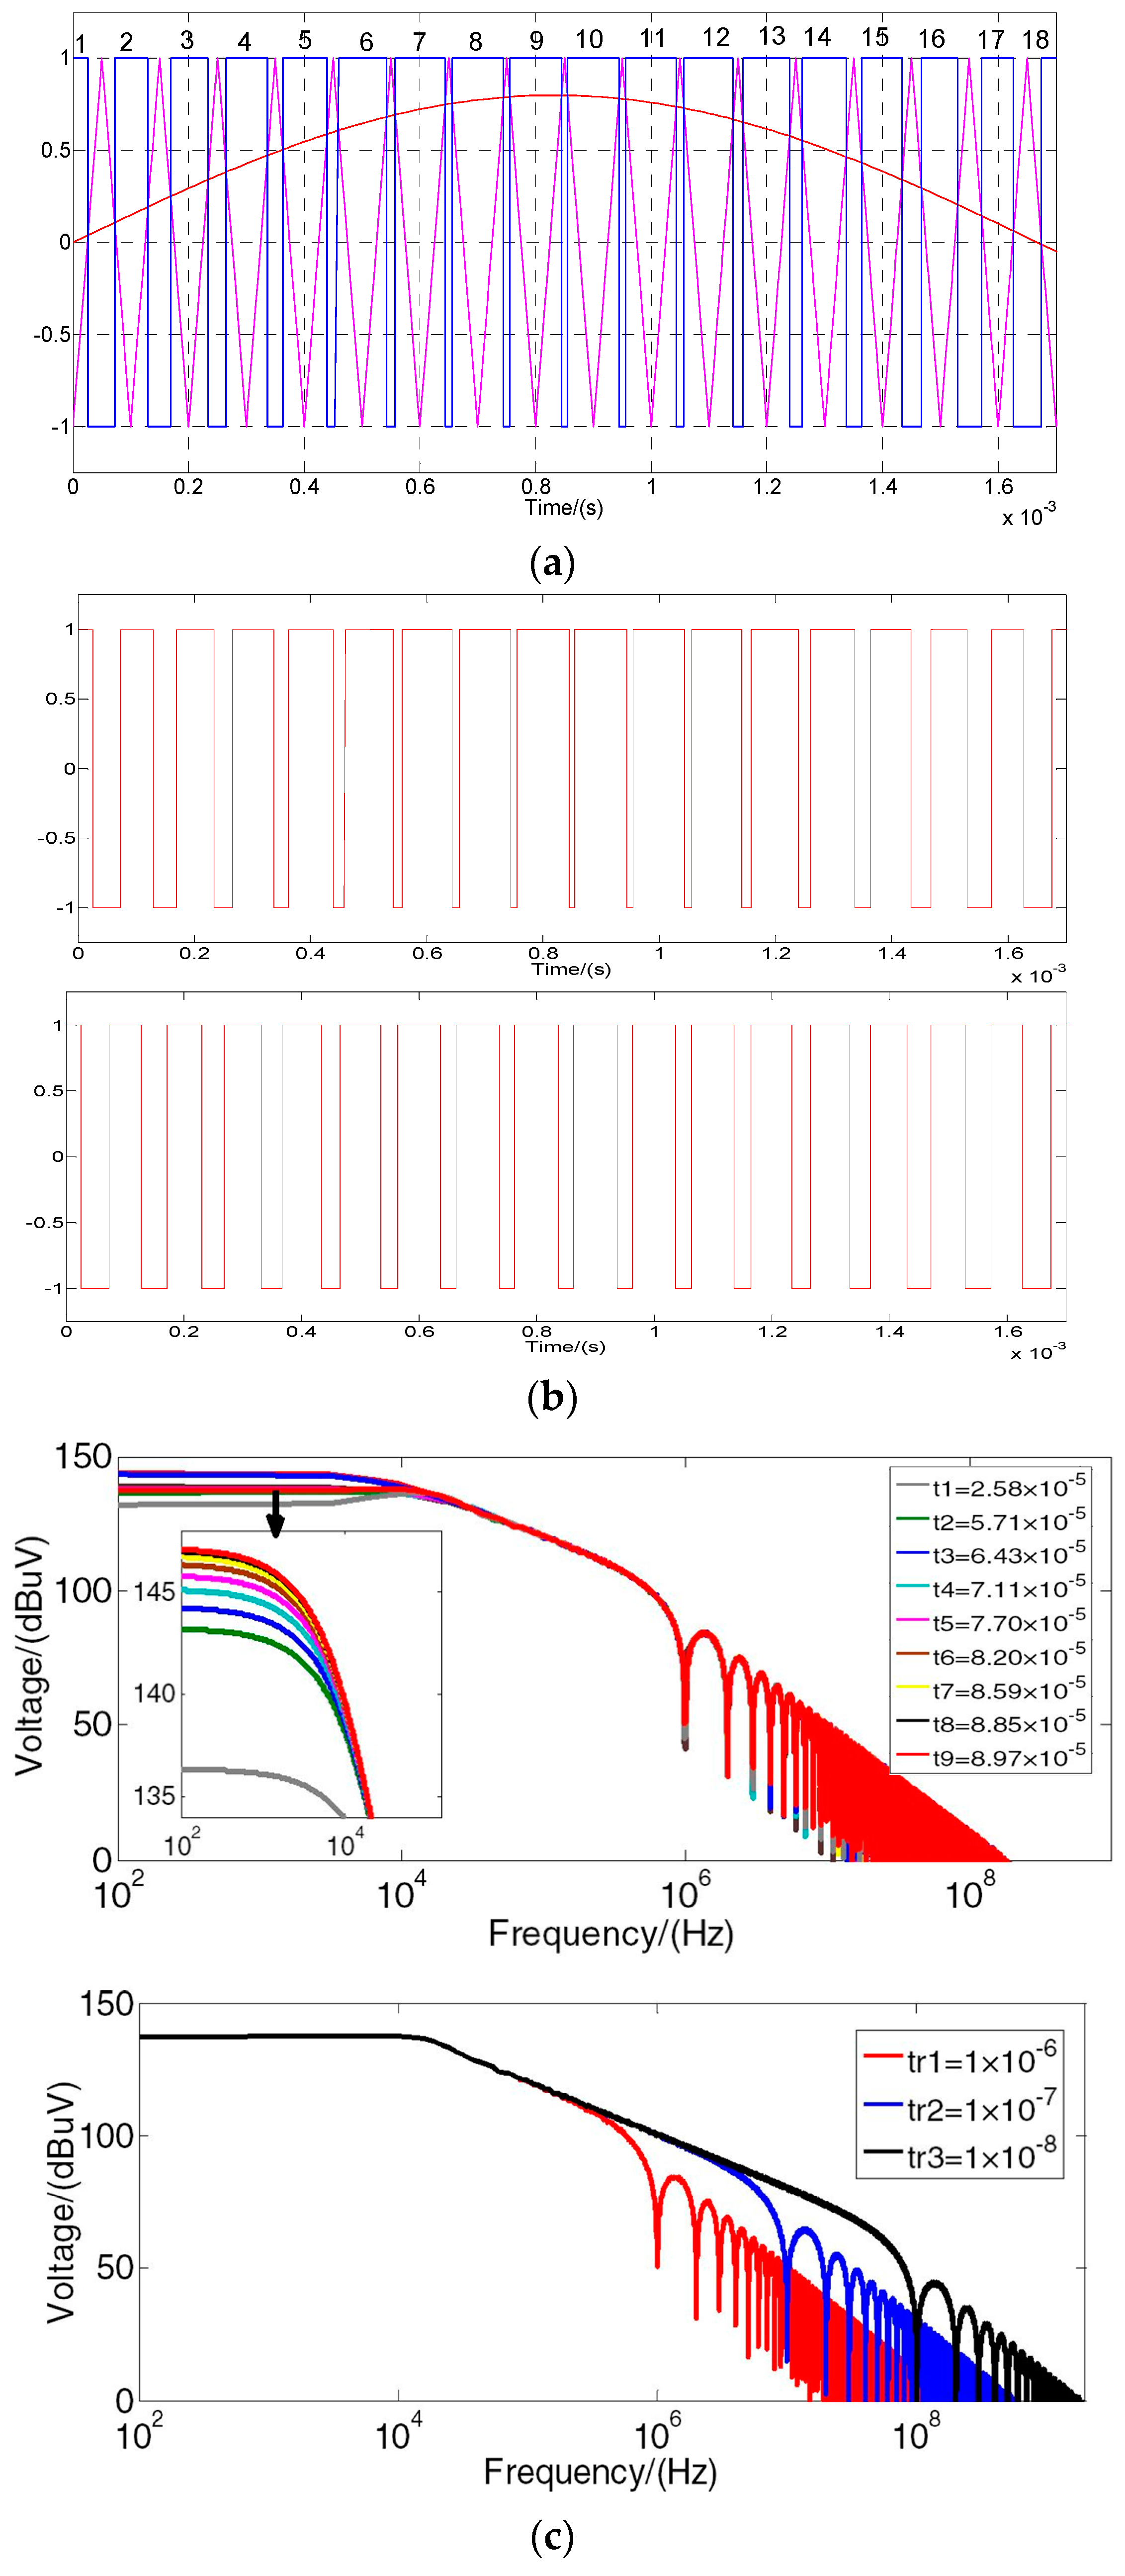
3.1. Noise Source

Figure 1 shows the circuit of a full bridge IGBT-based inverter in the motor controller model. The DC-fed PWM power inverter is designed to have a rated 250 V output voltage. The DC bus input voltage is 330 V. The six switches S1S6 in the inverter are 1200 V/600 A full bridge IGBT modules (Infineon) with sinusoidal pulse width-modulation (SPWM) control. Although control methods (like space vector pulse width modulation (SVPWM), direct torque control (DTC), indirect field oriented control (IFOC), etc.) have better characteristics for mitigating harmonics, this is not the case for the EMI noise at high frequency. Therefore, we focus on the effect of characteristics of the trapezoidal wave for PWM on the EMI. We just take SPWM as an example for explaining the principle of the spectrum of the trapezoidal wave. The switching frequency of IGBT was set to 20 kHz and the line frequency for the AC motor was 400 Hz. The SPWM control signals are generated by compared a sinusoidal reference with a 20 kHz triangular carrier signal as illustrated in Figure 4a, which shows the PWM waveforms in a half-period, which have nine duty cycles corresponding to nine pulses with different pulse-widths. The noise source due to the SPWM control is often simplified by assuming a trapezoidal shape for the switching transients [26]. Each PWM pulse can be described as a trapezoidal pulse by an amplitude A, a frequency f, a pulse rise-time τ r , a pulse fall-time τ f and a pulse-wide τ . T represents the period of the trapezoidal pulse. The continuous envelope spectrum for a trapezoidal pulse can be given by the following equations [31]:
Envelope = 2 A τ T | sin ( π τ f ) π τ f | | sin ( π τ r f ) π τ r f |
20 log 10 ( envelope ) = 20 log 10 ( 2 A τ T ) + 20 log 10 ( sin ( π τ f ) π τ f ) + 20 log 10 ( sin ( π τ r f ) π τ r f )
The τ is smaller under unloaded operation conditions than that under load operation by SPWM control, as shown in Figure 4. Then from (1) and (2) the magnitude of the EMI noise voltage decreases as the value of τ decreases, and is lower under unloaded operation than that under load operation. From (1) and (2), the first break point in the frequency spectral bound is related to τ and is 1 / π τ . The higher the τ , the wider the span related to the DC term, as shown in Figure 4b. The τ is smaller under unloaded operation conditions. Then the magnitude of the EMI noise voltage is lower under unloaded operation than that under load operation, as shown in Figure 3. The second breakpoint in the frequency spectral bound is related to rise/fall time and is 1 / π τ r .The smaller the rise/fall time, the larger the high-frequency spectral content, as shown in Figure 4c. The frequency band of the EMI noise source due to IGBT switching is from 0 Hz to 1 GHz. Then the resonances could be caused up to 1 GHz by parasitic distributed parameters of the AC motor system and may result in peak voltages exceeding the limit levels specified in the CISPR25 standard, as shown in Table 1.

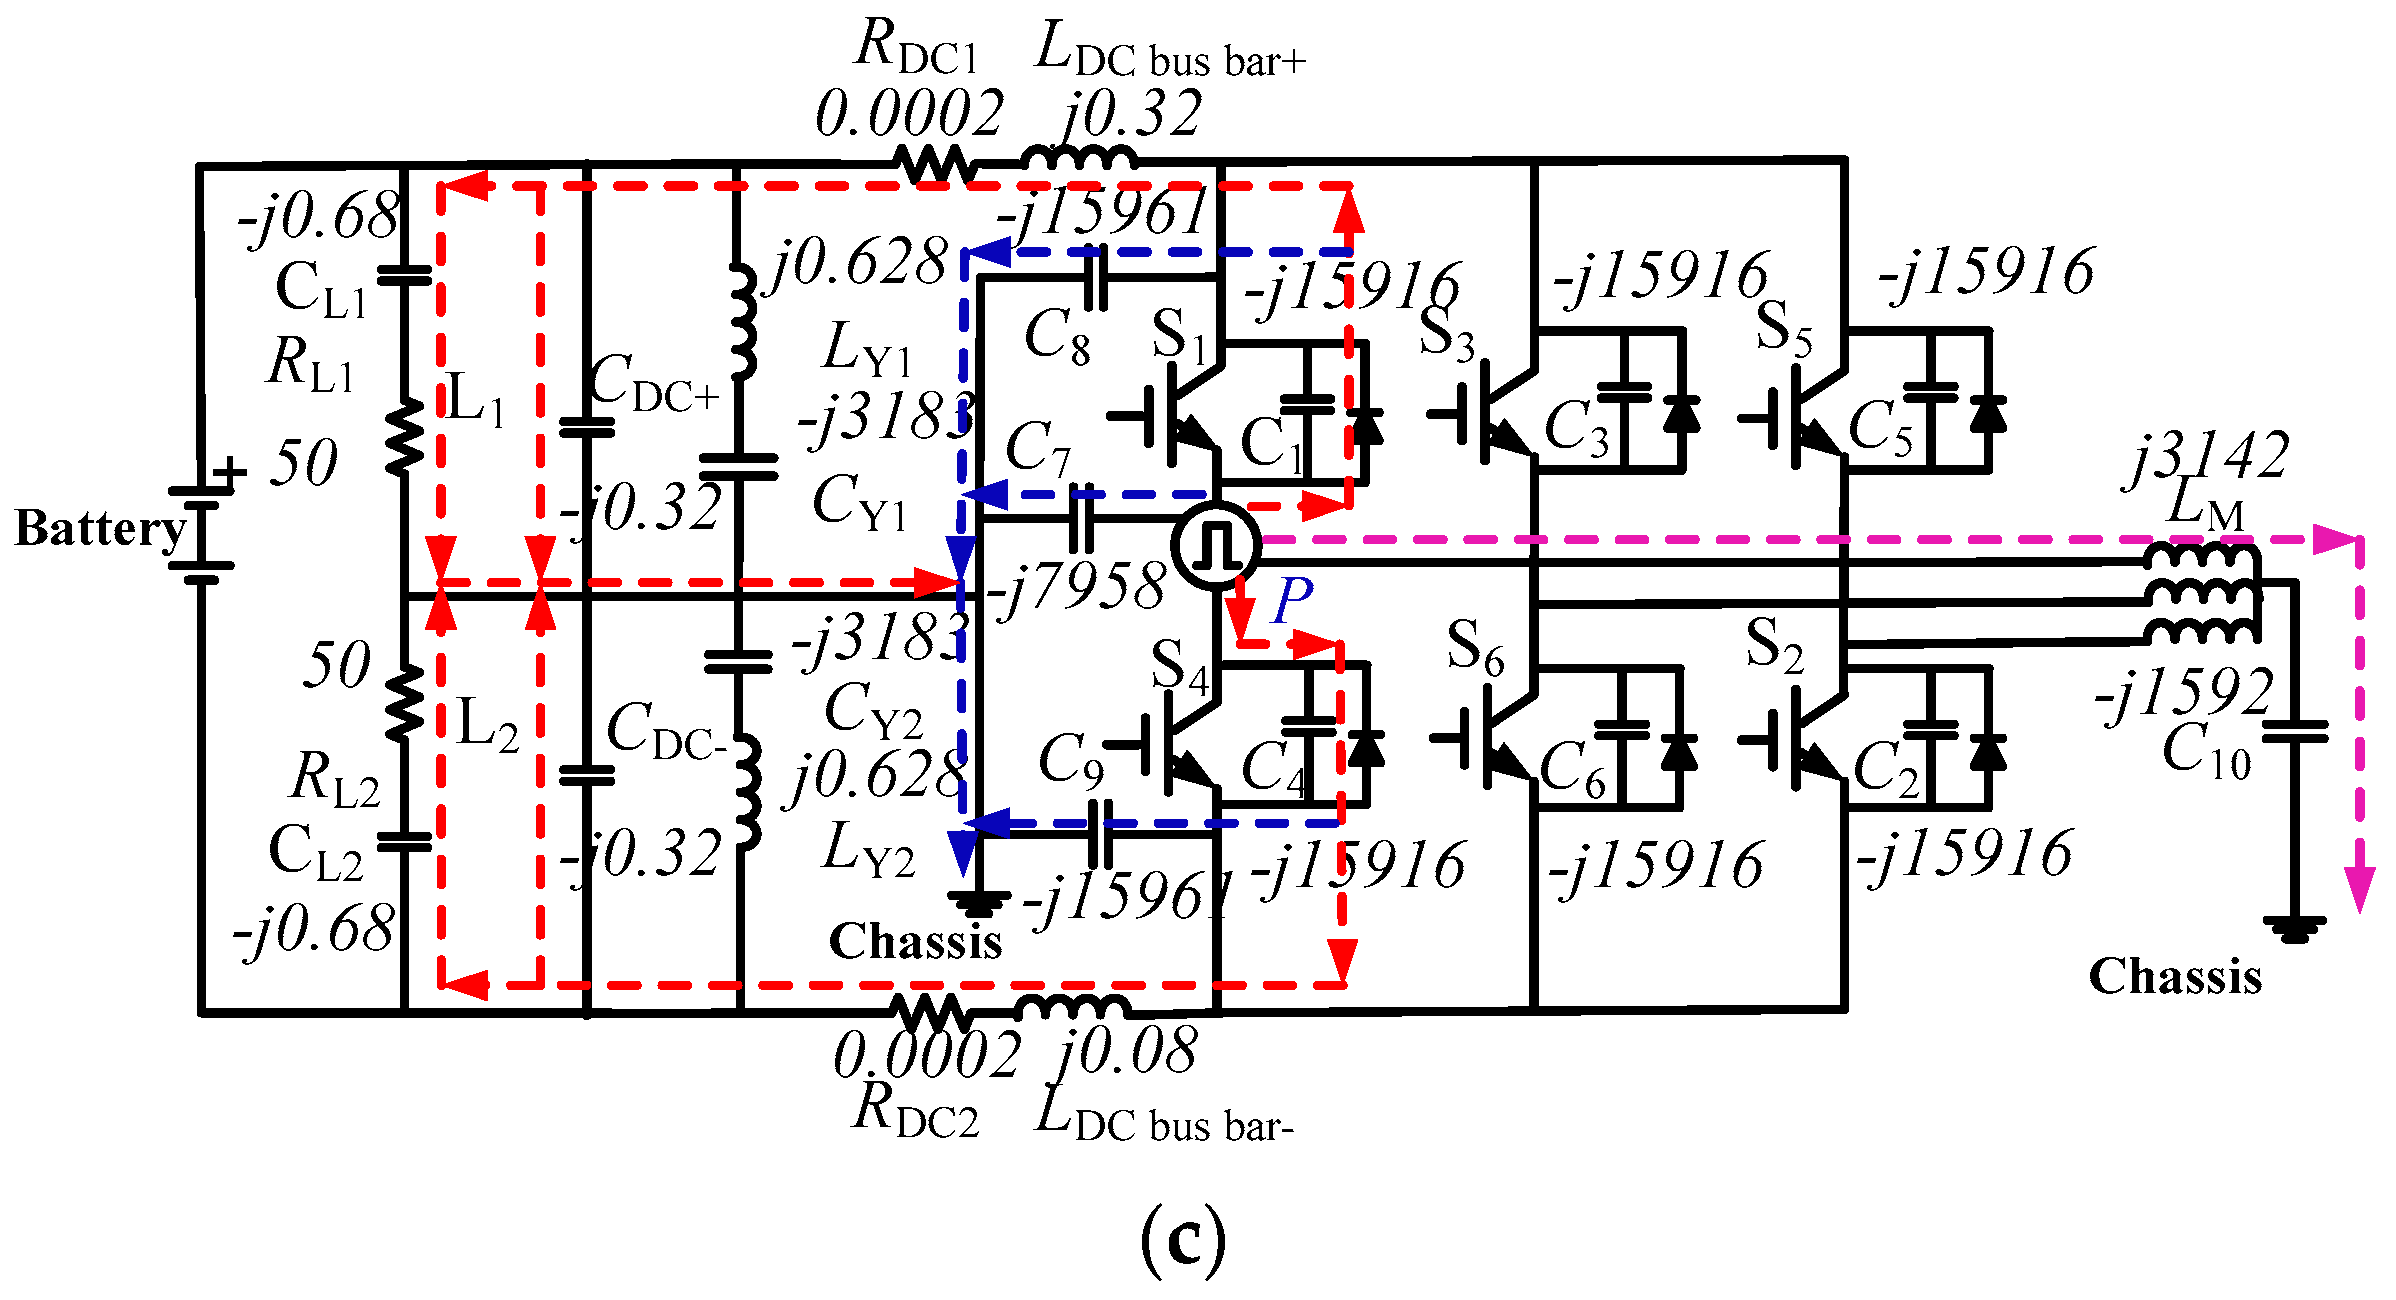
3.2. Analysis of the Current Path of Conducted Emissions

The self-inductance and mutual inductance are equivalent to one inductance in order to simplify the equivalent circuit for analyzing EMI propagation path. The motor drive system is constructed in DM and CM situation, as shown in Figure 5 and Figure 7, where, S1S6 represent six IGBTs in the inverter, C1C6 represent the distributed capacitance between the collector and emitter of S1S6, CY1 and CY2 represent the filter Y capacitors between the positive/negative DC cable and chassis, LY1 and LY2 represent the equivalent series inductances (ESLs) of CY1 and CY2, CX represents the filter X capacitor between the DC buses, LX represents the equivalent series resistance (ESR) of CX. Two LISNs can be represented by the circuit composed of RL1, CL1, RL2, CL2, C7, C8 and C9 to represent the distributed capacitance from the collector and emitter of the IGBT to the chassis, C10 represents the distributed capacitance between the motor and the chassis. LM represents the inductance of the motor phase winding, LDC bus bar+ and LDC bus bar− represent the DC bus bars’ inductance, which includes self-inductance and mutual inductance between two DC bus bars, so its value is larger than that of the lead stray inductance of IGBT, which is smaller and can be ignored, compared the inductance of the DC bus bars. CDC+ and CDC− represent the DC cables’ capacitance, LDC+ and LDC− represent the DC cables’ inductance, RDC1 and RDC2 represent the DC cables’ resistance. The main distributed parameters’ values are measured by VNA and shown in Table 2. The EMI noise propagation paths based on distributed parameters and the equivalent circuits of DM and CM noise current are respectively presented as follows.

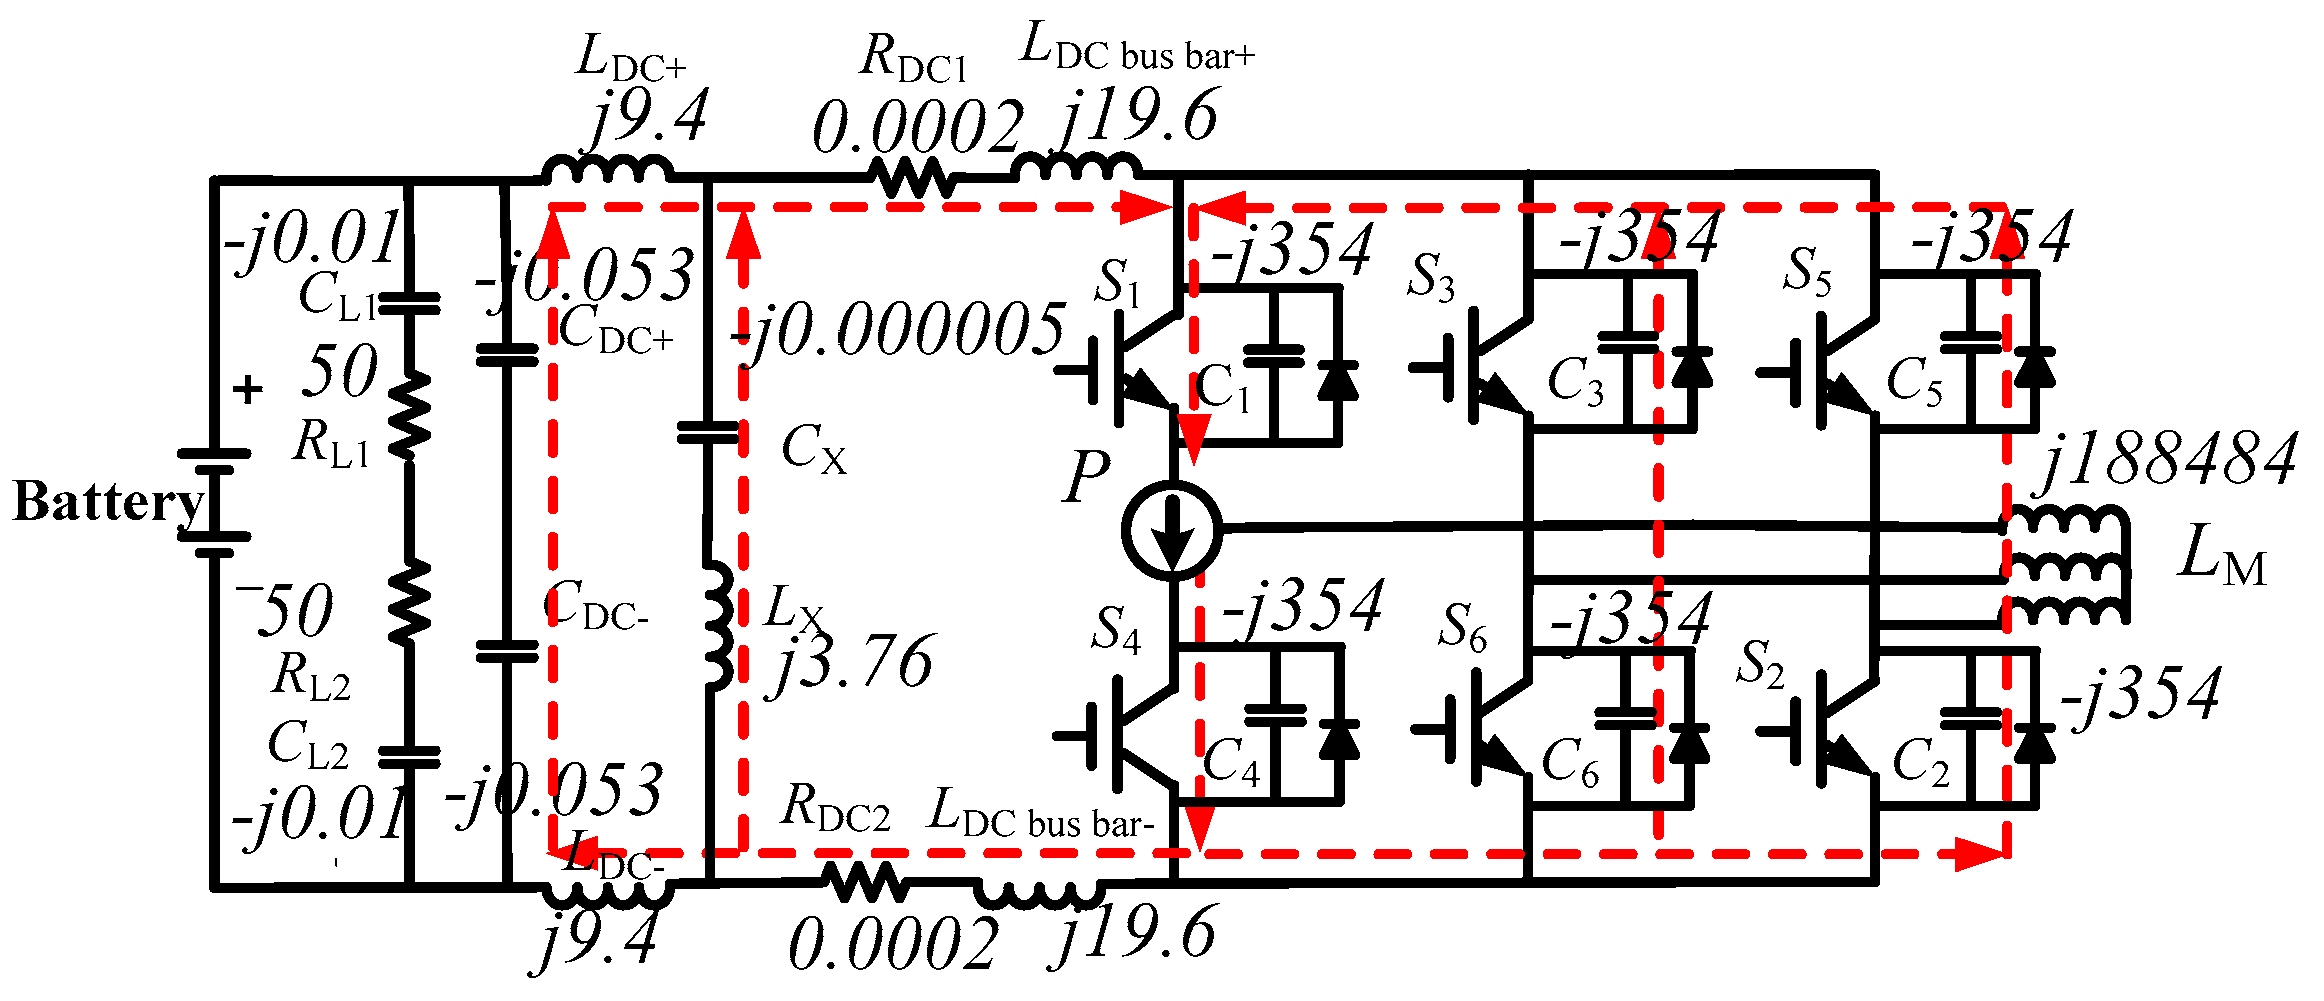
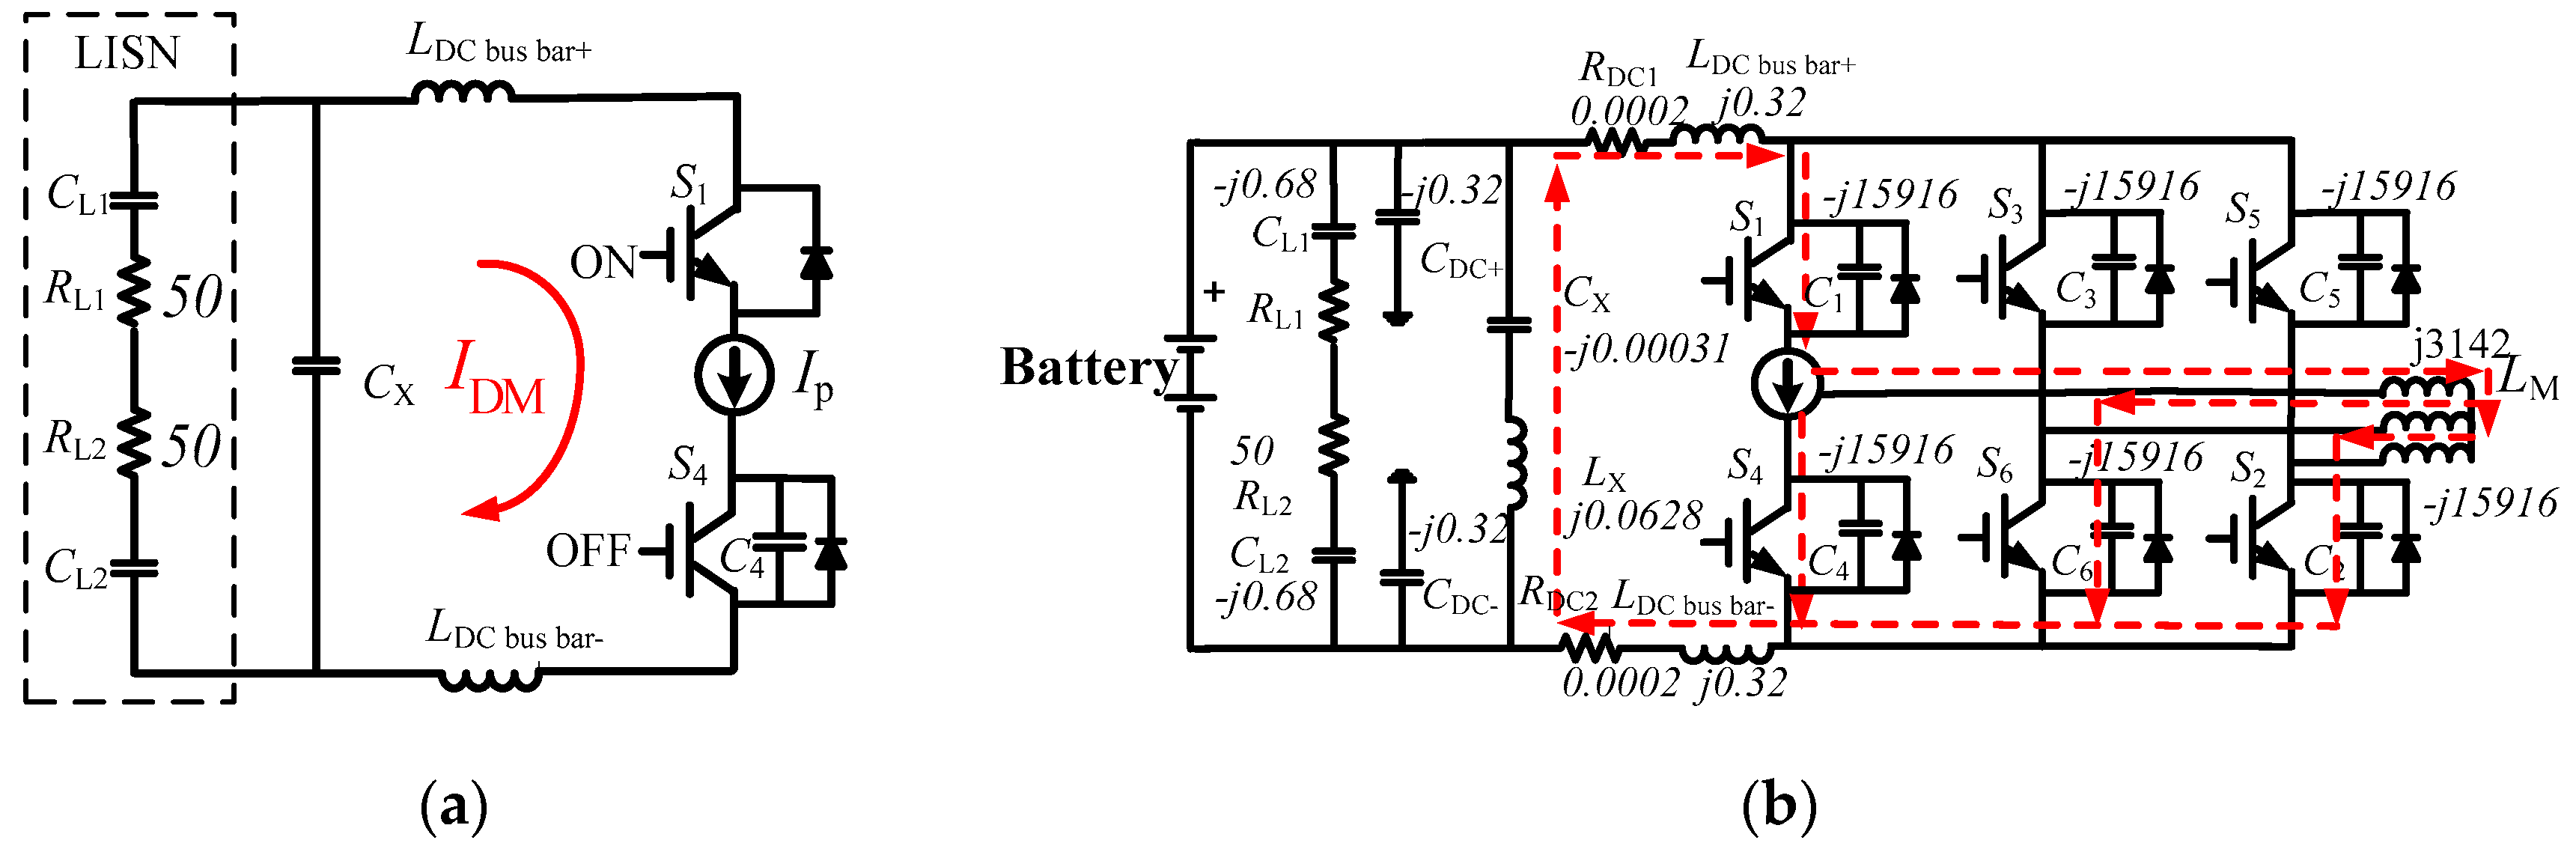
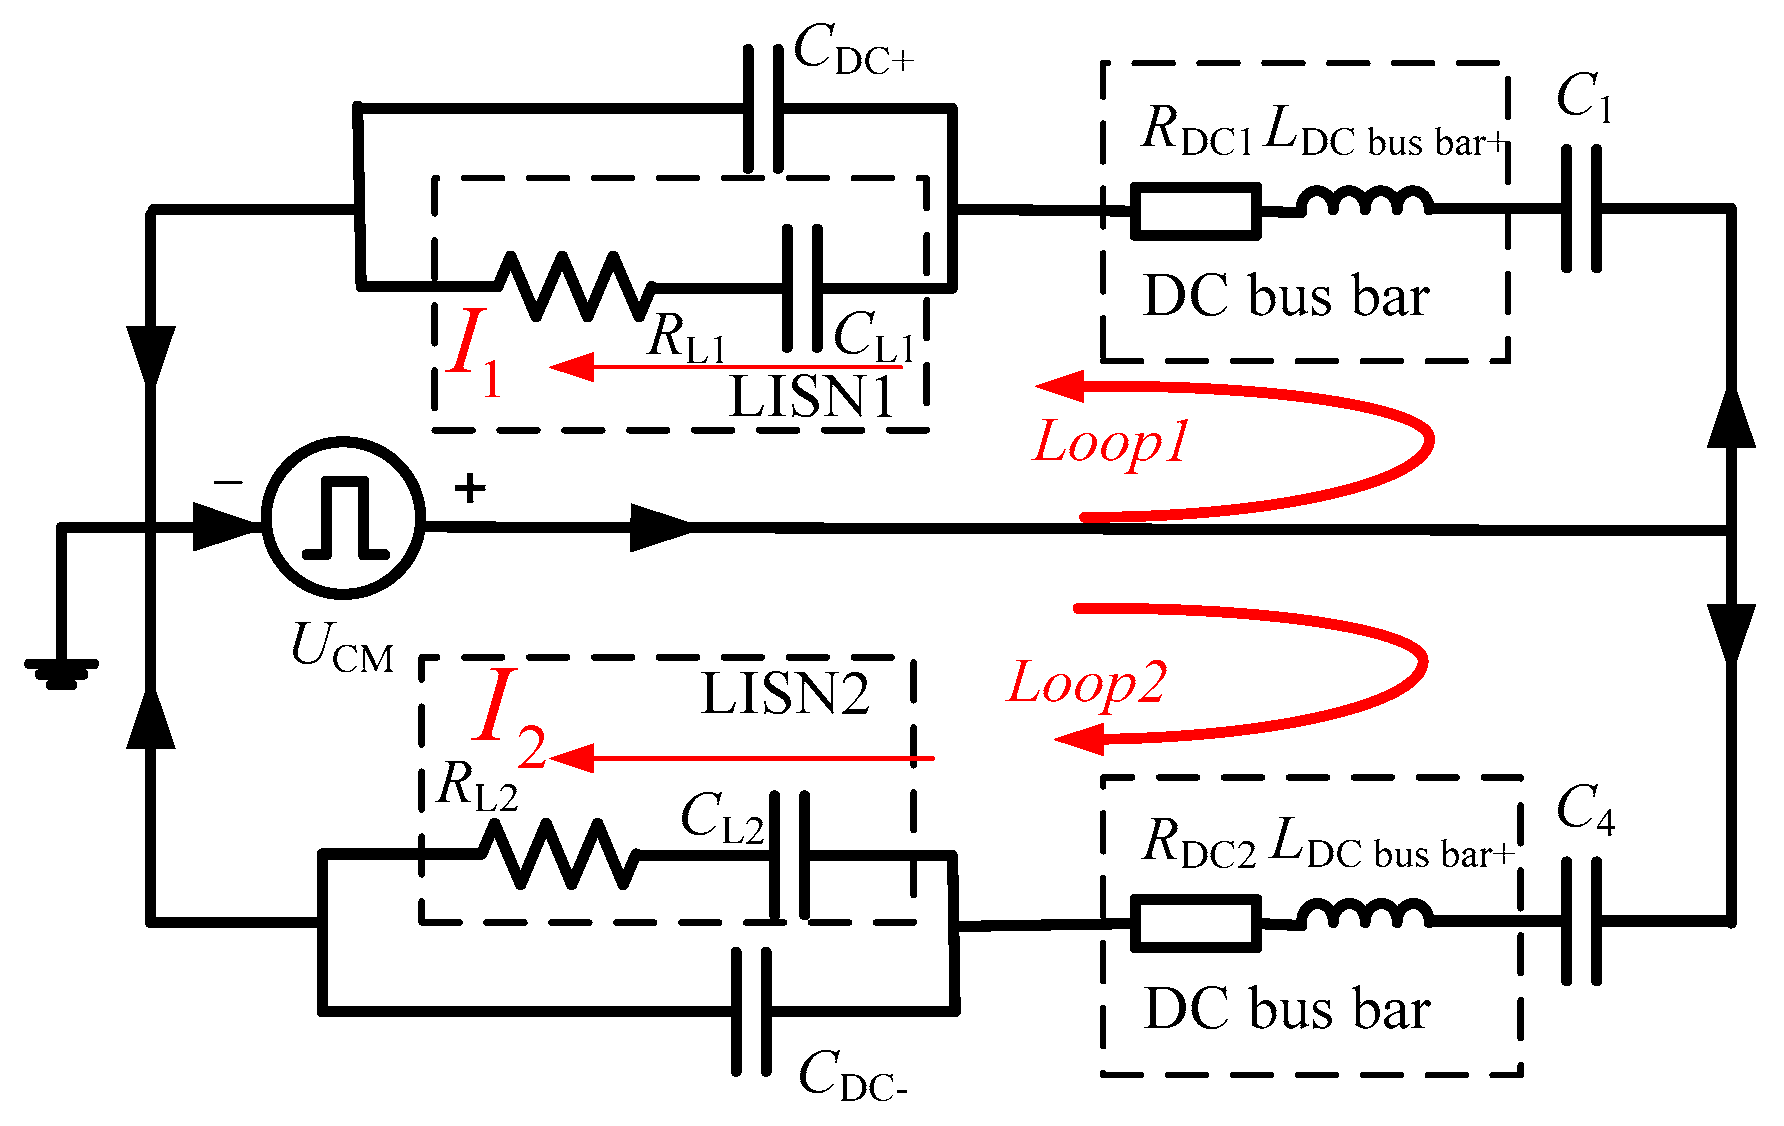
3.2.1. Analysis of the DM Current Path for 500 kHz

The DM EMI emission from the phase node P between the two IGBTs of one phase bridge leg can be equivalent to a DM noise current source IDM between the phase node P and DC bus minus the distributed parameters of the inner elements of the motor system, as shown in Figure 5a. The DM current loop can be illustrated by calculating the impedance of each circuit element ignoring the distributed parameters at 500 kHz, so the DM current flows though the distributed parameters of the motor system is shown in Figure 5b. IDM acts as a driving force to form the following three current loops:
  • current loop I: IDMC4LDC bus bar−RDC2LXCXRDC1LDC bus bar+C1IDM
  • current loop II: IDMLMC6LDC bus bar−RDC2LXCXRDC1LDC bus bar+C1IDM
  • current loop III: IDMLMC2LDC bus bar−RDC2LXCXRDC1LDC bus bar+C1IDM

3.2.2. Analysis of DM Current Path for 30 MHz

The impedance of each circuit element at 30 MHz is calculated as shown in Figure 6. IDM acts as a driving force to form the following three current loops at 30 MHz:
  • current loop I: IDMC4LDC bus bar−RDC2LXCXRDC1LDC bus bar+C1IDM
  • current loop II: IDMC4C6C3C1IDM
  • current loop III: IDMC4C2C5C1IDM
The harmonic content of the DM current at 500 kHz and 30 MHz flowing through the 50 Ω impedance of LISN is also very small due to the filtering effect of the X capacitor. Then the resonant peak at about 500 kHz and 30 MHz is not dominated by the DM current.

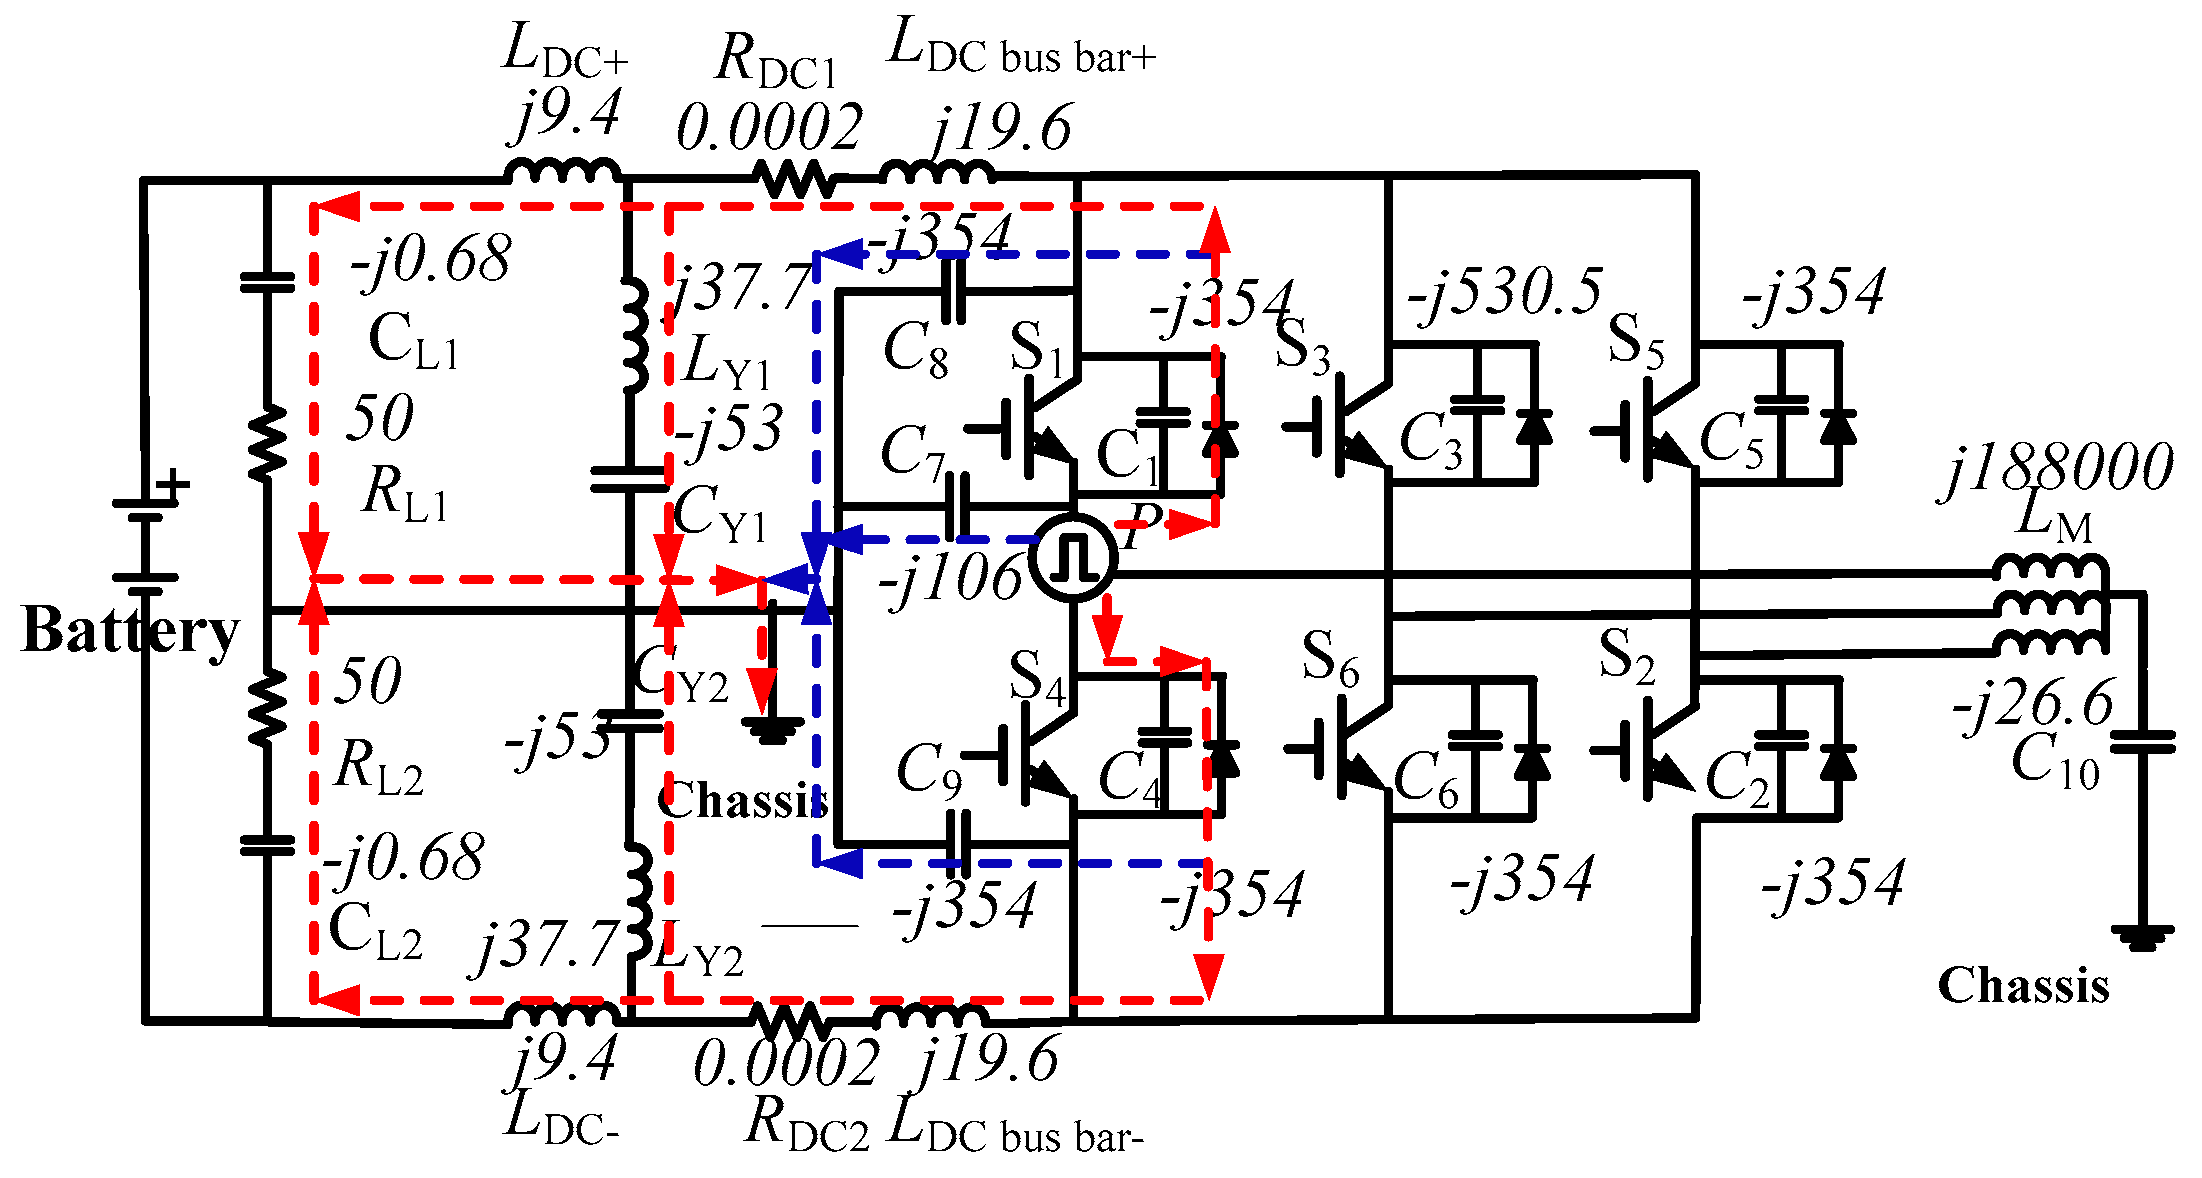
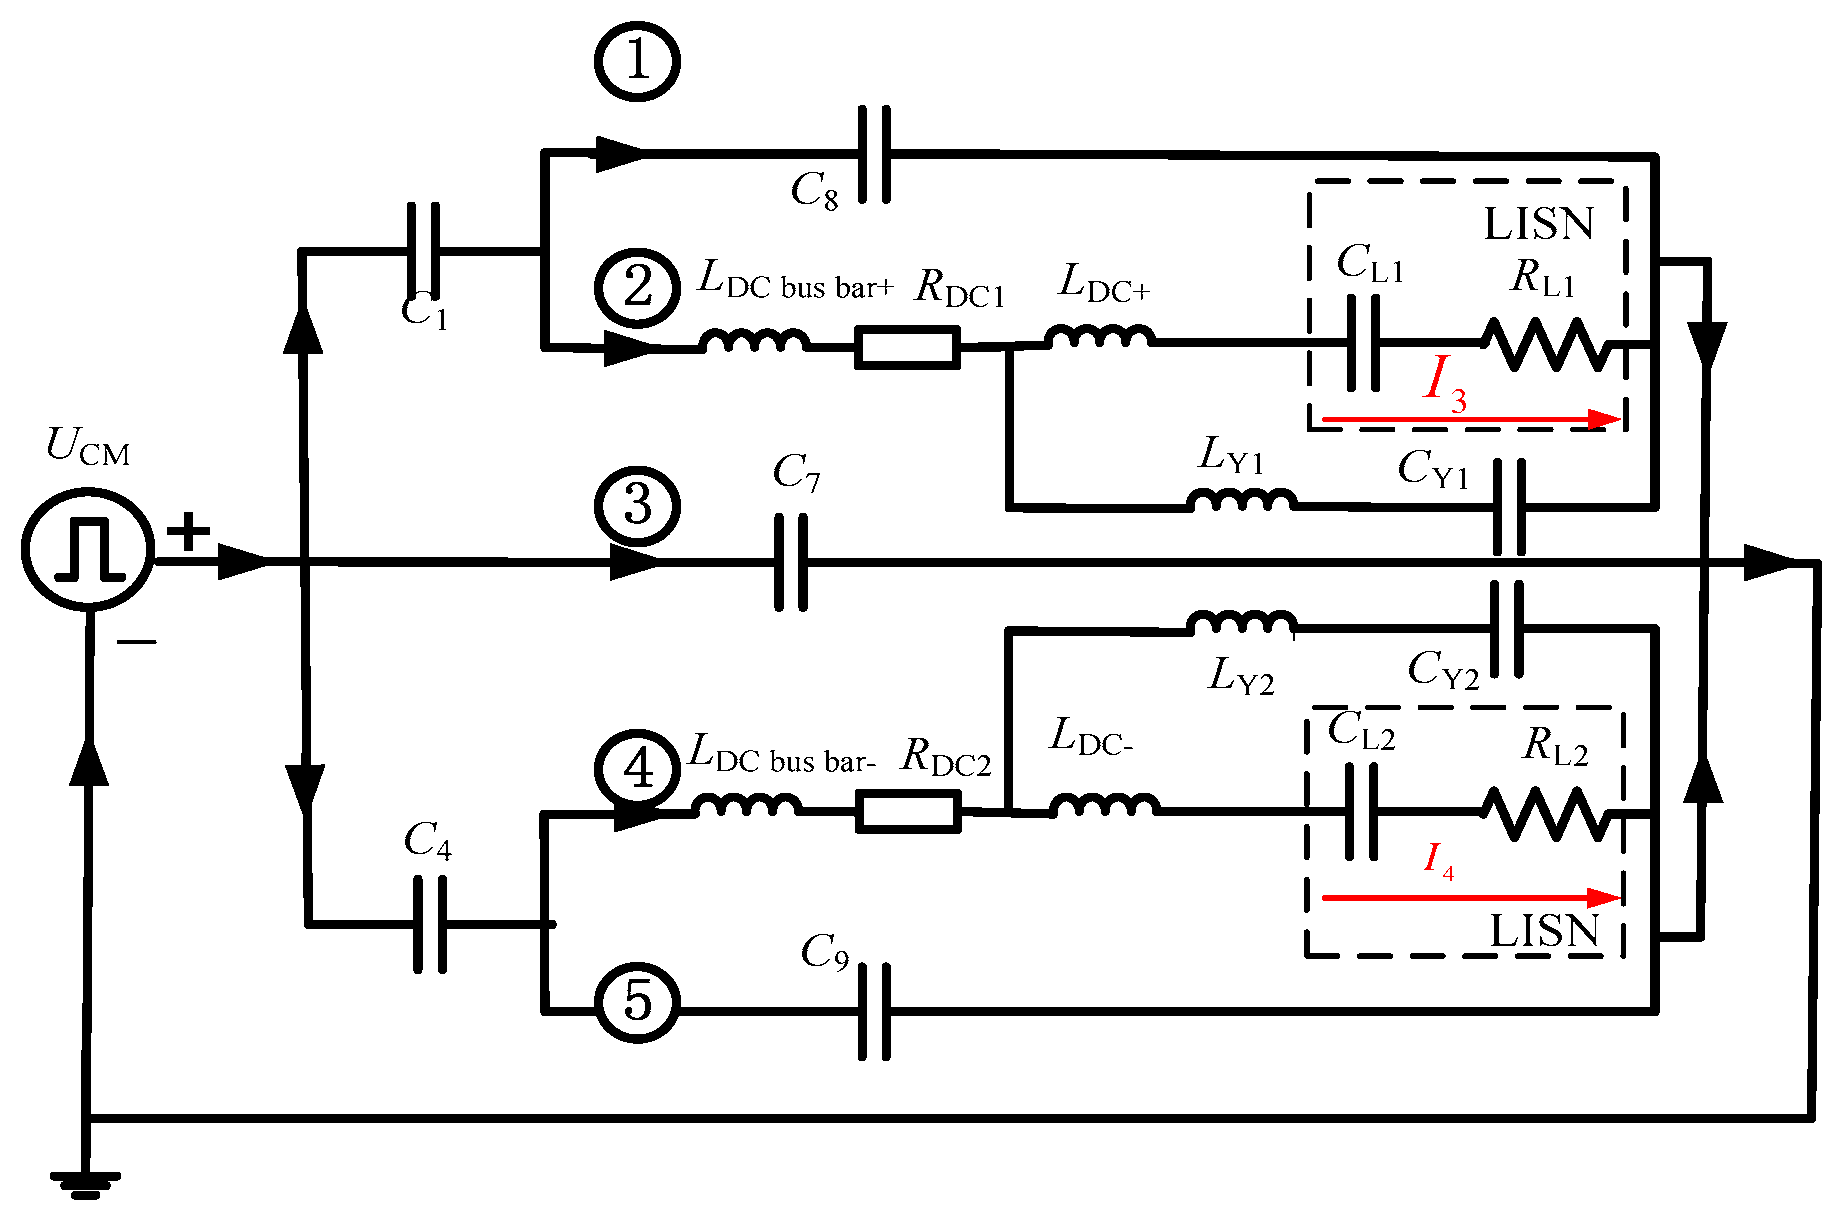
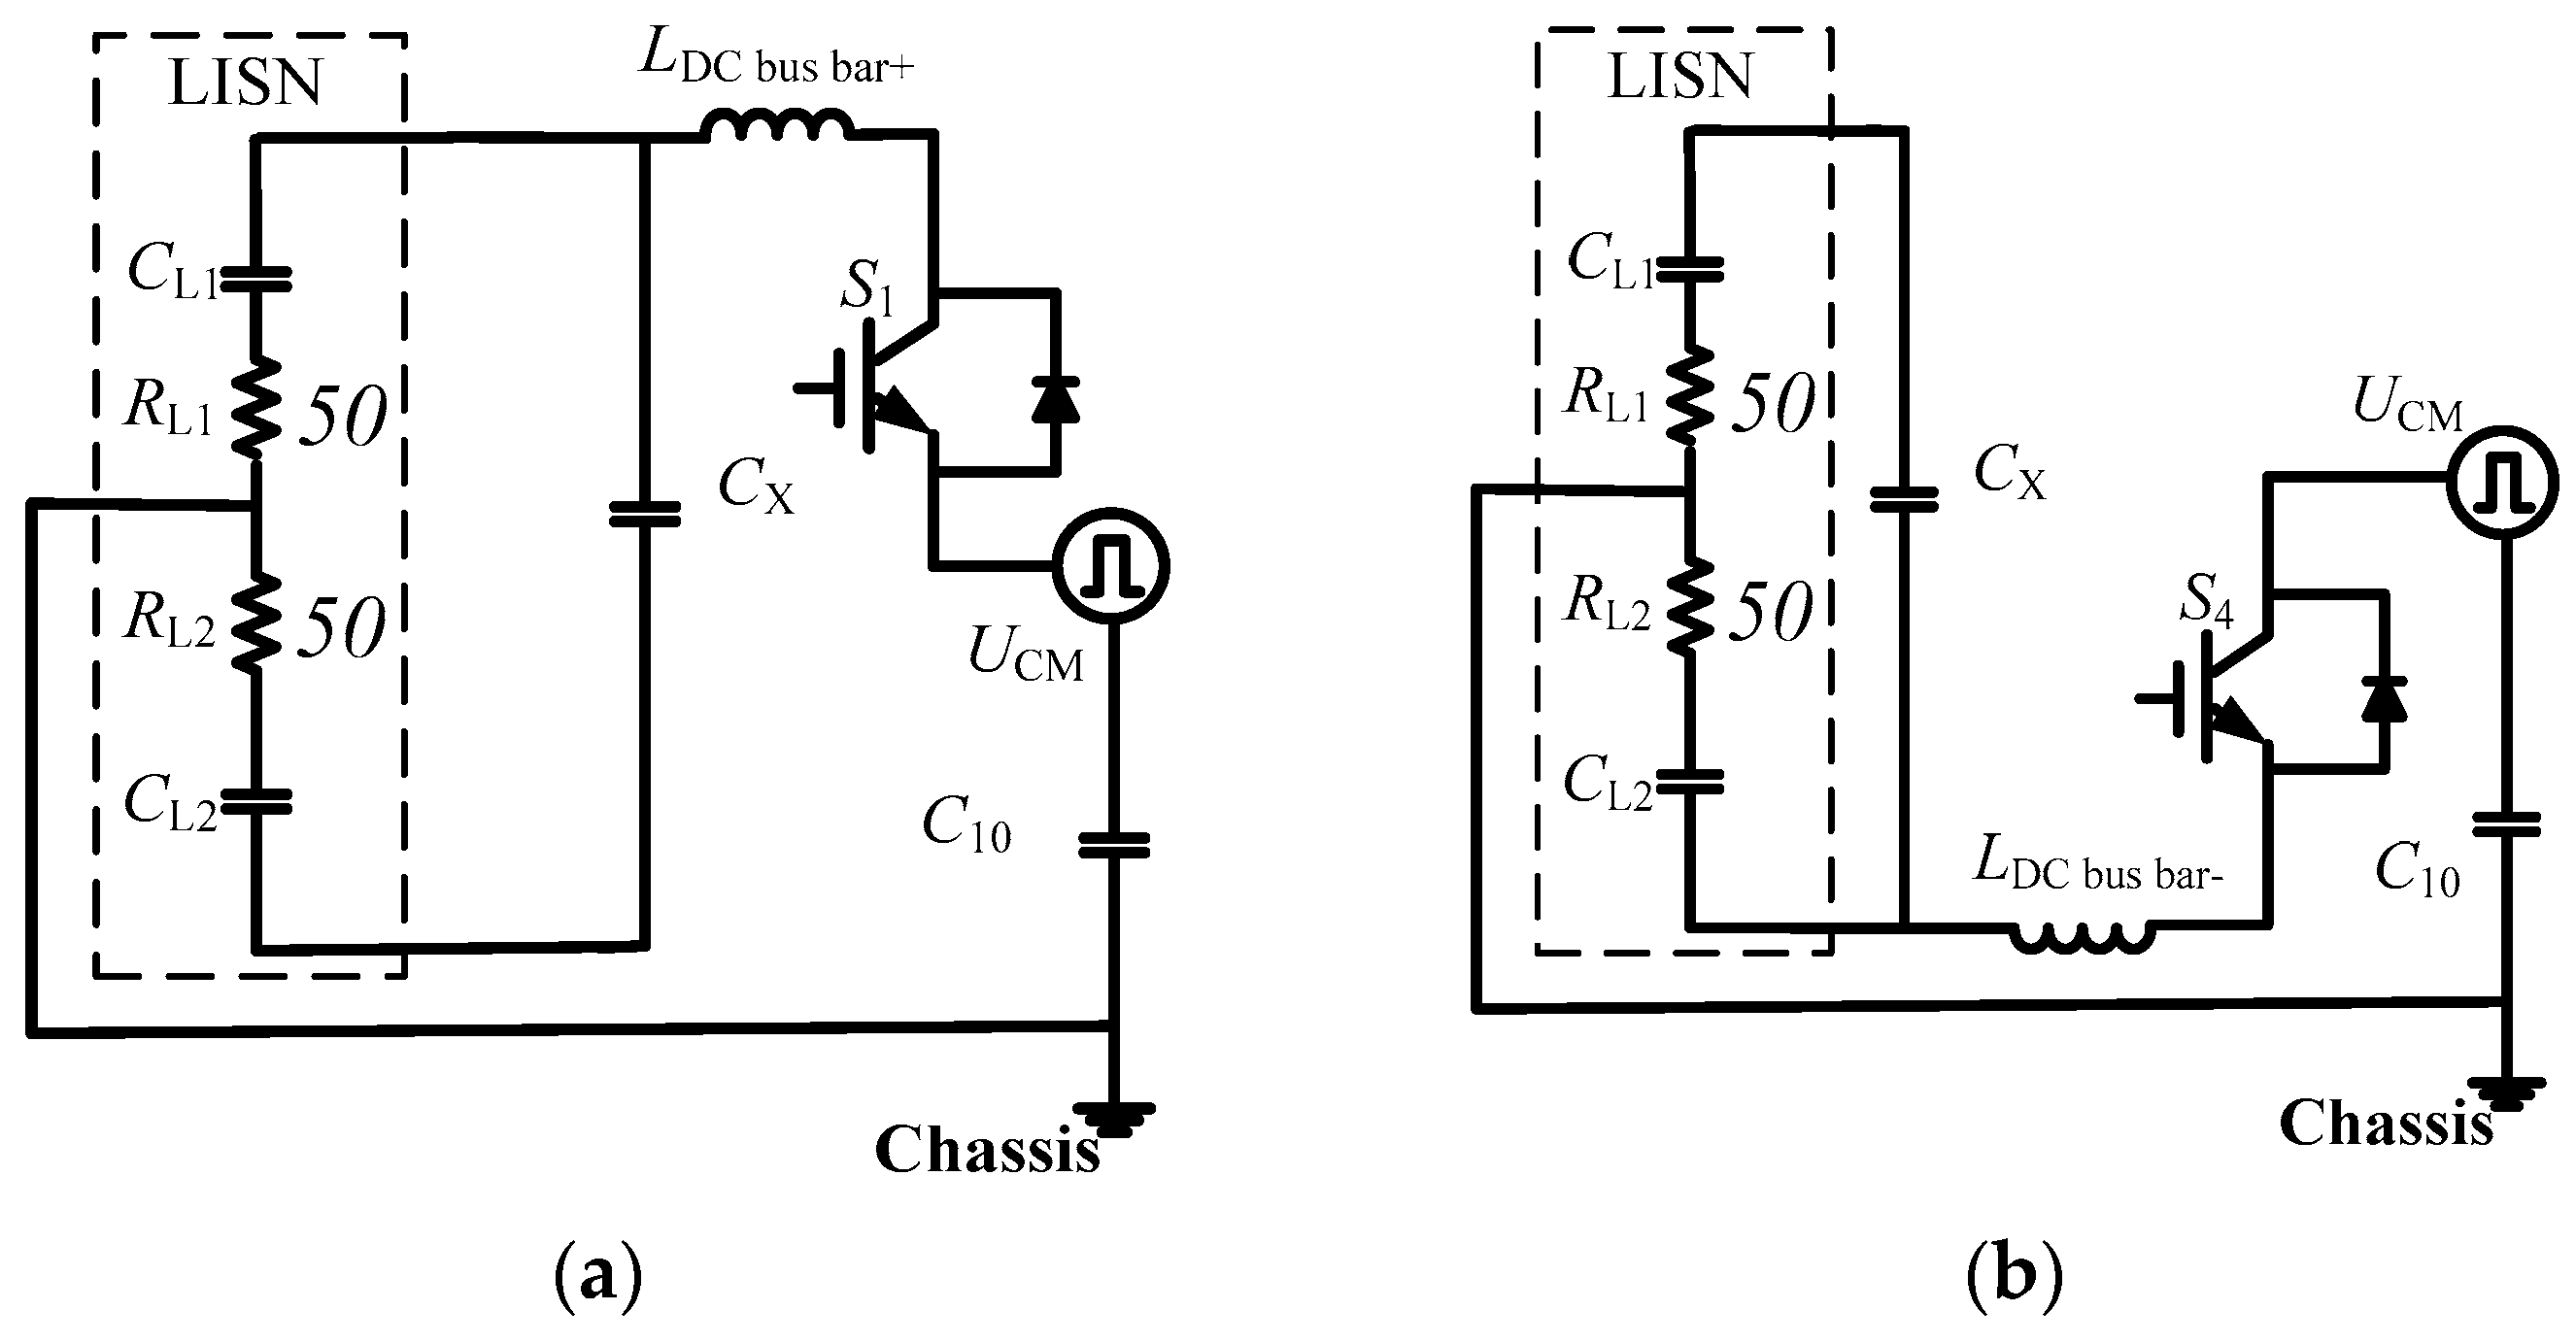
3.2.3. Analysis of CM Current Path for 500 kHz

The CM noise current is always generated at high frequency and flows through the distributed parameters to the ground [32]. The CM emission from the phase node P of two IGBTs of one phase bridge leg can be equivalent to a CM voltage source UDM between the phase node P and chassis with ignored distributed parameters of inner elements of the motor system, as shown in Figure 7a,b. The CM current loop can be illustrated by calculating the impedance of each circuit element with distributed parameters at 500 kHz. UCM acts as a driving force to form three CM current loops shown in Figure 7c, where current loop1 (red line), current loop2 (blue line) and current loop3 (purple line) are considered in parallel. The CM current flowing paths at 500 kHz are composed of a DC side path and an AC side path. The effective impedance of inductance for one branch of the current loop (red) dominated by LDC bus bar+ or LDC bus bar− is about j0.32 Ω and the effective impedance of capacitance for one branch of the current loop (red) dominated by the DC cable capacitance is about −j0.32 Ω. Therefore the peak voltage at about 500 kHz is mainly caused by the series resonance in the current loop (red).
The elements responsible for the resonance at 500 kHz mainly are the capacitance between the DC cables and the chassis, and the stray inductance of the DC bus bar of IGBT. The resonance peak at about 500 kHz is mainly dominated by the CM current. The effect of the current loop2 (blue line) and current loop3 (purple line) is smaller and can be ignored in the equivalent circuit of CM current at 500 kHz shown in Figure 8.
The CM current at about 500 kHz flowing on LISN can be expressed by the following equation:
I 1 = Z 1 U C M ( Z 1 + Z 2 ) Z 3 lim x
where Z1 denotes series-parallel impedance of RL1, CL1 and CDC+, Z2 denotes series impedance of LDC bus bar+, RDC1 and C1, Z3 denotes the series impedance of RL1 and CL1.

3.2.4. Analysis of CM Current Path for 30 MHz

UDM acts as a driving force to form the CM current loops shown in Figure 9. It is difficult to determine the main CM current loop and the elements responsible for the resonance at 30 MHz because of the complexity of CM current equivalent circuit dominated by C1, C4, LDC bus bar+ , LDC bus bar−, RDC2, RDC1, RDC2, LDC+, LDC−, CY1, LY1, CY2, LY2, C7, C8 and C9. The model of the CM current equivalent circuit is essential to study the main dominated CM current loop at 30 MHz to determine the distributed parameters responsible for the resonance peak at 30 MHz.
The equivalent circuit of CM current at 30 MHz is shown in Figure 10 and the CM current at 30 MHz flowing through the LISN resistor can be expressed by the following equation:
I 2 = Z 1 U C M ( Z 1 + Z C 1 ) ( Z 2 + Z 3 ) Z 4
Z1 denotes series-parallel impedance of C8, LDC bus bar+, RDC1, LDC+, CY1, LY1, CL1 and RL1. Z2 denotes series impedance of LDC bus bar+ and RDC1. Z3 denotes series-parallel impedance of LDC+, CL1, RL1, CY1 and LY1. Z4 denotes series impedance of LDC+, CL1 and RL1.
From Equation (3), CDC+, LDC bus bar+, CDC− and LDC bus bar− are the dominant distributed parameters causing the series resonance at 500 kHz and the effect on the CM current I1. Therefore C1 and C4 have a very small effect on I1 and can be ignored. Changing of any parameter among CDC+, LDC bus bar+, CDC− and LDC bus bar+ can reduce the value of I1 at 500 kHz. From Equation (4), LDC+, CY1, LY1, LDC−, CY2, LY2, C8 and C9 are the effective distributed parameters at 30 MHz and with an effect on I1.
The effect from distributed parameters on conducted voltage UR according to above equivalent circuits and calculation at 500 kHz and 30 MHz is shown in Table 3. In a motor drive system, the parameters such as C1C6, CX, LX and LM usually cannot be controlled, and only the distributed parameters LDC bus bar+, LDC bus bar−, CDC+, CDC−, C8, C9, LY1, LY2, CY1, CY2 could be changed along with different arrangements, filtering and shielding.

4. Simulation of the Effect of Distributed Parameters

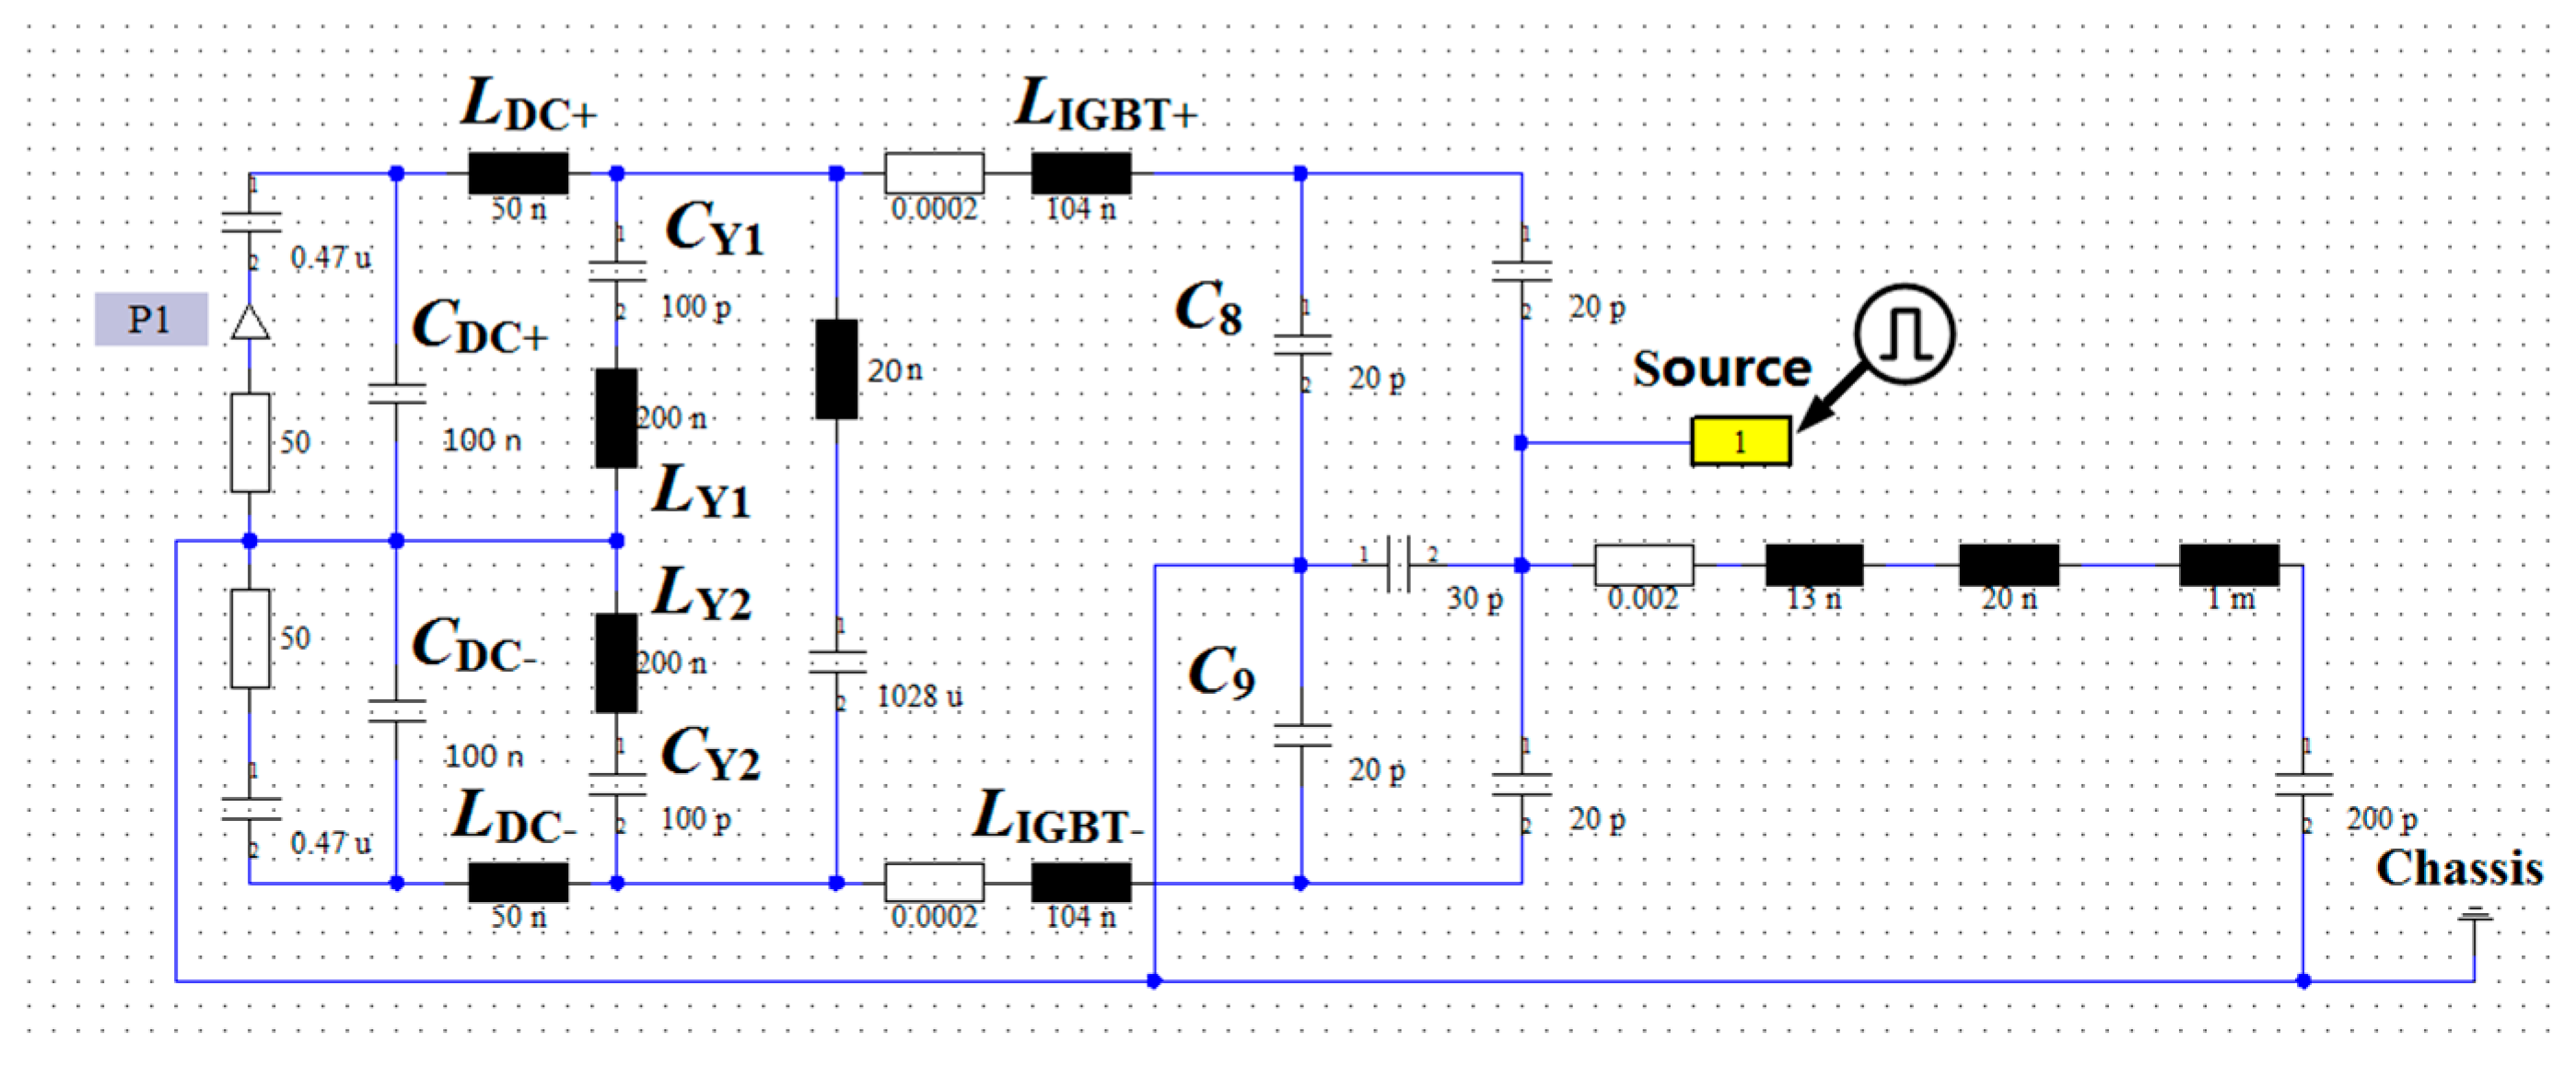
4.1. System Conducted EMI Modeling

According to the structure of the system and the distributed parameters, the power inverter system was modeled as a simplified single-arm bridge of the power inverter system using the EMC simulation software “Computer Simulation Technology” (CST) that predicts the noise in the entire conducted emissions range from 150 kHz to 108 MHz, as illustrated in Figure 11. The conducted emission (CE) voltage on the resistor of the LISN in the DM and CM network equivalent circuits can be obtained by using time-domain simulation, followed by fast fourier transform(FFT) in the designer platform provided in the CST software. The CM EMI source is equivalent to an ideal trapezoidal shape wave and the EMI voltage measured by a probe P1 is the positive conducted emission voltage. The EMI voltage simulation result is shown in Figure 12. Table 3 and Figure 12 suggest that the conducted EMI voltage spectrum of the motor drive system in EV can be divided into two different frequency ranges: the low frequency range around 500 kHz that is dominated by DC cables’ capacitance and DC bus bars, and the high frequency range around 30 MHz that is related to parasitic resonances due to the distributed parameters of Y capacitors and distributed capacitance from the IGBT phase node to the chassis. The EMI voltage peaks obtained through simulation in Figure 12 correspond to those of measurements at 500 kHz and 30 MHz. There are some larger errors between simulation results and measurement results because the measurement EMI voltage is the total of the EMI noise from the three arms of the power inverter. Conversely, the simulated EMI voltage is obtained from a single-arm. It can be seen that the model is efficient enough to be used to predict the CM current paths and the elements responsible for the EMI.

4.2. The Effect of Distributed Parameters

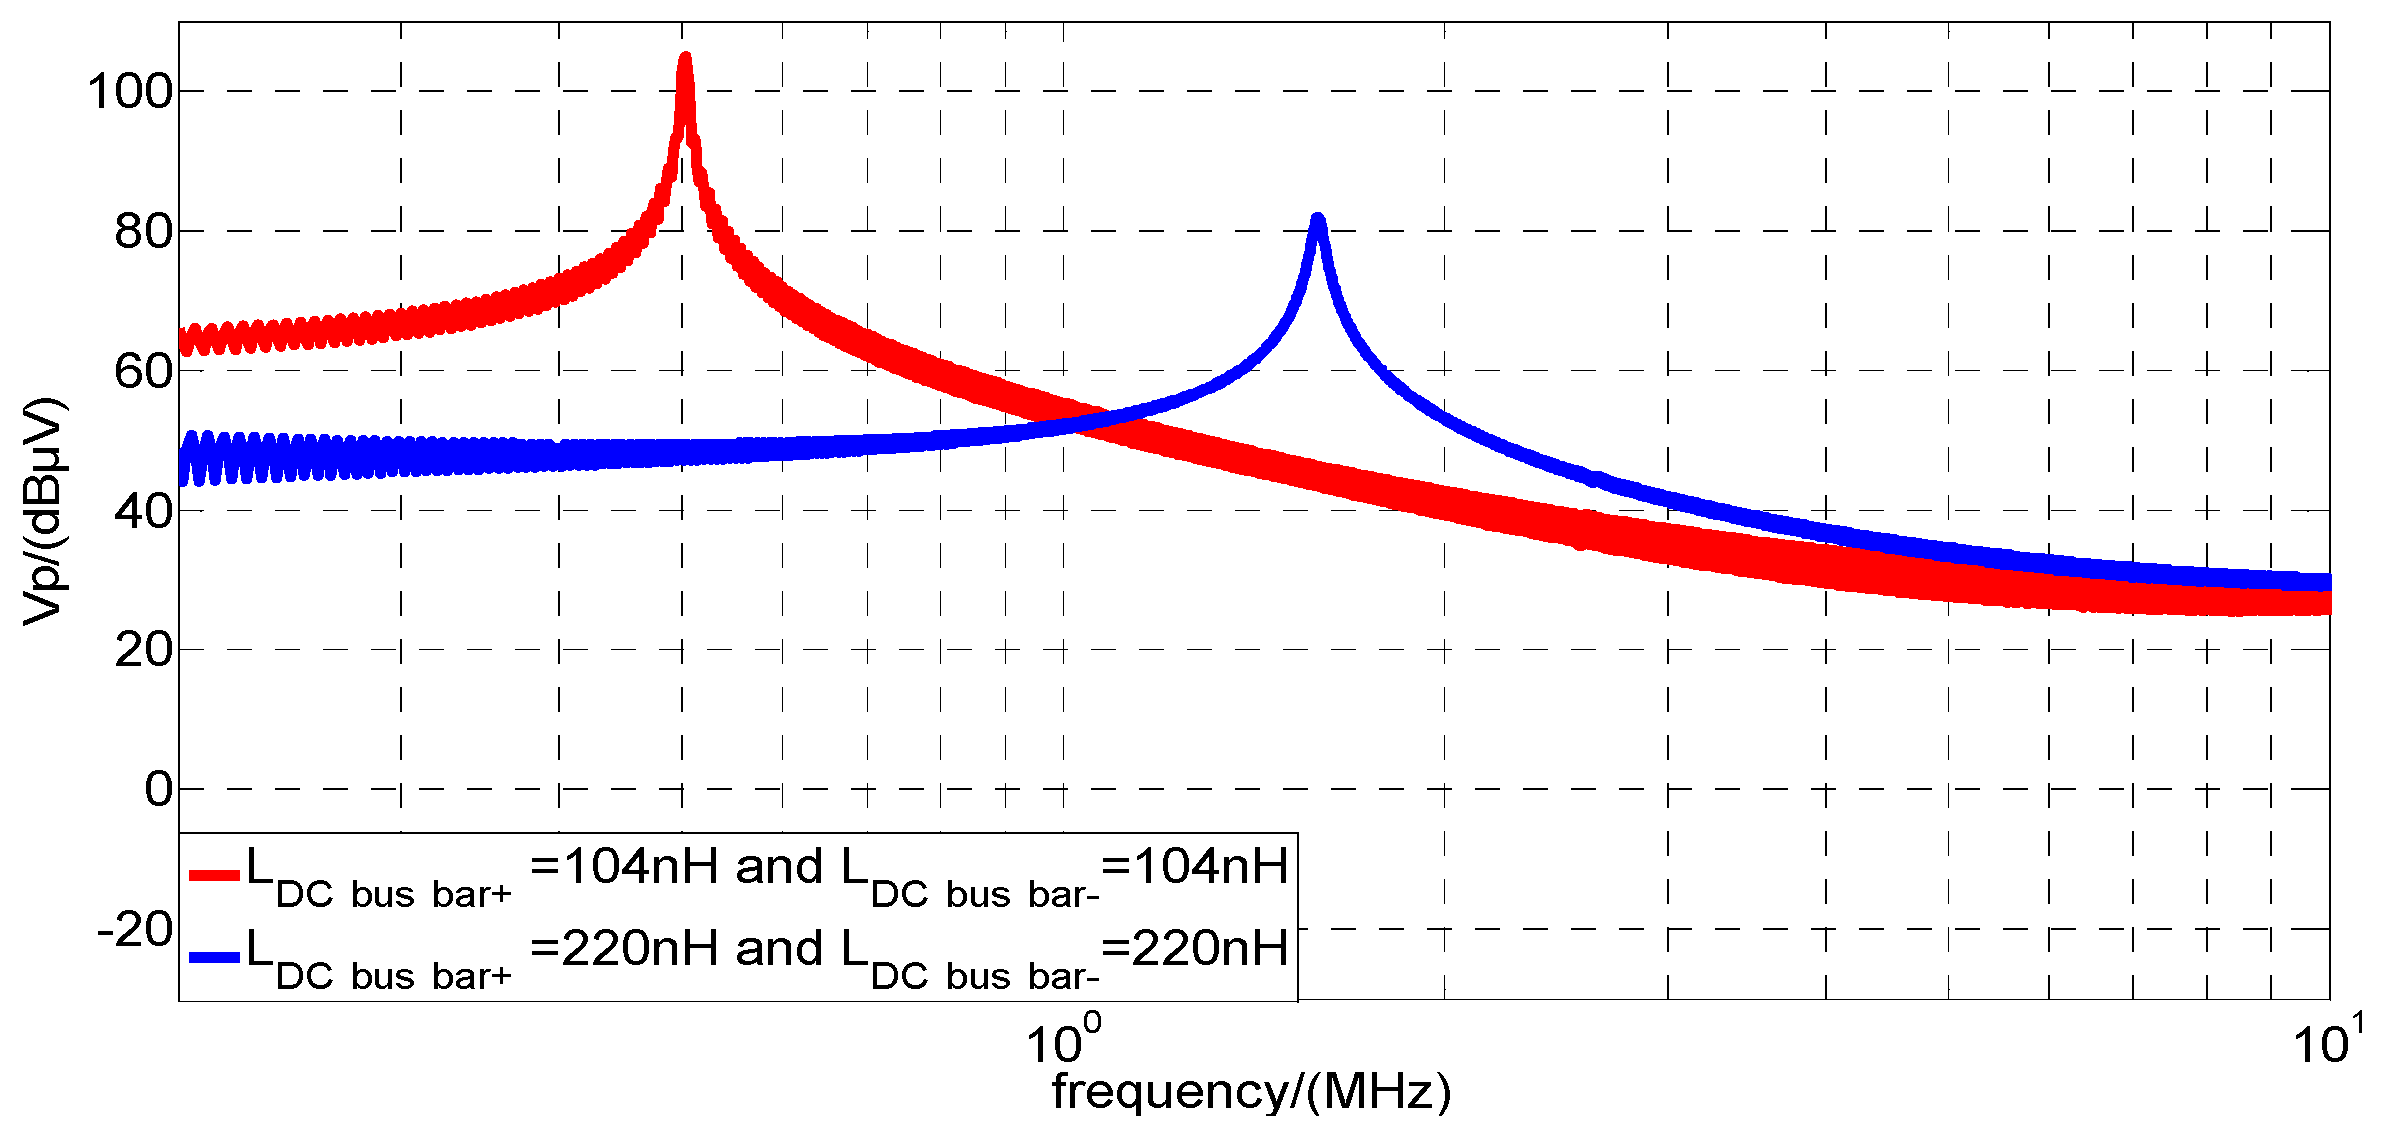
4.2.1. The Effect of LDC bus bar+ and LDC bus bar−

According to Table 3, changing the value of LDC bus bar+ and LDC bus bar− can mitigate the resonance and reduce the conducted emissions at low frequency. Therefore, the EMI voltage peak due to resonance at 500 kHz could be suppressed. The voltage value of conducted emission at 500 kHz can be rapidly decreased by about 50 dB by increasing the value of LDC bus bar+ and LDC bus bar− from 104 nH to 220 nH to comply with the limit level-3 of CISPR25 regulatory standards, as shown in Figure 13. It suggests that two CM inductors can be placed on the DC bus bar of the power inverter of the AC motor to reduce the CM current and conducted emission at 500 kHz.

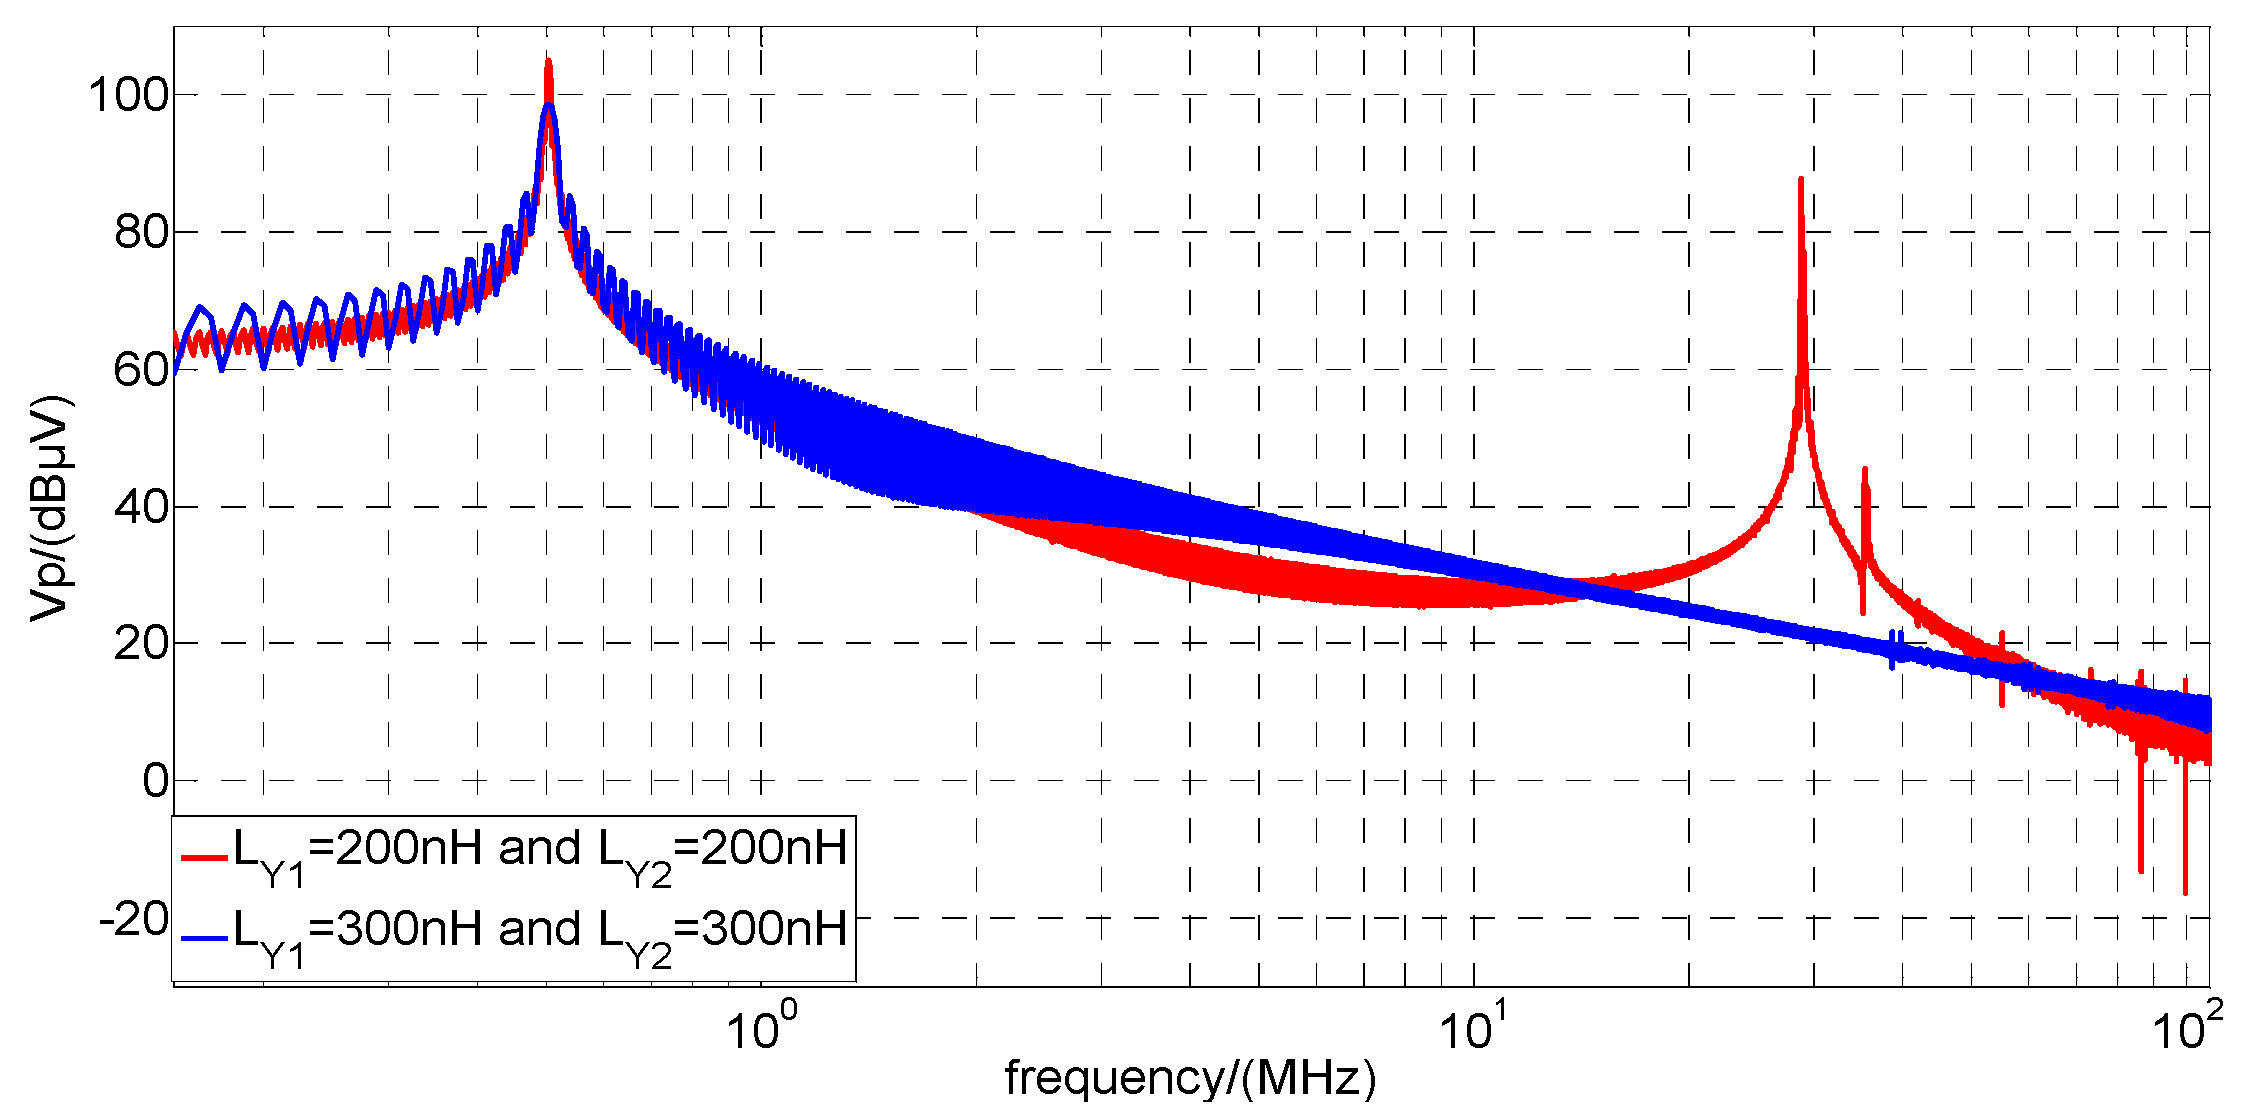
4.2.2. The Effect of LY1 and LY2

According to Table 3, LY1 and LY2 can be increased to mitigate the resonance and reduce the conducted emission at high frequency. Therefore, the EMI voltage peak due to resonance at 30 MHz could be suppressed. The voltage value of conducted emission at 30 MHz can be rapidly decreased by about 64 dB by increasing the value of LY1 and LY2 from 200 nH to 300 nH to comply with the level-3 limit of CISPR25, as shown in Figure 14. It suggests that the equivalent series inductance of Y capacitor can affect the conducted EMI at 30 MHz. A better design of the parameters of the Y capacitor can reduce the conducted emissions at high frequency.

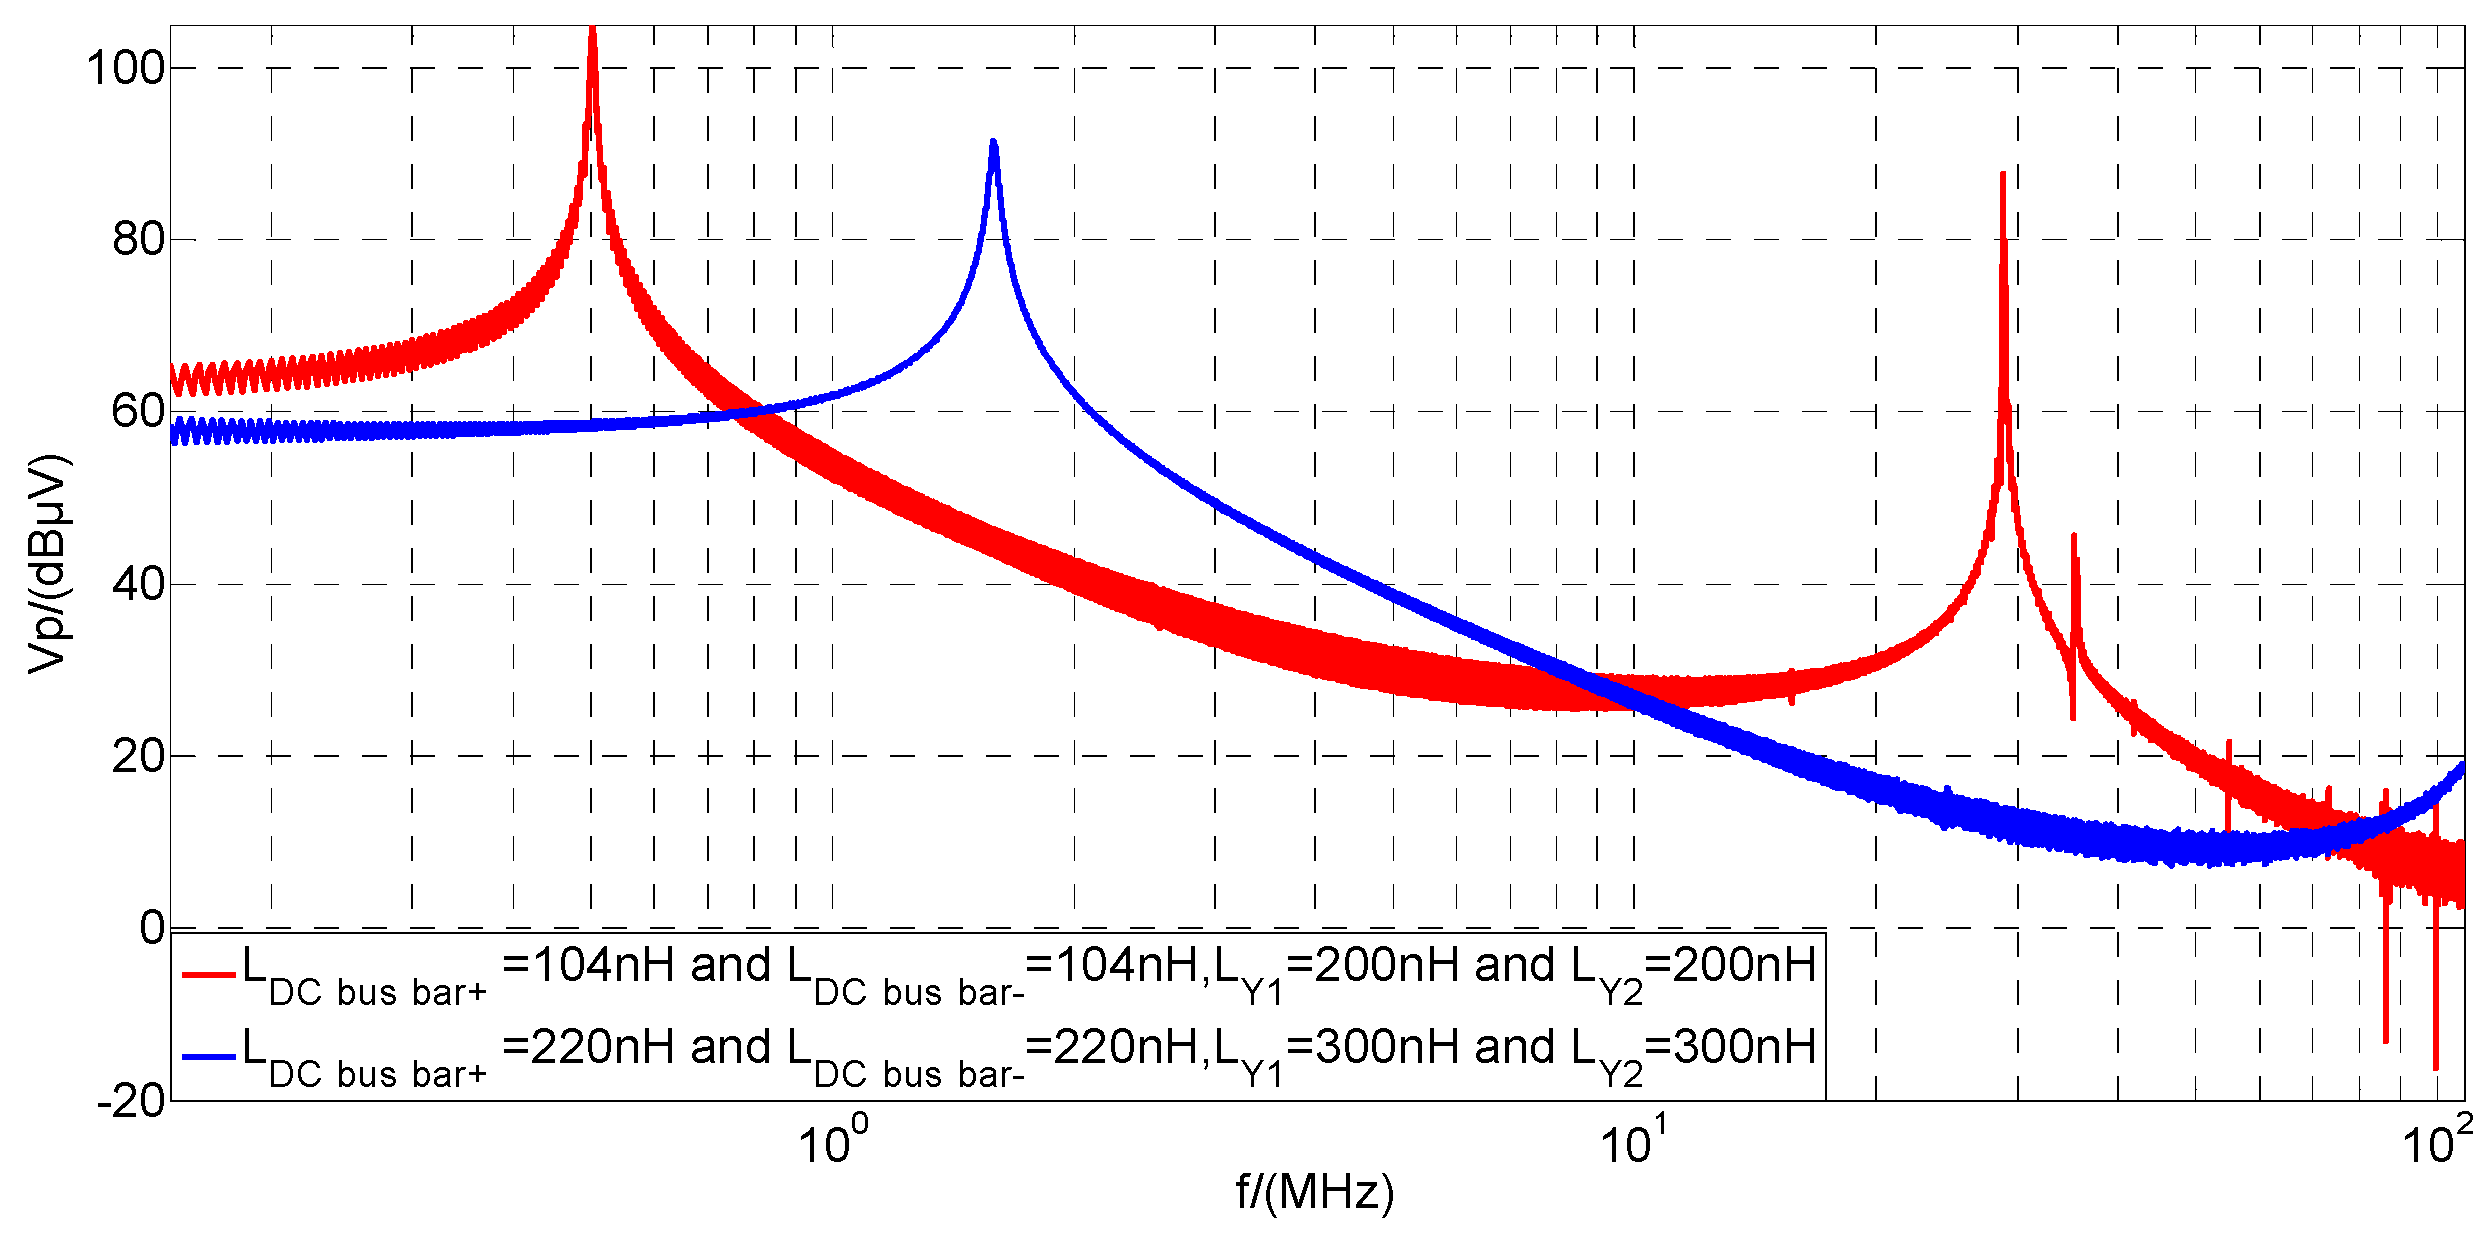
4.2.3. The Effect of Combination of LDC bus bar+, LDC bus bar−, LY1 and LY2

Increasing of the value of LDC bus bar+, LDC bus bar− (each 220 nH) and LY1, LY2 (each 300 nH) can decrease the conduced emissions at frequencies from 150 kHz to 108 MHz to below the limit level-3 of CISPR25. Then there are no resonances previously caused by LDC bus bar+ and LDC bus bar− at 500 kHz, LY1 and LY2 at 30 MHz. Although there still is a resonance point at around 55 MHz, the value of conducted voltage is decreased below the level-3 limit of CISPR25, as shown in Figure 15.

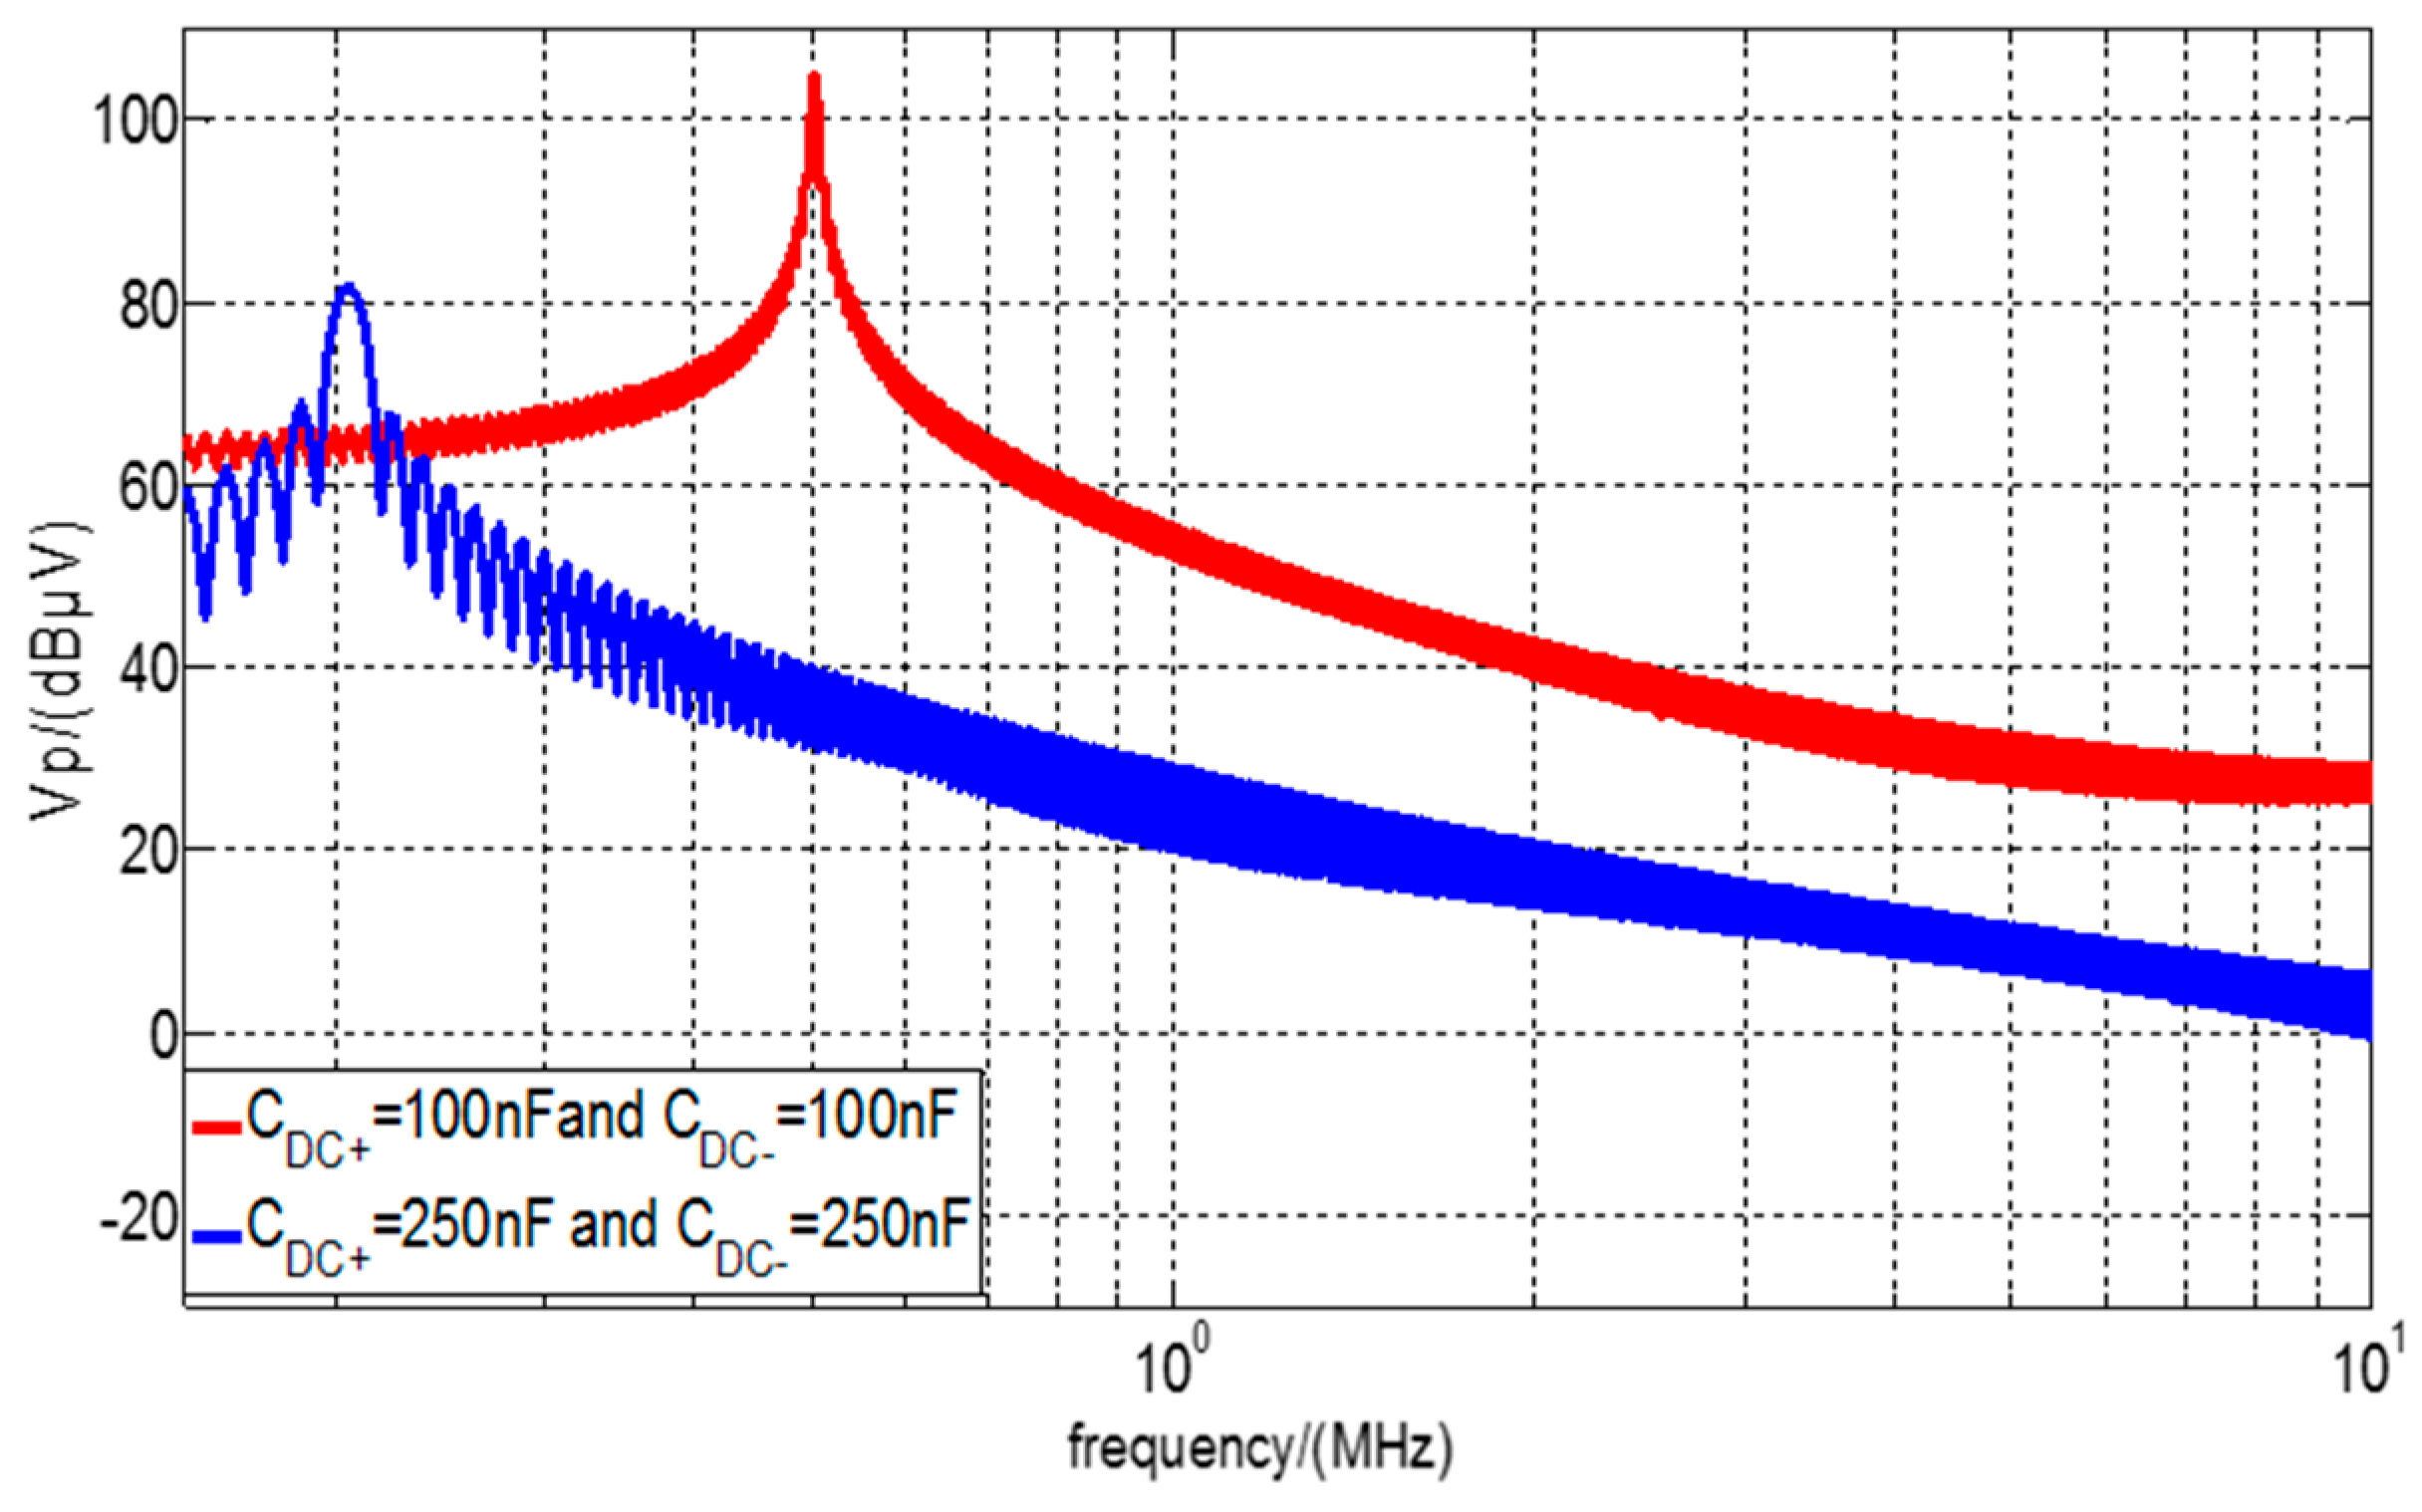
4.2.4. The Effect of CDC+ and CDC−

From Table 3, the distributed capacitances from DC cables (CDC+, CDC−) can affect the conducted emissions. Changing the value of CDC+ and CDC− can mitigate the resonance at 500 kHz and reduce the conducted emission at low frequency. The voltage value of conducted emission at 500 kHz can be decreased by about 25 dB by increasing the value of CDC+ and CDC− from 100 nF to 250 nF to comply with the limit level-3 of CISPR25, as shown in Figure 16. It suggests that filtering and shielding of the DC input of the power inverter of the AC motor can be used to change the distributed parameters of DC cables to reduce the CM current at low frequency and suppress the EMI voltage peak due to resonance at 500 kHz. For example, a Y capacitor could be added between the DC cable and chassis to reduce conducted emissions, although the Y capacitor may cause a high ground leakage current.

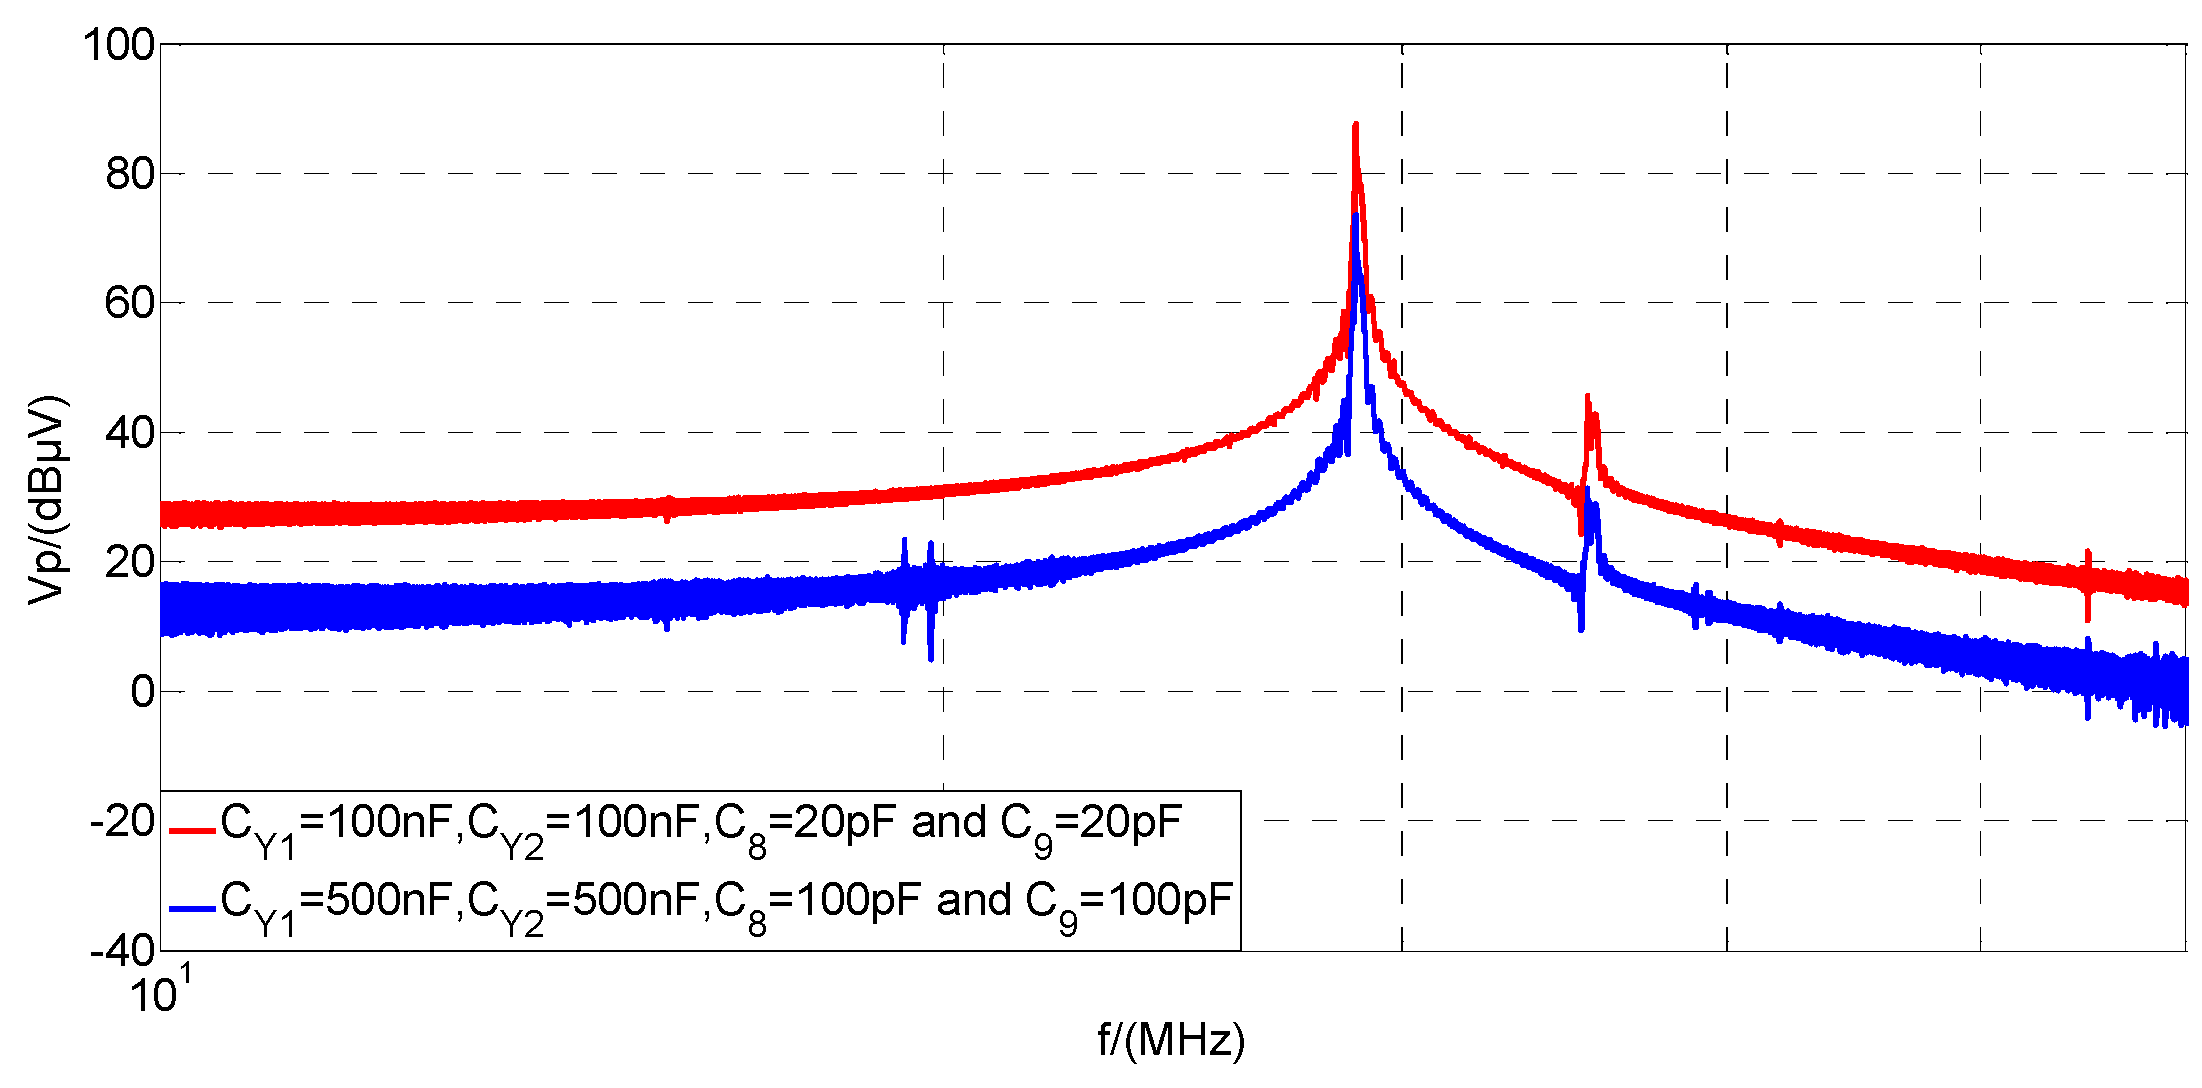
4.2.5. The Effect of the Combination of CY1, CY2, C8 and C9

From Table 3, the capacitances of the Y capacitors (CY1, CY2) and the distributed capacitance from the collector and emitter of the IGBT to the chassis (C8, C9) can affect the conduced emissions at high frequency. The voltage value of conducted emissions at high frequency can be decreased to comply with CISPR25 by increasing the value of CY1 and CY2 from 100 nF to 500 nF and the value of C8 and C9 from 20 pF to 100 pF, as shown in Figure 17. It shows that the peak value of the conducted voltage is reduced by 20 dB at about 30 MHz. Therefore, Y capacitors could be added between the collector and emitter of the IGBT and chassis, and between DC input and chassis to reduce conducted emissions at high frequency.

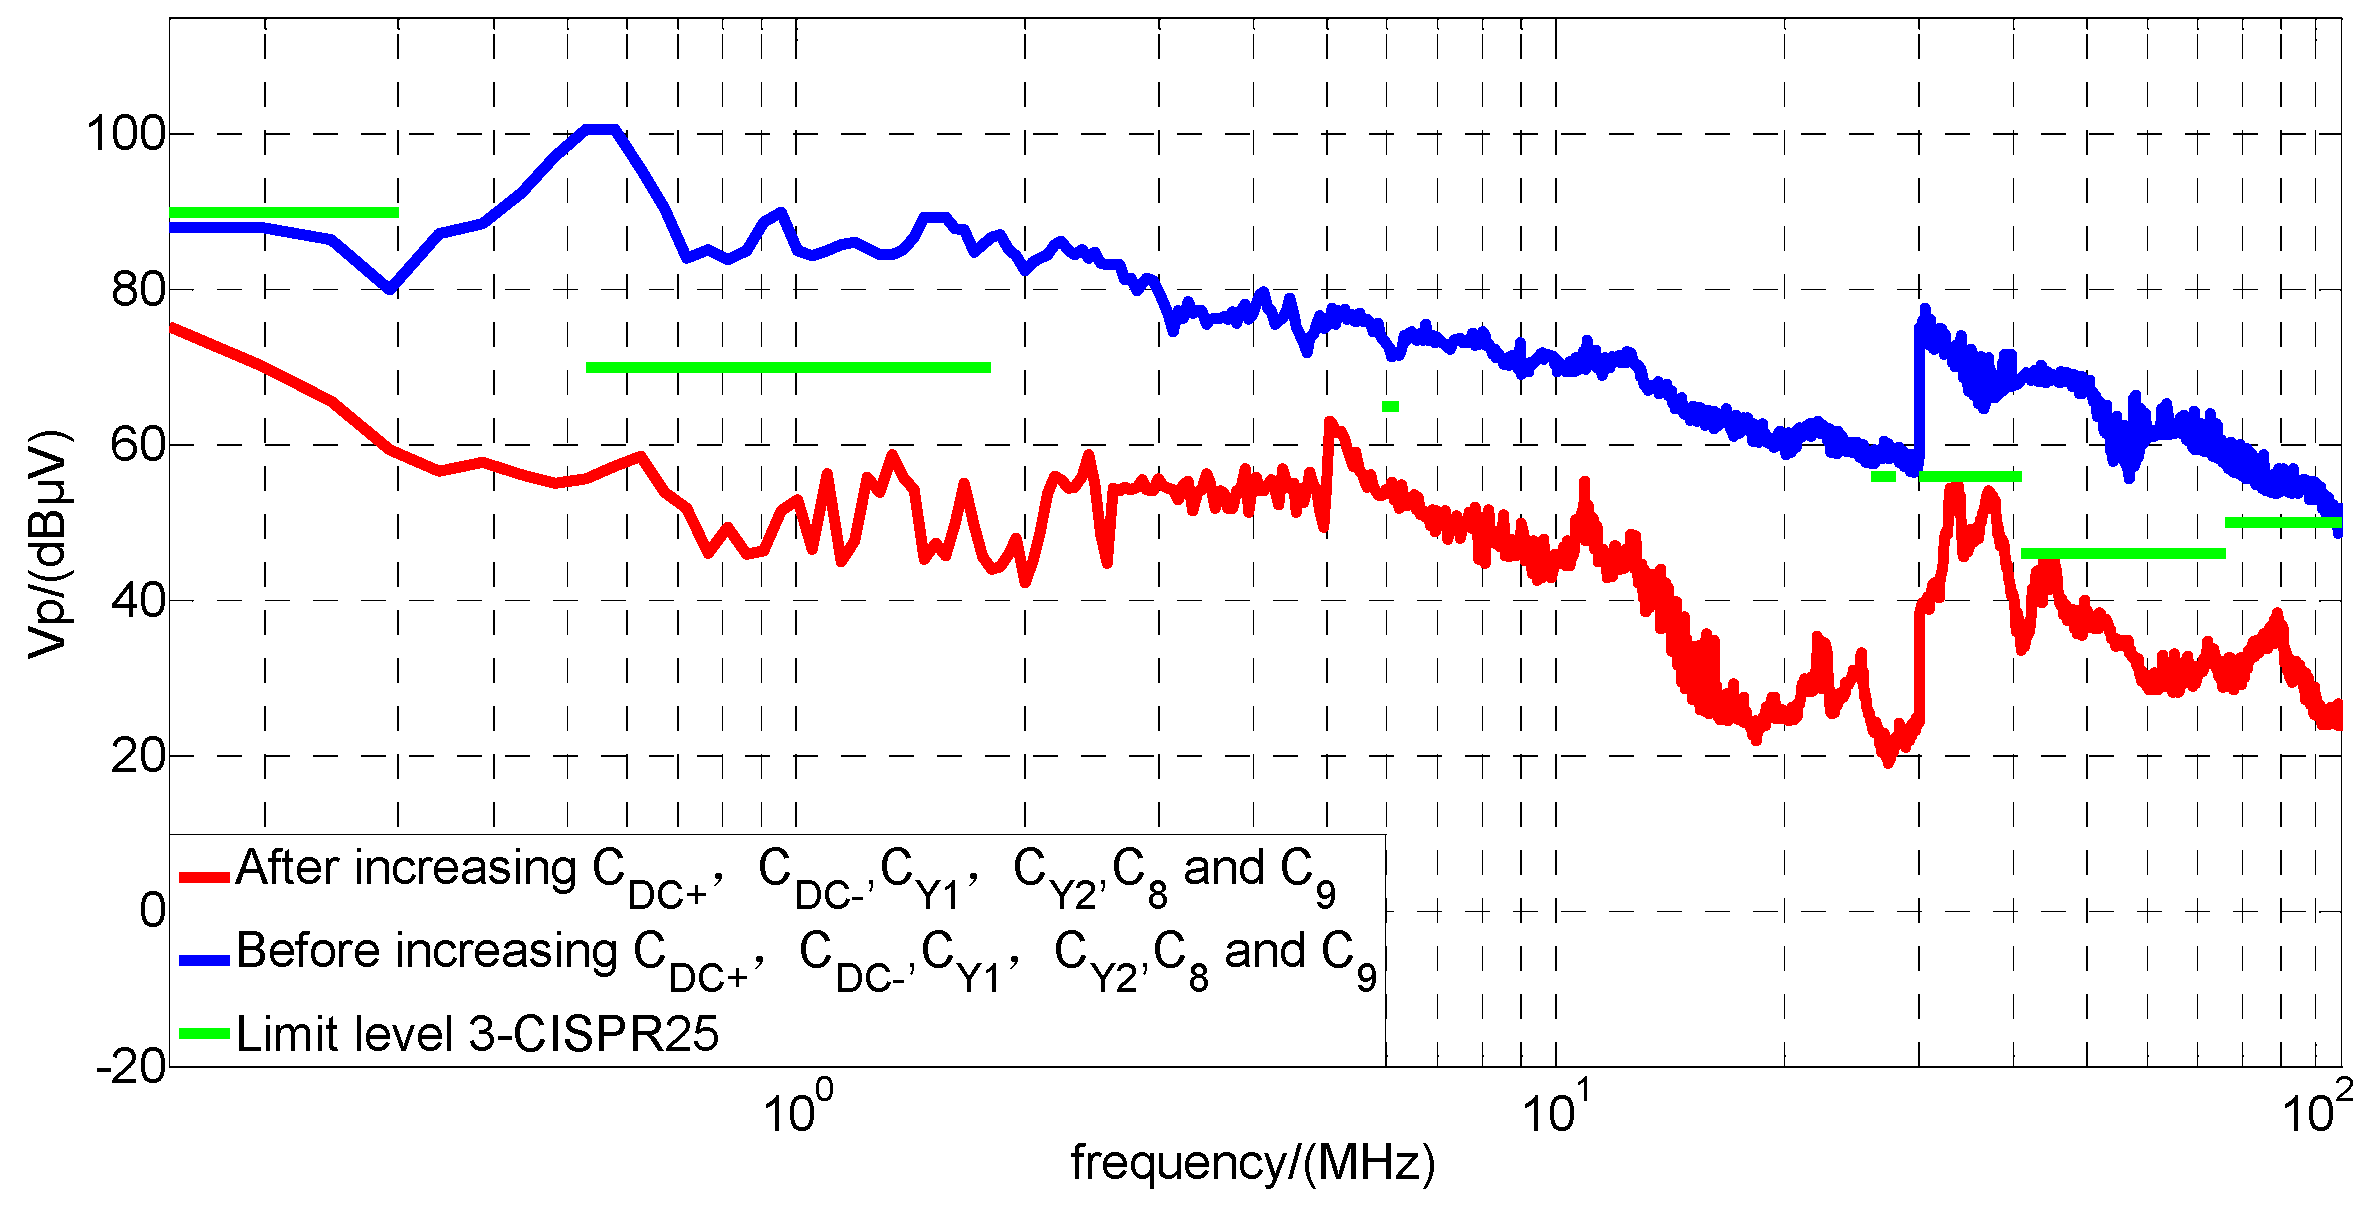
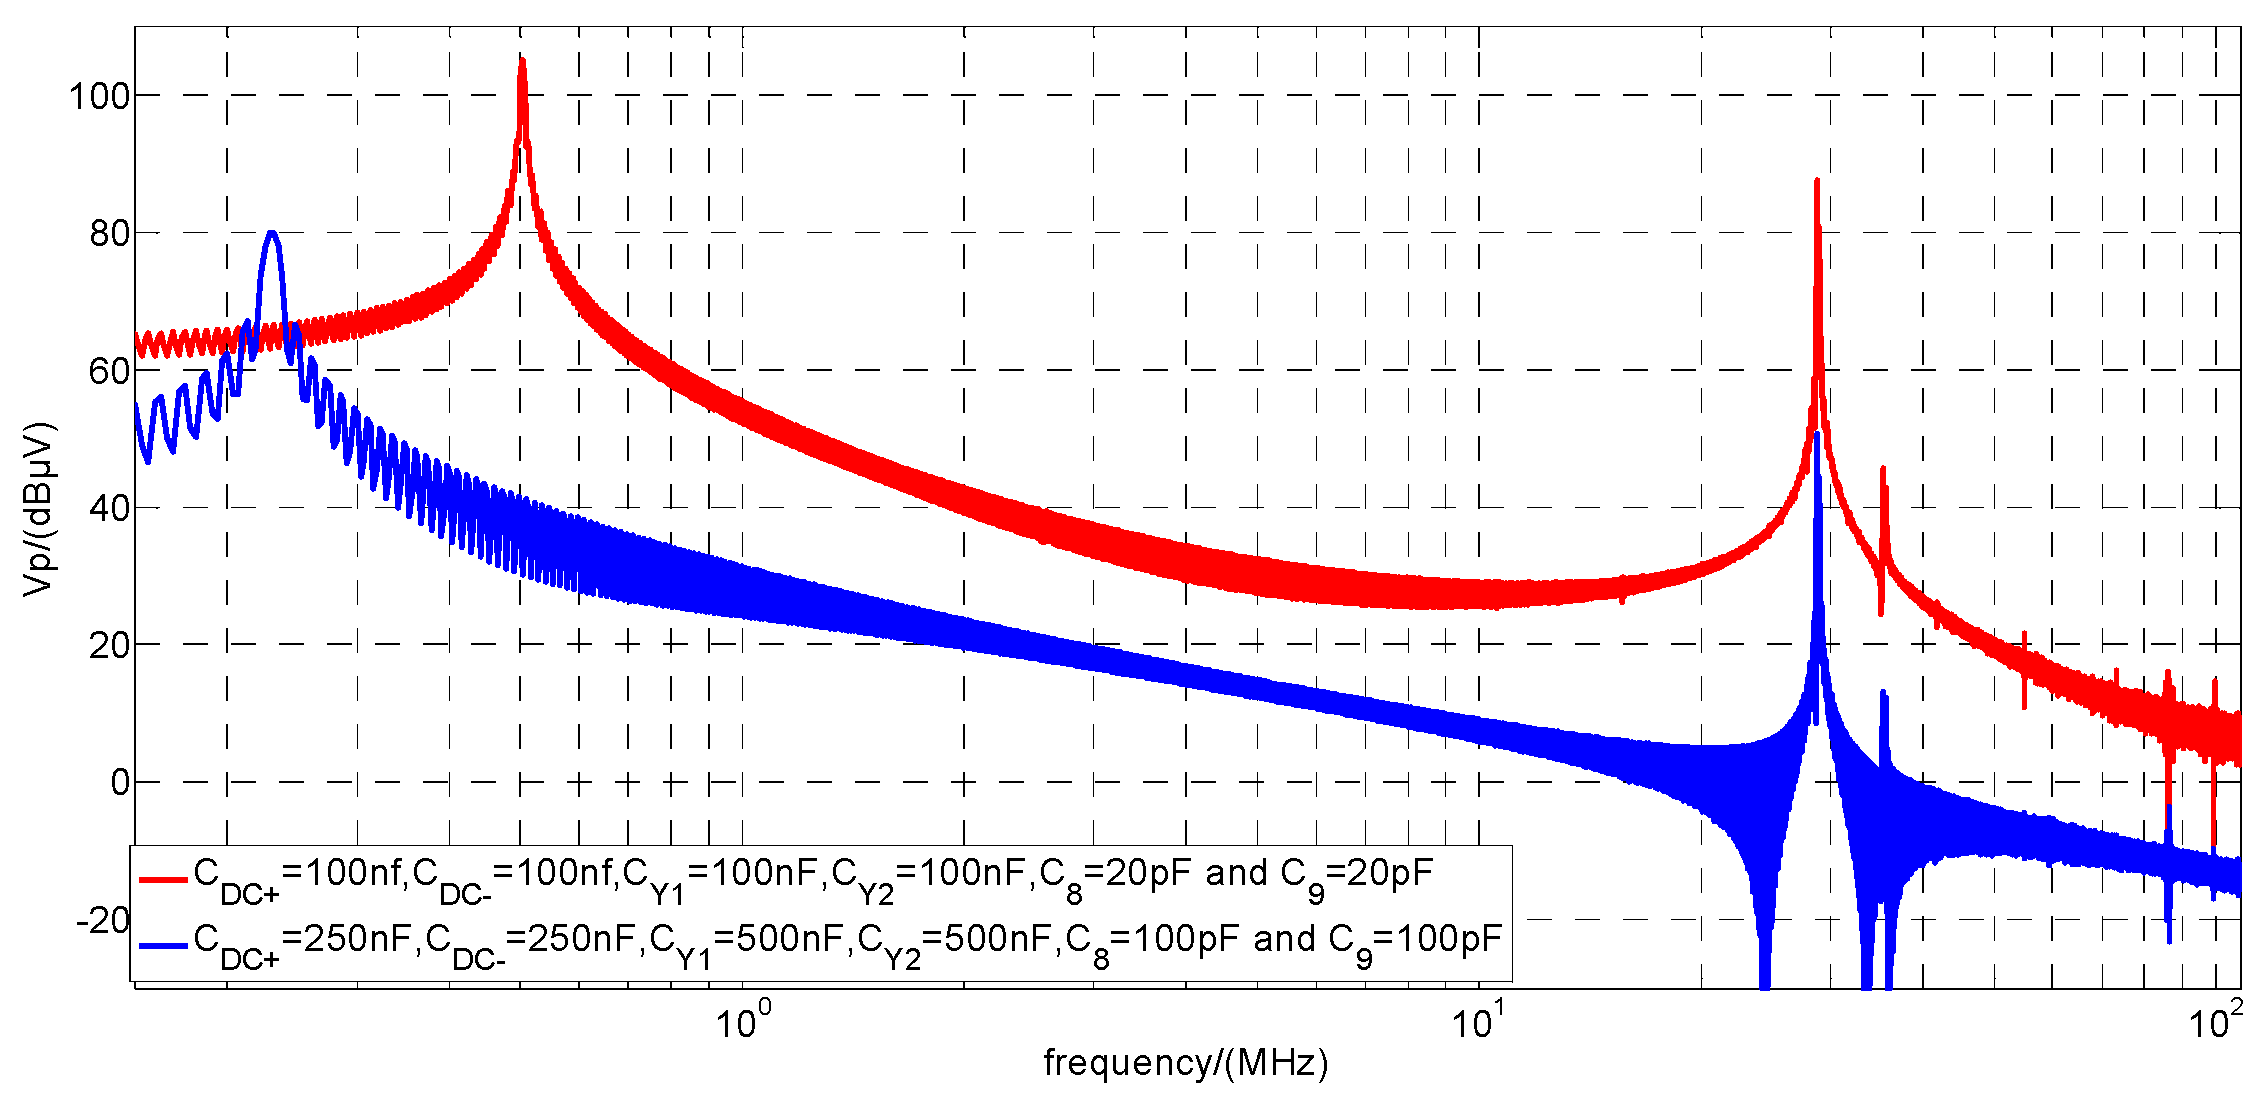
4.2.6. The Effect of the Combination of CDC+, CDC−, CY1, CY2, C8 and C9

It is a better mitigation method to change the value of the distributed parameters (CDC+, CDC−, CY1, CY2, C8 and C9) to reduce the conducted emission at frequencies from 150 kHz to 108 MHz defined in CISPR25. The conducted voltage is reduced by increasing the capacitances (CDC+ = CDC− = 250 nF, CY1 = CY2 = 500 nF, C8 = C9 = 100 pF), as shown in Figure 18.

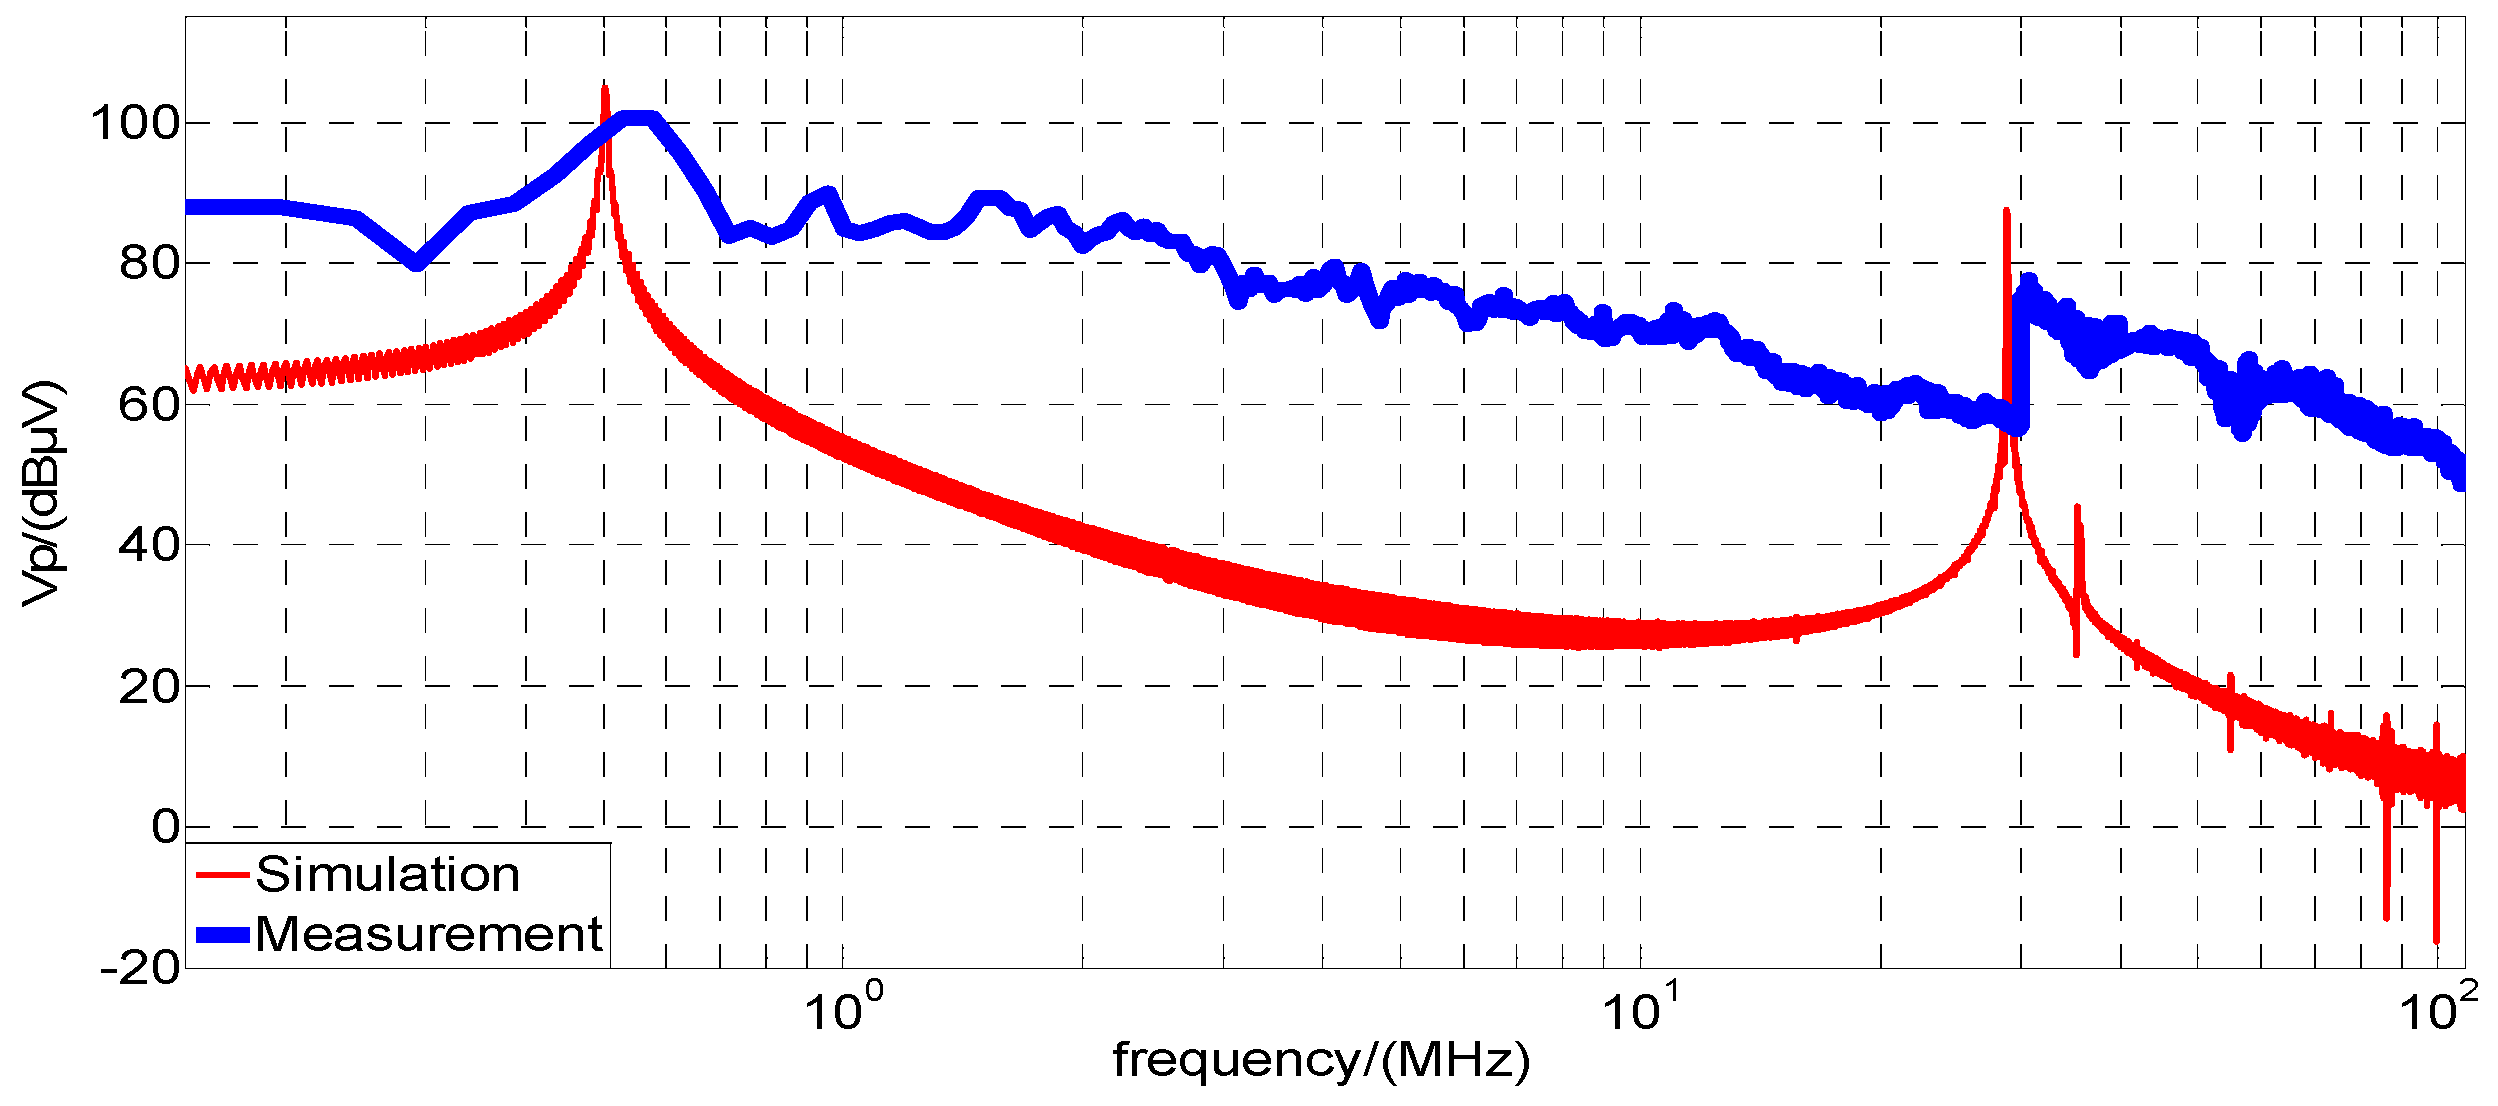
5. Experimental Verification

According to the above analysis of the effect of distributed parameters on the power inverter system of AC motors for EVs, changing the combination of CDC+, CDC−, CY1, CY2, C7 and C8 should be a better way to suppress the voltage peak at 500 kHz and 30 MHz to comply with the limit level-3 of CISPR 25. A new pair of Y capacitors are added between the collector and emitter of the IGBT and DC bus bar and the chassis to increase the capacitances between the inverter and the chassis. Experimental verification is conducted and the results are shown in Figure 19. The conducted emission characteristics at around 500 kHz and 30 MHz in Figure 19 are approximately as predicted by the simulation in Figure 18.

6. Conclusions

This study proposed a new method to analyze the effects of distributed parameters on conducted EMI from the DC-fed high voltage motor drive systems in EVs. The conducted EMI of high voltage DC cables of the motor drive system in a frequency range of 150 kHz–108 MHz and two EMI noise peaks at resonances frequencies 500 kHz and 30 MHz have been measured by a complete test for conducted EMI emissions from the AC motor drive system of an EV under load conditions. The research mainly focuses on the effects of distributed parameters in the inverter and cables on the resonances at 500 kHz and 30 MHz, nor the distributed parameters of the motor due to the high impedance of the motor model at 500 kHz and 30 MHz. The corresponding equivalent circuits for DM and CM EMI at resonance frequencies of 500 kHz and 30 MHz are established to determine the EMI propagation paths and the dominant distributed parameters of elements responsible for the resonances appearing at 500 kHz and 30 MHz.
The distributed parameters LDC bus bar+, LDC bus bar−, CDC+, CDC−, C8, C9, LY1, LY2, CY1 and CY2 can affect the EMI emissions from the high voltage motor drive system. The effect of the dominant distributed parameters on conducted voltage is verified by modeling of the CM circuit of a single-arm bridge of the high voltage motor power inverter. Increasing the value of LDC bus bar+, LDC bus bar− from 104 nH to 220 nH and LY1, LY2 from 200 nH to 300 nH or increasing the capacitances (CDC+, CDC− from 100 nF to 250 nF, CY1, CY2 from 100 nF to 500 nF, C8, C9 from 20 pF to 100 pF) can mitigate the two resonance peaks at the frequencies of 500 kHz and 30 MHz and decrease the conduced voltage at frequencies from 150 kHz to 108 MHz to below the limit level-3 of CISPR25. The effect of the combination of CDC+, CDC−, CY1, CY2, C8 and C9 on conducted voltage is verified by experiments. In future work, modeling of a CM circuit of three-arm bridge of the high voltage motor power inverter in EV will be developed. After that the effect of distributed parameters on EMI noise will be further simulated and tested.

Acknowledgments

This study is supported by National Natural Science of Foundation of China and Outstanding Talents Project of Beijing.

Author Contributions

Li Zhai analyzed the system conducted emission; Liwen Lin and Xinyu Zhang performed the modeling; Li Zhai and Chao Song performed the experiments; Li Zhai and Liwen Lin analyzed the data; Li Zhai wrote the paper.

Conflicts of Interest

The authors declare no conflict of interest.

References

  1. Sun, F.; Xiong, R.; He, H. A systematic state-of-charge estimation framework for multi-cell battery pack in electric vehicles using bias correction technique. Appl. Energy 2016, 162, 1399–1409. [Google Scholar] [CrossRef]
  2. Ferrero, E.; Alessandrini, S.; Balanzino, A.; Yan, J. Impact of the electric vehicles on the air pollution from a highway. Appl. Energy 2016, 169, 450–459. [Google Scholar] [CrossRef]
  3. Hu, X.; Murgovski, N.; Johannesson, L.; Bo, E. Energy efficiency analysis of a series plug-in hybrid electric bus with different energy management strategies and battery sizes. Appl. Energy 2013, 111, 1001–1009. [Google Scholar] [CrossRef]
  4. Chen, Z.; Xiong, R.; Wang, C.; Cao, J. An on-line predictive energy management strategy for plug-in hybrid electric vehicles to counter the uncertain prediction of the driving cycle. Appl. Energy 2016, 185, 1663–1672. [Google Scholar] [CrossRef]
  5. Torresa, J.L.; Gonzalezb, R.; Gimeneza, A.; Lopeza, J. Energy management strategy for plug-in hybrid electric vehicles. A comparative study. Appl. Energy 2014, 113, 816–824. [Google Scholar] [CrossRef]
  6. Zhai, L.; Zhang, X.; Bondarenko, N.; Loken, D.; Doren, T.V.; Beetner, D.G. Mitigation emission strategy based on resonances from a power inverter system in electric vehicles. Energies 2016, 9, 419. [Google Scholar] [CrossRef]
  7. Ehsani, M.; Gao, Y.; Emadi, A. Modern Electric, Hybrid Electric, and Fuel Cell Vehicles: Fundamentals, Theory, and Design; CRC Press: Boca Raton, FL, USA, 2010. [Google Scholar]
  8. Ardon, V.; Aime, J.; Chadebec, O.; Clavel, E. EMC modeling of an industrial variable speed drive with an adapted PEEC method. IEEE Trans. Magn. 2010, 46, 2892–2898. [Google Scholar] [CrossRef]
  9. Lai, J.S.; Huang, X.; Chen, S.; Nehl, T.W. EMI characterization and simulation with parasitic models for a low-Voltage high-current AC motor drive. IEEE Trans. Ind. Appl. 2004, 40, 178–185. [Google Scholar] [CrossRef]
  10. Jettanasen, C.; Costa, F.; Vollaire, C. Common-mode emissions measurements and simulation in variable-speed drive systems. IEEE Trans. Power Electron. 2009, 24, 2456–2464. [Google Scholar] [CrossRef]
  11. Tommasini, R.; Spertino, F. Electric power distribution and environment: Interference of power installation magnetic fields on computer systems. Appl. Energy 1999, 64, 181–193. [Google Scholar] [CrossRef]
  12. Toure, B.; Schanen, J.-L.; Gerbaud, L.; Meynard, T.; Roudet, J.; Ruelland, R. EMC modeling of drives for aircraft applications: Modeling process, EMI filter optimization and technological choice. IEEE Trans. Power Electron. 2013, 28, 1145–1156. [Google Scholar] [CrossRef]
  13. Lai, J.S. Resonant snubber-based soft-switching inverters for electric propulsion drives. IEEE Trans. Ind. Electron. 1997, 44, 71–80. [Google Scholar]
  14. Mutoh, N.; Ogata, M. New methods to control EMI noises generated in motor drive systems. IEEE Trans. Ind. Appl. 2004, 40, 143–152. [Google Scholar] [CrossRef]
  15. Rebholz, H.M.; Tenbohlen, S.; Kohler, W. Time-domain characterization of RF sources for the design of noise suppression filters. IEEE Trans. Electromagn. Compat. 2009, 51, 945–952. [Google Scholar] [CrossRef]
  16. Reuter, M.; Friedl, T.; Tenbohlen, S.; Köhler, W. Emulation of conducted emissions of an automotive inverter for filter development in HV networks. In Proceedings of the IEEE International Symposium on Electromagnetic Compatibility (EMC), Denver, CO, USA, 5–9 August 2013; pp. 236–241.
  17. Trzynadlowski, A.M.; Wang, Z.; Nagashima, J.; Stancu, C. Comparative investigation of PWM techniques for general motor’s new drive for electric vehicles. In Proceedings of the IEEE Industry Applications Conference, Pittsburgh, PA, USA, 13–18 October 2002; pp. 2010–2015.
  18. Piazza, M.C.D.; Ragusa, A.; Tine, G.; Vitale, G. A model of electromagnetic radiated emissions for dual Voltage automotive electrical systems. In Proceedings of the IEEE International Symposium on Industrial Electronics, Ajaccio, France, 4–7 May 2004; pp. 317–322.
  19. Akagi, H.; Shimizu, T. Attenuation of conducted EMI emissions from an inverter-driven motor. IEEE Trans. Power Electron. 2008, 23, 282–290. [Google Scholar] [CrossRef]
  20. Wang, S.; Maillet, Y.Y.; Wang, F.; Lai, R.; Luo, F.; Boroyevich, D. Parasitic effects of grounding paths on common-mode EMI filter’s performance in power electronics systems. IEEE Trans. Ind. Electron. 2010, 57, 3050–3059. [Google Scholar] [CrossRef]
  21. Bishnoi, H.; Baisden, A.C.; Mattavelli, P.; Boroyevich, D. Analysis of EMI terminal modeling of switched power converters. IEEE Trans. Power Electron. 2012, 27, 3924–3933. [Google Scholar] [CrossRef]
  22. Gong, X.; Ferreira, A.J. Comparison and reduction of conducted EMI in SiC JFET and Si IGBT-based motor drives. IEEE Trans. Power Electron. 2014, 29, 1757–1767. [Google Scholar] [CrossRef]
  23. Revol, B.; Roudet, J.; Schanen, J.L.; Loizelet, P. EMI study of three-phase inverter-fed motor drives. IEEE Trans. Ind. Appl. 2011, 47, 223–231. [Google Scholar] [CrossRef]
  24. Stevanovic, I.; Skibin, S.; Masti, M.; Laitinen, M. Behavioral modeling of chokes for EMI simulations in power electronics. IEEE Trans. Power Electron. 2013, 28, 695–705. [Google Scholar] [CrossRef]
  25. Mutoh, N.; Ogata, M.; Gulez, K.; Harashima, F. New methods to suppress EMI noises in motor drive systems. IEEE Trans. Ind. Electron. 2002, 49, 474–485. [Google Scholar] [CrossRef]
  26. Bishnoi, H.; Mattavelli, P.; Burgos, R.; Boroyevich, D. EMI behavioral models of DC-fed three-phase motor drive systems. IEEE Trans. Power Electron. 2014, 29, 4633–4645. [Google Scholar] [CrossRef]
  27. Bondarenko, N.; Zhai, L.; Xu, B.; Li, G.; Makharashvili, T.; Loken, D.; Berger, P.; Doren, T.P.V.; Beetner, D.G. A measurement-based model of the electromagnetic emissions from a power inverter. IEEE Trans. Power Electron. 2015, 30, 5522–5531. [Google Scholar] [CrossRef]
  28. Australia, S. Vehicle, Boats and Internal Combustion Engines—Limits and Methods of Measurement for the Protection of on-Board Receivers; CISPR25; International Special Committee on Radio Interference: Geneva, Switzerland, 2012. [Google Scholar]
  29. Mihalic, F.; Kos, D. Reduced conductive EMI in switched-mode DC–DC power converters without EMI filters: PWM versus randomized PWM. IEEE Trans. Power Electron. 2006, 21, 1783–1794. [Google Scholar] [CrossRef]
  30. Chen, S.; Nehl, T.W.; Lai, J.-S.; Huang, X.; Pepa, E.; de Doncker, R.; Voss, I. Towards EMI prediction of a PM motor drive for automotive applications. In Proceedings of the Applied Power Electronics Conference and Exposition, Miami Beach, FL, USA, 9–13 February 2003; pp. 14–22.
  31. Paul, C.R. Introduction to EMC; Wiley & Sons. Inc.: New York, NY, USA, 1992; pp. 466–474. [Google Scholar]
  32. Mugur, P.R.; Roudet, J.; Crebier, J.C. Power electronic converter EMC analysis through state variable approach techniques. IEEE Trans. Electromagn. Compat. 2001, 43, 229–238. [Google Scholar] [CrossRef]
Figure 1. Conducted EMI emission system test setup for the AC motor drive system.
Energies 10 00001 g001
Figure 2. The test platform for conducted EMI emission.
Energies 10 00001 g002
Figure 3. Comparison of measurement with load and measurement without load.
Energies 10 00001 g003
Figure 4. Spectral bounds for a trapezoidal wave: (a) SPWM in half-period; (b) The effect of pulse-width; (c) The effect of rise-time.
Energies 10 00001 g004
Figure 5. (a) Equivalent circuit for DM; (b) DM interference propagation path at 500 kHz.
Energies 10 00001 g005
Figure 6. DM interference propagation path at 30 MHz.
Energies 10 00001 g006
Figure 7. (a) Equivalent circuit for CM; (b) Equivalent circuit for CM; (c) CM interference propagation path at 500 KHz.
Energies 10 00001 g007aEnergies 10 00001 g007b
Figure 8. Equivalent circuit of CM interference at 500 KHz.
Energies 10 00001 g008
Figure 9. CM interference propagation path at 30 MHz.
Energies 10 00001 g009
Figure 10. Equivalent circuit of CM interference at 30 MHz.
Energies 10 00001 g010
Figure 11. CM circuit model of single-arm bridge of power inverter.
Energies 10 00001 g011
Figure 12. Comparison of measurement and simulation.
Energies 10 00001 g012
Figure 13. Positive conducted emission(CE) voltage after LDC bus bar+ and LDC bus bar− were increased.
Energies 10 00001 g013
Figure 14. Positive CE voltage after LY1 and LY2 were increased.
Energies 10 00001 g014
Figure 15. Positive CE voltage after LDC bus bar+, LDC bus bar−, LY1 and LY2 were increased.
Energies 10 00001 g015
Figure 16. Positive CE voltage after CDC+ and CDC− were increased.
Energies 10 00001 g016
Figure 17. Positive CE voltage after CY1, CY2, C8 and C9 were increased.
Energies 10 00001 g017
Figure 18. Positive CE voltage after CDC+, CDC−, CY1, CY2, C8 and C9 were increased.
Energies 10 00001 g018
Figure 19. Positive CE voltage after CDC+, CDC−, CY1, CY2, C8 and C9 were increased.
Energies 10 00001 g019
Table 1. CISPR25 class3-peak limits for conducted disturbances.
Service BandFrequency/MHzLimit/dB (µv)
Broadcast0.15–0.3090
0.53–1.8070
5.9–6.265
41–8846
76–10850
Mobile services26–2856
30–5456
68–8750
Table 2. Parameters in the motor drive system.
ParameterValueParameterValue
LY1, LY2200 nHCX1028 µF
C730 pFLX20 nH
C820 pFC1C620 pF
C920 pFRL1, RL250 Ω
C10200 pFCL1, CL20.47 µF
CY1, CY2100 pFLM1 mH
LDC+, LDC−50 nHCDC+, CDC−100 nF
RDC+, RDC−0.0002 ΩLDC bus bar+, LDC bus bar−104 nH
Table 3. The effect of the main distribution parameter on conducted EMI emission.
Changing of ParametersCurrentVoltage
LDC bus bar+ ↑ or ↓I1UR
LDC bus bar− ↑ or ↓I1UR
CDC+ ↑ or ↓I1UR
CDC−↑ or ↓I1UR
C8I2UR
C9I2UR
LY1I2UR
LY2I2UR
CY1I2UR
CY2I2UR
LDC bus bar+I2UR
LDC bus bar−I2UR

