1. Introduction
The financial system plays an important role in stimulating consumption and promoting economic growth. Schumpeter [
1] (pp. 95–128) recognized the importance of well-developed financial intermediaries in economic development about eight decades ago. In short, Schumpeter argues that by lowering transaction costs involved, well-functioning financial intermediaries enhance economic growth by allocating capital to projects that yield higher returns. In contrast, undeveloped financial intermediaries, in particular the banks, threaten economic growth.
Since the 1980s, there has been a profusion of banking crises in different countries. Japan suffered the largest losses over this period, with official estimates putting non-performing loans at about $400 billion in 1995. Unofficial estimates reach $1 trillion, or approximately 25 per cent of Japanese GDP. In the early 1980s, Argentina most probably saw the largest relative loss estimated variously at between 20 and 55 per cent of GDP. The US suffered the collapse of the subprime mortgage market in 2007 and ensuing financial instability. These cases have focused economists’ attention on bank insolvency issues. Caprio and Klingebiel [
2] (pp. 79–104) analyse the factors that cause bank insolvency and the government responses, and suggest that inadequate regulation developed by government may play an important role in failures to this. Demirgüҫ-Kunt and Detragiache [
3] (pp. 1373–1406) find a positive relationship between the existence of explicit deposit insurance and the likelihood of banking crises and this relation tends to be stronger with a larger coverage offered to depositors. Boyd, De Nicolò and Loukoianova [
4] (pp. 4–50) construct a theoretical model for the banking industry and use both country-level and firm-level samples to examine the impacts of macroeconomic factors, market structure, deposit insurance and external shocks on the likelihood of banking crises. These studies focus on investigating the common factors. A growing body of literature also demonstrates how the regulatory architecture and the political environment affect the financial market. Kim and Santomero [
5] (pp. 1219–1233) investigate the role of capital regulation in bank risk management using a mean-variance model and conclude that capital regulation encourages banks to adopt a higher risk portfolio. La Porta, López de Silanes, Shleifer, and Vishny [
6] (pp. 1113–1155) find that financial development is correlated with legal protection for investors, law enforcement, ownership concentration and the financial market. More recently, Laeven and Levine [
7] (pp. 259–275) show that the impacts of bank stability and bank regulations on bank activities depend on the bank’s ownership concentration. Based on a sample of international bank flows from 26 source countries to 120 recipient countries over a several decades, Houston, Lin and Ma [
8] (pp. 1845–1895) find that strong protection and limited regulation help attract international bank flows. However, to the extent of our knowledge, no existing literature discusses the impact of social capital.
Social capital is a new concept with a complex and diverse definition. The World Bank defines social capital as the institutions, relationships and norms that shape the quality and quantity of a society’s social interactions. Some researchers have focused on the effects of social capital in the macro-environment, in areas such as global economic growth and industry growth. For example, La Porta, López de Silanes, Shleifer, and Vishny [
9] (pp. 333–338) document a remarkable correlation between the trust prevailing in a country and the presence of large organizations and find that levels of trust are lower in countries with dominant hierarchical religions. Knack and Keefer [
10] (pp. 1251–1288) find that levels of social capital are higher in countries with faster economic growth. On the other hand, other scholars are interested in the role of social capital on micro-environment such as individual behaviour and firm performance. For instance, Hong, Kubik and Stein [
11] (pp. 137–163) study the relationship between social interactions and individuals’ stock market participation and find that high financial participation occurs in the community with high social interactions; Guiso, Sapienza and Zingales [
12] (pp. 526–556) argue that households in a low social capital community are less likely to own stocks and finally hinder global financial development; and Besley and Coate [
13] (pp. 1–18) relate social collateral to group lending programmes and find social collateral mitigate the negative effect of group lending on repayment rate. To our knowledge, very few studies have explored the connection between the level of social capital—especially that in the whole community—and the banking industry.
This paper is the first study to investigate the relationship between social capital and bank risk taking across countries and test whether the effects of social capital become stronger in any particular country. Some prior studies argue that social capital may reduce the cost of contract violation and reduce the cost of financial contracts (Rodrik [
14] (pp. 526–556)). Thus, social capital has a positive effect on bank stability. However, bankers may loosen their risk control as a result of high social capital. Therefore, social capital may have a negative effect as well. Our main finding shows that social capital is negatively related to the probability of bank insolvency, although it exerts both positive and negative impacts on bank stability. In areas with higher levels of social capital, banks are less likely to go bankrupt. Moreover, we argue that when the legal system is relatively weak, the effect of social capital becomes weaker. From the perspective of robustness, the results generated from the subsample, which excludes the banks in the US, are found to be consistent with the benchmark, indicating that both trust and civic norms exert positive effects on bank stability. Finally, our study examines the impact of shareholders’ social capital and provides results that are consistent with those of previous studies. The findings indicate that the behaviour of shareholders is affected more by the social capital present in their place of residence than in their place of birth as the latter exerts a negative and weaker impact on bank risk taking compared to the former.
The paper is organized as follows:
Section 2 describes the data sources and variables employed in the study,
Section 3 sets out the hypotheses,
Section 4 provides the empirical results, and
Section 5 concludes.
2. Data
2.1. Data Sources
The data used in this paper are compiled from two main sources:
- (1)
Bank-level accounting information for approximately 2000 banks is obtained from the BankScope database provided by Bureau van Dijk and Fitch Ratings. The BankScope database has comprehensive coverage in most countries, accounting for over 90% of all banking assets in each country. In this paper, the data covers the years 2004 to 2006.
- (2)
Measurements of social capital come from the World Values Survey (WVS), conducted by a worldwide network of social scientists who study changing values and their impacts on social and political life. Five waves of surveys were conducted from 1981 to 2007. This paper employs the last wave of surveys conducted in 2005, extracting 73,322 observations concerning trust and 75,766 observations on civic norms.
In
Appendix A,
Table A1 introduces the definition of all the variables included in this paper.
Table A2 reports the details of trust and civic indicators over 56 countries in 2005 wave.
Table 1 shows the summary statistics for all key variables. Our sample contains 2657 banks in 53 countries. Columns 2–8 present the mean, standard deviation, minimum, first quartile, median, third quartile and the max values, respectively.
Table 2 and
Table 3 report the correlations between the main regression variables, where trust and civic are measures of social capital. The positive correlation, as shown in
Table 2 and
Table 3, implicates that banks take less risk when the level of trust is higher and/or civic norms are stronger.
2.2. Bank Risk Taking
The measurement of bank risk taking employed in this study is the Z-score of each bank, calculated by dividing the sum of the return on assets (ROA) and the capital asset ratio (CAR) by the standard deviation of asset returns (σ(ROA)).
The Z-score measures the stability and the probability of insolvency of a bank and has been used widely in the empirical banking and finance literature since Roy’s [
15] (p. 431–449) study. Boyd and Runkle [
16] (pp. 47–67), De Nicoló [
17] (pp. 197–215), Boyd, De Nicolò and Jalal [
18] (pp. 19–29), Laeven and Levine [
7] (pp. 259–275) and Houston, Lin, Lin and Ma [
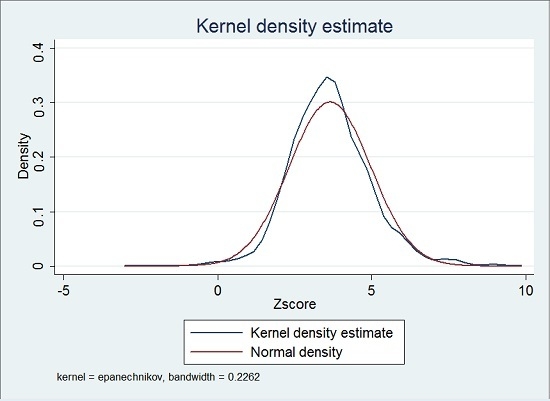
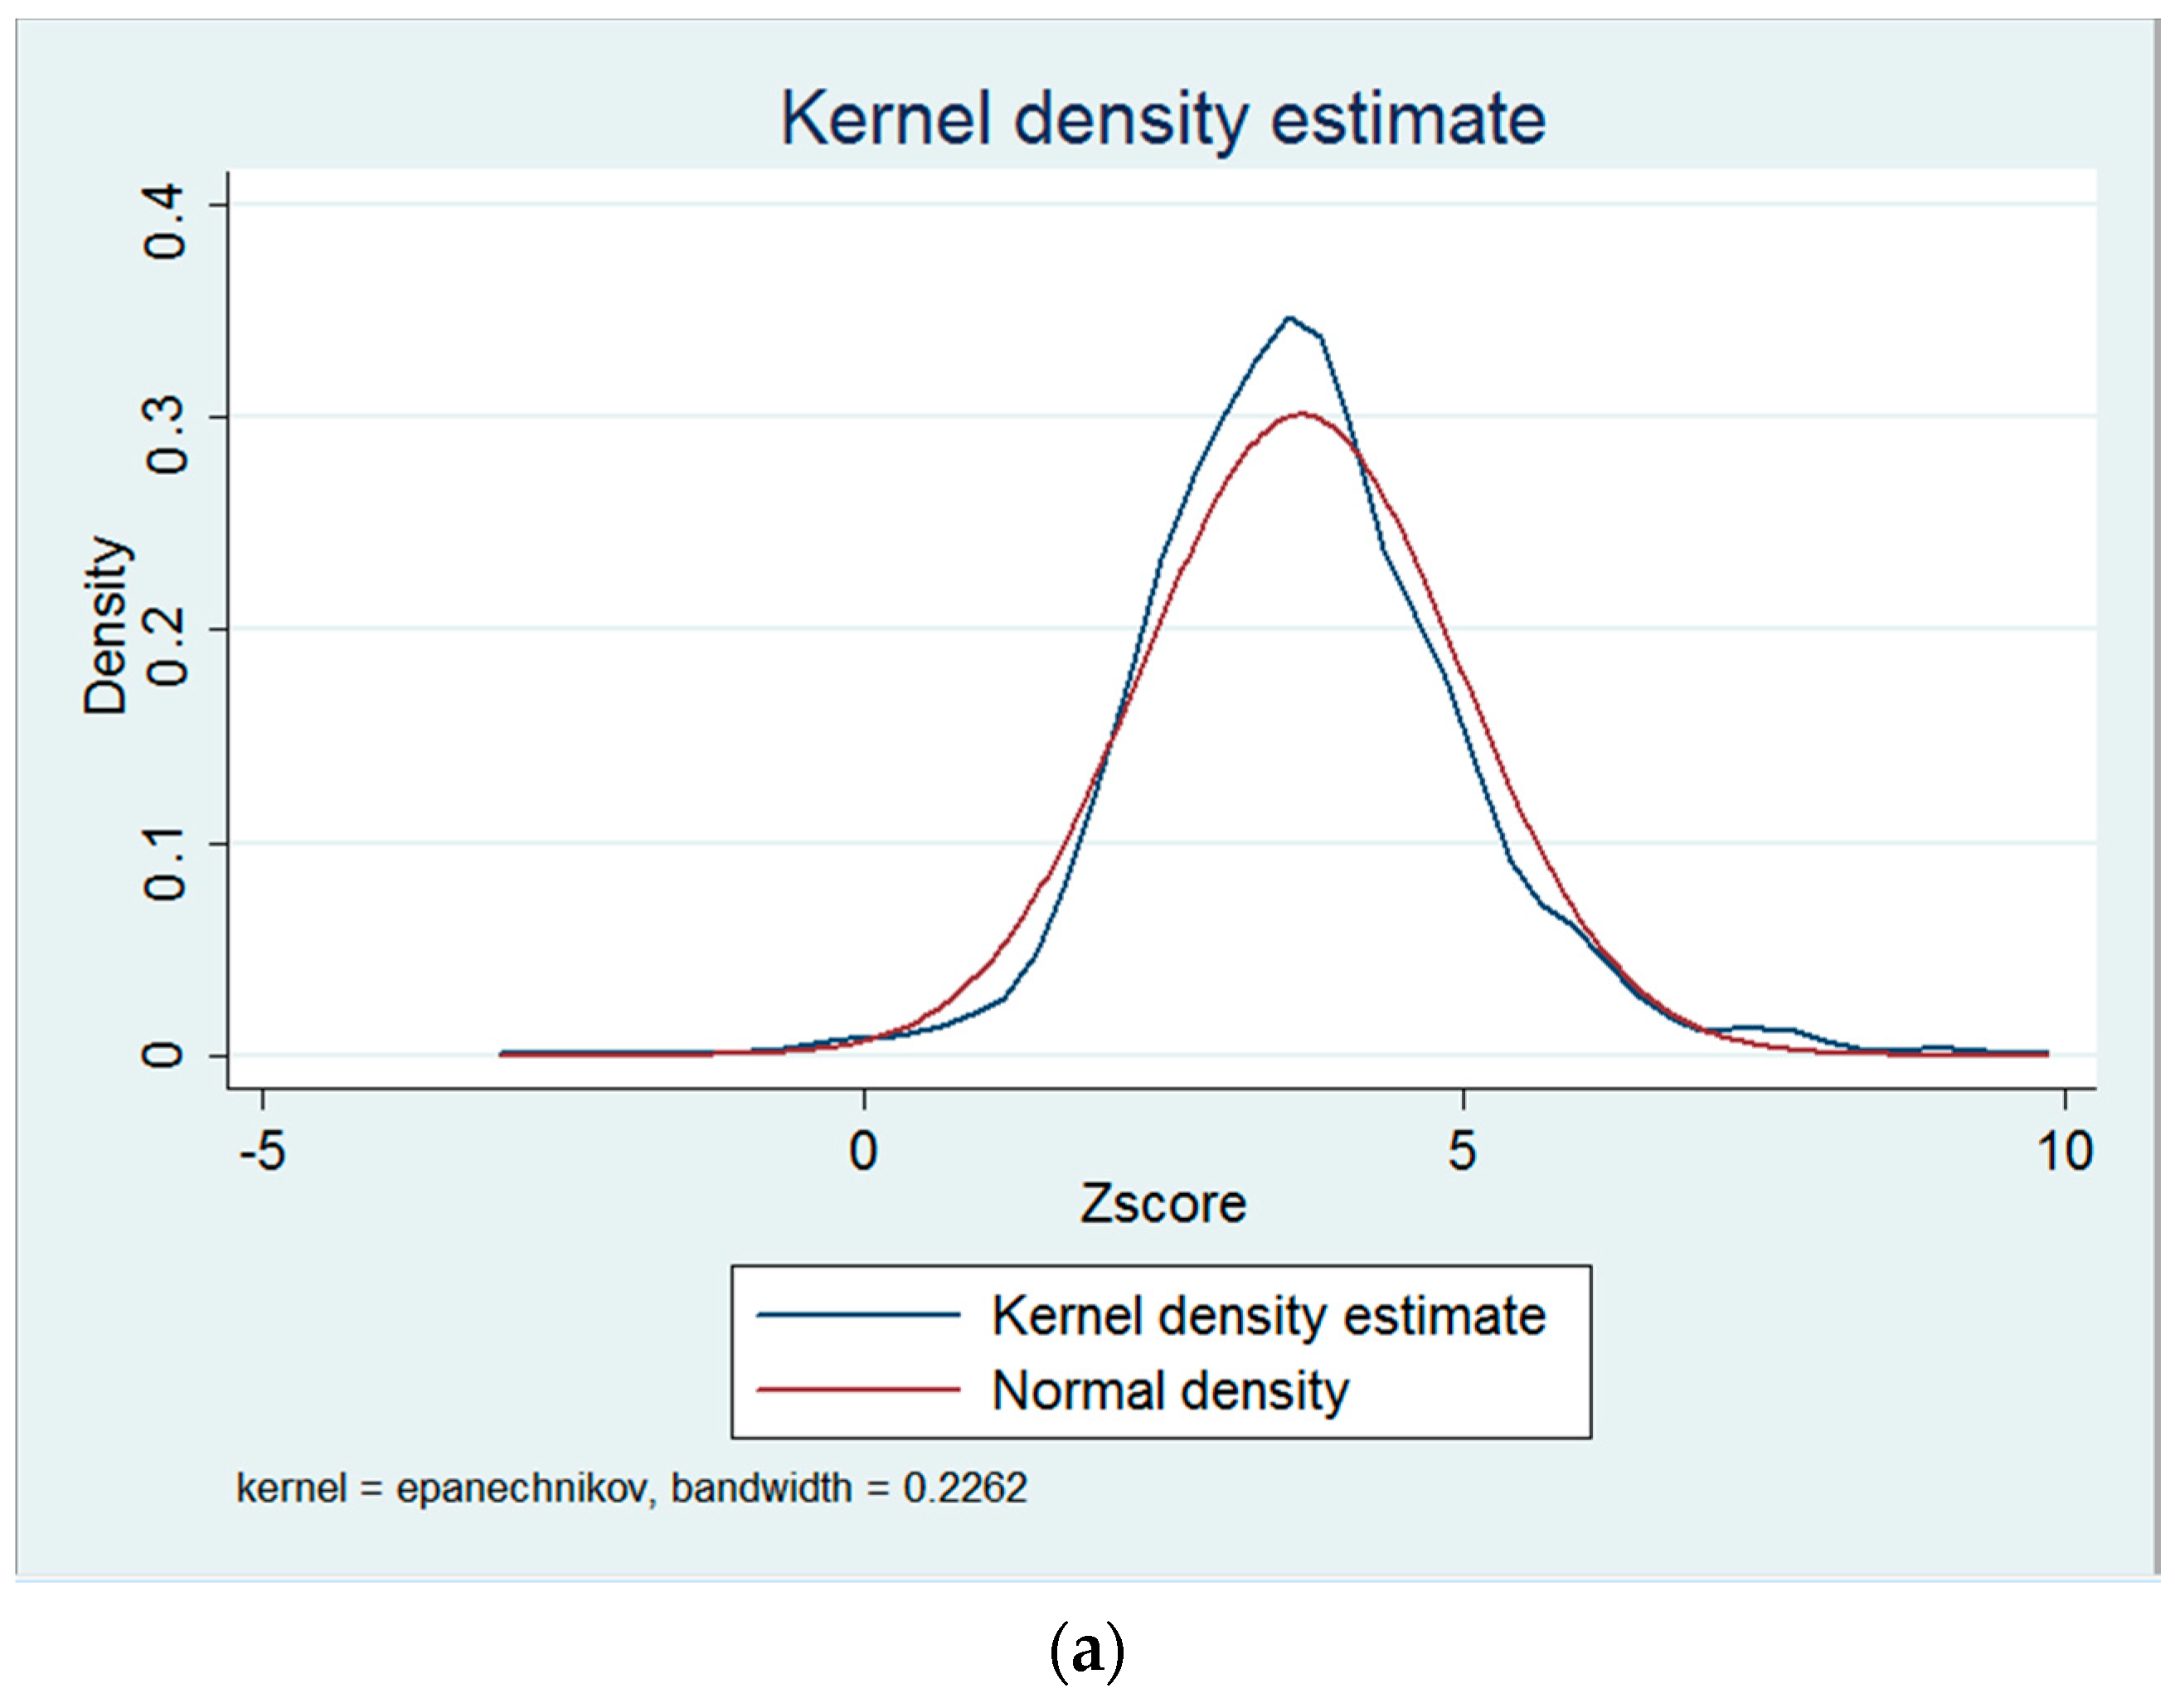
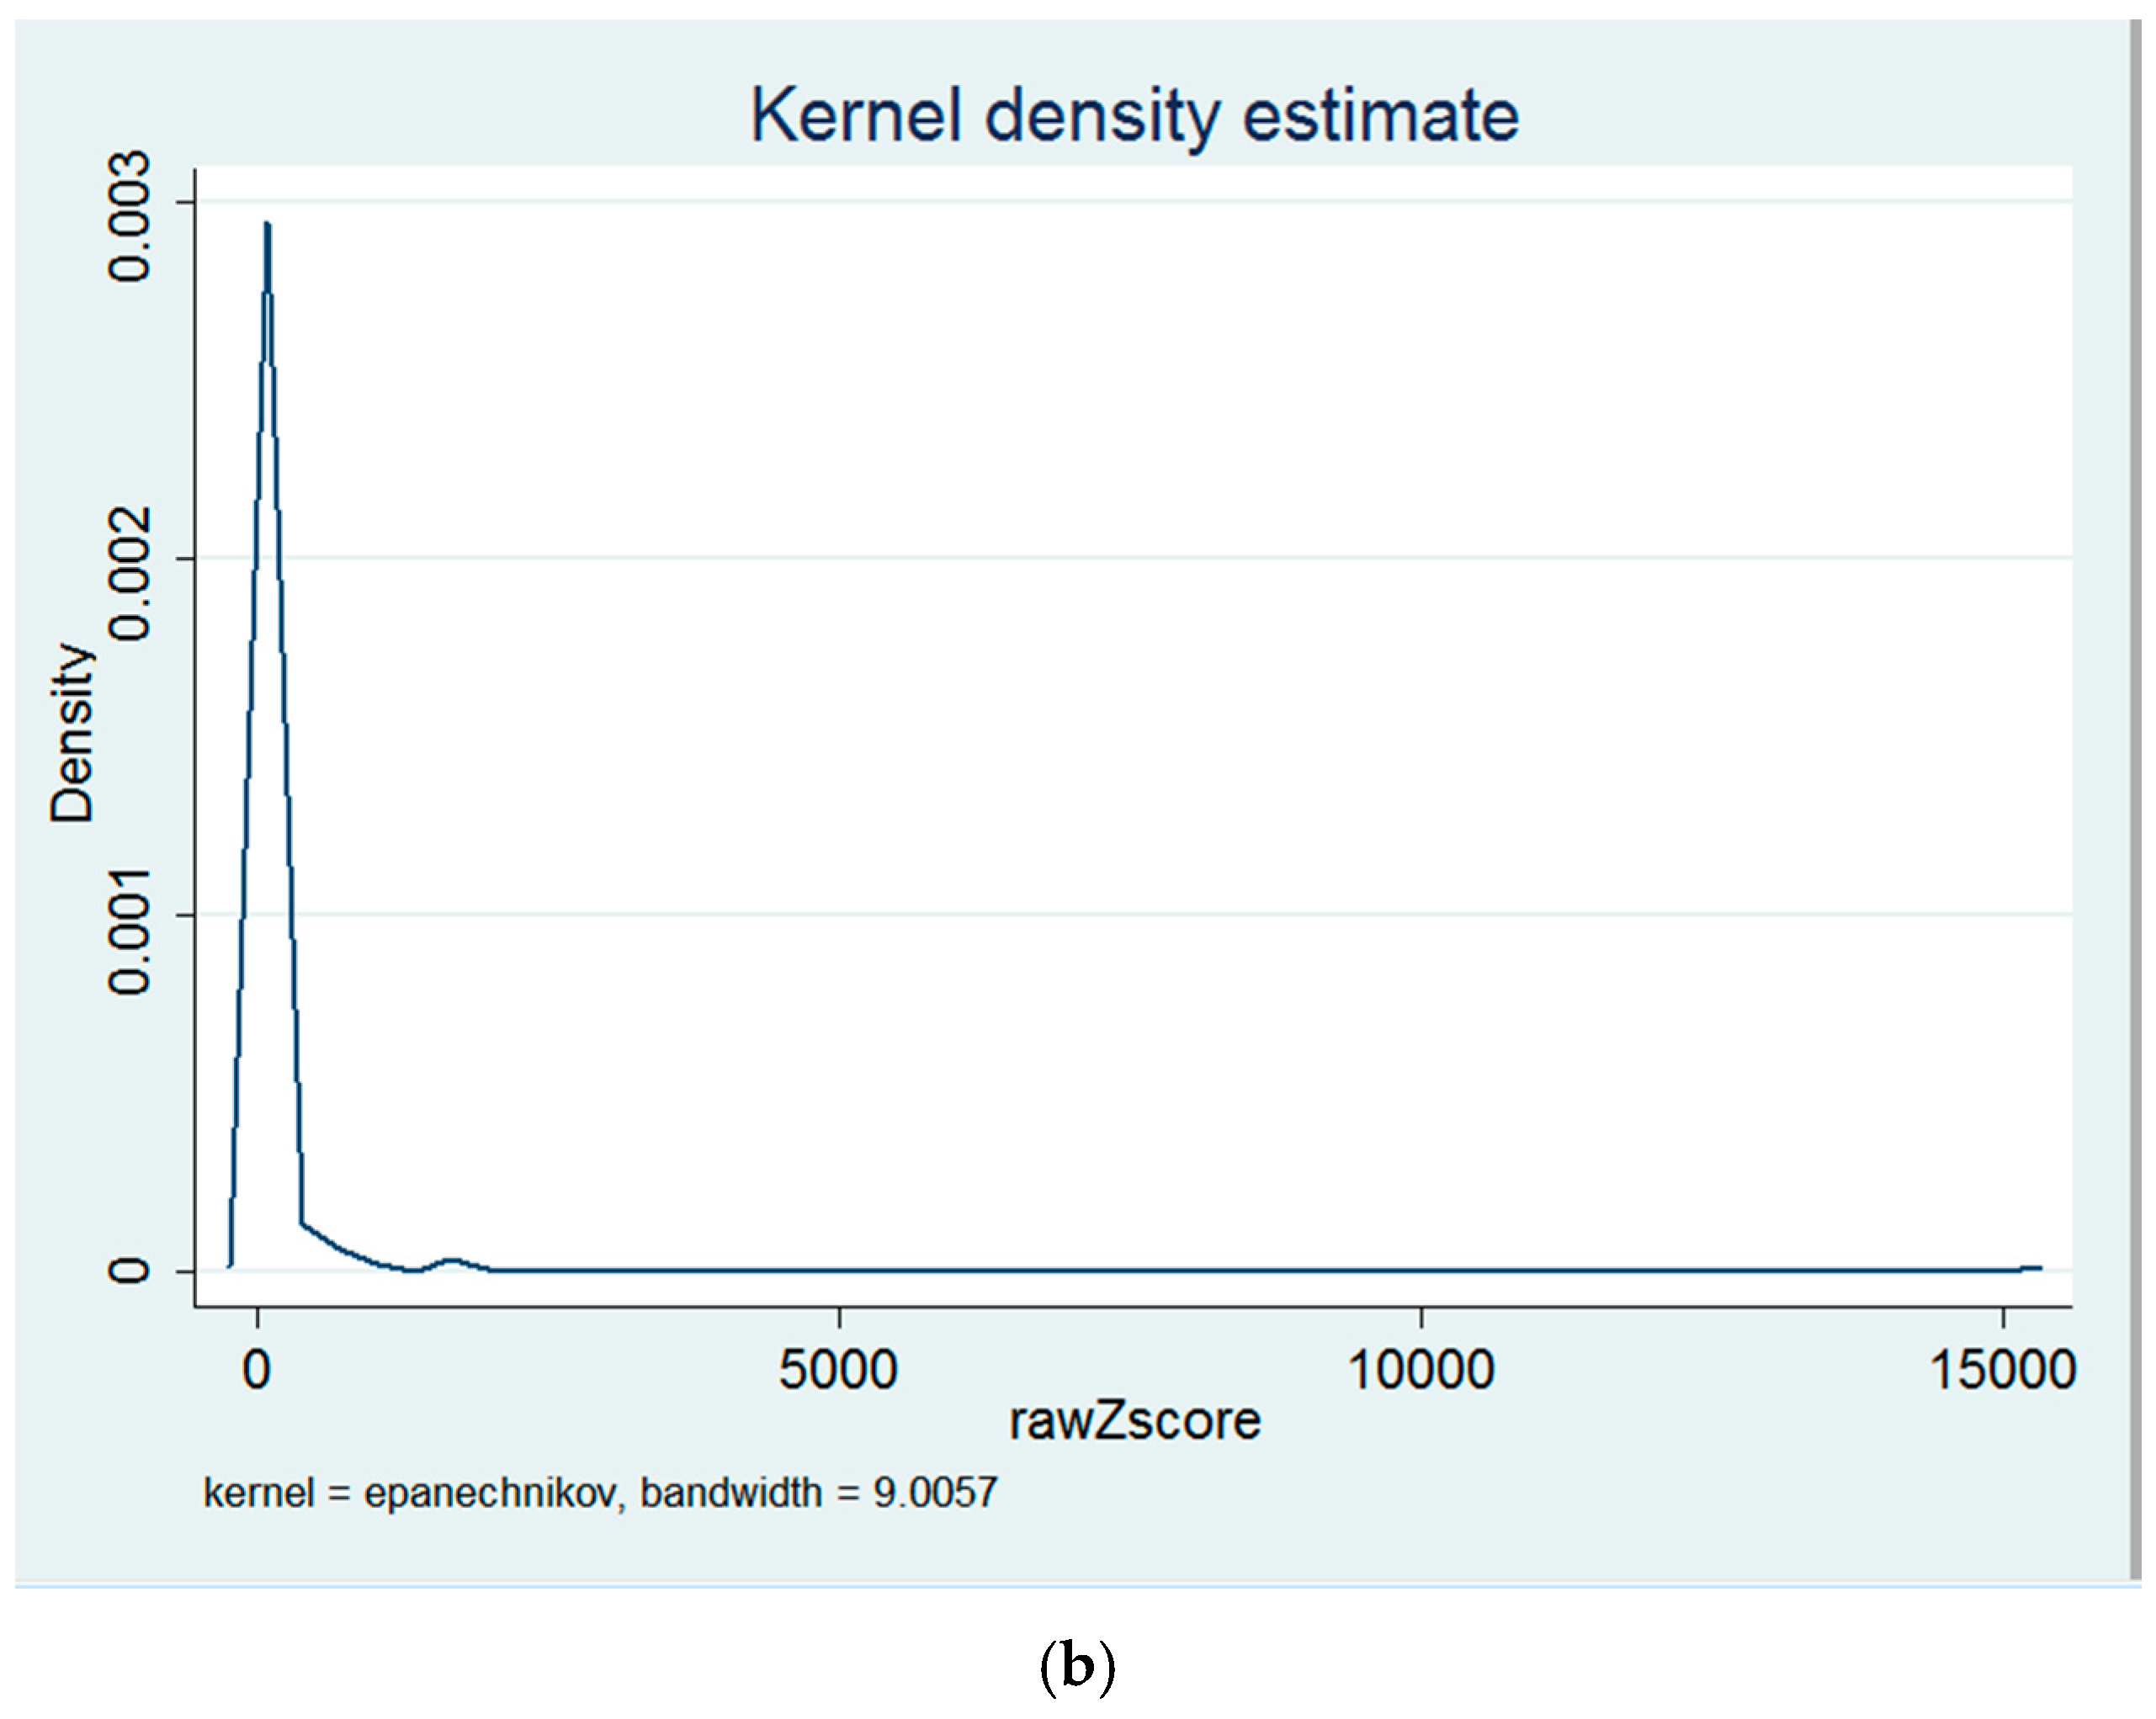
19] (pp. 485–512) all utilize the Z-score as a measure of bank risk. Given that bank insolvency occurs when losses exceed equity, the probability of insolvency can be expressed as prob (−ROA > CAR), where ROA is the return on assets and CAR is the capital asset ratio. If profits are normally distributed, the inverse probability of insolvency equals (ROA + CAR)/σ(ROA). The Z-score is monotonically associated with a bank’s stability, and a higher Z-score means a more stable bank. As shown in
Figure 1a,b, the raw Z-score is highly skewed, so the natural logarithm of the Z-score (hereafter Z-score) is used as the risk indicator.
The main sample is a cross-country database comprising 2093 commercial banks in 161 countries over the period 2004–2006, obtained from the BankScope database. ROA and CAR are calculated as the means for 2004–2006 and σ(ROA) is the standard deviation of ROA estimated over the same time period. As shown in
Table 1, the mean of the Z-score is 3.647, with a standard deviation of 1.324. These are similar to the values reported by Houston, Lin, Lin and Ma [
19] (pp. 485–512), who consider a longer period (average for 2000–2007) and report a mean Z-score of 3.240, with a standard deviation of 1.086. The fairly high standard deviation and the wide range of the Z-score shown by these statistics imply that there is a considerable amount of cross-sectional variation in the level of bank risk.
2.3. Social Capital
As mentioned above, the “trust” and “civic” indicators are derived from the responses to the World Values Survey (WVS) on trust and civic norms. The 2005 WVS used the following question to assess trust: “how much do you trust the people you meet for the first time?” Let the response “trust completely” be equal to 1, “somewhat” equal to 0.67, “not very much” equal to 0.33, and “not trust at all” equal to 0. The trust indicator is thus the average score of respondents in each nation, after excluding responses of “no response”. For trust, 73,322 observations from 51 countries are obtained. As Inglehart [
20] argues that some groups, such as city dwellers and better educated individuals, are oversampled in some countries, we follow Knack and Keefer [
10] (pp. 1251–1288) and use the weighted variable provided in the data to compute the country-level means. This gives a trust indicator covering 51 countries in 2005, with a mean of 0.394 and a standard deviation of 0.064. Larger values indicate higher levels of trust.
To create the indicator of civic norms, respondents select whether each of the following behaviours
- (1)
“Can always be justified, never be justified or something in between”;
- (2)
“Claiming government benefits which you are not entitled to”;
- (3)
“Avoiding a fare on public transport”;
- (4)
“Cheating on taxes if you have the chance”.
Respondents chose a number from 1 (never justifiable) to 10 (always justifiable). In order for the values to be positively related to civic cooperation, these scales are reversed and summed over the three items to create a civic indicator with a 30-point maximum. Totally, 75,766 observations from 54 countries are obtained. The civic indicator has a mean of 24.070 and a standard deviation of 1.219; again, larger values indicate higher levels of social capital.
By comparing the trust indicator with the results of another experiment conducted by Reader’s Digest, Knack and Keefer [
10] (pp. 1251–1288) argue that non-random samples, translation problems and discrepancies between professed attitudes and actual behaviour do not produce severe noise in the measure of trust. The experiment on trust involved “accidentally” dropping wallets containing an amount of cash and the address and phone number of the “owner” in 20 cities in 14 different Western European countries and 12 US cities. Given that the percentage of wallets returned with their contents intact in each country was highly correlated with trust at 0.67, these survey-based measures of social capital are reasonable.
Knack and Keefer [
10] (pp. 1251–1288) also argue that the relatively low correlation between trust related to the percentages of wallets returned with the contents and trust in family members shows that the measurement of trust in a country primarily captures “generalized” trust as opposed to “specific” trust placed in significant others, such as relatives and friends. As the aim here is to analyse the effect of country-level social capital (i.e., an indicator of generalized trust), rather than trust within a subgroup, the questions chosen are related to the level of trust in a person met for the first time, rather than in family or friends.
The standard deviation of the civic indicator is lower than that of trust. The reason for the low variation across countries may be that respondents are reluctant to admit behaviour such as claiming government benefits they are not entitled to, cheating on taxes and avoiding fares for public transport. As this problem may introduce measurement error into the civic construct, trust is used as the benchmark indicator, and civic is reported for robustness.
There are two advantages in using the data from 2005. First, these data show the extent of trust more precisely as the responses contain four different levels of trust rather than two as in other years. Second, the 2005 data are much more recent and cover more countries than the historical data widely used in previous literature. On the other hand, the data from BankScope only cover the period 1997–2013, limiting the sample of banks as a substantial amount of data on return on assets is missing for earlier years. Furthermore, it is not reasonable to assume that trust and civic norms are consistent in all countries, especially after major events such as the Asian financial crisis in 1997 and the Iraq War in 2003. Therefore, this study only tests the data for the period around 2005 and does not include any panel regression.
2.4. Macroeconomic and Bank-Level Controls
To control for the macroeconomic environment, the logarithm of gross domestic product (GDP) per capita and inflation rates are obtained from the World Development Indicators (WDI) database. For the legal system variable, we use the Worldwide Governance Indicators (WGI) database computed by Kaufmann, Kraay and Mastruzzi [
21] (pp. 2–103) and a database on bank supervision assembled by Barth, Caprio and Levine [
22] (pp. 1–431). The WGI database measures the quality of governance for approximately 200 countries, while the database computed by Barth, Caprio and Levine [
22] (pp. 1–431) covers the entry restrictions for new banks, the government ownership of banks and the restrictions on banks’ activities that hurt banking system performance. The Barth et al. database is based on a World Bank survey conducted in 152 countries over the period 1999–2007 using the value of year 2005.
In this paper, we employ bank-level controls such as bank size, the index of “too big to fail” and the ratio of loan loss reserves. According to Boyd and Runkle [
16] (pp. 47–67) and De Nicoló [
17] (pp. 197–215) study that bank size is an important factor which influences bank risk of failure. Scholars predict that large firms can get size-related diversification benefits, economies of scale and are less likely to fail than smaller ones. However, large-banks are more likely to fail since they are viewed as more likely to result in macroeconomic externalities. Therefore “too big to fail” is one indicator usually used as control variable to estimate bank risk. Moreover, banks with high loan loss provisioning exhibit more risk-shifting (Bushman and Williams [
23] (pp. 1–18)). Regarding banking market concentration, we examine the Cr4 index, which refers to the ratio of total deposits in the four largest banks to the total deposits within a given country.
Besides bank’s characteristics and market concentration, national regulation and macro-environment also affect the performance of banks and, of course, affect bank risk-taking as well. It is easy to understand, healthy and stable macroeconomic environment is good for bank to develop, so we conclude macroeconomic factors—inflation and GDP per capita—as macro-environment controls. Meanwhile, advanced legal system can limit bank to take risky asset and avoid contract violation, efficient social network will help bank to get true information about firms and make a smart decision. To assess the legal system, the official supervisory power, the control of corruption and regulatory quality are examined, and the level of the legal system is defined by the first principal component of these three.
3. Hypotheses
The main business of a commercial bank is deposit taking and loan providing. Such transactions are trust-sensitive and rely not only on the legal enforceability of contracts, but also on the trust between borrowers and lenders. Putnam, Leonardi and Nanetti [
24] (pp. 163–187) refer to social capital as the networks, norms and trust in one community or nation, implying that the trust between community members belongs to an important aspect of social capital. From this perspective, it may be inferred that social capital exerts the same influences on borrowers and lenders.
Social capital may increase the cost of contract violation for borrowers, reducing their likelihood of such violations and the risk borne by banks. If trust is an equilibrium outcome of a society (Coleman [
25] (pp. xvi–993); Spagnolo [
26] (pp. 1–25)), firms in areas with higher levels of social capital will make efforts to honour contracts as a result of the high cost of violation, as their operation relies to a considerable extent on social interactions. Thus, when a firm violates its contracts, it loses more than the legal penalties. On the other hand, if trust is a moral attitude ( Banfield and Banfield [
27] (pp. 1–192)) held by a firm’s staff, a firm will constrain its behaviour as a result of its staff’s moral stance. In countries with higher levels of social capital, CEOs and managers of firms learn to keep their promises because establishing moral norms represents a larger coefficient in their utility functions. As a result, banks face lower risks of contract violation by firms.
For lenders, higher social capital may reduce the cost of financial contracts, improve their profitability and help them avoid bankruptcy through more efficient cooperation. When the level of social capital in a group is sufficiently high, written contracts may become less important. A high level of social capital will reduce the cost of employing lawyers and the time spent on understanding complex contracts. As in the example given by Guiso, Sapienza and Zingales [
12] (pp. 526–556), Jewish diamond merchants in New York do business without written contracts because of the extremely high level of social capital in their community. In the financial industry, the costs of labour and time are extremely high. If banks can save on these costs when establishing contracts, they can reduce their interest rates and make their products less risky to firms and as a result, reduce the risk they bear. As high levels of social capital are associated with high levels of social interaction and cooperation, which supposedly lead people to be less selfish and more public-spirited, repeated interactions result in lower levels of economic instability (Rodrik [
14] (pp. 526–556)). Thus, in areas with higher levels of social capital, inter-bank and bank–firm cooperation is expected to be more efficient, and increasing the profitability of banks and reducing the probability of bank insolvency.
Houston, Lin, Lin and Ma [
19] (pp. 485–512) claim that the sharing of information increases bank profitability, contributes to economic growth and reduces bank risk taking. Social capital may increase the quantity and quality of information and therefore help banks analyse the performance of firms and solve the problem of information asymmetry, which is alleviated in areas with high levels of social interaction as information circulates more frequently and freely. Lin [
28] (pp. 28–51) suggests that social ties provide useful information concerning opportunities and choices in the usually imperfectly competitive markets as high levels of social capital help bank managers make the right decisions by knowing the firms better. From this perspective, bank risks should be higher in countries with lower levels of social capital. Accordingly, we make the following hypothesis:
Hypothesis 1:
In countries with higher levels of social capital, bank risk taking is lower.
However, social capital may also have negative impacts, as high levels of trust may encourage lenders to provide capital to risky borrowers. Overly trusting shareholders, for example, might exert an undue influence. Based on this argument, the second hypothesis is as follows:
Hypothesis 2:
Social capital has negative effects as well as positive effects because people are overconfident or overly trusting.
Social capital may influence bank risk taking by influencing behaviour of both lenders and borrowers. It is known that legal systems influence financial markets (La Porta, López de Silanes, Shleifer, and Vishny [
6] (pp. 1113–1155)). In all economies, a sound legal system guarantees the enforcement of contracts and the incentives for loan activities by increasing the cost of contract violation for borrowers. Thus, the legal system is suggested to work in a similar way to social capital. On this basis, the following hypothesis is developed:
Hypothesis 3:
A strong legal system strengthens the effects of social capital on bank risk taking.
A person’s behaviour is influenced by the level of social capital in the area where he or she lives, instead of in the area where he or she was born (Guiso, Sapienza and Zingales [
12] (pp. 526–556)). Coleman [
25] (pp. xvi–993) considers trust as an equilibrium outcome of a society whether an individual chooses to fulfil his promise depends on the punishment for breaking the promise, and the punishment is determined by the level of social interaction in his country of residence. Banfield and Banfield [
27] (pp. 1–192) also point out that trust is a moral attitude imprinted with education; the level of social capital in the place where an individual grew up has a stronger impact on the individual than the level of social capital of the place of birth. From this perspective, it is possible to infer that the behaviours of CEOs and managers of firms reflect the level of social capital of the place where the firms are located, rather than where the major shareholders of the firm from. Meanwhile, behaviour of firms and banks reflect their staff’s moral attitudes. Although the moral attitudes of banks’ major shareholders also influence the behaviour of a bank, the impacts are indirect and not as strong as those from the majority of staff. This leads to the fourth and final hypothesis:
Hypothesis 4:
Bank risk taking is not affected as strongly by the level of social capital in the country of residence of major shareholders, as by the level of social capital in the countries in which the banks operate.
4. Results
4.1. Social Capital and Bank Risk Taking
To test Hypothesis 1, a benchmark regression model was estimated:
where subscripts
i and
j indicate the bank and country, respectively.
Zij is a log Z-score; α is the constant; εij is the random disturbance term;
X1 refers to the key variables of interest: trust and civic;
X2 is a vector of bank-level control variables, including bank size, too-big-to-fail and the rate of loan loss reserves (LLR); and
X3 is a vector of country-level control variables, including market concentration, inflation, log GDP per capita and the legal system (official supervisory power, control of corruption and regulatory quality). In addition, Model with square term of trust are tested as well. The square term of trust is insignificant, implying the relation is not U-shaped.
Table 4 and
Table 5 present the results for the relationship between social capital and bank risk taking. These two tables show four model specifications: Model 1 is a simple regression model between bank risk taking and social capital without the inclusion of any control variables; in Models 2–4, groups of bank-level and country-level control variables are incorporated one by one. Regardless of which model is considered, the main results remain unchanged.
Table 2a indicates a significantly positive impact of trust on the degree Z-score, implying a negative impact on bank risk taking. Moreover, the results still hold even when replacing trust with the civic variable to proxy the levels of social capital (see
Table 5). However, the impact of civic norms on the degree of bank risk taking is relatively small compared to that of trust, which may be due to the different measurement ranges of the indicators. In sum, the empirical results support the main hypothesis: social capital exerts a negative and significant effect on bank risk taking, thus reducing the probability of bank insolvency.
A banking crisis occurs when a large number of bank clients withdraw their deposits because of the strong belief that banks may fail and become bankrupt. Based on the empirical results, social capital is found to lower the degree of bank risk taking. Thus, countries with higher levels of social capital are less likely to experience banking crises as the higher degree of interpersonal trust decreases the probability of banks runs. Our result provides policy implications for governments: bank crises can be avoided by improving the level of social capital in a country.
Subsample Analysis: Excluding Banks in the United States
Subsample robustness tests are conducted to prevent some large banks in a few key countries from exerting an overly strong influence on the results. Given that the US has the largest number of banks in the sample, we follow Houston, Lin, Lin and Ma [
19] (pp. 485–512) and re-estimate the models after removing the data from US banks.
Table 6 shows the impact of trust and civic norms on bank risk taking, excluding the data for US banks, and additional robustness tests are estimated and reported in
Table A3 in
Appendix A.
Consistent with the benchmark model, the effects of trust and civic norms on bank risk taking are significantly positive, even after excluding the banks in the US. Higher levels of trust or strong civic norms lead to less bank risk taking.
4.2. Channels: How Does Social Capital Work?
As mentioned above, social capital exerts positive effects on bank risk taking, but the effects can also be negative. In this section, we discuss both these positive and negative effects.
To gain a clearer view of how social capital affects bank risk taking both positively and negatively, three components of the Z-score (i.e., ROA, CAR and σ(ROA)) are used as separate dependent variables.
In
Table 7, it can be observed that social capital tends to reduce bank risk taking, mainly by reducing the standard deviation of ROA. Both trust coefficient and the civic coefficient are significantly negative, with the trust coefficient strongly significant at the 1% level. The lower standard deviation of ROA refers to higher stability of banks. However, trust seems to reduce the values for both ROA and CAR, indicating that negative effects do exist and proving Hypothesis 2. Banks prefer to hold less capital and more assets in countries with higher levels of trust. Additionally, low CAR increases the probability of bank insolvency. In countries with higher levels of social capital, the lower ROA of banks indicates poorer performance, and also implies bank instability.
To further test Hypothesis 2, the coefficients of trust are compared to those of civic. As the overconfidence problem is attributed mainly to high levels of trust but not strong civic norms, civic should not have significantly negative effects, which is proven by our test. Banks are over-trusting lenders in countries with higher levels of social capital, and therefore they tend to reduce CAR and lend money to unqualified or risky borrowers. Strong civic norms do not significantly decrease the CAR or ROA of banks but do stabilize ROA.
4.3. The Effects of the Legal System on Social Capital
Here, we consider whether the legal system improves or hinders the effects of social capital on bank risk taking. The interaction terms “trust_low pol” and “civic_low pol” are added to the model; “low pol” is a dummy variable equal to 1 if the level of the legal system is lower than the average of the sample. To define the legal system, a variable “pol” is created, which is the first principal component of the three political variables: “official supervisory power”, “control of corruption” and “regulatory quality”.
From
Table 8, it is apparent that the effects of both the trust and civic variables are lower in countries with weaker legal systems than in countries with stronger legal systems, and that these differences are significant at the 5% level. Therefore, it can be inferred that the legal system does not hinder but promotes the positive effects of social capital on bank risk taking, which is consistent with Hypothesis 3.
4.4. The Effects of Social Capital in Shareholders’ Countries
To test the hypothesis that bank risk taking is affected mainly by the levels of social capital in the shareholders’ country of domicile/residence rather than the country in which the bank is located (registered), the levels of social capital in the countries of residence of the largest shareholders are examined.
Employing data on the countries of residence of the largest shareholders of 1831 banks from the BankScope database, the models are re-estimated and the results are presented in
Table 9. The regression coefficients of trust and civic norms for the largest shareholder’s country of residence are lower than those for the country of registration. This shows that the levels of social capital in the major shareholders’ countries of residence do not affect the behaviour of banks as strongly as those in the countries in which the banks operate, supporting Hypothesis 4. However, it is interesting to note that the impact of trust in the major shareholder’s country on bank risk taking becomes negative.
This may explain why some well-known international banks are not able to perform better than domestic banks in developing countries: neither the high social capital of the largest shareholder’s country nor the low social capital of the company’s country of registration leads to stable performance. The strategy of lending set by major shareholders may be too loose to control bank risk taking in countries with lower levels of social capital.
5. Conclusions
This paper analyses the impacts of social capital on bank risk taking. By using indicators of trust and civic norms from WVS data, it is found that the levels of social capital present in the bank shareholders’ countries of residence exert a positive impact on bank stability. Furthermore, the coefficients of trust and civic norms are still significant after eliminating US data. The findings suggest that high levels of social capital in the countries of residence tend to reduce the probability of bank insolvency and increase the stability of the banking industry. However, high levels of trust also bring problems, as being overly trusting may exert a negative influence on the return on assets and the capital-asset ratio. Overall, the negative effects are dominated by the positive ones.
Second, the results of the empirical analysis show that the impacts of trust on bank risk taking are stronger in countries with stronger legal systems as these countries are more capable of regulating the behaviour of their citizens and firms. As constructing a better institutional environment and building a society with a high level of social capital and a well-developed political/legal system help avoid bank crises, it is suggested that governments should pay more attention to build up social capital when working on economic development of the country.
Finally, our study examines the relationship between the levels of social capital in each bank’s largest shareholder’s country and the risk faced by banks. The empirical results in this paper support our prediction that the shareholder’s country of residence exerts a weaker and negative effect, suggesting that bank strategy should be based predominantly on the social environment of the countries in which branches are located.
Our findings have important implications for policy makers and bank managers. Policy makers should improve the level of domestic social capital as well as the legal system. For bank managers, they should be cautious in approving loans despite the high level of social capital in the country.
There are some limitations in our research. First, people’s trust may be the result not only of the social capital present in their community, but also of prompt law enforcement. Using trust as the main indicator of social capital may be problematic. Meanwhile, since the indicator of social capital is collected by interview, the answers are influenced by the respondents’ definition of trust. Previous literature uses the surveys of 1990 and 1981, where the answer for the question about trust only has the yes-no choice. Our study has improved the problem since we use the 2005 survey with information on four degrees of trust. Second, it is difficult to test the real degree of trustworthiness of the respondent if the person is not trustworthy. Third, it is not measured on the entire population, so there may be some sampling error. Fourth, the civic indicator is based on three behavioural questions that potentially encounter acquiescence bias by the respondents who answer the questions, implying that the responses about civic norms may not be totally reliable. Guiso, Sapienza and Zingales [
12] (pp. 526–556) focus on other measures of social capital: voter turnout for referenda and blood donations. However, these two measures are not suitable for cross-country test.


