1. Introduction
The Brexit referendum and the U.S. presidential election were two very important events of 2016, both with unanticipated outcomes. Stock and foreign exchange markets in different countries showed large volatility as soon as the news of the results of the referendum and election unfolded. In this paper, we analyse the response of Japan’s foreign exchange and stock markets to the outcomes of the Brexit referendum and the U.S. presidential election. We estimate the changes in returns of the daily exchange rates of the yen (JPY), the daily closing price index of the Nikkei and the dynamic conditional correlation (DCC) coefficients between the JPY and the Nikkei caused by both events.
The information about comovement between the financial markets is of great importance for national and international investors. Bollerslev’s generalised autoregressive conditionally heteroskedastic (GARCH) model (
Bollerslev 1986)—a natural generalisation of the autoregressive conditional heteroskedastic process introduced in (
Engle 1982)—is an appropriate and widely used tool for analysing time-varying interdependence between financial markets. Different types of GARCH models have been used to analyse the dynamic interdependence of financial markets and the impact of a variety of factors on financial markets and their comovements. In particular, the impact of international economic changes and financial crises (
Karfakis and Panagiotidis 2015;
Chung and Jang 2000;
Agren 2006), political changes and conflicts (
Lin and Wang 2005;
Hanabusa 2010), and natural disasters (
Hanabusa 2010;
Wang and Kutan 2013) on the financial markets of Japan have been studied.
(
Karfakis and Panagiotidis 2015) examined the effects of global monetary policy and the Greek debt crisis on the DCC between exchange rate returns of the USD and the JPY. The study found that the DCC had sharply increased during the period after the collapse of Lehman Brothers. (
Chung and Jang 2000) analysed the impact of the Asian financial crises of 1997 on the relationship between the exchange rate returns of the Korean Republic Won (KRW) and the JPY. The research demonstrated changes in the relationship between the exchange rates before and after the crises. (
Agren 2006) investigated the impact of oil price volatility on the stock markets of Japan, Norway, Sweden, the United Kingdom and the United States. The study found strong evidence of volatility spillover for all stock markets, excluding Sweden.
(
Lin and Wang 2005) investigated the impact of political changes (in Japan) on the Nikkei’s returns and volatilities. Their empirical findings showed that the transition of the ruling party did not have a crucial effect. (
Hanabusa 2010) assessed the effects of foreign disasters such as the 11 September terrorist attacks, the Iraq War and Hurricane Katrina on stock prices of the Japanese petroleum industry. The empirical results of the research revealed an increase in the stock prices after the 11 September terrorist attacks, but the Iraq War and Hurricane Katrina did not have a significant impact. (
Wang and Kutan 2013) investigated the wealth and risk effects of natural disasters on the composite stock markets of Japan and the United States. The research findings showed no wealth effects on the composite stock markets, but a significant wealth effect in the U.S. and Japan insurance sectors.
In this paper, we used a DCC bivariate GARCH model following the estimations proposed by (
Engle and Sheppard 2001) and (
Engle 2002). The derived results highlight Japan’s stock and foreign exchange market response to unexpected political and economic changes that have a significant global impact.
2. Methodology
We estimated the parameters of a DCC bivariate GARCH model following estimations by (
Engle and Sheppard 2001) and (
Engle 2002). First, we estimated univariate GARCH models and then estimated the parameters of the dynamic correlation. The proposed model assumes a covariance matrix of the form
where
is the
k ×
k diagonal matrix of time-varying standard deviations from univariate GARCH models with
on the
i-th diagonal.
is the time-varying correlation matrix. The elements of
are proposed to be written as
where
i = 1, 2, …,
k and the following restrictions are imposed:
The residuals used in Equation (2) are derived from estimation of the vector autoregression (VAR) models of
The parameters of Equations (2) and (3) (M, P, Q) are determined based on a likelihood ratio (LR) test, the Akaike information criterion (AIC) and the Schwarz information criterion (SIC).
The dynamic correlation structure is proposed as
where
is the unconditional covariance of the standardised residuals from the previous estimations. is a diagonal matrix of the square root of the diagonal elements of . In addition, is a vector of standardised residuals, and and are parameters of the dynamics of conditional quasi-correlation. Finally, and are non-negative and satisfy the condition of .
3. Empirical Results
3.1. Changes in Returns
The difference in the logarithmic daily representative exchange rate of the JPY and the closing price index of the Nikkei are used in estimation. The observation period comprises 9 February 2016, to 24 March 2017. JPY exchange rates are as reported by the Bank of Japan, and the data source for the Nikkei price index is Google Finance. The whole period includes a total of 276 observations, with 92 observations before and after the Brexit referendum and the United States presidential election. Weekends and holidays were omitted.
Table 1 presents descriptive statistics for the data. The mean values for JPY returns show that the returns had a decreasing trend in the first and second periods and an increasing trend in the third period. Nikkei’s returns had a decreasing trend in the first period and an increasing trend in the second and third periods. Standard deviation values show the relatively higher instability of JPY returns in the first and third periods. Nikkei returns were relatively unstable in the first and second periods. Skewness, kurtosis and the Jarque-Bera test demonstrated that the returns are not normally distributed. The augmented Dickey-Fuller unit root (ADF) test (
Dickey and Fuller 1979,
1981) proved that the return series were stationary. The descriptive statistics confirmed that the return series are appropriate to be used in a GARCH-type model.
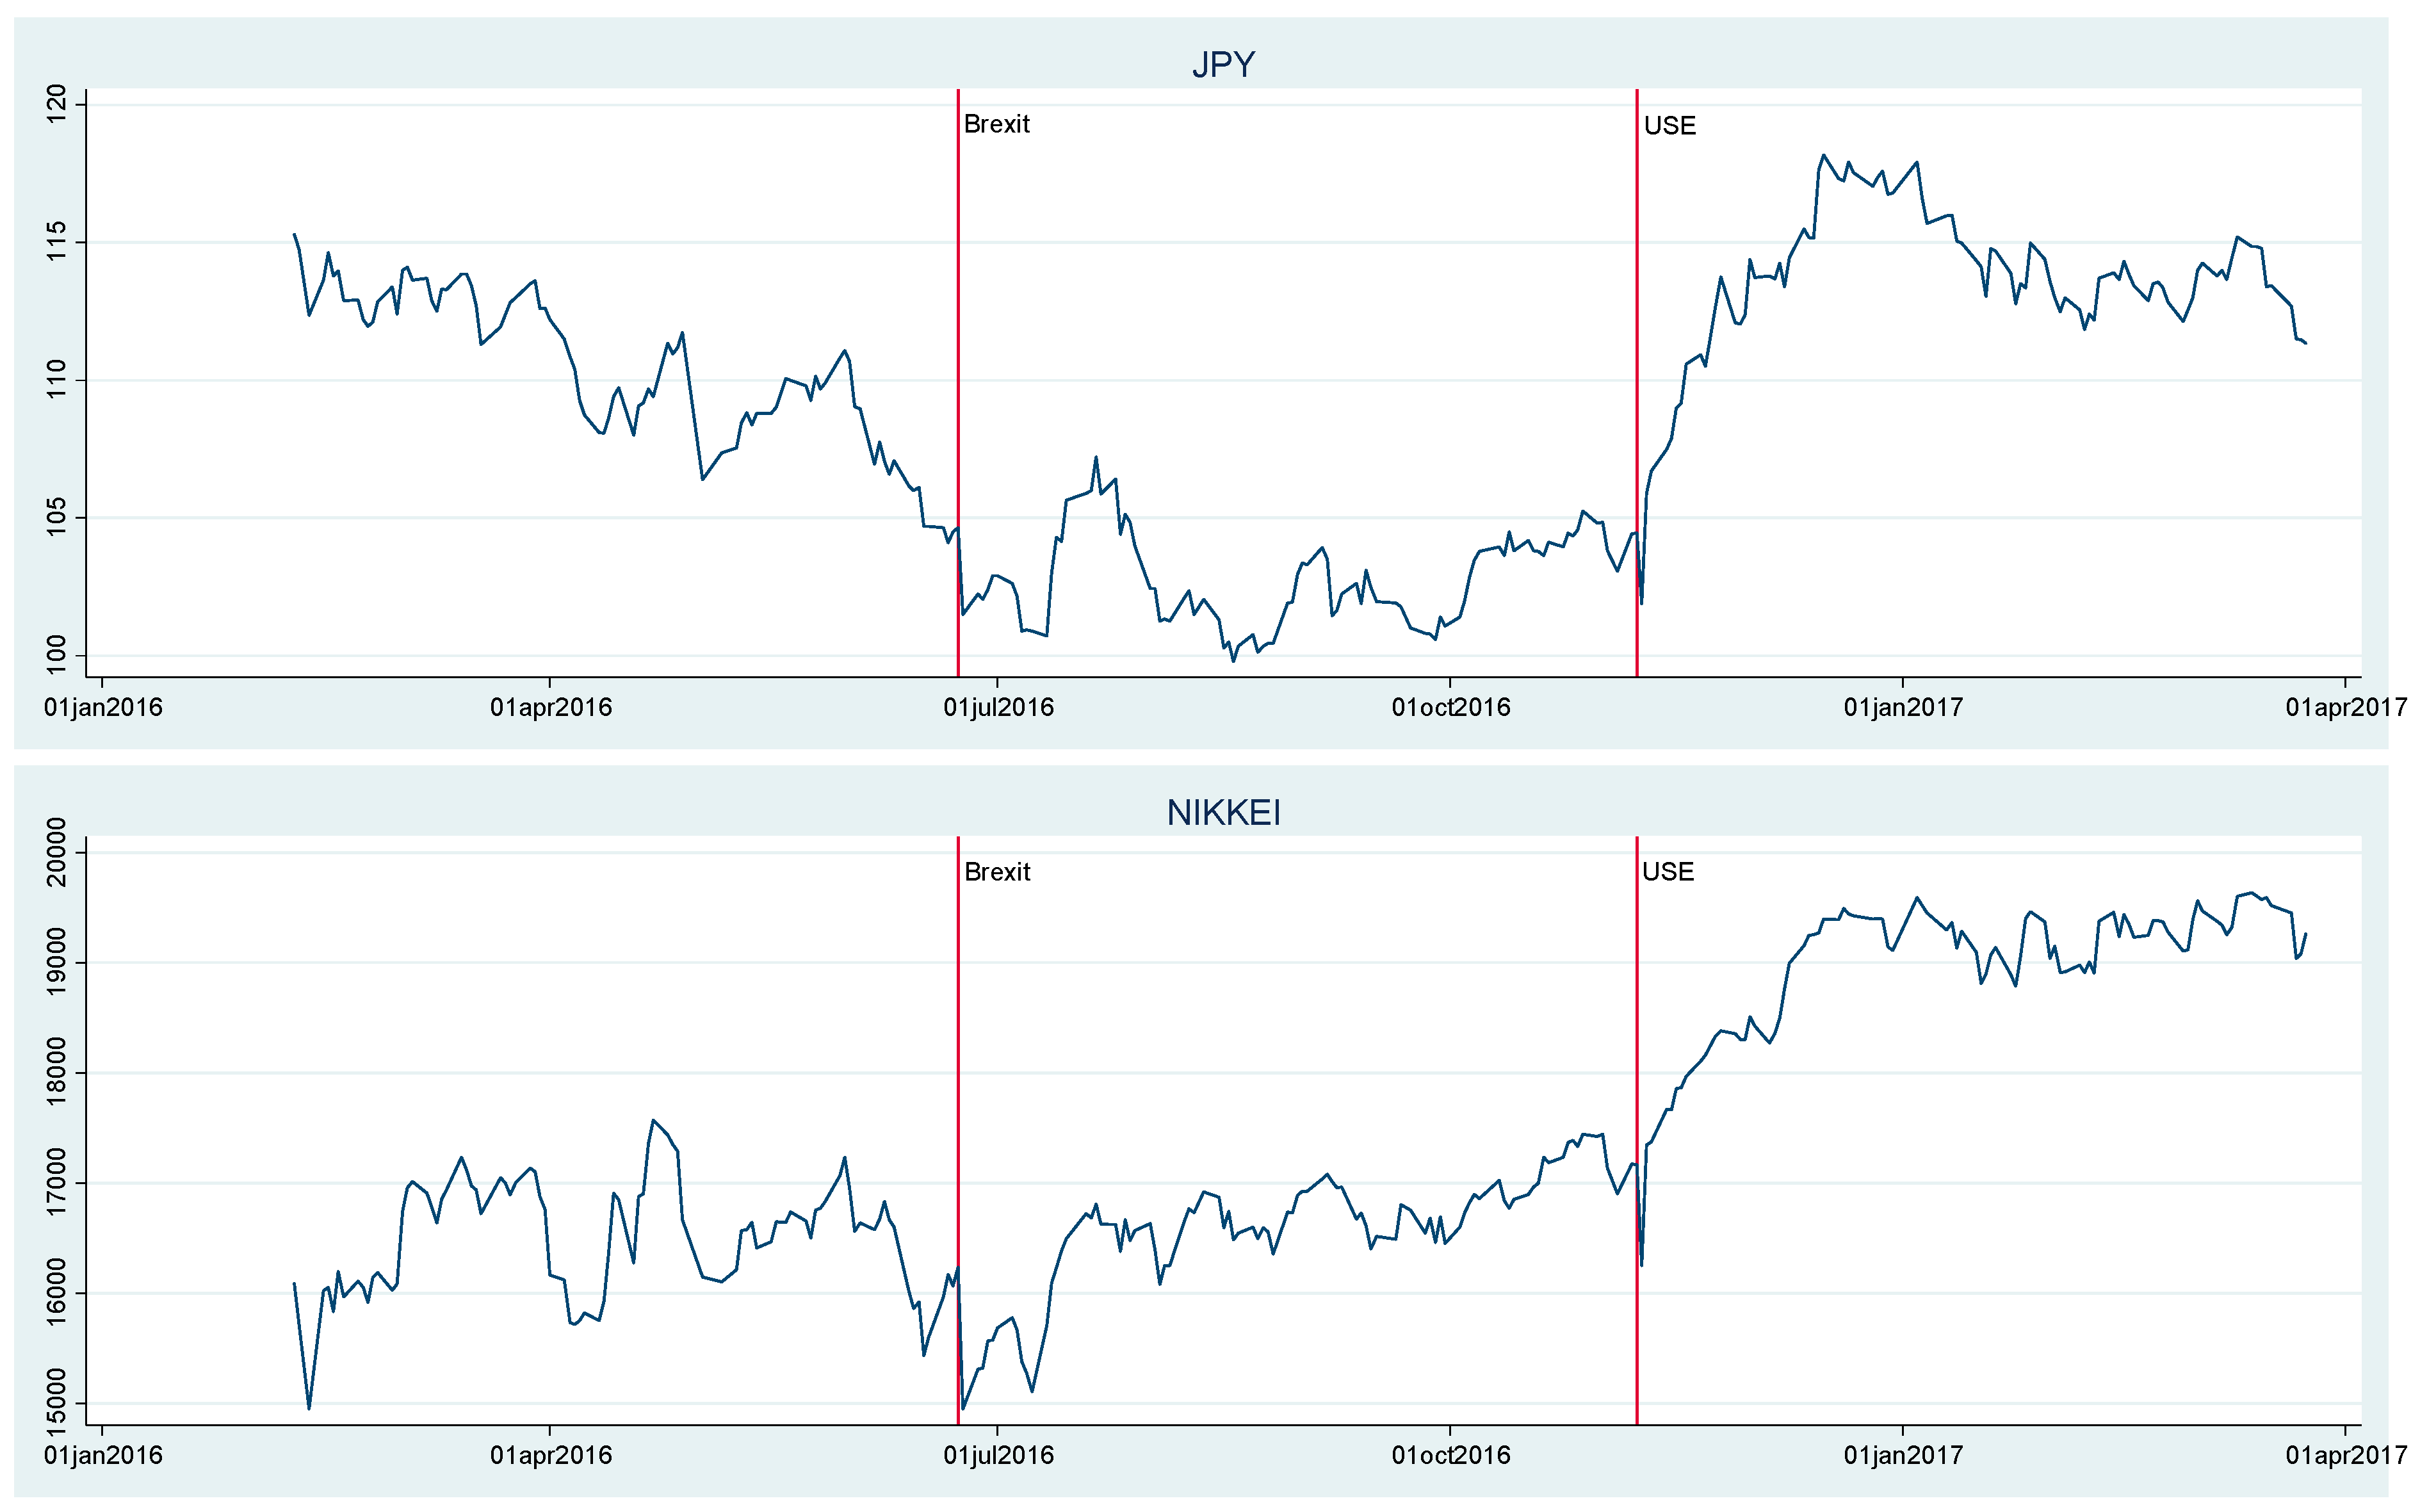
Figure 1 illustrates the daily representative exchange rate of the JPY and the daily closing price index of the Nikkei. The vertical reference lines mark the days of the Brexit referendum (Brexit) and the United States presidential election (USE). The figure clearly demonstrates that the JPY exchange rate and the Nikkei price index suddenly changed in the first days following each event. Furthermore, the shapes of the time series seem different in each period.
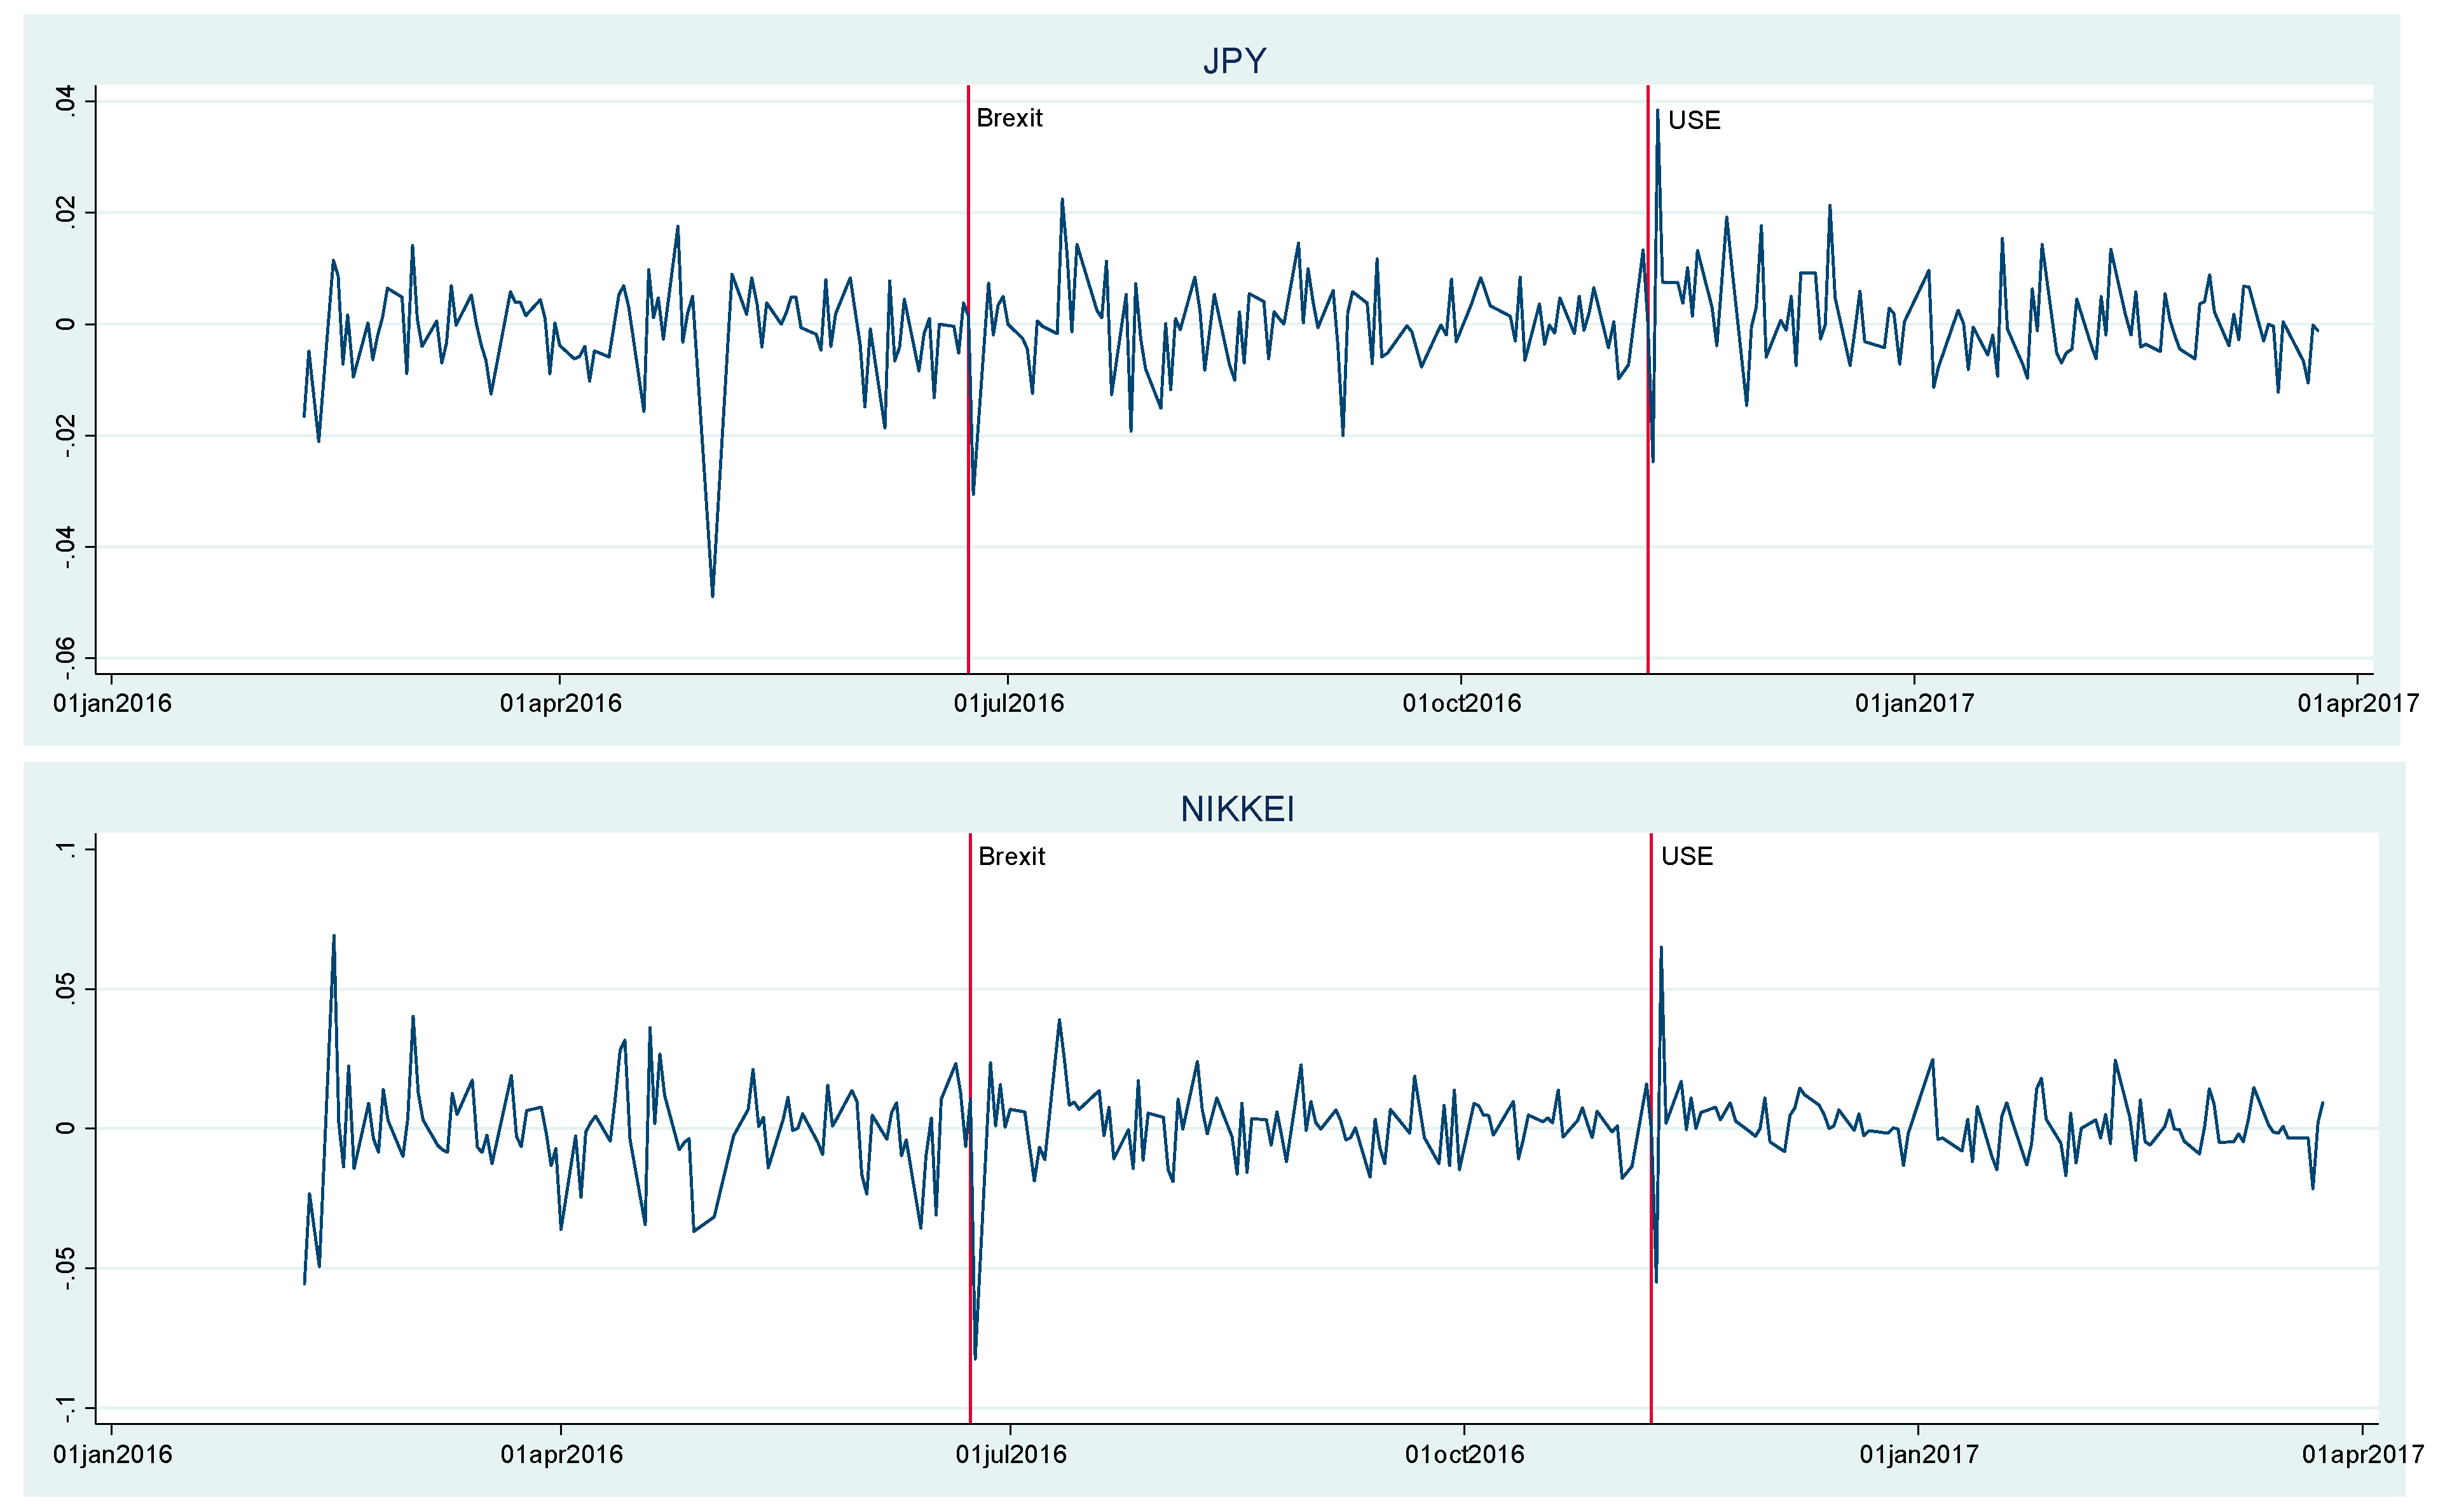
Figure 2 illustrates the logarithmic returns of the JPY daily exchange rate and the Nikkei closing price index. The vertical reference lines mark the days of the Brexit referendum and the United States presidential election. The returns clearly demonstrate instability in the returns of the JPY and the Nikkei in the days following the referendum and election. Moreover, the returns seem different for each period. The difference in the returns before and after each event could be considered as the effect of the Brexit referendum and the United States presidential election, or as the response of the exchange rate and stock price to information or news about the results of the referendum and election.
We used one sample
t-test to estimate how the means of the returns were different before and after each event. The estimations were done for a week (degree of freedom is 4), two weeks (degree of freedom is 9), three weeks (degree of freedom is 14), one month (degree of freedom is 19), two months (degree of freedom is 39), three months (degree of freedom is 59), four months (degree of freedom is 79) and for each period (degree of freedom is 91) before and after each event. The derived results are presented in
Table 2, with the first column showing the degree of freedom. For example, a degree of freedom of 4 means five days before and five days after the event were tested using one sample
t-test. As weekends were omitted, five days equate to a week in our estimations. The second, third, sixth and seventh columns show the mean of the returns for a given number of days before and after each event. The fourth and eighth columns show the difference in the means of returns calculated as the mean after minus the mean before the event. The fifth and ninth columns show the
t-value for one sample
t-test.
The mean of returns of the JPY and the Nikkei for the week after the referendum was different (statistically significant at 10% and 5% significance levels) from the mean of the JPY and Nikkei returns for the week before the referendum. The mean of the returns decreased significantly within a week after the Brexit referendum. The mean of the returns decreased within two weeks after the Brexit referendum, too (although the difference in the mean is not statistically significant). For periods longer than two weeks, the mean of the returns after the Brexit referendum was higher than the mean before the referendum. The difference is only statistically significant (at a 10% significance level) for JPY returns for a month before and after the Brexit referendum.
Comparison of JPY and Nikkei returns from before and after the U.S. presidential election shows that the means of the returns were higher after the election compared to the means of the returns before the election. The difference in the means of returns of the JPY for two weeks, three weeks, a month and two months before and after the election is statistically significant (at 1% to 5% significance levels). The differences in the means of the Nikkei returns for two weeks and two months before and after the election are statistically significant at the 10% significance level.
3.2. Changes in DCC Coefficients
Changes in the exchange rate of the JPY and the price index of the Nikkei could cause a change in their DCC coefficients. We used a DCC bivariate GARCH model to estimate the DCC coefficients between the JPY and the Nikkei.
Table 3 presents the estimation results.
The impact of the previous day’s returns on the present day’s mean and the impact of the previous day’s information and variance on the present day’s variance were not statistically significant for the period under estimation.
The values of
ω,
α,
β,
and
satisfy the restrictions outlined in the Methodology section. The Ljung-Box
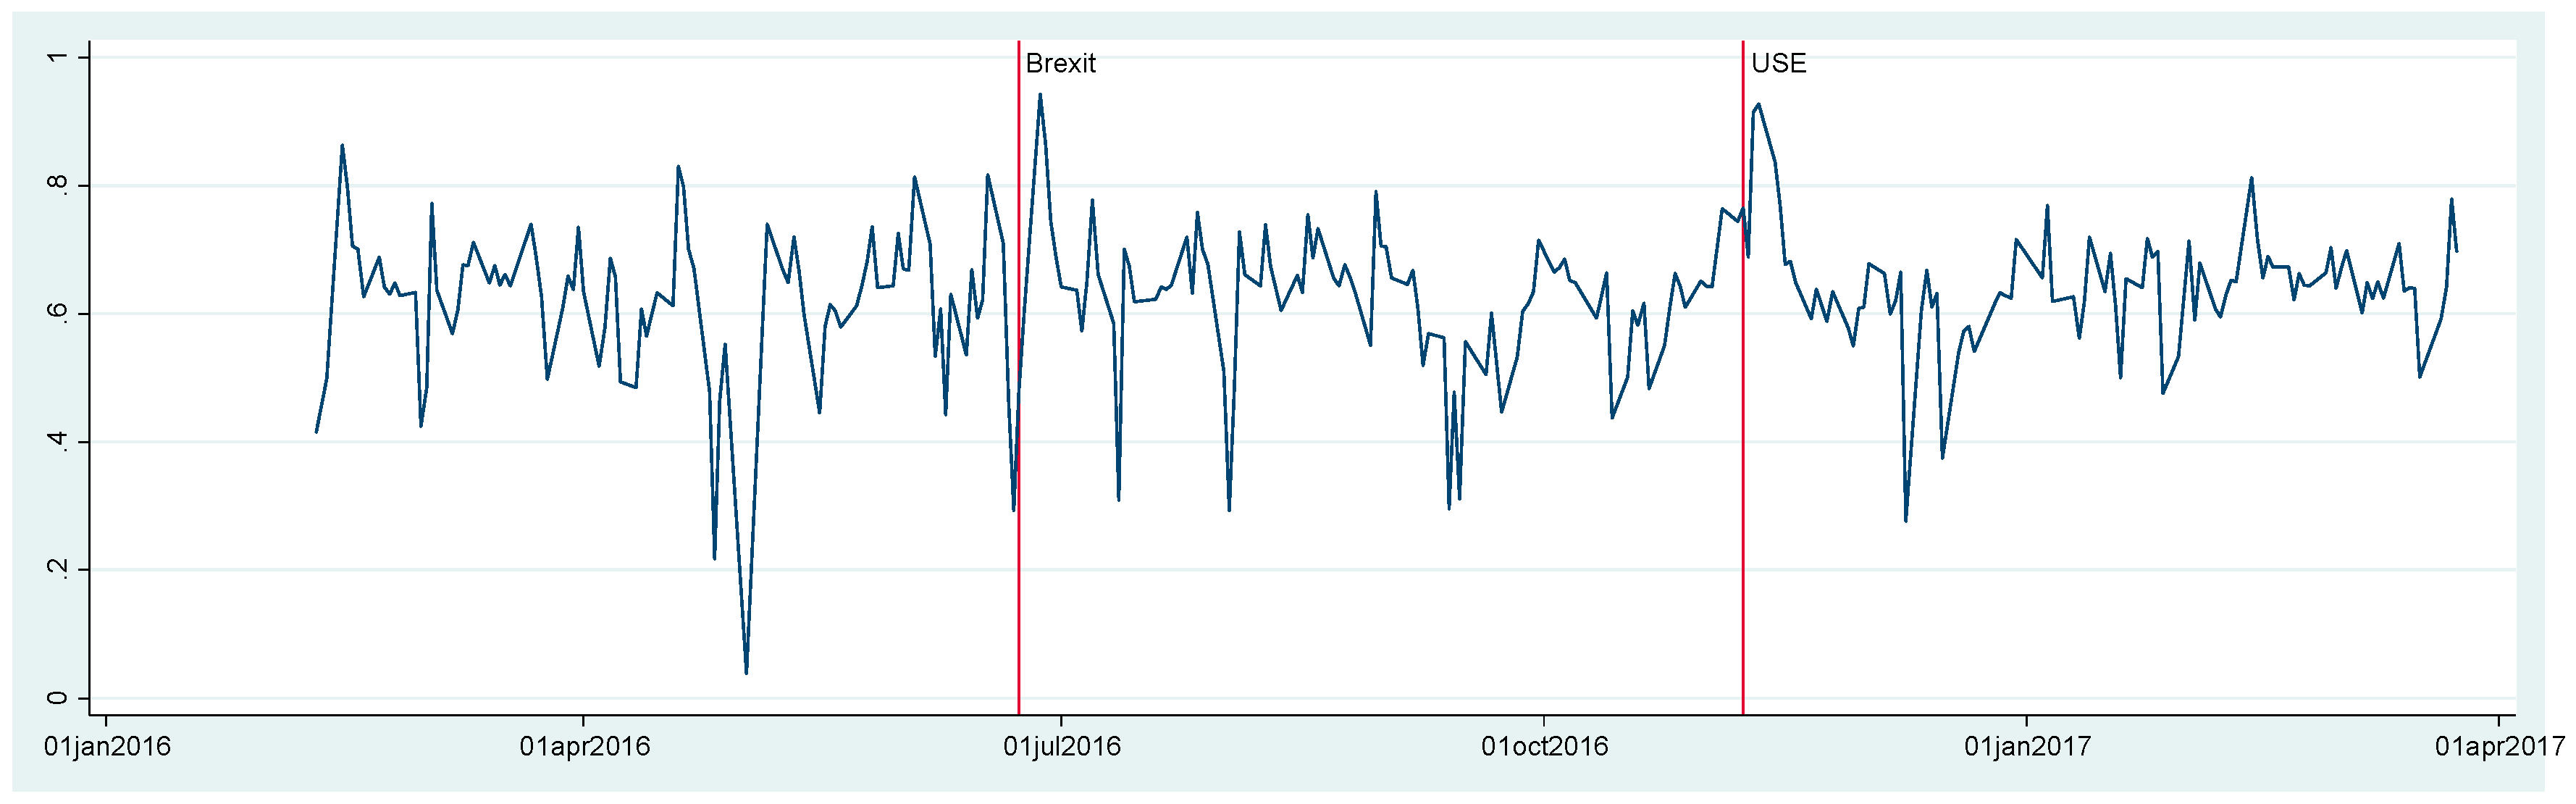
Q statistic states that there is no autocorrelation up to the order of 10 for standardised residuals and squared values of standardised residuals. Variances and co-variances derived from estimation of the mean and variance (Equations (2) and (3)) were used in the calculation of the DCC coefficients, and the coefficients are depicted in
Figure 3. It seems the coefficients changed to a certain degree in the periods after the Brexit referendum and the U.S. presidential election. Using one sample
t-test, we were able to precisely compare the difference in means of the DCC coefficients for a different number of days before and after each event.
Table 4 presents the results of one sample
t-test for the difference in the means of DCC coefficients before and after each event for a different number of days. The means after each event were higher compared to the mean before that event. The difference in the means of DCC coefficients was statistically significant for a week, two weeks and three weeks before and after each event. The difference in the means of DCC coefficients was more significant (at 1% to 5% significance levels) before and after the election than before and after the referendum (at 5% to 10% significance levels). The difference in the means of the coefficients for two months before and two months after each event was statistically significant at the 1% significance level. The difference in the means of DCC coefficients for a month and four months before and after the presidential elections was statistically significant at the 1% to 5% significance levels.
Alternatively, we tested the interdependence between DCC coefficients and dummy variables corresponding to 39 days after the Brexit and 79 days after the U.S. presidential election.
1 The effect of dummy variables on DCC coefficients was statistically significant (at the 5% to 10% significance levels) and confirmed that the estimation results presented in
Table 4 are appropriate.
4. Conclusions
We analysed the response of Japan’s financial markets to the Brexit referendum and the U.S. presidential election of 2016. The empirical findings showed a significant change in the daily logarithmic returns of exchange rates of the JPY and the closing price index of the Nikkei, as well as their time-varying comovement (DCC) after both events. In general, the impact of the U.S. elections on financial markets and their dynamic correlation was stronger than the impact of the Brexit referendum. The empirical findings suggest that political events with unexpected outcomes that influence the expectations and behaviour of investors significantly affect Japan’s financial markets and their dynamic interdependence.
The findings of this paper will have vital importance for investment portfolio optimization and risk management in the context of Japanese financial markets with respect to international political events.
Author Contributions
Conceptualization: M.S.; Methodology, Formal Analysis, Investigation, Resources, Data Curation, Original Draft Preparation, Review and Editing, and Visualization: M.S. and S.N.J.
Funding
This research received no external funding.
Acknowledgments
The authors are grateful to the assistant editor and two anonymous referees for their helpful comments and suggestions.
Conflicts of Interest
The authors declare no conflict of interest.
References
- Agren, Martin. 2006. Does Oil Price Uncertainty Transmit to Stock Markets? Working Paper Series 2006, 23; Uppsala: Uppsala University, Department of Economics. [Google Scholar]
- Bollerslev, Tim. 1986. Generalised autoregressive conditional hetroscedasticity. Journal of Econometrics 31: 307–27. [Google Scholar] [CrossRef]
- Chung, Chae-Shik, and Youngmin Jang. 2000. Analysis of changes in the relationship between the KRW/USD exchange rate and JPY/USD exchange rate before and after the economic crisis. East Asian Economic Review 4: 65–93. [Google Scholar] [CrossRef]
- Dickey, Alan Dickey, and Wayne Arthur Fuller. 1979. Distribution of the estimators for autoregressive time series with a unit root. Journal of the American Statistical Association 74: 427–31. [Google Scholar]
- Dickey, Alan Dickey, and Wayne Arthur Fuller. 1981. Likelihood ration statistics for autoregressive time series with a unit root. Econometrica 49: 1057–72. [Google Scholar] [CrossRef]
- Dimitriou, Dimitrios, Dimitris Kenourgios, and Theodore Simos. 2017. Financial crises, exchange rate linkages and uncovered interest parity: Evidence from G7 markets. Economic Modelling, Elsevier 66: 112–20. [Google Scholar] [CrossRef]
- Engle, Fry Robert. 1982. Autoregressive conditional hetroscedasticity with estimates of the variance of United Kingdom inflation. Econometrica 50: 987–1007. [Google Scholar] [CrossRef]
- Engle, Fry Robert. 2002. Dynamic conditional correlation: A simple class of multivariate generalized autoregressive conditional hetroscedasticity models. Journal of Business and Economic Statistics 20: 339–50. [Google Scholar] [CrossRef]
- Engle, Fry Robert, and Kevin Sheppard. 2001. Theoretical and Empirical Properties of Dynamic Conditional Correlation Multivariate GARCH. NBER Working Paper No. 8554. Available online: https://ssrn.com/abstract=1296441 (accessed on 10 September 2017).
- Hanabusa, Kunihiro. 2010. Effects of foreign disasters on the petroleum industry in Japan: A financial market perspective. Energy 35: 5455–63. [Google Scholar] [CrossRef]
- Karfakis, Costas, and Theodore Panagiotidis. 2015. The effects of global monetary policy and Greek debt crisis on the dynamic conditional correlations of currency markets. Empirica (Journal of European Economics) 42: 795–811. [Google Scholar] [CrossRef]
- Lin, Chin-Tsai, and Yi-Hsien Wang. 2005. An analysis of political changes on Nikkei 225 stock returns and volatilities. Annals of Economics and Finance 6: 169–83. [Google Scholar]
- Wang, Lin, and Ali Kutan. 2013. The impact of natural disasters on stock markets: Evidence from Japan and the US. Comparative Economic Studies 55: 672–86. [Google Scholar] [CrossRef]
© 2018 by the authors. Licensee MDPI, Basel, Switzerland. This article is an open access article distributed under the terms and conditions of the Creative Commons Attribution (CC BY) license (http://creativecommons.org/licenses/by/4.0/).


