Physical Activity Associated with Public Transport Use—A Review and Modelling of Potential Benefits

Abstract
:1. Introduction
2. Methods
2.1. Study Selection Criteria
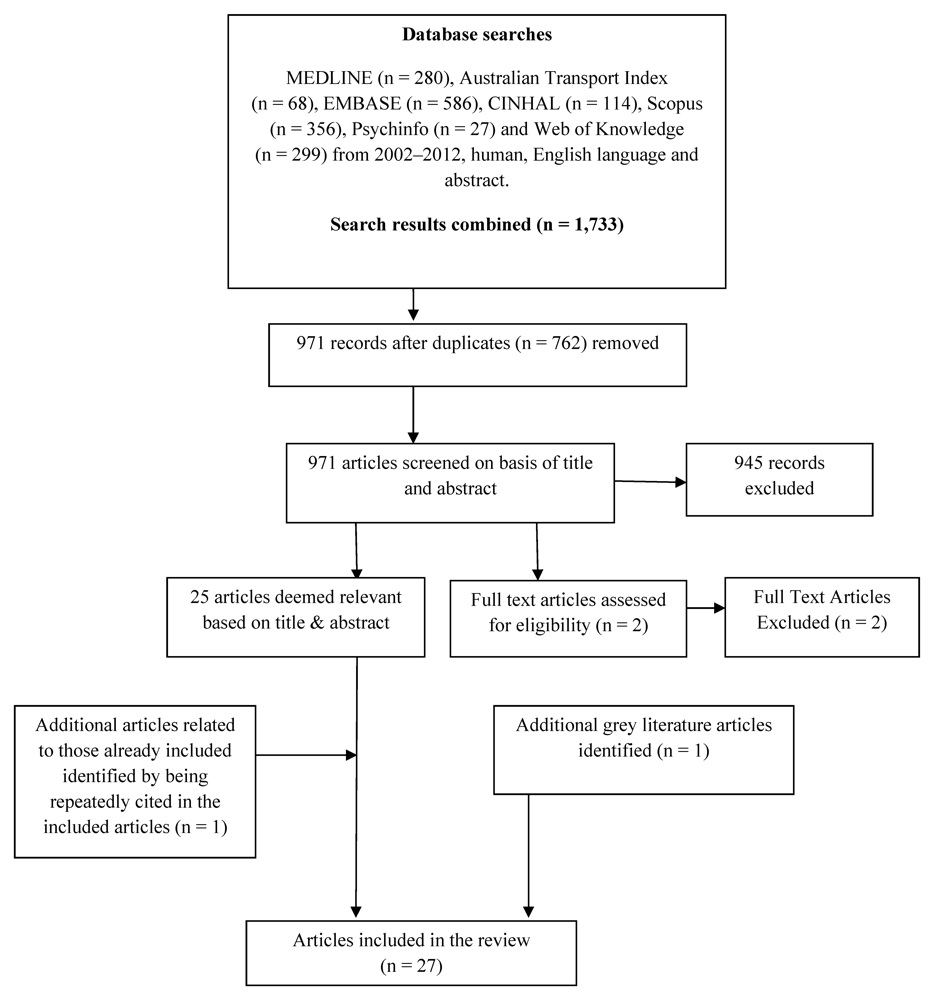
2.2. Search Strategy and Study Selection Process


| Key words | Medline/Psychinfo terms | Australian Transport Index | Embase | Scopus | Cinahl | Web of Knowledge |
|---|---|---|---|---|---|---|
| Adult | Adult$ | Adult$ | Adult$ | Adult$ | Adult$ | Adult$ |
| Physical Activity | Physic$ activ$, exercis$, physical training, fitness training | No relevant subject term | Physic$ activ$, exercis$, physical training, fitness training | Physic$ activ$, exercis$, physical training, fitness training | Physic$ activ$, exercis$, physical training, fitness training | Physic$ activ$, exercis$, physical training, fitness training |
| Physical fitness | No relevant subject term | Physical fitness | Physical fitness | Physical fitness | Physical fitness | |
| Physical exertion | No relevant subject term | No relevant subject term | Physical exertion | No relevant subject term | Physical exertion | |
| Walk$, active travel, active commut$, active transport$ | Walk$, active travel, active commut$, active transport$ | Walk$, active travel, active commut$, active transport$ | Walk$, active travel, active commut$, active transport$ | Walk$, active travel, active commut$, active transport$ | Walk$, active travel, active commut$, active transport$ | |
| Bicyc$, cycle, cycling, biking | Bicyc$, cycle, cycling, biking | Bicyc$, cycle, cycling, biking | Bicyc$, cycle, cycling, biking | Bicyc$, cycle, cycling, biking | Bicyc$, cycle, cycling, biking | |
| Leisure activ$ | No relevant subject term | No relevant subject term | Leisure activ$ | Leisure activ$ | Leisure activ$ | |
| Public Transport | Public transport$, public transit$, rail$, tram, metro, bus, ferry, subway, mass transit. | Public transport$, public transit$, rail$, tram, metro, bus, ferry, subway, mass transit. | Public transport$, public transit$, rail$, tram, metro, bus, ferry, subway, mass transit. | Public transport$, public transit$, rail$, tram, metro, bus, ferry, subway, mass transit. | Public transport$, public transit$, rail$, tram, metro, bus, ferry, subway, mass transit. | Public transport$, public transit$, rail$, tram, metro, bus, ferry, subway, mass transit. |
2.3. Modelling of NSW Health Survey Data
3. Results
| Study Characteristics | Methodology | Outcome | ||||||
|---|---|---|---|---|---|---|---|---|
| Author, Year, Country, | Research Question | Public Transport Measure | Physical Activity Measure | Occupational/Leisure-Time Physical Activity Separated in Final Analyses | Confounders Measured | Result | ||
| Study Design, | ||||||||
| Sample Size/Demographic | ||||||||
| Lachapelle, U et al. (2011) [15] | Relationship between commuting by public transport and objectively measured moderate intensity physical activity. | Reported % of all work commute trips taken by public transport. 3 groups: | Mean daily minutes of accelerometer measured moderate intensity physical activity. | Self report measures of occupational/ leisure-time physical activity did not confound results. | (1) Neighbourhood walkability, enjoyment of physical activity, demographics. | (1) Frequent public transport users accumulated significantly more (+8 mins) moderate-intensity physical activity daily compared with non-public transport users. | ||
| USA | ||||||||
| Cross-sectional | -non public transport user | |||||||
| n = 1,237 | -infrequent public transport user(<50% commutes by public transport) | |||||||
| 20–65 years old working outside home | -frequent public transport user(≥50% commutes by public transport) | |||||||
| Besser, LM et al. (2005) [18] | Estimate the daily level of physical activity obtained by Americans solely by walking to/from transit. | Only measured walking in transit users so no public transport measure. | Minutes spent walking to/from transit in a 24 h period. | Only walking to/from transit measured. | (1) Uncontrolled | (1) People who walk to/from transit accumulate 24.3 mins of mean walking time/day. | ||
| USA | ||||||||
| Cross-sectional | ||||||||
| n = 3,312 | ||||||||
| 18+ years who walked to/from transit on day of measurement | (2) Stratified for transit type, demographics, population density, car ownership. | (2) 29% of transit users achieve ≥ 30 minutes walking to/from transit daily. | ||||||
| Edwards, R et al. (2008) [16] | Is the additional walking associated with mass transit use large enough to reduce obesity & health care costs? (by estimating additional walking associated with public transport use). | “Public transit user” = anyone who reports using public transport for any reason on assigned travel day. | Time spent walking on assigned travel day for any purpose. | no | (1) Demographics, number of household vehicles, own home, census region fixed effects. | (1) Public transport use associated with significantly more (8–10 mins) additional walking per day. | ||
| USA | ||||||||
| Cross-sectional | ||||||||
| n = 28,771 | ||||||||
| 18+ years old from National Household travel survey | ||||||||
| Evans, A et al. (2009) [19] | Focus is on rail and road safety. | Only examined walking in rail users so no public transport measure. | Self report distance walked to surface railway stations over 7 consecutive reporting days. | Only measured walking to train stations. | no | Brits walk an average of 0.905 km per journey on journeys with surface rail as the main mode. | ||
| UK | ||||||||
| Cross-sectional | ||||||||
| n = 5,749 rail journeys | ||||||||
| Data from British National Travel survey 1999–2001 | (equivalent to 10–12 minutes per trip) | |||||||
| Morabia et al. (2010) [20] | Compare levels of physical activity between car & public transport commutes to work. | 18 participants commuted by car to Queens College for 5 days than switched to commuting by public transport. (no public transport measure) | Activity diary +GPS system used to calculate the average metabolic equivalent value for car vs. public transport. | n/a as experiment limited to walking for transport. | no | Public transport commuters expended significantly more (+622 kcal over 5 days) energy compared with travelling the same route by car. (approximately equivalent to 30 minutes walking) | ||
| USA | ||||||||
| Experimental | ||||||||
| n = 18 | ||||||||
| Adults either working/studying at Queens College | ||||||||
| Wener, R et al. (2007) [21] . | Compare level of physical activity between car and transit users travelling to/from work. | If travelled to work by: | Pedometer worn for 5 days and international physical activity questionnaire issued at start of measuring week. | no | (1) Income, gender & education. | (1) Train commuters walked significantly more steps (2,000 per day) compared to car commuters (equivalent to about 30 minutes). | ||
| USA | ||||||||
| Cross-sectional | ||||||||
| n = 177 | ||||||||
| Adults commuting from New Jersey to work in NY | public transport ≥ 4 × /week = transit user car ≥ 4 × /week = car user. | (2) Income, gender, education & commuting time. | (2) Train commuters 4 × more likely to achieve 10,000 steps/day compared to car users. | |||||
| Davis, M et al. (2011) [22] | Describe the frequency, purpose & travel mode of daily trips in older adults & their association with participant characteristics & objectively measured physical activity. | Determined by respondent noting “mode of transport” in trip log. | Steps/day and minutes of moderate-intensity physical activity day assessed by accelerometer for 1week + daily trip log noting purpose of trip/mode of transport . | Did not adjust for “purpose of trip”. | (1) Other trip types (car, walking, cycling), age, sex, physical function, use of a walking aid, education & car ownership. | (1) Each weekly trip made by public transport is significantly associated with extra 412.7 steps/day in older adults (equivalent to about 8 minutes of walking). | ||
| UK | ||||||||
| Cross-sectional | ||||||||
| n = 214 | ||||||||
| Adults over 70 years old | (2) As per #1 | (2) Public transport trips made by older adults is significantly associated with minutes of moderate-intensity physical activity/day (ln = 0.06). | ||||||
| Villanueva, K et al. (2008) [17] | Compare pedometer-determined physical activity levels of university students using public transport compared to cars for travel to uni. | Categorised into 2 groups: “mainly car user” or “mainly public transport user” for travel to uni. | Time spent walking for transport estimated from pedometer & diaries. | Adjusted for self-report leisure-time physical activity in analysis #2. | (1) Uncontrolled | (1) Public transport users took significantly greater steps (11,433 vs . 10,242) compared with drivers.(1,191 steps is equivalent to about 15 minutes of walking) | ||
| Australia (Perth) | ||||||||
| Cross-sectional | ||||||||
| n = 103 | ||||||||
| University students | (2) Gender, age and leisure-time physical activity. | (2) Public transport users significantly (3.55×) more likely to achieve 10,000 steps/ day compared with drivers. | ||||||
| Macdonald, J et al. (2010) [23] | Examine association between objective & perceived measures of the built environment, body mass index, obesity and meeting recommended physical activity (RPA) through walking and vigorous exercise. To assess effect of using light rail on weekly RPA. | Pre and post exposure to a new light rail transit line. | Categorised as either meeting the recommendations for physical activity through vigorous exercise or moderate-intensity physical activity (through walking) or not meeting recommendations. | no | (1) Age, gender, race, employment status, education, own residence, distance to work, perception of neighbourhood, access to parks, density of food/alcohol establishments, household density, use of public transport on weekly basis & propensity to use light rail. | (1) Light rail transit (LRT) users decreased their body mass index by average of 1.18 compared with similarly situated non-LRT users over 12–15 months follow-up. | ||
| USA | ||||||||
| n = 498 | (2) LRT users lived 1.5 miles from stations (equivalent to 36 minutes walking). | |||||||
| Cross-sectional and pre/post intervention | 2) As per #1 | (3) Association between LRT use and meeting weekly recommended physical activity levels by walking was in a positive direction but not significant. | ||||||
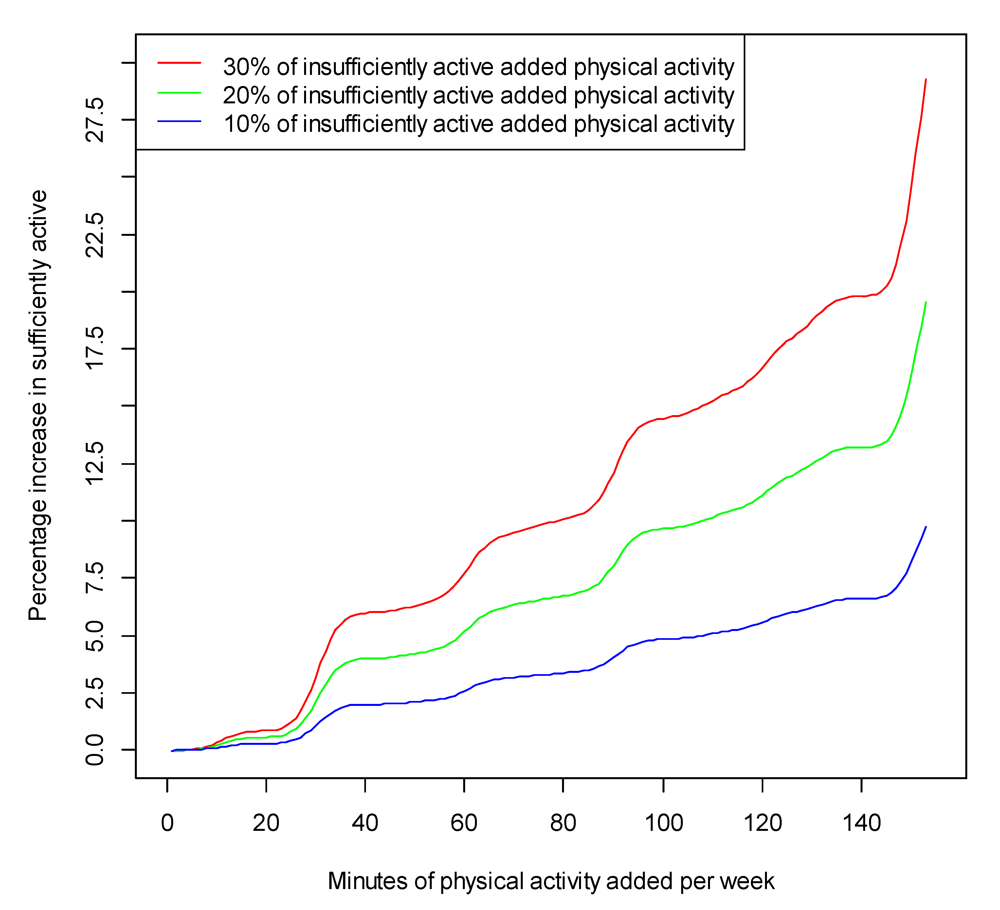
3.1. Modelling of NSW Health Survey Population Data
| Minutes of physical activity added per weekday | ||||
|---|---|---|---|---|
| 8 | 16 | 24 | ||
| Percent uptake of physical activity by insufficiently active | 10%/ | 1.96% | 3.48% | 5.94% |
| (1.81%–2.12%) | (3.36%–3.61%) | (5.62%–6.26%) | ||
| 20% | 3.93% | 6.97% | 11.88% | |
| (3.62%–4.23%) | (6.61%–7.32%) | (11.45%–12.31%) | ||
| 30% | 5.89% | 10.45% | 17.82% | |
| (5.10%–6.68%) | (10.00%–10.94%) | (17.00%–18.64%) | ||
4. Discussion
4.1. Study Strengths and Limitations
5. Conclusions
Conflict of Interest
Acknowledgements
References
- Bull, F.; Bauman, A. Physical inactivity: The cinderella risk factor for ncd prevention. J. Health Commun. 2011, 16(Suppl 2), S13–S26. [Google Scholar]
- Trost, S.G.; Owen, N.; Bauman, A.E.; Sallis, J.F.; Brown, W. Correlates of adults’ participation in physical activity: Review and update. Med. Sci. Sports Exerc. 2002, 34, 1996–2001. [Google Scholar]
- Kent, J.; Thompson, S.M.; Jalaludin, B. Healthy Built Environments: A Review of the Literature; Healthy Built Environments Program, City Futures Research Centre, The University of New South Wales: Sydney, Australia, 2011. [Google Scholar]
- Heath, G.W.; Brownson, R.C.; Kruger, J.; Miles, R.; Powell, K.; Ramsey, L.T. The effectiveness of urban design and land use and transport policies and practices to increase physical activity: A systematic review. Hum. Kinet. 2006, 3(Suppl 1), S55–S76. [Google Scholar]
- Pucher, J.; Dijkstra, L. Promoting safe walking and cycling to improve public health: Lessons from the netherlands and germany. Am. J. Public Health 2003, 93, 1509–1516. [Google Scholar] [CrossRef]
- Wilson, L.A.; Giles-Corti, B.; Burton, N.W.; Giskes, K.; Haynes, M.; Turrell, G. The association between objectively measured neighborhood features and walking in middle-aged adults. Am. J. Health Promot. 2011, 25, e12–e21. [Google Scholar]
- Wen, L.M.; Orr, N.; Millett, C.; Rissel, C. Driving to work and overweight and obesity: Findings from the 2003 new south wales health survey, Australia. Int. J. Obes. (Lond.) 2006, 30, 782–786. [Google Scholar]
- Wen, L.M.; Rissel, C. Inverse associations between cycling to work, public transport, and overweight and obesity: Findings from a population based study in Australia. Prev. Med. 2008, 46, 29–32. [Google Scholar] [CrossRef]
- Hansson, E.; Mattisson, K.; Bjork, J.; Ostergren, P.O.; Jakobsson, K. Relationship between commuting and health outcomes in a cross-sectional population survey in southern Sweden. BMC Public Health 2011. [Google Scholar] [CrossRef]
- Bus Association Victoria, Public Transport Use a Ticket to Health; Bus Association Victoria: Melbourne, Australia, 2010.
- NSW Ministry of Health. New South Wales Population Health Survey. Available online: http://www.health.nsw.gov.au/publichealth/surveys/phs.asp (accessed on 15 March 2012).
- R Development Core Team, R: A Language and Environment for Statistical Computing; R Foundation for Statistical Computing: Vienna, Austria, 2011.
- Davidson, A.C.; Hinkley, D.V. Bootstrap Methods and Their Application; Cambridge University Press: Cambridge, UK, 1997. [Google Scholar]
- Wegman, E.J.; Wright, I.W. Splines in statistics. J. Am. Stat. Assoc. 1983, 78, 351–365. [Google Scholar]
- Lachapelle, U.; Frank, L.; Saelens, B.E.; Sallis, J.F.; Conway, T.L. Commuting by public transit and physical activity: Where you live, where you work, and how you get there. J. Phys. Act. Health 2011, 8(Suppl 1), S72–S82. [Google Scholar]
- Edwards, R.D. Public transit, obesity, and medical costs: Assessing the magnitude. Prev. Med. 2008, 46, 14–21. [Google Scholar] [CrossRef]
- Villanueva, K.; Giles-Corti, B.; McCormack, G. Achieving 10,000 steps: A comparison of public transport users and drivers in a university setting. Prev. Med. 2008, 47, 338–341. [Google Scholar] [CrossRef]
- Besser, L.M.; Dannenberg, A.L. Walking to public transit steps to help meet physical activity recommendations. Am. J. Prev. Med. 2005, 29, 273–280. [Google Scholar] [CrossRef]
- Evans, A.W.; Addison, J.D. Interactions between rail and road safety in great Britain. Accid. Anal. Prev. 2009, 41, 48–56. [Google Scholar] [CrossRef]
- Morabia, A.; Mirer, F.E.; Amstislavski, T.M.; Eisl, H.M.; Werbe-Fuentes, J.; Gorczynski, J.; Goranson, C.; Wolff, M.S.; Markowitz, S.B. Potential health impact of switching from car to public transportation when commuting to work. Am. J. Public Health 2010, 100, 2388–2391. [Google Scholar] [CrossRef]
- Wener, R.; Evans, G. A morning stroll: Levels of physical activity in car and mass transit commuting. Environ. Behav. 2007, 39, 62–74. [Google Scholar] [CrossRef]
- Davis, M.G.; Fox, K.R.; Hillsdon, M.; Coulson, J.C.; Sharp, D.J.; Stathi, A.; Thompson, J.L. Getting out and about in older adults: The nature of daily trips and their association with objectively assessed physical activity. Int. J. Behav. Nutr. Phys. Act. 2011, 8. [Google Scholar] [CrossRef] [Green Version]
- MacDonald, J.M.; Stokes, R.J.; Cohen, D.A.; Kofner, A.; Ridgeway, G.K. The effect of light rail transit on body mass index and physical activity. Am. J. Prev. Med. 2010, 39, 105–112. [Google Scholar] [CrossRef]
- Lindstrom, M. Means of transportation to work and overweight and obesity: A population-based study in southern Sweden. Prev. Med. 2008, 46, 22–28. [Google Scholar] [CrossRef]
- McCormack, G.R.; Giles-Corti, B.; Bulsara, M. The relationship between destination proximity, destination mix and physical activity behaviors. Prev. Med. 2008, 46, 33–40. [Google Scholar] [CrossRef]
- Morabia, A.; Amstislavski, P.N.; Mirer, F.E.; Amstislavski, T.M.; Eisl, H.; Wolff, M.S.; Markowitz, S.B. Air pollution and activity during transportation by car, subway, and walking. Am. J. Prev. Med. 2009, 37, 72–77. [Google Scholar] [CrossRef]
- Coogan, P.F.; White, L.F.; Adler, T.J.; Hathaway, K.M.; Palmer, J.R.; Rosenberg, L. Prospective study of urban form and physical activity in the black women’s health study. Am. J. Epidemiol. 2009, 170, 1105–1117. [Google Scholar] [CrossRef]
- Brown, B.B.; Werner, C.M. A new rail stop: Tracking moderate physical activity bouts and ridership. Am. J. Prev. Med. 2007, 33, 306–309. [Google Scholar] [CrossRef]
- Cleland, V.J.; Timperio, A.; Crawford, D. Are perceptions of the physical and social environment associated with mothers’ walking for leisure and for transport? A longitudinal study. Prev. Med. 2008, 47, 188–193. [Google Scholar] [CrossRef]
- Frank, L.D.; Greenwald, M.J.; Winkelman, S.; Chapman, J.; Kavage, S. Carbonless footprints: Promoting health and climate stabilization through active transportation. Prev. Med. 2010, 50(Suppl 1), S99–S105. [Google Scholar]
- Lachapelle, U.; Frank, L.D. Transit and health: Mode of transport, employer-sponsored public transit pass programs, and physical activity. J. Public Health Policy 2009, 30(Suppl 1), S73–S94. [Google Scholar]
- Li, F.; Harmer, P.A.; Cardinal, B.J.; Bosworth, M.; Acock, A.; Johnson-Shelton, D.; Moore, J.M. Built environment, adiposity, and physical activity in adults aged 50-75. Am. J. Prev. Med. 2008, 35, 38–46. [Google Scholar] [CrossRef]
- Liao, Y.; Harada, K.; Shibata, A.; Ishii, K.; Oka, K.; Nakamura, Y.; Inoue, S.; Shimomitsu, T. Perceived environmental factors associated with physical activity among normal-weight and overweight Japanese men. Int. J. Environ. Res. Public Health 2011, 8, 931–943. [Google Scholar] [CrossRef]
- McConville, M.E.; Rodriguez, D.A.; Clifton, K.; Cho, G.; Fleischhacker, S. Disaggregate land uses and walking. Am. J. Prev. Med. 2011, 40, 25–32. [Google Scholar] [CrossRef]
- New South Wales Department of Health, The Health of the People of NSW—Report of the Chief Health Officer; New South Wales Department of Health: Sydney, Australia, 2010.
- Australian Government, National Physical Activity Guidelines for Adults; Department of Health and Aged Care, Australian Government: Canberra, Australia, 2005.
- Australian Institute of Health and Welfare (AIHW), Australia’s Health Series No. 12. In Australia’s Health 2010; AIHW: Sydney, Australia, 2010.
- Douglas, M.; Thomson, H.; Jepson, R.; Hurley, F.; Higgins, M.; Muirie, J.; Gorman, D. Health Impact Assessment of Transport Initiatives: A Guide; NHS Health Scotland: Edinburgh, UK, 2007. [Google Scholar]
- De Bourdeaudhuij, I.; Sallis, J.F.; Saelens, B.E. Environmental correlates of physical activity in a sample of Belgian adults. Am. J. Health Promot. 2003, 18, 83–92. [Google Scholar] [CrossRef]
- Kamada, M.; Kitayuguchi, J.; Inoue, S.; Kamioka, H.; Mutoh, Y.; Shiwaku, K. Environmental correlates of physical activity in driving and non-driving rural Japanese women. Prev. Med. 2009, 49, 490–496. [Google Scholar] [CrossRef]
- Pikora, T.J.; Giles-Corti, B.; Knuiman, M.W.; Bull, F.C.; Jamrozik, K.; Donovan, R.J. Neighborhood environmental factors correlated with walking near home: Using spaces. Med. Sci. Sports Exerc. 2006, 38, 708–714. [Google Scholar] [CrossRef]
- Lovasi, G.S.; Neckerman, K.M.; Quinn, J.W.; Weiss, C.C.; Rundle, A. Effect of individual or neighborhood disadvantage on the association between neighborhood walkability and body mass index. Am. J. Public Health 2009, 99, 279–284. [Google Scholar] [CrossRef]
- Cerin, E.; Leslie, E.; du Toit, L.; Owen, N.; Frank, L.D. Destinations that matter: Associations with walking for transport. Health Place 2007, 13, 713–724. [Google Scholar] [CrossRef]
Appendix
| Study Characteristics | Methodological | Outcome | ||||||
|---|---|---|---|---|---|---|---|---|
| Author, Year, Country,Study Design, Sample Size/Demographic | Research Question | Public Transport Measure | Physical Activity Measure | Occupational/ Leisure-Time Physical Activity Separated in Final Analyses | Confounders Measured | Result | ||
| Morabia, A et al. (2009) [26] | Assess the physical activity energy expenditure for transportation by car vs. subway vs. walking the same predetermined route. | Only the car vs. subway arms are relevant to this report. | Activity diary + GPS system used to calculate the average metabolic equivalent value for each study arm. | n/a as experiment limited to walking for transport. | no | Physical activity energy expenditure (Kcal/min) was significantly greater in subway users (2.35) compared to car users (1.74) travelling the same pre-determined route. | ||
| USA | ||||||||
| Experimental 3 arm study | ||||||||
| N = 20 | ||||||||
| Adults either working /studying at Queens College. | ||||||||
| Coogan, P et al. (2009) [27] | Association between neighbourhood urban form & physical activity. | (1) Shortest distance between each participants address & public transport. | Hours/week spent in utilitarian walking (≥5h walking/week vs. ¼ 5h walking/week). | Only measured utilitarian walking. | (1) Demographics, caregiver responsibilities, smoking/alcohol status, number of moves in last 2 years, energy intake, tv viewing, %vacant housing units, neighbourhood SES, crime index. | (1) Distance to transit (OR: 2.63 for lowest quintile distance to transit) & bus (OR: 3.23 for highest quintile bus routes) availability (when considered as only urban variable) is significantly positively associated with utilitarian walking. | ||
| USA | ||||||||
| Longitudinal | ||||||||
| N = 20,354 | ||||||||
| Black females 21–69 years old | (2) Bus availability (measured by miles of bus routes within 0.5 miles of individual’s address). | (2) As for 1+ adjusted for all other urban form variables (housing density, sidewalks, parks etc .). | (2) Bus availability is independently & significantly associated with utilitarian walking (OR 1.18–1.44 for lowest to highest quintile of bus route availability). | |||||
| Lindstrom, M (2008) [24] | Association between means of transport to work & overweight/ obesity | Means of transportation to work measured as options: walking, biking, car, bus | Not measured. | n/a as physical activity not measured | (1) Age, country of origin, education & time to travel to work. | (1) Odds of overweight + obesity(0.61–0.86) and obesity (0.51–0.95) in men who use public transport to travel to work are significantly lower compared with men who use a car to get to work. | ||
| Sweden | ||||||||
| Cross-sectional | ||||||||
| N = 16,705 | train, other (could tick | |||||||
| 18–80 years old employed people | multiple) | |||||||
| Brown, B et al. (2007) [28] | Does a new light rail stop increase number of light rail users & does light rail ridership relate to moderate activity bouts? | Pre-post building of new light rail stop. | Moderate intensity physical activity (MPA) measured with accelerometers & respondents indicated whether they were related to walking to/from light rail stop. | Respondents indicated whether the moderate intensity physical activity registered on accelerometers was associated with walking to/from light rail. | (1) Gender, household size & home ownership. | (1) Pre & post new stop rail rides were significantly related to more moderate intensity physical activity (MPA) bouts. | ||
| USA | ||||||||
| Pre/post test design | ||||||||
| n = 51 | ||||||||
| Adults living within ½ mile of new rail stop | (2) #1 variables + moderate-intensity physical activity pre new rail stop. | (2) Longitudinal analysis showed walks to transit contributed to MPA above prior activity levels (before construction of new stop). | ||||||
| de Bourdeaudhuij, I et al. (2003) [39] | Examine the variance in sitting, walking and moderate- vigorous physical activity explained by a wide range of community design & recreational environmental variables above & beyond the variance accounted for by individual & group demographic variables. | Ease of access to public transport stop. | International physical activity questionnaire: minutes spent walking AND minutes spent in moderate-intensity physical activity (not walking) in last week. | no | (1) Sex, age, education, living situation, working situation, height, weight, body mass index. | (1) 3% of the variance in walking (all purposes) was explained by greater ease of walk to public transport (correlate = 0.16) and to land use mix. | ||
| Belgium | ||||||||
| Cross-sectional | ||||||||
| N = 521 | ||||||||
| 18–65 years old from Ghent | ||||||||
| Frank, L et al. (2010) [30] | Examine the relationship between energy used for active and motorised forms of transport & evaluate how modifiable features of the built environment are associated with the ratio between energy used for active vs. motorised travel. | -Distance to nearest public transport stop. | Average distance spent walking over 2 days (than converted to average kilocalories spent walking). | no | (1) Age, gender, ethnicity, drivers’ license status, income, #household members, vehicles in household. | (1) As shortest distance to nearest rail stop increased energy expended from walking decreased significantly | ||
| USA | ||||||||
| Cross-sectional | ||||||||
| N = 10,148 | -“Transit | (2) As per #1. | (2) As shortest distance to nearest bus-stop increased, energy expended from walking increased significantly. | |||||
| >16 years old residents of Atlanta | Accessibility” ( i.e. ,: whether respondent could access all the regions 5 major activity centers by walking to transit). | (3) As per #1. | (3) Those that had access to all 5 of the major city centres via transit burned significantly more kilocalories from walking. | |||||
| Kamada, M et al. (2009) [40] | Describe environmental correlates (focus on public transport) of physical activity among rural Japanese women. | -Self report “access to public transport”. | International physical activity questionnaire used to assess time spent in occupational, leisure-time physical activity & transportation related walking over a typical 7 day week & divided into:recommendations) | no | (1) Age, body mass index, gender, general health state, household economy, employment, engagement in farming, parenting/care-giving status, driving status. | (1) “Sufficiently active” women significantly more likely (OR = 1.57) to report good access to public transport compared with inactive women. | ||
| Japan | ||||||||
| Cross-sectional | -GPS measured distance to train station. | (1) sufficiently active (meeting recommendations) | ||||||
| N = 434 | -Bus service convenience (combination of GPS measured distance to | (2) insufficiently active (not meeting | ||||||
| 40–64 years old rural Japanese women | bus-stop+bus frequency). | (3) inactive(no moderate-vigorous intensity physical activity) | (2) As per #1. | (2) Non-drivers in an area where bus services were moderately convenient were more likely (OR: 3.23) to be sufficiently active than those where it was less convenient. | ||||
| Lachapelle, U et al. (2009) [31] | (1) Assess the relationship between using public transport & meeting recommended levels of physical activity while controlling for neighbourhood built environment & demographic factors. | -Distance to nearest transit stop/station.- | Average self-report distance walked for transportation over the 2 reporting days. 3 groups: | Only measured walking for transport | (1) Demographics, neighbourhood density, presence of services near work, distance from home to transit, car availability | (1) Only trips with public transport are significantly associated with being sufficiently active (OR: 3.35) compared to driving or being a car passenger. | ||
| USA | ||||||||
| Cross-sectional | ||||||||
| N = 4,156 | ||||||||
| 16–70 years old Atlanta residents | (2) Relationship between employer- sponsored public transport passes & walking. | If respondent received and used free/ subsidized transit pass. | -sufficient walking(meets recommendation) | (2) As per #1 | (2) Having & making use of an employer-sponsored transit card positively & significantly associated with being sufficiently active (OR = 4.96) compared with not having access to a card. | |||
| -moderate walking(less than sufficient but more than no walking)-no walking(no walking for transport) | (3) As per #1 | (3) Transit users living 450–1,000 m of transit were significantly more likely to be moderate walkers (O = 6.54). | ||||||
| Li, F et al. (2008) [32] | Examine relationship between built environment factors, the prevalence of overweight/obesity & various forms of physical activity. | Density of public transport stations/stops. | -Walked for household errands/ transportation ≥30 min/week or not-Self-report moderate-vigorous intensity physical activity resulting in 3 categories: (1) met guidelines for moderate or vigorous physical activity. | yes | Age, gender, race/ethnicity, employment status, home ownership, income, health status, fruit & vegetable intake, fried food consumption, body mass index. | (1) Density of public transport stations significantly associated with more walking for transport & being “sufficiently active”. | ||
| USA | ||||||||
| Cross-sectional | ||||||||
| N = 1,221 | (2) insufficiently active | |||||||
| 50–75 years old from 120 different neighbourhoods | (3) inactive | Residential density, median household income &% African American/Hispanic residents. | ||||||
| Liao, Y et al. (2011) [33] | Examine the perceived environmental correlates of physical activity among normal weight & overweight Japanese men. | Access to public transport. | Categorised as either meeting the recommendations for walking and or moderate-vigorous intensity physical activity (excluding walking) or not meeting recommendations. | no | (1) Age, marital status, education, household income, employment status. | (1) Good access to public transport (OR = 2.3) is significantly associated with walking sufficiently per week to meet physical activity recommendations in normal weight men. This did not apply to overweight men. | ||
| Japan | ||||||||
| Cross-sectional | ||||||||
| N = 1,420 | ||||||||
| 30–59 years old Japanese men | (2) As per #1 | (2) Good access to public transport had no significant relationship with moderate-vigorous intensity physical activity in normal weight & overweight men. | ||||||
| McConville, M et al. (2011) [34] | Association between accessibility/ intensity of non-residential land uses & walking for transport. | -Distance to bus-stop/ railway from person’s home measured | Walking for transport 3 categories: | Only measured walking for transport. | (1) Demographics +residential population density & sidewalk density.(2) As per #1(3) As per #1 + neighbourhood type | (1) Compared to not walking for transport the odds of walking for transport for ¼ 150 min/week were significantly lower with greater distance to bus stop (OR = 0.91, CI: 0.85–0.97). | ||
| USA | ||||||||
| Cross-sectional | (1) none | |||||||
| N = 260 | (2) ¼ 150 min/week | (2) Compared to not walking for transport odds for walking ≥150 min/week were significantly lower with greater distance to bus stop (OR = 0.01, CI:0.001–0.11) & rail station (OR = 0.9, CI:0.82–0.99). | ||||||
| Healthy adults from Montgomery County non-representative) | -# of bus-stops within ½ or ¼ mile. | (3) ≥150 min/week | (3) # of bus-stops within a ½ (OR:1.06) & ¼ (OR: 1.16) mile buffer associated with greater odds of walking ≥ | |||||
| 150 min/week for transport compared to not walking for transport. | ||||||||
| Wilson, L et al. (2011) [6] | Examine how a range of objectively measured neighbourhood features are associated with likelihood of middle-aged adults walking in their local neighbourhoods. | Distance to bus-stop/ railway from person’s home measured. | Walking for leisure-time physical activity + transport walking 5 levels: | no | Demographics and neighbourhood level socioeconomic status and within neighbourhood variation in age, sex household type, education, occupation & household income. | (1) There was no relationship found between proximity to public transport & walking for any purpose (maybe because they didn’t specifically measure transport walking). | ||
| Australia (Brisbane) | ||||||||
| Cross-sectional | ¼30 min | |||||||
| N = 10,286 | -≥30 min–¼90 min | |||||||
| ->90 min–¼150 min | ||||||||
| -≥150 min–¼300 min | ||||||||
| 40–65 years old Brisbane residents from 200 neighbourhoods | -≥300 min | |||||||
| Wen, L et al. (2008) [8] | Association between various modes of transport to work & overweight & obesity. | Whether public transport was usual method of commuting to work or not. | Not reported in terms of association with public transport (overweight/obese was instead). | Adjusted for people who met recommendedlevels of physical activity (all purpose). | (1) Age, marital status, education, language spoken at home, meeting recommendations for physical activity. | (1) Men who used public transport to get to work are significantly less likely to be overweight & obese (OR = 0.65; CI = 0.53–0.81) compared with men who drive to work (not significant for women). | ||
| Australia (NSW) | ||||||||
| Cross-sectional | ||||||||
| N = 6,810 | ||||||||
| 16+ years old working in NSW | ||||||||
| Pikora, T et al. (2006) [41] | Association between physical environmental factors & walking for recreation & transport near home. | Extent of presence of public transport within 400 m of home (embedded in a “destination score”). | Walking for transport near home or not in last 2 weeks (no time specified). | yes | (1) Demographics, socioeconomic status of area of residence + all other environmental variables (function, safety, aesthetic & destination). | (1) Presence of public transport 400m from home was not significantly associated with walking for transport (relationship was positive). However, the presence of destinations (including public transport) was significantly related to walking for transport near home (OR:1.8; CI: 1.33–2.44). | ||
| Australia (Perth) | ||||||||
| Cross-sectional | ||||||||
| N = 1,678 | ||||||||
| 18–59 years old Perth residents | ||||||||
| Lovasi, G et al. (2009) [42] | Test whether association between walkable environments & lower body mass index was stronger within disadvantaged groups. | -#bus/subway stops within 1 km radius of home. | Not measured (body mass index used) | n/a | (1) Age, gender, race, individual education, % of Black/Hispanic residents in area, % below poverty line.#1 | (1) “Advantaged people” who have subway access & use public transport are significantly more likely to have a lower body mass index compared with disadvantaged groups. | ||
| USA | ||||||||
| Cross-sectional | ||||||||
| N = 13,102 | ||||||||
| 30+ years old New York residents | -Use public transport or not. | (2) As per | ||||||
| Cerin, E et al. (2007) [43] | Examine the association of objective & perceived measures of access to destinations with self-reported walking for transport | -Proximity of public transport | Weekly minutes of transport-related walking | n/a as only measured transport-related walking | (1) Sociodemographics + neighbourhood selection (residents chose to live in area because of accessibility of certain destinations). | (1) No relationship between transport walking & proximity to public transport stops. | ||
| Australia (Adelaide) | ||||||||
| Cross-sectional | ||||||||
| N = 2,650 | ||||||||
| 20–65 years old recruited from 32 neighbourhoods in Adelaide | - Monthly frequency of walking to public transport. | (2) Sociodemographics and walking to specific types of destinations. | (2) Monthly frequencies of walking to public transport stop independently significantly associated with weekly minutes of walking for transport (b = 3.7). | |||||
© 2012 by the authors; licensee MDPI, Basel, Switzerland. This article is an open-access article distributed under the terms and conditions of the Creative Commons Attribution license (http://creativecommons.org/licenses/by/3.0/).
Share and Cite
Rissel, C.; Curac, N.; Greenaway, M.; Bauman, A. Physical Activity Associated with Public Transport Use—A Review and Modelling of Potential Benefits. Int. J. Environ. Res. Public Health 2012, 9, 2454-2478. https://doi.org/10.3390/ijerph9072454
Rissel C, Curac N, Greenaway M, Bauman A. Physical Activity Associated with Public Transport Use—A Review and Modelling of Potential Benefits. International Journal of Environmental Research and Public Health. 2012; 9(7):2454-2478. https://doi.org/10.3390/ijerph9072454
Chicago/Turabian StyleRissel, Chris, Nada Curac, Mark Greenaway, and Adrian Bauman. 2012. "Physical Activity Associated with Public Transport Use—A Review and Modelling of Potential Benefits" International Journal of Environmental Research and Public Health 9, no. 7: 2454-2478. https://doi.org/10.3390/ijerph9072454