Increase in Metabolic Syndrome-Related Hospitalizations in Relation to Environmental Sources of Persistent Organic Pollutants


Abstract
:1. Introduction
2. Methods
2.1. Study Population
2.2. Statistical Analysis
3. Results
3.1. Patient Characteristics
3.2. Unadjusted Analysis
3.3. Multivariable Adjusted Analysis
4. Discussion
5. Conclusions
Acknowledgments
References
- Lloyd-Jones, D; Adams, RJ; Brown, TM; Carnethon, M; Dai, S; De Simone, G; Ferguson, TB; Ford, E; Furie, K; Gillespie, C; Go, A; Greenlund, K; Haase, N; Hailpern, S; Ho, PM; Howard, V; Kissela, B; Kittner, S; Lackland, D; Lisabeth, L; Marelli, A; McDermott, MM; Meigs, J; Mozaffarian, D; Mussolino, M; Nichol, G; Roger, V; Rosamond, W; Sacco, R; Sorlie, P; Stafford, R; Thom, T; Wasserthiel-Smoller, S; Wong, ND; Wylie-Rosett, J. Heart Disease and Stroke Statistics—2010 Update. A Report from the American Heart Association. Circulation 2010, 121, e1–e170. [Google Scholar]
- Mathers, CD; Lopez, AD; Murray, CJL. The Burden of Disease and Mortality by Condition: Data, Methods, and Results for 2001. In Global Burden of Disease and Risk Factors; Lopez, AD, Mathers, CD, Ezzati, M, Jamison, DT, Murray, CJL, Eds.; The World Bank and Oxford University Press: New York, NY, USA, 2006; pp. 45–240. [Google Scholar]
- Ford, ES; Giles, WH; Dietz, WH. Prevalence of the metabolic syndrome among US adults: Findings from the Third National Health and Nutrition Examination Survey. JAMA 2002, 287, 356–359. [Google Scholar]
- Ervin, RB. Prevalence of metabolic syndrome among adults 20 years of age and over, by sex, age, race and ethnicity, and body mass index: United States, 2003–2006. Natl. Health Stat. Report 2009, 13, 1–7. [Google Scholar]
- Huang, PL. A comprehensive definition for metabolic syndrome. Dis. Model. Mech 2009, 2, 231–237. [Google Scholar]
- Grundy, SM; Brewer, HB, Jr; Cleeman, JI; Smith, SC, Jr; Lenfant, C. Definition of metabolic syndrome: Report of the National Heart, Lung, and Blood Institute/American Heart Association conference on scientific issues related to definition. Circulation 2004, 109, 433–438. [Google Scholar]
- Grundy, SM; Cleeman, JI; Daniels, SR; Donato, KA; Eckel, RH; Franklin, BA; Gordon, DJ; Krauss, RM; Savage, PJ; Smith, SC, Jr; Spertus, JA; Costa, F. Diagnosis and management of the metabolic syndrome: An American Heart Association/National Heart, Lung, and Blood Institute Scientific Statement. Circulation 2005, 112, 2735–2752. [Google Scholar]
- Wu, SH; Liu, Z; Ho, SC. Metabolic syndrome and all-cause mortality: A meta-analysis of prospective cohort studies. Eur. J. Epidemiol 2010, 25, 375–384. [Google Scholar]
- Mottillo, S; Filion, KB; Genest, J; Joseph, L; Pilote, L; Poirier, P; Rinfret, S; Schiffrin, EL; Eisenberg, MJ. The metabolic syndrome and cardiovascular risk: A systematic review and meta-analysis. J. Am. Coll. Cardiol 2010, 56, 1113–1132. [Google Scholar]
- The Foundation for Global Action on Persistent Organic Pollutants: A United States Perspective; EPA/600/P-01/003F;. U.S. Environmental Protection Agency, Office of Research and Development: Washington, DC, USA, 2002. Available online: http://www.epa.gov/ncea/pdfs/pops/POPsa.pdf (accessed on 12 November 2010).
- International Programme on Chemical Safety (IPCS). Polychlorinated Biphenyls: Human Health Aspects; Concise International Chemical Assessment Document Series, Document 55; World Health Organization: Geneva, Switzerland, 2003. [Google Scholar]
- Carpenter, DO. Polychlorinated biphenyls (PCBs): Routes of exposure and effects on human health. Rev. Environ. Health 2006, 21, 1–23. [Google Scholar]
- Dioxins and Health; Schecter, A (Ed.) Plenum Press: New York, NY, USA, 1994.
- Weisglas-Kuperus, N. Neurodevelopmental, immunological and endocrinological indices of perinatal human exposure to PCBs and dioxins. Chemosphere 1998, 37, 1845–1853. [Google Scholar]
- Kern, PA; Dicker-Brown, A; Said, ST; Kennedy, R; Fonseca, VA. The stimulation of tumor necrosis factor and inhibition of glucose transport and lipoprotein lipase in adipose cells by 2,3,7,8-tetrachlorodibenzo-p-dioxin. Metabolism 2002, 51, 65–68. [Google Scholar]
- Nishiumi, S; Yoshida, M; Azuma, T; Yoshida, K; Ashida, H. 2,3,7,8-tetrachlorodibenzo-p-dioxin impairs an insulin signaling pathway through the induction of tumor necrosis factor-alpha in adipocytes. Toxicol. Sci 2010, 115, 482–491. [Google Scholar]
- Lee, DH; Lee, IK; Porta, M; Steffes, M; Jacobs, DR, Jr. Relationship between serum concentrations of persistent organic pollutants and the prevalence of metabolic syndrome among non-diabetic adults: Results from the National Health and Nutrition Examination Survey 1999–2002. Diabetologia 2007, 50, 1841–1851. [Google Scholar]
- Uemura, H; Arisawa, K; Hiyoshi, M; Kitayama, A; Takami, H; Sawachika, F; Dakeshita, S; Nii, K; Satoh, H; Sumiyoshi, Y; Morinaga, K; Kodama, K; Suzuki, T; Nagai, M. Prevalence of metabolic syndrome associated with body burden levels of dioxin and related compounds among Japan’s general population. Environ. Health Perspect 2009, 117, 568–573. [Google Scholar]
- Ribeiro, MC; Pereira, MJ; Soares, A; Branquinho, C; Augusto, S; Llop, E; Fonseca, S; Nave, JG; Tavares, AB; Dias, CM; Silva, A; Selemane, I; de Toro, J; Santos, MJ; Santos, F. A study protocol to evaluate the relationship between outdoor air pollution and pregnancy outcomes. BMC Public Health 2010, 10, 613. [Google Scholar]
- Kunzli, N; Tager, IB. The semi-individual study in air pollution epidemiology: A valid design as compared to ecologic studies. Environ. Health Perspect 1997, 105, 1078–1083. [Google Scholar]
- Reynolds, K; Muntner, P; Fonseca, V. Metabolic syndrome: Underrated or underdiagnosed? Diabetes Care 2005, 28, 1831–1832. [Google Scholar]
- Huang, X; Lessner, L; Carpenter, DO. Exposure to persistent organic pollutants and hypertensive disease. Environ. Res 2006, 102, 101–106. [Google Scholar]
- Carpenter, DO; Shen, Y; Nguyen, T; Le, L; Lininger, LL. Incidence of endocrine disease among residents of New York areas of concern. Environ Health Perspect 2001, 109(Suppl 6), 845–851. [Google Scholar]
- Krieger, N; Williams, DR; Moss, NE. Measuring social class in US public health research: Concepts, methodologies, and guidelines. Annu. Rev. Public Health 1997, 18, 341–378. [Google Scholar]
- Krieger, N; Chen, JT; Waterman, PD; Rehkopf, DH; Subramanian, SV. Painting a Truer Picture of US Socioeconomic and Racial/Ethnic Health Inequalities: The Public Health Disparities Geocoding Project. Am. J. Public Health 2005, 95, 312–323. [Google Scholar]
- Kouznetsova, M; Huang, X; Ma, J; Lessner, L; Carpenter, DO. Increased rate of hospitalization for diabetes and residential proximity of hazardous waste sites. Environ. Health Perspect 2007, 115, 75–79. [Google Scholar]
- Sergeev, AV; Carpenter, DO. Hospitalization rates for coronary heart disease in relation to residence near areas contaminated with persistent organic pollutants and other pollutants. Environ. Health Perspect 2005, 113, 756–761. [Google Scholar]
- Sergeev, AV; Carpenter, DO. Geospatial patterns of hospitalization rates for stroke with comorbid hypertension in relation to environmental sources of persistent organic pollutants: Results from a 12-year population-based study. Environ. Sci. Pollut. Res. Int. [online] 2010, http://www.springerlink.com/content/r22h2h17752774n7 (accessed on 10 December 2010).
- Sergeev, AV; Carpenter, DO. Increased hospitalizations for ischemic stroke with comorbid diabetes and residential proximity to sources of organic pollutants: A 12-year population-based study. Neuroepidemiology 2010, 35, 196–201. [Google Scholar]
- Philibert, A; Schwartz, H; Mergler, D. An exploratory study of diabetes in a First Nation community with respect to serum concentrations of p,p’-DDE and PCBs and fish consumption. Int. J. Environ. Res. Public Health 2009, 6, 3179–3189. [Google Scholar]
- Codru, N; Schymura, MJ; Negoita, S; Rej, R; Carpenter, DO. Diabetes in relation to serum levels of polychlorinated biphenyls and chlorinated pesticides in adult Native Americans. Environ. Health Perspect 2007, 115, 1442–1447. [Google Scholar]
- Elobeid, MA; Padilla, MA; Brock, DW; Ruden, DM; Allison, DB. Endocrine disruptors and obesity: An examination of selected persistent organic pollutants in the NHANES 1999–2002 data. Int. J. Environ. Res. Public Health 2010, 7, 2988–3005. [Google Scholar]
- Goncharov, A; Haase, RF; Santiago-Rivera, A; Morse, G; McCaffrey, RJ; Rej, R; Carpenter, DO. High serum PCBs are associated with elevation of serum lipids and cardiovascular disease in a Native American population. Environ. Res 2008, 106, 226–239. [Google Scholar]
- Goncharov, A; Bloom, M; Pavuk, M; Birman, I; Carpenter, DO. Blood pressure and hypertension in relation to levels of serum polychlorinated biphenyls in residents of Anniston, Alabama. J. Hypertens 2010, 28, 2053–2060. [Google Scholar]
- Boyd, DR; Genuis, SJ. The environmental burden of disease in Canada: Respiratory disease, cardiovascular disease, cancer, and congenital affliction. Environ. Res 2008, 106, 240–249. [Google Scholar]
- Prüss-Üstün, A; Corvalán, C. World Health Organization. In Preventing Disease through Healthy Environments: Towards an Estimate of the Environmental Burden of Disease; World Health Organization: Geneva, Switzerland, 2006; p. 104. [Google Scholar]
- Chang, JW; Chen, HL; Su, HJ; Liao, PC; Guo, HR; Lee, CC. Simultaneous exposure of non-diabetics to high levels of dioxins and mercury increases their risk of insulin resistance. J. Hazard. Mater 2011, 185, 749–755. [Google Scholar]
- Cranmer, M; Louie, S; Kennedy, RH; Kern, PA; Fonseca, VA. Exposure to 2,3,7,8-tetrachlorodibenzo-p-dioxin (TCDD) is associated with hyperinsulinemia and insulin resistance. Toxicol. Sci 2000, 56, 431–436. [Google Scholar]
- Lang, CH; Dobrescu, C; Bagby, GJ. Tumor necrosis factor impairs insulin action on peripheral glucose disposal and hepatic glucose output. Endocrinology 1992, 130, 43–52. [Google Scholar]
- Uysal, KT; Wiesbrock, SM; Marino, MW; Hotamisligil, GS. Protection from obesity-induced insulin resistance in mice lacking TNF-alpha function. Nature 1997, 389, 610–614. [Google Scholar]
- Hotamisligil, GS. The role of TNFalpha and TNF receptors in obesity and insulin resistance. J. Intern. Med 1999, 245, 621–625. [Google Scholar]
- Enan, E; Liu, PC; Matsumura, F. 2,3,7,8-Tetrachlorodibenzo-p-dioxin causes reduction of glucose transporting activities in the plasma membranes of adipose tissue and pancreas from the guinea pig. J. Biol. Chem 1992, 267, 19785–19791. [Google Scholar]
- Stephens, JM; Lee, J; Pilch, PF. Tumor necrosis factor-alpha-induced insulin resistance in 3T3-L1 adipocytes is accompanied by a loss of insulin receptor substrate-1 and GLUT4 expression without a loss of insulin receptor-mediated signal transduction. J. Biol. Chem 1997, 272, 971–976. [Google Scholar]
- Ruan, H; Hacohen, N; Golub, TR; Van Parijs, L; Lodish, HF. Tumor necrosis factor-alpha suppresses adipocyte-specific genes and activates expression of preadipocyte genes in 3T3-L1 adipocytes: Nuclear factor-kappaB activation by TNF-alpha is obligatory. Diabetes 2002, 51, 1319–1336. [Google Scholar]
- Fujiyoshi, PT; Michalek, JE; Matsumura, F. Molecular epidemiologic evidence for diabetogenic effects of dioxin exposure in U.S. Air force veterans of the Vietnam war. Environ. Health Perspect 2006, 114, 1677–1683. [Google Scholar]
- Michalek, JE; Akhtar, FZ; Kiel, JL. Serum dioxin, insulin, fasting glucose, and sex hormone-binding globulin in veterans of Operation Ranch Hand. J. Clin. Endocrinol. Metab 1999, 84, 1540–1543. [Google Scholar]
- Razzouk, L; Muntner, P. Ethnic, gender, and age-related differences in patients with the metabolic syndrome. Curr. Hypertens. Rep 2009, 11, 127–132. [Google Scholar]
- Jacobson, TA; Case, CC; Roberts, S; Buckley, A; Murtaugh, KM; Sung, JC; Gause, D; Varas, C; Ballantyne, CM. Characteristics of US adults with the metabolic syndrome and therapeutic implications. Diabetes Obes. Metab 2004, 6, 353–362. [Google Scholar]
- Morgenstern, H. Ecologic studies. In Modern Epidemiology, 3rd ed; Rothman, KJ, Greenland, S, Lash, TL, Eds.; Lippincott Williams & Wilkins: Philadelphia, PA, USA, 2008; pp. 511–531. [Google Scholar]
- Baker, D. Study design and methods. In Environmental Epidemiology: Study Methods and Application; Baker, D, Nieuwenhuijsen, M, Eds.; Oxford University Press: New York, NY, USA, 2008; pp. 113–145. [Google Scholar]
- Koepsell, T; Weiss, N. Ecological studies. In Epidemiologic Methods: Studying the Occurrence of Illness; Koepsell, T, Weiss, N, Eds.; Oxford University Press: New York, NY, USA, 2003; pp. 281–307. [Google Scholar]


| Population groups | POP | Non-POP | Total |
|---|---|---|---|
| Race: | |||
| African Americans | 279,804 (25.9) | 802,119 (74.1) | 1,081,923 (100.0) |
| Caucasians | 4,146,579 (24.3) | 12,885,081 (75.7) | 17,031,660 (100.0) |
| Age: | |||
| 25–34 years | 977,889 (25.1) | 2,913,609 (74.9) | 3,891,498 (100.0) |
| 35–44 years | 1,046,424 (24.3) | 3,262,539 (75.7) | 4,308,963 (100.0) |
| 45–54 years | 809,217 (22.9) | 2,717,067 (77.1) | 3,526,284 (100.0) |
| 55–64 years | 607,584 (23.7) | 1,954,566 (76.3) | 2,562,150 (100.0) |
| 65–74 years | 533,748 (25.5) | 1,557,114 (74.5) | 2,090,862 (100.0) |
| 75+ years | 451,521 (26.0) | 1,282,305 (74.0) | 1,733,826 (100.0) |
| Gender: | |||
| males | 2,077,314 (24.3) | 6,470,253 (75.7) | 8,547,567 (100.0) |
| females | 2,349,069 (24.6) | 7,216,947 (75.4) | 9,566,016 (100.0) |
| Total study population | 4,426,383 (24.4) | 13,687,200 (75.6) | 18,113,583 (100.0) |
| Population characteristics | Unadjusted MetS-associated hospital admission rates (95% CI), per 100,000 person-years | Unadjusted RR (95% CI) | p value |
|---|---|---|---|
| Race: | |||
| Caucasians (reference) | 2.30 (2.07–2.53) | 1.0 | |
| African Americans | 1.48 (0.75–2.20) | 0.643 (0.390–1.059) | 0.083 |
| Gender: | |||
| females (reference) | 2.34 (2.03–2.65) | 1.0 | |
| males | 2.15 (1.84–2.46) | 0.919 (0.755–1.116) | 0.398 |
| Age: | |||
| 25–34 years (reference) | 0.31 (0.13–0.48) | 1.0 | <0.01* |
| 35–44 years | 0.79 (0.52–1.05) | 2.559 (1.325–4.942) | |
| 45–54 years | 2.84 (2.28–3.39) | 9.197 (5.053–16.737) | |
| 55–64 years | 4.06 (3.28–4.84) | 13.164 (7.242–23.927) | |
| 65–74 years | 4.07 (3.20–4.93) | 13.184 (7.204–24.129) | |
| 75+ years | 4.21 (3.24–5.18) | 13.654 (7.415–25.143) | |
| Income (quartiles of median household income): | |||
| quartile 1 (reference) | 4.61 (3.76–5.47) | 1.0 | <0.01* |
| quartile 2 | 2.91 (2.34–3.49) | 0.632 (0.480–0.827) | |
| quartile 3 | 2.90 (2.47–3.33) | 0.629 (0.499–0.804) | |
| quartile 4 | 1.54 (1.28–1.80) | 0.333 (0.259–0.430) | |
| Population characteristics | Unadjusted MetS-associated hospital admission rates (95% CI), per 100,000 person-years | Unadjusted RR (95% CI) | p value |
|---|---|---|---|
| Race: | |||
| African Americans | |||
| non-POP (reference) | 1.37 (0.56–2.18) | 1.0 | |
| POP | 1.79 (0.22–3.35) | 1.303 (0.268–3.360) | 0.623 |
| Caucasians | |||
| non-POP (reference) | 2.09 (1.84–2.34) | 1.0 | |
| POP | 2.97 (2.44–3.49) | 1.421 (1.137–1.746) | <0.001 |
| Gender: | |||
| females | |||
| non-POP (reference) | 2.04 (1.71–2.37) | 1.0 | |
| POP | 3.28 (2.55–4.10) | 1.609 (1.204–2.099) | <0.01 |
| males | |||
| non-POP (reference) | 2.06 (1.71–2.40) | 1.0 | |
| POP | 2.46 (1.78–3.13) | 1.194 (0.840–1.618) | 0.280 |
| Age: | |||
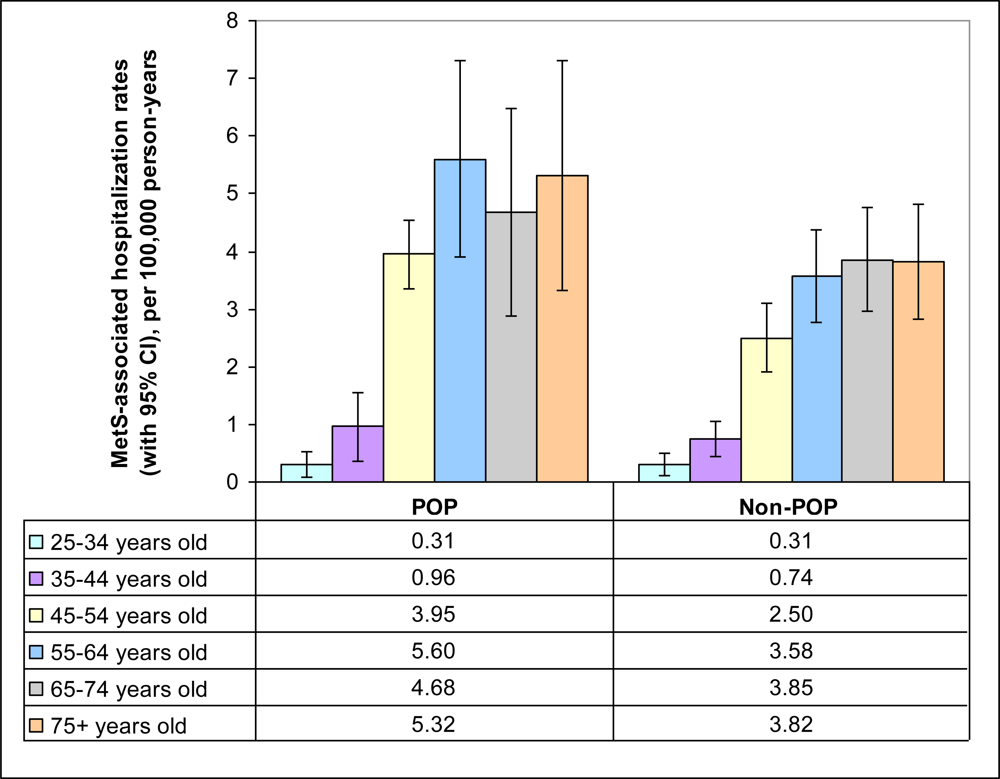
| 25–34 years | |||
| non-POP (reference) | 0.31 (0.11–0.51) | 1.0 | |
| POP | 0.31 (0.06–0.65) | 0.993 (0.015–2.920) | 0.992 |
| 35–44 years | |||
| non-POP (reference) | 0.74 (0.44–1.03) | 1.0 | |
| POP | 0.96 (0.36–1.55) | 1.299 (0.512–2.523) | 0.486 |
| 45–54 years | |||
| non-POP (reference) | 2.50 (1.91–3.10) | 1.0 | |
| POP | 3.95 (2.58–5.32) | 1.580 (0.995–2.347) | 0.186 |
| 55–64 years | |||
| non-POP (reference) | 3.58 (2.74–4.42) | 1.0 | |
| POP | 5.60 (3.71–7.48) | 1.563 (0.998–2.302) | 0.186 |
| 65–74 years | |||
| non-POP (reference) | 3.85 (2.88–4.83) | 1.0 | |
| POP | 4.68 (2.85–6.52) | 1.216 (0.717–1.873) | 0.411 |
| 75+ years | |||
| non-POP (reference) | 3.82 (2.75–4.89) | 1.0 | |
| POP | 5.32 (3.19–7.44) | 1.391 (0.806–2.200) | 0.183 |
| Parameter | β coefficient | Standard error | Multivariable adjusted RR (95% CI) | p value |
|---|---|---|---|---|
| POP (compared to non-POP)1 | 0.331 | 0.153 | 1.392 (1.032–1.879) | 0.030 |
| African Americans (compared to Caucasians)2 | –0.188 | 0.366 | 0.829 (0.404–1.700) | 0.609 |
| Males (compared to females)3 | 0.003 | 0.144 | 1.003 (0.757–1.328) | 0.984 |
| Age (compared to 25–34 years)4 | <0.001* | |||
| 35–44 years | 0.928 | 0.481 | 2.530 (0.985–6.497) | |
| 45–54 years | 2.181 | 0.438 | 8.857 (3.754–20.897) | |
| 55–64 years | 2.523 | 0.437 | 12.461 (5.290–29.353) | |
| 65–74 years | 2.531 | 0.442 | 12.560 (5.278–29.886) | |
| 75+ years | 2.568 | 0.447 | 13.042 (5.427–31.350) | |
© 2011 by the authors; licensee MDPI, Basel, Switzerland This article is an open-access article distributed under the terms and conditions of the Creative Commons Attribution license (http://creativecommons.org/licenses/by/3.0/).
Share and Cite
Sergeev, A.V.; Carpenter, D.O. Increase in Metabolic Syndrome-Related Hospitalizations in Relation to Environmental Sources of Persistent Organic Pollutants. Int. J. Environ. Res. Public Health 2011, 8, 762-776. https://doi.org/10.3390/ijerph8030762
Sergeev AV, Carpenter DO. Increase in Metabolic Syndrome-Related Hospitalizations in Relation to Environmental Sources of Persistent Organic Pollutants. International Journal of Environmental Research and Public Health. 2011; 8(3):762-776. https://doi.org/10.3390/ijerph8030762
Chicago/Turabian StyleSergeev, Alexander V., and David O. Carpenter. 2011. "Increase in Metabolic Syndrome-Related Hospitalizations in Relation to Environmental Sources of Persistent Organic Pollutants" International Journal of Environmental Research and Public Health 8, no. 3: 762-776. https://doi.org/10.3390/ijerph8030762