Trichloroethylene and Cancer: Systematic and Quantitative Review of Epidemiologic Evidence for Identifying Hazards

Abstract
:1. Introduction
2. Methods
2.1. Study Selection and Data Extraction
2.2. Statistical Methods
3. Results
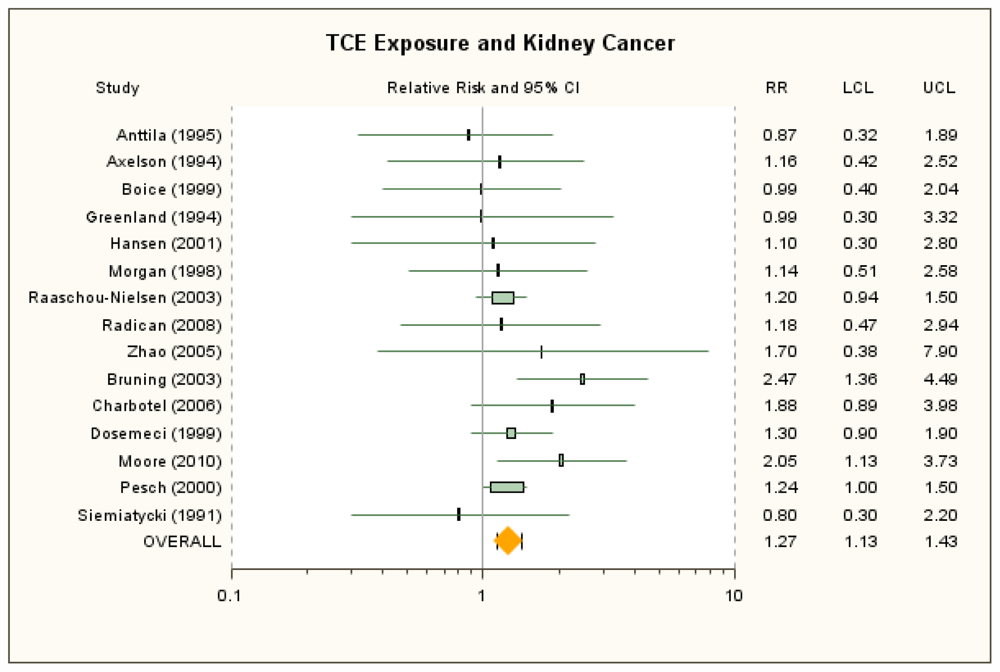
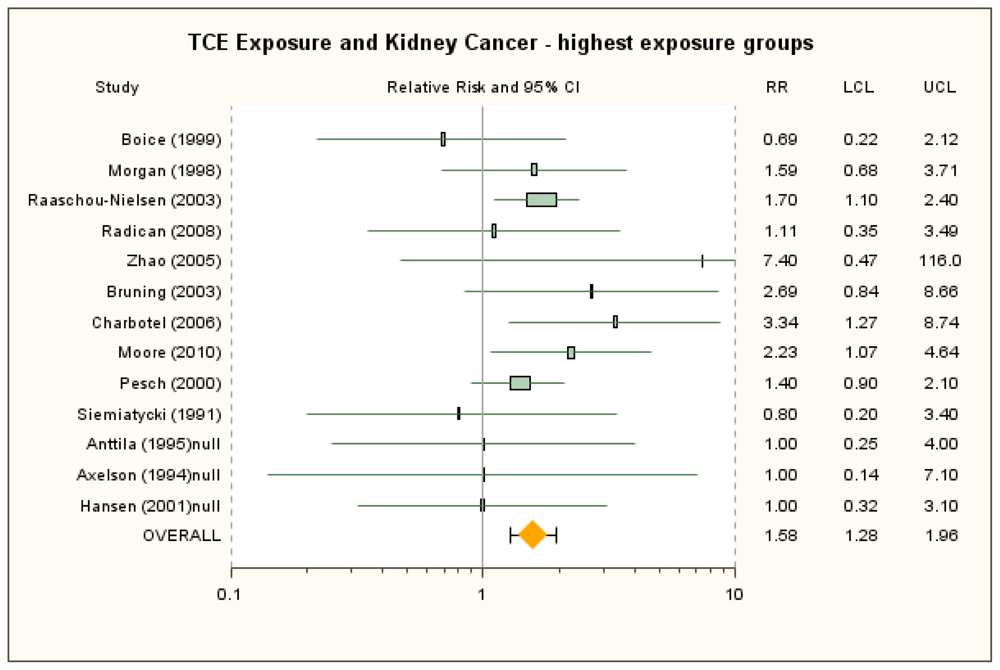
3.1. Kidney Cancer
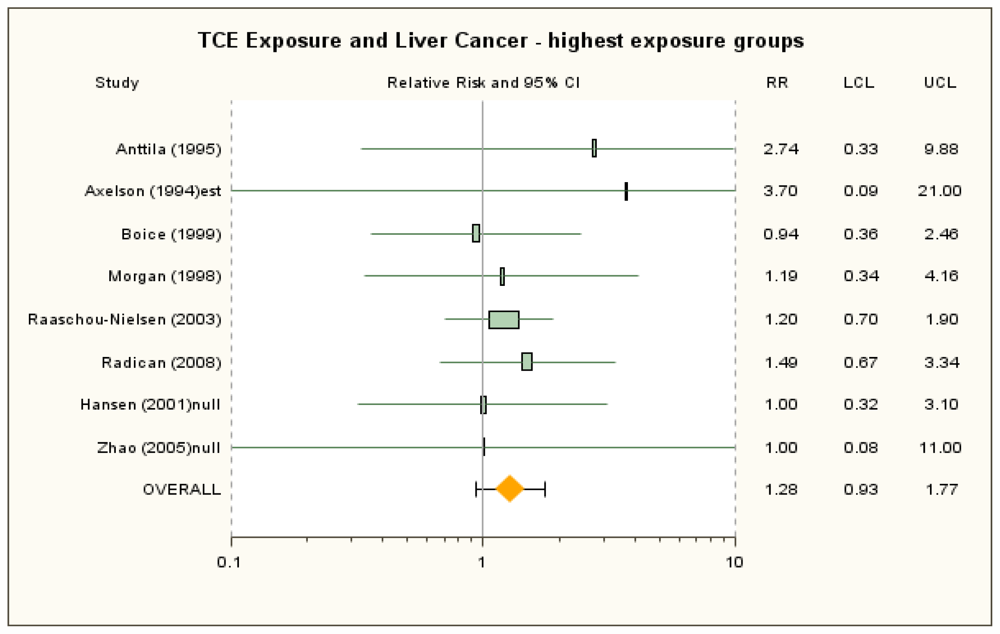
3.2. Liver Cancer
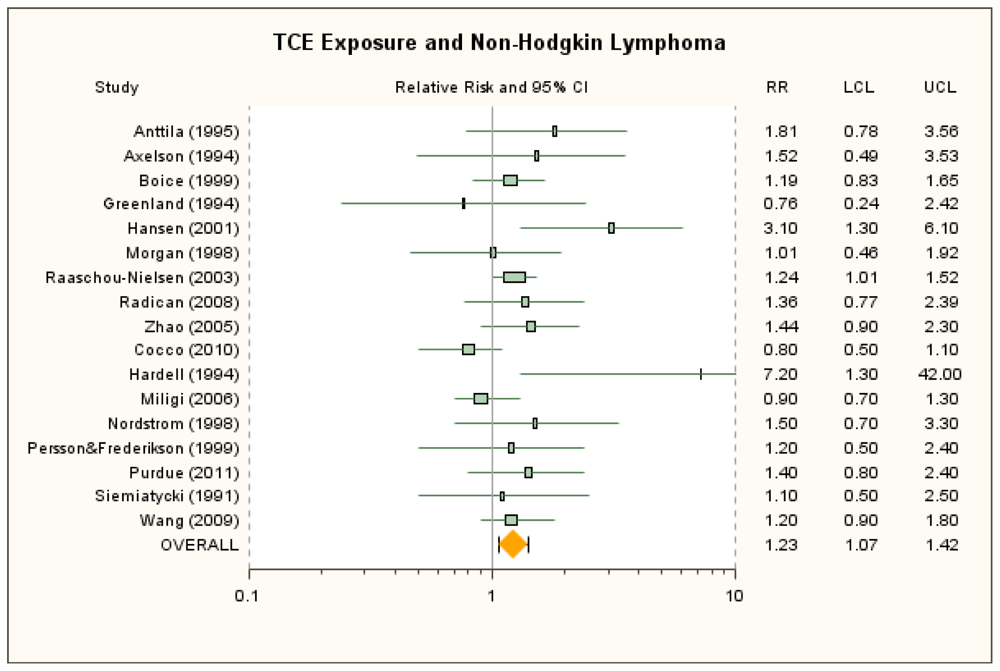
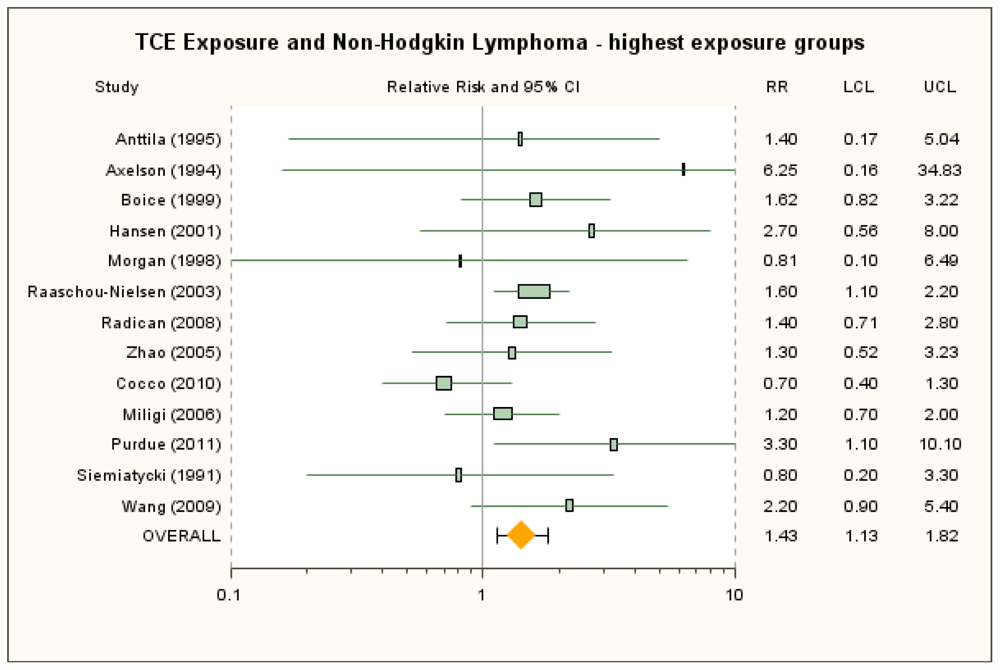
3.3. Non-Hodgkin Lymphoma
4. Discussion
Supplementary Material
ijerph-08-04238-s001.docAcknowledgements
- Sources of Financial SupportNo external sources of funding were used for analysis or preparation of manuscript.
- DisclaimerThe views expressed in this article are those of the authors and do not necessarily reflect the views or policies of the U.S. Environmental Protection Agency.
References
- International Agency for Research on Cancer (IARC), Monographs on the Evaluation of Carcinogenic Risks to Humans. Dry Cleaning, Some Chlorinated Solvents and Other Industrial Chemicals; International Agency for Research on Cancer: Lyon, France, 1995; Volume 63.
- National Toxicology Program (NTP). 11th report on carcinogens. Rep. Carcinog. 2005, 1-A32.
- Ruden, C. Principles and practices of health risk assessment under current EU regulations. Regul. Toxicol. Pharmacol. 2006, 44, 14–23. [Google Scholar]
- Scott, C.S.; Chiu, W.A. Trichloroethylene cancer epidemiology: A consideration of select issues. Environ. Health Perspect. 2006, 114, 1471–1478. [Google Scholar]
- National Research Council (NRC), Contaminated Water Supplies at Camp Lejeune—Assessing Potential Health Effects; The National Academies Press: Washington, DC, USA, 2009.
- National Research Council (NRC), Assessing the Human Health Risks of Trichloroethylene: Key Scientific Issues; The National Academies Press: Washington, DC, USA, 2006.
- Ward, E.M.; Schulte, P.A.; Straif, K.; Hopf, N.B.; Caldwell, J.C.; Carreon, T.; Demarini, D.M.; Fowler, B.A.; Goldstein, B.D.; Hemminki, K.; et al. Research recommendations for selected IARC-classified agents. Environ. Health Perspect. 2010, 118, 1355–1362. [Google Scholar]
- Blair, A.; Burg, J.; Foran, J.; Gibb, H.; Greenland, S.; Morris, R.; Raabe, G.; Savitz, D.; Teta, J.; Wartenberg, D. Guidelines for application of meta-analysis in environmental epidemiology. Regul. Toxicol. Pharmacol. 1995, 22, 189–197. [Google Scholar]
- Stroup, D.F.; Berlin, J.A.; Morton, S.C.; Olkin, I.; Williamson, G.D.; Rennie, D.; Moher, D.; Becker, B.J.; Sipe, T.A.; Thacker, S.B. Meta-analysis of observational studies in epidemiology: A proposal for reporting. Meta-analysis of observational studies in epidemiology (MOOSE) group. JAMA 2000, 283, 2008–2012. [Google Scholar]
- Vandenbroucke, J.P.; von Elm, E.; Altman, D.G.; Gotzsche, P.C.; Mulrow, C.D.; Pocock, S.J.; Poole, C.; Schlesselman, J.J.; Egger, M. Strengthening the reporting of observational studies in epidemiology (STROBE): Explanation and elaboration. Epidemiology 2007, 18, 805–835. [Google Scholar]
- National Cancer Institute (NCI), Carcinogenesis Bioassay of Trichloroethylene, NCI-CG-TR-2. In Technical Report Series; NCI: Bethesda, MD, USA, 1976.
- NTP, Toxicology and Carcinogenesis Studies of Trichloroethylene (CAS No. 79-01-6) in Four Strains of Rats (ACI, August, Marshall, Osborne-Mendel) (Gavage Studies). In Technical Report Series; NTP: Research Triangle Park, NC, USA, 1988.
- NTP, Carcinogenesis Studies of Trichloroethylene (without Epichlorohydrin) in F344/N Rats and B6C3F1 Mice (Gavage Studies). In Technical Report Series; NTP: Research Triangle Park, NC, USA, 1990.
- Alexander, D.D.; Kelsh, M.A.; Mink, P.J.; Mandel, J.H.; Basu, R.; Weingart, M. A meta-analysis of occupational trichloroethylene exposure and liver cancer. Int. Arch. Occup. Environ. Health 2007, 81, 127–143. [Google Scholar]
- Alexander, D.D.; Mink, P.J.; Mandel, J.H.; Kelsh, M.A. A meta-analysis of occupational trichloroethylene exposure and multiple myeloma or leukaemia. Occup. Med. (Lond.) 2006, 56, 485–493. [Google Scholar]
- Kelsh, M.A.; Alexander, D.D.; Mink, P.J.; Mandel, J.H. Occupational trichloroethylene exposure and kidney cancer: A meta-analysis. Epidemiology 2010, 21, 95–102. [Google Scholar]
- Kelsh, M.A.; Weingart, M.; Mandel, J.H.; Mink, P.; Alexander, D.; Basu, R.; Kalmes, R.; Goodman, M. A meta-analysis of epidemiology studies of occupational TCE exposure and selected cancers. Presented at the Third Meeting on Assessing Human Health Risks of Trichloroethylene, Irvine, CA, USA; 2005. [Google Scholar]
- Mandel, J.H.; Kelsh, M.A.; Mink, P.J.; Alexander, D.D.; Kalmes, R.M.; Weingart, M.; Yost, L.; Goodman, M. Occupational trichloroethylene exposure and non-Hodgkin’s lymphoma: A meta-analysis and review. Occup. Environ. Med. 2006, 63, 597–607. [Google Scholar]
- Wartenberg, D.; Reyner, D.; Scott, C.S. Trichloroethylene and cancer: Epidemiologic evidence. Environ. Health Perspect. 2000, 108 Suppl 2, 161–176. [Google Scholar]
- Miligi, L.; Costantini, A.S.; Benvenuti, A.; Kriebel, D.; Bolejack, V.; Tumino, R.; Ramazzotti, V.; Rodella, S.; Stagnaro, E.; Crosignani, P.; et al. Occupational exposure to solvents and the risk of lymphomas. Epidemiology 2006, 17, 552–561. [Google Scholar]
- Cocco, P.; t’Mannetje, A.; Fadda, D.; Melis, M.; Becker, N.; de Sanjose, S.; Foretova, L.; Mareckova, J.; Staines, A.; Kleefeld, S.; et al. Occupational exposure to solvents and risk of lymphoma subtypes: Results from the Epilymph case-control study. Occup. Environ. Med. 2010, 67, 341–347. [Google Scholar]
- Purdue, M.P.; Bakke, B.; Stewart, P.; De Roos, A.J.; Schenk, M.; Lynch, C.F.; Bernstein, L.; Morton, L.M.; Cerhan, J.R.; Severson, R.K.; et al. A case-control study of occupational exposure to trichloroethylene and non-Hodgkin lymphoma. Environ. Health Perspect. 2011, 119, 232–238. [Google Scholar]
- Wang, R.; Zhang, Y.; Lan, Q.; Holford, T.R.; Leaderer, B.; Zahm, S.H.; Boyle, P.; Dosemeci, M.; Rothman, N.; Zhu, Y.; et al. Occupational exposure to solvents and risk of non-Hodgkin lymphoma in Connecticut women. Am. J. Epidemiol. 2009, 169, 176–185. [Google Scholar]
- Moore, L.E.; Boffetta, P.; Karami, S.; Brennan, P.; Stewart, P.S.; Hung, R.; Zaridze, D.; Matveev, V.; Janout, V.; Kollarova, H.; et al. Occupational trichloroethylene exposure and renal carcinoma risk: Evidence of genetic susceptibility by reductive metabolism gene variants. Cancer Res. 2010, 70, 6527–6536. [Google Scholar]
- Zhao, Y.; Krishnadasan, A.; Kennedy, N.; Morgenstern, H.; Ritz, B. Estimated effects of solvents and mineral oils on cancer incidence and mortality in a cohort of aerospace workers. Am. J. Ind. Med. 2005, 48, 249–258. [Google Scholar]
- Boice, J.D., Jr; Marano, D.E.; Cohen, S.S.; Mumma, M.T.; Blot, W.J.; Brill, A.B.; Fryzek, J.P.; Henderson, B.E.; McLaughlin, J.K. Mortality among Rocketdyne workers who tested rocket engines, 1948–1999. J. Occup. Environ. Med. 2006, 48, 1070–1092. [Google Scholar]
- Radican, L.; Blair, A.; Stewart, P.; Wartenberg, D. Mortality of aircraft maintenance workers exposed to trichloroethylene and other hydrocarbons and chemicals: Extended follow-up. J. Occup. Environ. Med. 2008, 50, 1306–1319. [Google Scholar]
- Institute of Medicine (IOM), Gulf War and Health. Insecticides and Solvents; The National Academies Press: Washington, DC, USA, 2003; Volume 2.
- Altekruse, S.F.; Kosary, C.L.; Krapcho, M.; Neyman, N.; Aminou, R.; Waldron, W.; Ruhl, J.; Howlader, N.; Tatalovich, Z.; Cho, H.; et al. Surveillance, Epidemiology, End Results (SEER) Cancer Statistics Review, 1975–2007; National Cancer Institute: Bethesda, MD, USA, 2010. Available online: http://seer.cancer.gov/csr/1975_2007/ accessed on 30 March 2011.
- DerSimonian, R.; Laird, N. Meta-analysis in clinical trials. Control Clin. Trials 1986, 7, 177–188. [Google Scholar]
- Rothman, K.J.; Greenland, S. Modern Epidemiology, 2nd Edition ed; Lippincott Williams & Wilkins: Philedelphia, PA, USA, 1998. [Google Scholar]
- Breslow, N.E.; Day, N.E. Statistical Methods in Cancer Research. Volume II—The Design and Analysis of Cohort Studies; International Agency for Research on Cancer: Lyon, France, 1987. [Google Scholar]
- Woolf, B. On estimating the relation between blood group and disease. Ann. Hum. Genet. 1955, 19, 251–253. [Google Scholar]
- Breslow, N.E.; Day, N.E. Statistical Methods in Cancer Research. Volume I—The Analysis of Case-Control Studies; International Agency for Research on Cancer: Lyon, France, 1980. [Google Scholar]
- Higgins, J.P.; Thompson, S.G.; Deeks, J.J.; Altman, D.G. Measuring inconsistency in meta-analyses. BMJ 2003, 327, 557–560. [Google Scholar] [Green Version]
- Duval, S.; Tweedie, R. Trim and fill: A simple funnel-plot-based method of testing and adjusting for publication bias in meta-analysis. Biometrics 2000, 56, 455–463. [Google Scholar]
- Axelson, O.; Selden, A.; Andersson, K.; Hogstedt, C. Updated and expanded Swedish cohort study on trichloroethylene and cancer risk. J. Occup. Med. 1994, 36, 556–562. [Google Scholar]
- Anttila, A.; Pukkala, E.; Sallmen, M.; Hernberg, S.; Hemminki, K. Cancer incidence among Finnish workers exposed to halogenated hydrocarbons. J. Occup. Environ. Med. 1995, 37, 797–806. [Google Scholar]
- Hansen, J.; Raaschou-Nielsen, O.; Christensen, J.M.; Johansen, I.; McLaughlin, J.K.; Lipworth, L.; Blot, W.J.; Olsen, J.H. Cancer incidence among Danish workers exposed to trichloroethylene. J. Occup. Environ. Med. 2001, 43, 133–139. [Google Scholar]
- Raaschou-Nielsen, O.; Hansen, J.; McLaughlin, J.K.; Kolstad, H.; Christensen, J.M.; Tarone, R.E.; Olsen, J.H. Cancer risk among workers at Danish companies using trichloroethylene: A cohort study. Am. J. Epidemiol. 2003, 158, 1182–1192. [Google Scholar]
- Boice, J.D., Jr; Marano, D.E.; Fryzek, J.P.; Sadler, C.J.; McLaughlin, J.K. Mortality among aircraft manufacturing workers. Occup. Environ. Med. 1999, 56, 581–597. [Google Scholar]
- Greenland, S.; Salvan, A.; Wegman, D.H.; Hallock, M.F.; Smith, T.J. A case-control study of cancer mortality at a transformer-assembly facility. Int. Arch. Occup. Environ. Health 1994, 66, 49–54. [Google Scholar]
- Morgan, R.W.; Kelsh, M.A.; Zhao, K.; Heringer, S. Mortality of aerospace workers exposed to trichloroethylene. Epidemiology 1998, 9, 424–431. [Google Scholar]
- Blair, A.; Hartge, P.; Stewart, P.A.; McAdams, M.; Lubin, J. Mortality and cancer incidence of aircraft maintenance workers exposed to trichloroethylene and other organic solvents and chemicals: Extended follow up. Occup. Environ. Med. 1998, 55, 161–171. [Google Scholar]
- Rothman, K.J.; Greenland, S.; Lash, T.L. Modern Epidemiology, 3rd Edition ed; Wolters Kluwer, Lippincott Williams and Wilkins: Philadelphia, PA, USA, 2008. [Google Scholar]
- Hardell, L.; Eriksson, M.; Degerman, A. Exposure to phenoxyacetic acids, chlorophenols, or organic solvents in relation to histopathology, stage, and anatomical localization of non-Hodgkin’s lymphoma. Cancer Res. 1994, 54, 2386–2389. [Google Scholar]
- Nordstrom, M.; Hardell, L.; Magnuson, A.; Hagberg, H.; Rask-Andersen, A. Occupational exposures, animal exposure and smoking as risk factors for hairy cell leukaemia evaluated in a case-control study. Br. J. Cancer 1998, 77, 2048–2052. [Google Scholar]
- Persson, B.; Fredrikson, M. Some risk factors for non-Hodgkin’s lymphoma. Int .J. Occup. Med. Environ. Health 1999, 12, 135–142. [Google Scholar]
- Bruning, T.; Pesch, B.; Wiesenhutter, B.; Rabstein, S.; Lammert, M.; Baumuller, A.; Bolt, H.M. Renal cell cancer risk and occupational exposure to trichloroethylene: Results of a consecutive case-control study in Arnsberg, Germany. Am. J. Ind. Med. 2003, 43, 274–285. [Google Scholar]
- Charbotel, B.; Fevotte, J.; Hours, M.; Martin, J.L.; Bergeret, A. Case-control study on renal cell cancer and occupational exposure to trichloroethylene. Part II: Epidemiological aspects. Ann. Occup. Hyg. 2006, 50, 777–787. [Google Scholar]
- Dosemeci, M.; Cocco, P.; Chow, W.H. Gender differences in risk of renal cell carcinoma and occupational exposures to chlorinated aliphatic hydrocarbons. Am. J. Ind. Med. 1999, 36, 54–59. [Google Scholar]
- Pesch, B.; Haerting, J.; Ranft, U.; Klimpel, A.; Oelschlagel, B.; Schill, W. Occupational risk factors for renal cell carcinoma: Agent-specific results from a case-control study in Germany. MURC study group. Multicenter urothelial and renal cancer study. Int. J. Epidemiol. 2000, 29, 1014–1024. [Google Scholar]
- Siemiatycki, J. Risk Factors for Cancer in the Workplace; CRC Press: Boca Raton, FL, USA, 1991. [Google Scholar]
- Ikeda, M.; Otsuji, H.; Imamura, T.; Komoike, Y. Urinary excretion of total trichloro-compounds, trichloroethanol, and trichloroacetic acid as a measure of exposure to trichloroethylene and tetrachloroethylene. Br. J. Ind. Med. 1972, 29, 328–333. [Google Scholar]
- Pannett, B.; Coggon, D.; Acheson, E.D. A job-exposure matrix for use in population based studies in England and Wales. Br. J. Ind. Med. 1985, 42, 777–783. [Google Scholar]
- Gomez, M.R.; Cocco, P.; Dosemeci, M.; Stewart, P.A. Occupational exposure to chlorinated aliphatic hydrocarbons: Job exposure matrix. Am. J. Ind. Med 1994, 26, 171–183. [Google Scholar]
- Morgan, R.W.; Kelsh, M.A.; Zhao, K.; Heringer, S. Final Report “Cohort Mortality Study of Aerospace Workers with Exposure to Trichloroethylene.”. Letter from Paul A. Cammer, Ph.D., Trichloroethylene Issues Group, to Cheryl Siegel Scott, US EPA, ID 645806; US EPA, Health and Environmental Reserach Online (HERO): Durham, NC, USA, 1997. Available online: http://hero.epa.gov/index.cfm?heroid=645806&action=search.do&submit=Search&portal=true&sort=year&all=&exact=&any=&author=&journal=&singleyear=&startyear=&endyear= accessed on 30 August 2011.
- Bruning, T.; Weirich, G.; Hornauer, M.A.; Hofler, H.; Brauch, H. Renal cell carcinomas in trichloroethene (TRI) exposed persons are associated with somatic mutations in the von Hippel-Lindau (VHL) tumour suppressor gene. Arch. Toxicol. 1997, 71, 332–335. [Google Scholar]
- Pesch, B. Correspondence from Beate Pesch, Ph.D., BGFA—Research Institute of Occupational Medicine to Cheryl Siegel Scott, US EPA, ID 783486; US EPA, Health and Environmental Reserach Online (HERO): Durham, NC, USA, 2008. Available online: http://hero.epa.gov/index.cfm?heroid=783486&action=search.do&submit=Search&portal=true&sort=year&all=&exact=&any=&author=&journal=&singleyear=&startyear=&endyear= accessed on 30 August 2011.
- Environmental Protection Agency (US EPA), Toxicological Review of Trichloroethylene (CAS No. 79-01-6) in Support of Summary Information on the Integrated Risk Information System (IRIS), EPA/635/R-09/011F; EPA: Washington, DC, USA, 2011.
- Vlaanderen, J.; Portengen, L.; Rothman, N.; Lan, Q.; Kromhout, H.; Vermeulen, R. Flexible meta-regression to assess the shape of the benzene-leukemia exposure-response curve. Environ. Health Perspect. 2010, 118, 526–532. [Google Scholar]
- Henschler, D.; Vamvakas, S.; Lammert, M.; Dekant, W.; Kraus, B.; Thomas, B.; Ulm, K. Increased incidence of renal cell tumors in a cohort of cardboard workers exposed to trichloroethene. Arch. Toxicol. 1995, 69, 291–299. [Google Scholar]
- Vamvakas, S.; Bruning, T.; Thomasson, B.; Lammert, M.; Baumuller, A.; Bolt, H.M.; Dekant, W.; Birner, G.; Henschler, D.; Ulm, K. Renal cell cancer correlated with occupational exposure to trichloroethene. J. Cancer Res. Clin. Oncol. 1998, 124, 374–382. [Google Scholar]
- Steinmaus, C.; Smith, A.H.; Jones, R.M.; Smith, M.T. Meta-analysis of benzene exposure and non-Hodgkin lymphoma: Biases could mask an important association. Occup. Environ. Med. 2008, 65, 371–378. [Google Scholar]
- Vlaanderen, J.; Lan, Q.; Kromhout, H.; Rothman, N.; Vermeulen, R. Occupational benzene exposure and the risk of lymphoma subtypes: A meta-analysis of cohort studies incorporating three study quality dimensions. Environ. Health Perspect. 2011, 119, 159–167. [Google Scholar]
- Zhang, L.; Steinmaus, C.; Eastmond, D.A.; Xin, X.K.; Smith, M.T. Formaldehyde exposure and leukemia: A new meta-analysis and potential mechanisms. Mutat. Res. 2009, 681, 150–168. [Google Scholar]
- Vardiman, J.W. The World Health Organization (WHO) classification of tumors of the hematopoietic and lymphoid tissues: An overview with emphasis on the myeloid neoplasms. Chem. Biol. Interact. 2010, 184, 16–20. [Google Scholar]
- Chow, W.H.; Dong, L.M.; Devesa, S.S. Epidemiology and risk factors for kidney cancer. Nat. Rev. Urol. 2010, 7, 245–257. [Google Scholar]
- IARC, Tobacco Smoke and Involuntary Smoking; International Agency for Research on Cancer: Lyon, France, 2004; Volume 83.
- Charbotel, B.; Fevotte, J.; Martin, J.L.; Bergeret, A. Renal cell carcinoma and exposure to trichloroethylene: Are the French limits of occupational exposure relevant? Rev. Epidemiol. Sante Publique 2009, 57, 41–47. [Google Scholar]
- Karami, S.; Boffetta, P.; Brennan, P.; Stewart, P.A.; Zaridze, D.; Matveev, V.; Janout, V.; Kollarova, H.; Bencko, V.; Navratilova, M.; et al. Renal cancer risk and occupational exposure to polycyclic aromatic hydrocarbons and plastics. J. Occup. Environ. Med. 2011, 53, 218–223. [Google Scholar]
- Calvert, G.M.; Ward, E.; Schnorr, T.M.; Fine, L.J. Cancer risks among workers exposed to metalworking fluids: A systematic review. Am. J. Ind. Med. 1998, 33, 282–292. [Google Scholar]
- Mirer, F.E. New evidence on the health hazards and control of metalworking fluids since completion of the OSHA advisory committee report. Am. J. Ind. Med. 2010, 53, 792–801. [Google Scholar]
- Venook, A.P.; Papandreou, C.; Furuse, J.; de Guevara, L.L. The incidence and epidemiology of hepatocellular carcinoma: A global and regional perspective. Oncologist 2010, 15 Suppl 4, 5–13. [Google Scholar]
- El-Serag, H.B. Epidemiology of hepatocellular carcinoma in USA. Hepatol. Res. 2007, 37 Suppl 2, S88–S94. [Google Scholar]
- Alexander, D.D.; Mink, P.J.; Adami, H.O.; Chang, E.T.; Cole, P.; Mandel, J.S.; Trichopoulos, D. The non-Hodgkin lymphomas: A review of the epidemiologic literature. Int. J. Cancer 2007, 120 Suppl 12, 1–39. [Google Scholar]
- Morton, L.M.; Hartge, P.; Holford, T.R.; Holly, E.A.; Chiu, B.C.; Vineis, P.; Stagnaro, E.; Willett, E.V.; Franceschi, S.; La Vecchia, C.; et al. Cigarette smoking and risk of non-Hodgkin lymphoma: A pooled analysis from the International Lymphoma Epidemiology Consortium (INTERLYMPH). Cancer Epidemiol. Biomarkers Prev. 2005, 14, 925–933. [Google Scholar]
- Lan, Q.; Zhang, L.; Tang, X.; Shen, M.; Smith, M.T.; Qiu, C.; Ge, Y.; Ji, Z.; Xiong, J.; He, J.; et al. Occupational exposure to trichloroethylene is associated with a decline in lymphocyte subsets and soluble CD27 and CD30 markers. Carcinogenesis 2010, 31, 1592–1596. [Google Scholar]


| Reference | Study Design | Study population and size | Outcome and Sites Examined | Exposure assessment and exposure surrogate | |
|---|---|---|---|---|---|
| Anttila et al. [38] | C | Finnish workers (n = 3,974) biologically monitored using U-TCA (n = 3,089), 1965–1982, FU 1965–1991 (M), 1967–1992 (I). | I, M | K, L, NHL | Subjects from several industries, primarily metal. Using the Ikeda et al. [54] relationship for TCE exposure to U-TCA, TCE exposures were roughly 4 ppm (median) and 6 ppm (mean). Overall TCE exposure, mean U-TCA, years since 1st U-TCA measurement. |
| Axelson et al. [37] | C | Swedish workers biologically monitored using U-TCA (n = 1,670), 1955–1975, FU 1958–1987 (I). | I | K, L, NHL | Roughly ¾ of cohort had U-TCA concentrations equivalent to <20 ppm TCE. Overall TCE exposure mean U-TCA, years since 1st biological monitoring measurement. |
| Boice et al. [41] | C | Aircraft-manufacturing workers with ≥1 year at Lockheed Martin (Burbank, CA) (n = 77,965; 2,267 with routine TCE; 3,176 with intermittent TCE), FU 1960–1996. | M | K, L, NHL | TCE subcohort. JEM for potential TCE exposure for (1) routine or (2) intermittent or routine basis without semi-quantitative intensity estimate. Overall TCE exposure, exposure duration. |
| Boice et al. [26] | C | Aerospace workers with ≥6 months employment at Rockwell/ Rocketdyne (Santa Susana Field Laboratory and nearby facilities) (n = 41,351; 1,111 with TCE exposure), FU 1948–1999. Overlaps cohort of Zhao et al. [25]. | M | K, L, NHL | TCE subcohort. Potential TCE exposure assigned to test-stand workers whose tasks included the cleaning or flushing of rocket engines (engine flush) (n = 639 subjects) or for general utility cleaning (n = 472). JEM for TCE without semi-quantitative intensity estimates. Vapor degreasing with TCE before 1966 and PCE afterwards. Overall TCE exposure, exposure duration. |
| Brüning et al. [49] | CC | Histologically confirmed RCC (n = 134), from hospitals (Arnsberg, Germany), 1992−2000; hospital controls (n = 401). | I | K (RCC) | Self-reported exposure and JEM of Pannett et al. [55] to assign cumulative exposure to TCE and PCE. Cumulative exposure, exposure duration. |
| Charbotel et al. [50] | CC | RCC (n = 87), from urologists’ files and area teaching hospitals (Arve Valley region, France), 1993–2003; urologist or general practitioner patient controls (n = 316). | I | K (RCC) | Semi-quantitative cumulative TCE exposure and presence/absence of peak TCE exposure assigned to subjects using a JTEM designed using information obtained from questionnaires and routine atmospheric monitoring of workshops or biological monitoring (U-TCA) of workers carried out since the 1960s. Cumulative exposure (low, 62.4 ppm-year; medium, 253.2 ppm-year; high, 925.0 ppm-year), cumulative exposure + peaks. |
| Cocco et al. [21] | CC | Histologically confirmed NHL from 7 European countries (Czech Republic, Finland, France, Germany, Ireland, Italy, and Spain) (n = 2,348), 1998−2004; hospital (4 participating countries) or population controls (all others) (n = 2,462). | I | NHL | IH assessment of 43 agents, including TCE, by confidence, exposure intensity, and exposure frequency, in each participating center. Overall TCE exposure, cumulative TCE exposure for subjects assessed with high degree of confidence. |
| Dosemeci et al. [51] | CC | Histologically confirmed RCC (n = 438), 1988−1990, Minnesota Cancer Registry; controls identified using RDD or, if ≥65 years, from HCFA records (n = 687). | I | K (RCC) | Occupational history of TCE exposure using job title and JEM of Gomez et al. [56]. Overall TCE exposure. |
| Greenland et al. [42] | Nested CC | Cancer deaths among pensioned workers, GE transformer plant (Pittsfield, MA) (n = 12 kidney, 9 liver and biliary, 15 NHL), 1969–1984; controls were non-cancer deaths among pensioned workers (n = 1,202). | M | K, L, NHL | IH assessment from interviews and position descriptions. TCE (no/any exposure) assigned to individual subjects using JEM. Overall TCE exposure. |
| Hansen et al. [39] | C | Workers biologically monitored using U-TCA and air-TCE (n = 803), 1947–1989, FU 1968–1998. | I | K, L, NHL | U-TCA from 1947−1989; air TCE measurements from 1974. Overall, TCE exposure to cohort as extrapolated from air TCE and U-TCA measurements, using Ikeda et al. [54], was 4 ppm (median) and 12 ppm (mean). Overall TCE exposure, year 1st employed, employment duration, mean exposure, cumulative exposure. |
| Hardell et al. [46] | CC | Histologically confirmed cases of NHL in males from Swedish (Umea) hospital (n = 105), 1974−1978; population controls or, if case deceased, from causes-of-death registry (n = 335). | I | NHL | Self-reported overall TCE exposure. |
| Miligi et al. [20] | CC | NHL, including CLL, cases (n = 1,428) identified through surveys of hospital and pathology departments or specialized hematology centers in 8 areas in Italy, 1991−1993; population controls (n = 1,530). | I | NHL+ CLL | TCE exposure assigned using JEM and assessed using exposure probability, intensity and duration. TCE exposure intensity, exposure duration. |
| Moore et al. [24] | CC | Histologically confirmed RCC identified in hospitals in four European countries (Czech Republic, Poland, Romania, Russia) (n = 1,097), 1999−2003; hospital controls with diagnoses unrelated to smoking or genitourinary disorders (n = 1,476). | I | K (RCC) | Specialized job-specific questionnaire for specific jobs or industries of interest focused on solvent exposures, includingTCE, with exposure assignment by frequency, intensity and confidence of TCE exposure. Overall TCE exposure, duration (total hours, years), cumulative exposure (cases: 0, 0.83, 1.95, 7.25 ppm-years for 25th percentile, median, and 75th percentile) and average intensity (cases: 0, 0.08, 0.08, and 0.44 ppm for 25th percentile, median, and 75th percentile). |
| Morgan et al. [43] | C | Aerospace workers with >6 months during 1950–1985 at Hughes (Tucson, AZ) (n = 20,503; 4,733 with TCE exposure), FU 1950–1993. | M | K, L, NHL | TCE subcohort. TCE exposure intensity assigned using JEM. “High TCE exposure” job classification defined as >50 ppm. Overall TCE exposure, cumulative exposure, peak exposure. |
| Nordstrom et al. [47] | CC | Histologically confirmed cases of hairy-cell leukemia in males (n = 111), Swedish Cancer Registry, 1987−1992;a population controls (n = 400). | I | NHL (HCL) | Self-reported overall TCE exposure. |
| Persson and Fredrikson [48] | CC | Histologically confirmed B-cell NHL from two hospitals in Sweden: Oreboro, 1964−1986, or Linkoping, 1975−1984 (n = 199); controls from previous studies, randomly selected from population registers (n = 479). | I | NHL | Self-reported overall TCE exposure. |
| Pesch et al. [52] | CC | Histologically confirmed RCC from German hospitals (5 regions) (n = 935), 1991−1995; controls randomly selected from residency registries (n = 4,298). | I | K (RCC) | TCE and other exposures assigned by questionnaire assessing occupational history using job title (JEM approach), job task (JTEM approach), or self-reported exposure. Cumulative exposure. |
| Purdue et al. [22] | CC | Histologically confirmed NHL identified from four SEER areas (Los Angeles County, Detroit metropolitan area, Seattle-Puget Sound and Iowa) (n = 1,321), 1998–2000; population controls from RDD, or Medicare file, if ≥65 years (n = 1,057). | I | NHL | Specialized job-specific modules asked for detailed information on individual jobs and focused on solvent exposures, including TCE; assessment by expert industrial hygienist blinded to case and control status by levels of probability, frequency, and intensity. Overall exposure, average weekly exposure, years exposed, average exposure intensity, and cumulative exposure. Cumulative exposure categories of 0, 1–46,800 ppm-hour, 46,801–112,320 ppm-hour, 112,321–234,000 ppmhour and >234,000 ppm-hour. |
| Radican et al. [27] (mortality follow-up of Blair et al. [44]) | C | Civilian aircraft-maintenance workers with at least 1 year in 1952−1956 at Hill Air Force Base (UT) (n = 14,455; 7,204 ever exposed to TCE), FU 1952–2000 (M), 1973–1990 (I). | I, M | K, L, NHL | TCE assigned to individual subjects using JEM. TCE replaced in 1968 with 1,1,1-trichloroethane in bench-top degreasing activities and was discontinued in 1978 in vapor degreasing activities. Median TCE exposures were ~10 ppm for rag and bucket; 100−200 ppm for vapor degreasing. Overall TCE exposure, cumulative exposure, continuous or intermittent exposures, and peak exposure. Cumulative exposure categories of 0–5 unit-hour, 5–25 unit-hour, and >25 unit-hour. |
| Raaschou-Nielsen et al. [40] | C | Blue-collar workers employed >1,968 at 347 Danish TCE-using companies (n = 40,049; 14,360 with presumably higher-level exposure to TCE). FU to 1997. | I | K, L, NHL | Employers had documented TCE usage but no information on individual subjects, with job type and company size as variables identified as increasing the likelihood for TCE exposure. Subjects from iron and metal, electronics, painting, printing, chemical, and dry-cleaning industries. Median exposures to TCE were 40−60 ppm for the years before 1970, 10−20 ppm for 1970 to 1979, and approximately 4 ppm for 1980 to 1989. Overall TCE exposure, employment duration, year 1st employed, and company size. |
| Siemiatycki [53] | CC | Histologically confirmed NHL or kidney cancer in males, diagnosed in 16 large Montreal-area hospitals (215 = NHL, 177 K), 1979−1985; population-based controls identified from electoral lists and RDD (n = 533). | I | K, NHL | TCE and other exposure assigned on semi-quantitative scale from work histories by team of chemists and industrial hygienists. Overall TCE exposure, substantial exposure. |
| Wang et al. [23] | CC | Histologically confirmed NHL cases among females (n = 601), Connecticut Cancer Registry, 1996−2000; population-based female controls from RDD or, if ≥65 years of age, random selection from Medicare and Medicaid Service files (n = 717). | I | NHL | TCE intensity and probability of exposure assigned on semi-quantitative scale using JEM (Gomez et al. [56]). Overall TCE exposure, intensity, exposure probability. |
| Zhao et al. [25] | C | Aerospace workers with >2 years of employment at Rockwell/ Rocketdyne’s Santa Susana Field Laboratory, 1950–1993, FU 1950–2001 (M, n = 6,044), 1988–2000 (I, n = 5,049). Overlaps cohort of Boice et al.[26]. | I, M | K, NHL+ other LHP cancers | TCE and other exposures assigned on semi-quantitative scale from work history using JEM. Cumulative TCE score. |
| Overall Exposure | Highest TCE Exposure Group | |||||
|---|---|---|---|---|---|---|
| Study | RR (95% CI) | Alternate RR estimates | Exposure Category | RR (95% CI) | Alternate RR estimates | Comments |
| Cohort Studies | ||||||
| Anttila et al. [38] | 0.87 (0.32, 1.89) | None | 100+ μmol/L U-TCA a | 1.0 assumed b | ICD-7 180. SIR. Reported high exposure group results for some cancer sites but not kidney. | |
| Axelson et al. [37] | 1.16 (0.42, 2.52) | 1.07 (0.39, 2.33) with estimated female contribution to SIR addedc | ≥2 year exposure and 100+ mg/L U-TCA | 1.0 assumed b | ICD-7 180. SIR reported for males only, but there was a small female component to the cohort. Reported high exposure group results for some cancer sites but not kidney. | |
| Boice et al. [41] | 0.99 (0.4, 2.04) | None | ≥5 years exposure | 0.69 (0.22, 2.12) | None | ICD-9 189.0−189.2. Overall exposure SMR for potential routine exposure; results for any potential exposure not reported. Mortality RR for highest exposure group for potential routine or intermittent exposure, adjusted for date of birth, dates 1st and last employed, race, and sex; referent group is workers not exposed to any solvent. |
| Greenland et al. [42] | 0.99 (0.30, 3.32) | None | NA | b | ICD-8 codes not specified, presumably all of 189. Mortality OR from nested case-control study. | |
| Hansen et al. [39] | 1.1 (0.3, 2.8) c | None | ≥1,080 months × mg/m3 | 1.0 assumed b | ICD-7 180. SIR. Reported high exposure group results for some cancer sites but not kidney. | |
| Morgan et al. [43] | 1.14 (0.51, 2.58) (Morgan et al. [57]) | 1.32 (0.57, 2.6) Published SMR | High cumulative exposure score | 1.59 (0.68, 3.71) | 1.89 (0.85, 4.23) for medium/high peak | ICD-7 180, ICD-8, -9 189.0−189.2. Overall mortality RR from Morgan et al. [57]. RRs adjusted for age and sex. |
| Raaschou-Nielsen et al. [40] | 1.20 (0.94, 1.50) | 1.20 (0.98, 1.46) for ICD-7 180; c 1.4 (1.0, 1.8) for subcohort with expected higher exposures | ≥5 years in subcohort with expected higher exposure levels | 1.7 (1.1, 2.4) | 1.6 (1.1, 2.2) for ≥5 years in total cohort; c 1.4 (0.99, 1.9) ICD-7 180 ≥5 years in total cohort c | ICD-7 180.0 (RCC). |
| Radican et al. [27] | 1.18 (0.47, 2.94) | None | >25 unit-years | 1.11 (0.35, 3.49) d | Incidence RR: 0.9 (0.3, 3.2) (Blair et al. [44]) d | ICD-8, -9 189.0, ICD-10 C64. Mortality RR adjusted for age, sex and race, with workers with no chemical exposures as referent group. |
| Zhao et al. [25] | 1.7 (0.38, 7.9)e | Incidence RR: 2.0 (0.47, 8.2); e Mortality RR no lag: 0.89 (0.22, 3.6); e Incidence RR no lag : 2.1 (0.56, 8.1);e SMR: 2.22 (0.89, 4.57) (Boice et al. [26]) | High exposure score | 7.40 (0.47, 116) | Mortality RR: 1.82 (0.09, 38.6); Incidence RR no lag: 7.71 (0.65, 91.4); Mortality RR no lag: 0.96 (0.09, 9.91); Mortality RR: 2.12 (0.63, 7.11) for ≥5 years as test stand mechanic (Boice et al. [26]); 3.13 (0.74, 13.2) for ≥4 test-year engine flush (Boice et al. [26]) | ICD-9 189. Mortality RR for males only for overall exposure with 20-year lag; adjusted for age, SES, time since first employment, exposure to other carcinogens. Overall mortality results reflect same number exposed cases (10 with no lag) as do incidence results. Overall RRs estimated by combining across exposure groups. Incidence RR for highest TCE exposure group reflects more exposed cases than does the mortality results and is used in primary analysis. Boice et al. [26] cohort, with seven exposed deaths, overlaps Zhao et al. [25] cohort. |
| Case-Control Studies: f | ||||||
| Brüning et al. [58] | 2.47 (1.36, 4.49) | 1.80 (1.01, 3.20) for longest job held in industry with TCE exposure | ≥20 years self-assessed exposure | 2.69 (0.84, 8.66) | None | RCC. OR for self-assessed TCE exposure adjusted for age, sex, and smoking. |
| Charbotel et al. [50] | 1.88 (0.89, 3.98) | 1.64 (0.95, 2.84) for full study; 1.68 (0.97, 2.91) for full study with 10-year lag | High cumulative dose | 3.34 (1.27, 8.74) | 3.80 (1.27, 11.40) for high + peaks; Full study, high: 2.16 (1.02, 4.60) + peaks: 2.73 (1.06, 7.07); Full study with 10-year lag, high: 2.16 (1.01, 4.65) + peaks: 3.15 (1.19, 8.38); Full study, additional adjustment, high: 1.96 (0.71, 5.37) + peaks: 2.63 (0.79, 8.83) | RCC. ORs for subgroups with good confidence about exposure assessment. Matched on sex and age, and adjusted for smoking and BMI. Highest exposure group alternate estimates with additional adjustment were also adjusted for exposure to cutting fluids and other petroleum oils. |
| Dosemeci et al. [51] | 1.30 (0.9, 1.9) | None | NA | b | RCC. OR adjusted for age, sex, smoking, hypertension and/or use of diuretics and/or anti-hypertension drugs, BMI. | |
| Moore et al. [24] | 2.05 (1.13, 3.73) | 1.63 (1.04, 2.54) for all subjects | ≥1.58 ppm × years | 2.23 (1.07, 4.64) | 2.02 (1.14, 3.59) for all subjects | RCC. Subgroup with high-confidence assessments. OR adjusted for age, sex, and center. |
| Pesch et al. [52] | 1.24 (1.03, 1.49) | 1.13 (0.98, 1.30) with German JEM | Substantial | 1.4 (0.9, 2.1) d | 1.2 (0.9, 1.7) for JEM d | RCC. JTEM approach. Crude ORs and CIs for overall TCE exposure calculated from data provided by Pesch [59], as described in methods section. ORs for highest exposure group adjusted for age, study center, and smoking. |
| Siemiatycki [53] | 0.8 (0.3, 2.2) | None | Substantial | 0.8 (0.2, 3.4) | None | “Kidney cancer.” SE and 95% CI calculated from reported 90% CI. OR for males only, adjusted for age, income, and cigarette smoking index. |
| Overall Exposure | Highest TCE Exposure Group | |||||
|---|---|---|---|---|---|---|
| Study | RR (95% CI) | Alternate RR estimates | Exposure Category | RR (95% CI) | Alternate RR estimates | Comments |
| Cohort Studies | ||||||
| Anttila et al. [38] | 1.89 (0.86, 3.59) a | 2.27 (0.74, 5.29) for 155.0 alone | 100+ μmol/L U-TCA b | 2.74 (0.33, 9.88) | None | ICD-7 155.0 + 155.1. SIR. ICD-7 155.0 for highest exposure group. |
| Axelson et al. [37] | 1.41 (0.38, 3.60) | 1.34 (0.36, 3.42) with estimated female contribution to SIR added c | 100+ mg/L U-TCA | 3.7 (0.09, 21) c | Exclude study | ICD-7 155. SIR reported for males only, but there was a small female component to the cohort. No cases were observed in highest exposure group (i.e., >2 years and 100+ U-TCA), so combined with <2 years and 100+ subgroup and estimated female results. |
| Boice et al. [41] | 0.81 (0.45, 1.33) | 0.54 (0.15, 1.38) for potential routine exposure | ≥5 year exposure | 0.94 (0.36, 2.46) | None | ICD-9 155 + 156. Overall SMR for any potential exposure. Highest exposure mortality RR for any potential exposure, adjusted for date of birth, dates 1st and last employed, race, and sex; referent group is workers not exposed to any solvent. |
| Greenland et al. [42] | 0.54 (0.11, 2.63) | None | NA | d | ICD-8 155 + 156. Mortality OR from nested case-control study. | |
| Hansen et al. [39] | 2.1 (0.7, 5.0) c | None | ≥1,080 months × mg/m3 | 1.0 assumed d | ICD-7 155. SIR. Reported high exposure group results for some cancer sites but not liver. | |
| Morgan et al. [43] | 1.48 (0.56, 3.91) | 0.98 (0.36, 2.13) Published SMR | High cumulative exposure score | 1.19 (0.34, 4.16) | 0.98 (0.29, 3.35) for medium/high | ICD-7 155, ICD-8, −9 155 + 156. Overall mortality RR as reported in Morgan et al. [57] RRs adjusted for age and sex. |
| Raaschou-Nielsen et al. [40] | 1.35 (1.03, 1.77) a,c | 1.28 (0.89, 1.80) for ICD-7 155.0 c | ≥5 years | 1.2 (0.7, 1.9) a,c | 1.1 (0.5, 2.1) ICD-7 155.0 (liver only) c | ICD-7 155.0 + 155.1. SIR. |
| Radican et al. [27] | 1.12 (0.57, 2.19) | 1.25 (0.31, 4.97) for ICD-8, −9 155.0 | >25 unit-year | 1.49 (0.67, 3.34) e | None | ICD-8, −9 155 + 156, ICD-10 C22–C24. Mortality HR adjusted for age, sex and race, with workers with no chemical exposures as referent group. |
| Zhao et al. [25]/Boice et al. [26] | 1.28 (0.35, 3.27) | 1.0 assumed for Zhao et al. [25] d | High exposure score | 1.0 assumed for Zhao et al. [25] d | ICD-9 155 + 156. Overall SMR for males from Boice et al. [26] used in lieu of Zhao et al. [25], who do not report liver cancer results. Highest exposure group RR for liver cancer not reported by Zhao et al. [25] or Boice et al. [26]. | |
| Overall Exposure | Highest TCE Exposure Group | |||||
|---|---|---|---|---|---|---|
| Study | RR (95% CI) | Alternate RR estimates | Exposure Category | RR (95% CI) | Alternate RR estimates | Comments |
| Cohort Studies | ||||||
| Anttila et al. [38] | 1.81 (0.78, 3.56) | None | 100+ μmol/L U-TCA a | 1.4 (0.17, 5.04) | None | ICD-7 200 + 202. SIR. |
| Axelson et al. [37] | 1.52 (0.49, 3.53) | 1.36 (0.44, 3.18) with estimated female contribution to SIR added b | ≥2 year exposure and 100+ mg/L U-TCA | 6.25 (0.16, 34.83) | 5.62 (0.14, 31.3) with estimated female contribution added b | ICD-7 200 + 202. SIR reported for males only, but there was a small female component to the cohort. |
| Boice et al. [41] | 1.19 (0.83, 1.65) | 1.19 (0.65, 1.99) for potential routine exposure | ≥5 years exposure | 1.62 (0.82, 3.22) | None | ICD-9 200 + 202. Overall exposure SMR for any potential exposure. Mortality RR for highest exposure group for any potential exposure adjusted for date of birth, dates 1st and last employed, race, and sex; referent group is workers not exposed to any solvent. |
| Greenland et al. [42] | 0.76 (0.24, 2.42) | None | NA | ICD-8 200–202. Mortality OR from nested case-control study. Overall exposure only. | ||
| Hansen et al. [39] | 3.1 (1.3, 6.1) b | None | ≥1,080 months × mg/m3 | 2.7 (0.56, 8.0) b | 3.7 (1.0, 9.5) for >75 months exposure duration; b 2.9 (0.79, 7.5) for >19 mg/m3 mean exposure b | ICD-7 200 + 202. SIR for highest exposure group presented only for males; female results estimated and combined with male results. |
| Morgan et al. [43] | 1.01 (0.46, 1.92) | 1.36 (0.35, 5.21) RR for ICD 200 | High cumulative exposure score | 0.81 (0.1, 6.49) | 1.31 (0.28, 6.08) for medium/high peak | ICD 200 + 202, ICD Revision 7, 8, or 9, depending on year of death. Overall SMR reported by Mandel et al. [18] Alternative overall mortality RR for ICD 200 as reported in Morgan et al. [57] and adjusted for age and sex. Mortality RR for highest exposure group is for ICD 200 only and adjusted for age and sex. |
| Raaschou-Nielsen et al. [40] | 1.24 (1.01, 1.52) | 1.5 (1.2, 2.0) for subcohort with expected higher exposures | ≥5 years in subcohort with expected higher exposure levels | 1.6 (1.1, 2.2) | 1.45 (0.99, 2.05) for ≥5 years in full cohort b | ICD-7 200 + 202. SIR. |
| Radican et al. [27] | 1.36 (0.77, 2.39) | None | >25 unit-years | 1.41 (0.71, 2.81)c | 0.97 (0.42, 2.2) for incidence (Blair et al. [44])c | ICD-8,-9 200 + 202; ICD-10 C82–C85. Mortality RR adjusted for age, sex and race, with workers with no chemical exposures as referent group. |
| Zhao et al. [25] | 1.44 (0.90, 2.30) d | Incidence RR: 0.77 (0.42, 1.39); d SMR for ICD-9 200 + 202: 0.21 (0.01, 1.18) (Boice et al. [26]) | High exposure score | 1.30 (0.52, 3.23) | Incidence RR: 0.20 (0.03, 1.46) | Most lymphohematopoietic cancers, ICD-9 200–208, ICD-10, C81–C95, ICD-O 2, morphology code 9590–9716, 9723, 9800–9980. Mortality RRs used in primary analyses since reflect more exposed cases than do the incidence results. Males only; adjusted for age, SES, time since first employment. |
| Case-Control Studies:e | ||||||
| Cocco et al. [21] | 0.8 (0.5, 1.1) | None | High cumulative exposure | 0.7 (0. 4, 1.3) | None | NHL. Grouping consistent with traditional definition provided by author. Incidence OR. High-confidence subgroup. Adjusted for age, sex, center, and education. |
| Hardell et al. [46] | 7.2 (1.3, 42) | None | NA | NHL. Rappaport classification system. Incidence OR. Males only; controls matched for age, place of residence, vital status. Overall exposure only. | ||
| Miligi et al. [20] | 0.93 (0.67, 1.29) | None | Medium/high exposure intensity | 1.2 (0.7, 2.0) | 1.0 (0.5, 2.6) for med/high intensity and >15 years | NHL + CLL. NCI Working Formulation. Adjusted OR for overall exposure not presented; overall crude incidence OR calculated as described in methods section. OR for highest exposure group adjusted for age, sex, education, and area. |
| Nordstrom et al. [47] | 1.5 (0.7, 3.3) | None | NA | HCL. Incidence OR. Males only; controls matched for age and county; analysis controlled for age. Overall exposure only. | ||
| Perrson and Frederikson [48] | 1.2 (0.5, 2.4) | None | NA | NHL. Classification system not specified. Incidence OR. Controls selected from same geographic areas; OR stratified on age and sex. Overall exposure only. | ||
| Purdue et al. [22] | 1.4 (0.8, 2.4) | None | Cumulative exposure > 234,000 ppm-hours | 3.3 (1.1, 10.1) | 2.3 (1.0, 5.0) for highest exposure tertile (>112,320 ppm-hours) | ICD-O-3 codes 967–972. Incidence OR. Probable-exposure subgroup. Adjusted for age, sex, SEER center, race, and education. |
| Siemiatycki [53] | 1.1 (0.5, 2.5) | None | Substantial | 0.8 (0.2, 3.3) | None | ICD-9 200 + 202. Incidence OR. SE and 95% CI calculated from reported 90% CIs; males only; adjusted for age, income, and cigarette smoking index. |
| Wang et al. [23] | 1.2 (0.9, 1.8) | None | Medium-high intensity | 2.2 (0.9, 5.4) | None | ICD-O M-9590–9595, 9670–9688, 9690–9698, 9700–9723. Incidence OR. Females only; adjusted for age, family history of lymphohematopoietic cancers, alcohol consumption, and race. |
© 2011 by the authors; licensee MDPI, Basel, Switzerland This article is an open-access article distributed under the terms and conditions of the Creative Commons Attribution license (http://creativecommons.org/licenses/by/3.0/).
Share and Cite
Siegel Scott, C.; Jinot, J. Trichloroethylene and Cancer: Systematic and Quantitative Review of Epidemiologic Evidence for Identifying Hazards. Int. J. Environ. Res. Public Health 2011, 8, 4238-4271. https://doi.org/10.3390/ijerph8114238
Siegel Scott C, Jinot J. Trichloroethylene and Cancer: Systematic and Quantitative Review of Epidemiologic Evidence for Identifying Hazards. International Journal of Environmental Research and Public Health. 2011; 8(11):4238-4271. https://doi.org/10.3390/ijerph8114238
Chicago/Turabian StyleSiegel Scott, Cheryl, and Jennifer Jinot. 2011. "Trichloroethylene and Cancer: Systematic and Quantitative Review of Epidemiologic Evidence for Identifying Hazards" International Journal of Environmental Research and Public Health 8, no. 11: 4238-4271. https://doi.org/10.3390/ijerph8114238