Disturbance and Plant Succession in the Mojave and Sonoran Deserts of the American Southwest

Abstract
:
1. Introduction
- What is the relationship of plant community cover, species richness, and species composition with time since disturbance (TSD), and do these measures change at different rates?
- Are there differences in successional pattern between primary and secondary succession and among disturbance and community types in secondary succession?
- Which species are dominant early successional colonizers?
- Do successional patterns differ between annual and perennial species?
- Is there evidence supporting generalizations proposed in the literature about arid land succession, such as successional sequences being similar to more temperate regions but requiring longer time periods to develop?
2. Methods
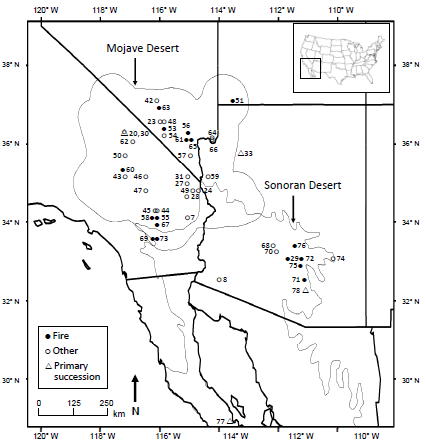
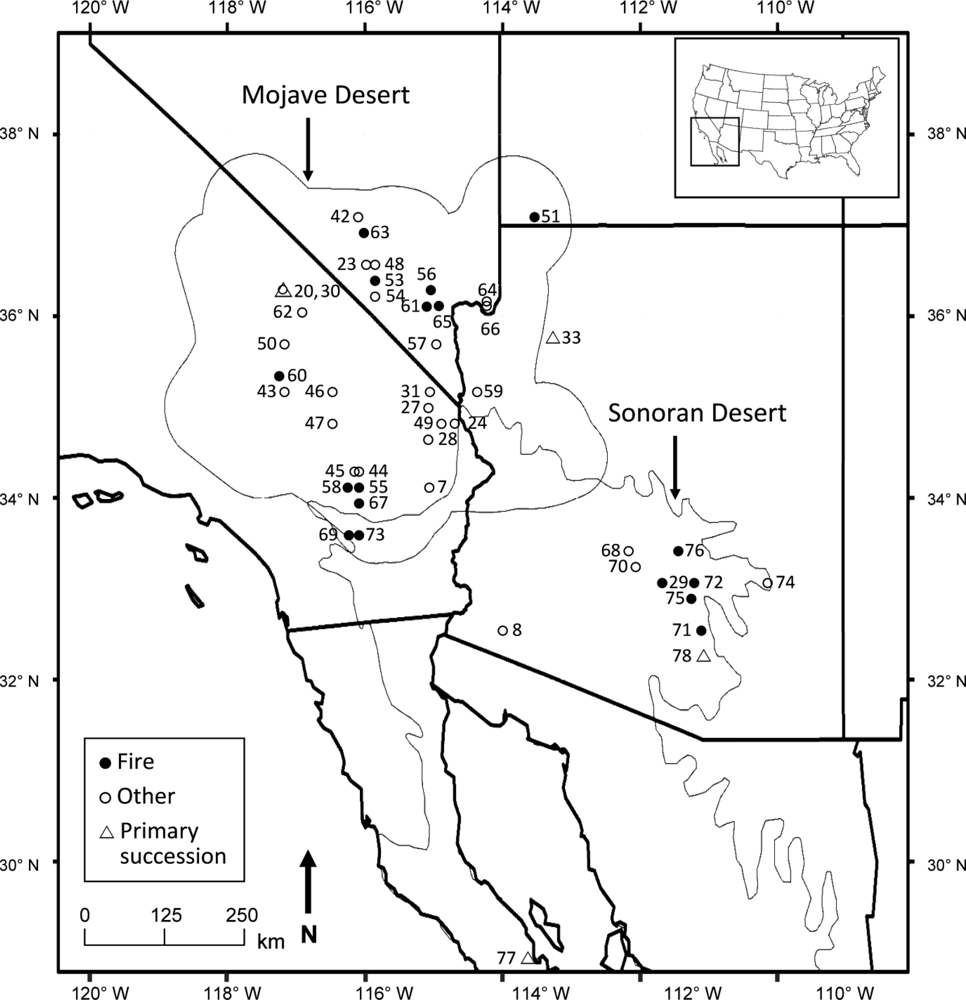
2.1. Study Area
2.2. Literature Search
2.3. Data Preparation
2.4. Data Analysis
3. Results
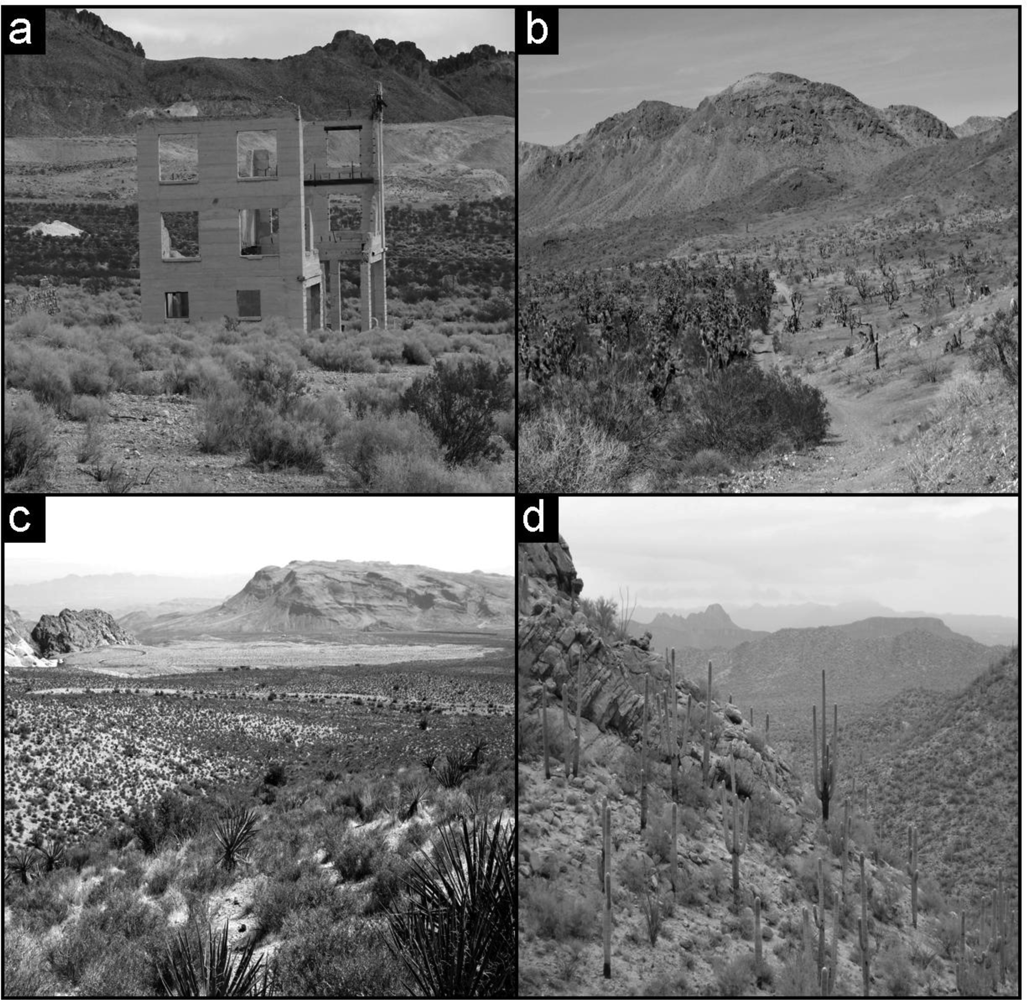
3.1. Literature Description
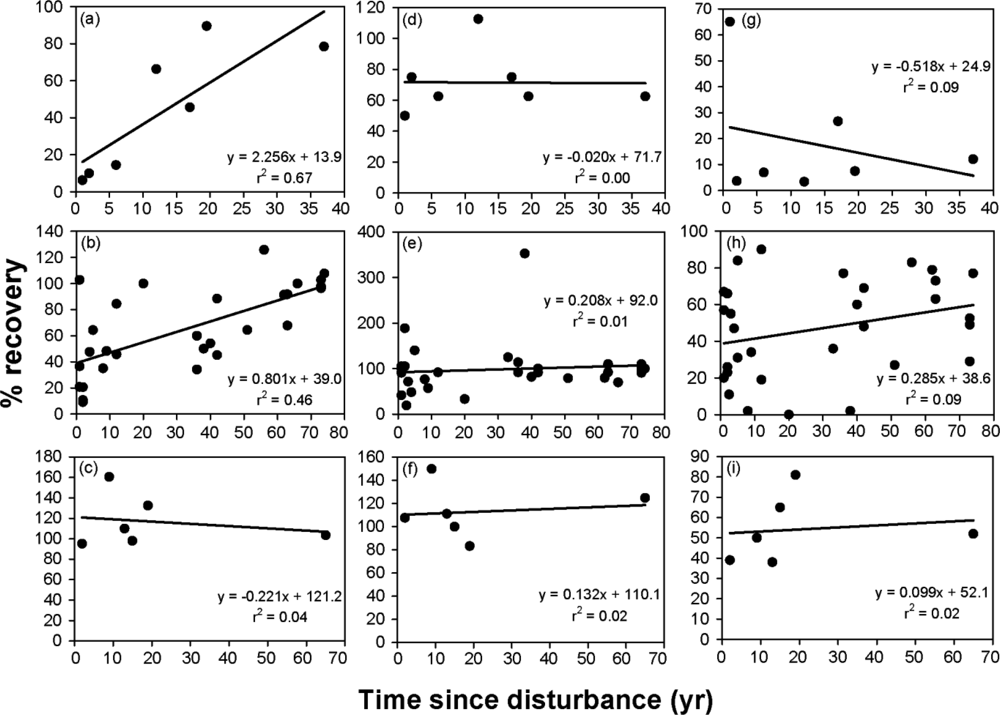
3.2. Time since Disturbance Relationships
3.3. Community and Disturbance Type Comparisons
3.4. Among-Study Comparisons
3.5. Individual Perennial Species
3.6. Annual Vegetation
3.7. Primary Succession
4. Discussion
4.1. Analysis Challenges
4.2. Evidence for Desert Succession Concepts
4.3. Conservation and Management Implications
4.4. Summary and Conclusion
Appendix. Summary of 47 studies meeting inclusion criteria for a quantitative analysis of plant recovery following disturbance in the Mojave and Sonoran Deserts of the American Southwest.

| Reference1 | Disturbance type | TSD (yr)2 | Temporal sampling3 | Community type4 | Species metric5 | Species included | |
|---|---|---|---|---|---|---|---|
| Annuals | Perennials | ||||||
| Mojave Desert | |||||||
| Wells [23] | Ghost town (roads, townsite) | 33 | – | MS | D, F | × | |
| Rickard and Shields [42,104] | Nuclear detonation, clearing | 2–3 | – | MS | II | × | × |
| Davidson and Fox [43] | Vehicle staging area | 1 | – | CR | D, F | × | × |
| Vasek et al. [44] | Pipeline corridor | 12 | – | CR | – | × | |
| Vasek et al. [45] | Powerline corridor | 1, 36 | CS | CR, SB | – | × | |
| Vasek [24] | Borrow pit | 9 | – | CR | C, D, F | × | |
| Lathrop and Archbold [46] | Aqueduct corridor | 9, 66 | CS | CR | – | × | |
| Lathrop and Archbold [47] | Powerline, pipeline corridor | 1–55 | CS | CR | – | × | |
| Webb and Wilshire [48] | Ghost town (roads, townsite) | 51 | – | MS | C, D | × | |
| Lathrop [49] | Military (roads, clearing) | 36 | – | CR | C, D | × | |
| Webb et al. [50] | Old agricultural field | 20 | – | CR | C, D | × | |
| Callison et al. [51] | Fire | 1–37 | CS | BB | C | × | × |
| Prose and Metzger/Prose et al. [7,52] | Military (roads, clearing) | 40 | – | CR | C, D | × | |
| Carpenter et al./Carpenter [31,105] | Old agricultural field | 52–79 | CS | CR, JT, MS | II | × | |
| Webb et al. [30,20] | Pipeline corridor, ghost town | 42–74 | – | BB-MS | C, D | × | |
| Medica et al. [53] | Fire | 2–8 | PP | MS | C, D | × | × |
| Gabbert et al. [54] | Clearing | 6–12 | – | CR, BB, MS | D | × | |
| Minnich [55] | Fire | 1–47 | CS | BB, JT | C, D | × | |
| Lei [56] | Fire | 1–17 | CS | BB | D | × | |
| Walker and Powell [57] | Abandoned road | 3 | – | JT | D | × | × |
| Bolling and Walker/Bolling [27,106] | Abandoned road | 5–88 | CS | CR | C, D | × | |
| Loik et al. [58] | Fire | 1 | – | JT-MS | C, F | × | |
| Prose and Wilshire [28] | Military (roads, clearing) | 22–43 | – | CR | C, D | × | |
| Steiger and Webb [59] | Military (roads, clearing) | 42 | – | CR-MS | C, D | × | |
| Brooks [60] | Fire | 1–4 | PP | CR | – | × | |
| Brooks and Matchett [61] | Fire | 6–14 | CS | BB | C | × | × |
| Webb and Thomas [62] | Ghost town (roads, townsite) | 19–92 | CS | MS | – | × | |
| Webb et al. [63] | Fire | 4–41 | PP | BB-MS | C, D | × | |
| Abella et al. [64] | Pipeline corridor | 8, 38 | CS | CR | C, D | × | × |
| Abella et al. [65] | Fire | 2 | – | CR-BB | C, D, F | × | × |
| Scoles-Sciulla and DeFalco [66] | Abandoned road | 1–7 | CS | CR | C | × | |
| Vamstad and Rotenberry/Vamstad [67,107] | Fire | 2–65 | CS | BB-JT | C | × | × |
| Sonoran Desert | |||||||
| Johnson et al. [68,108] | Powerline corridor | 1–6 | PP | MS | – | × | × |
| O'Leary and Minnich [69] | Fire | 5 | – | CR | F | × | |
| Hessing and Johnson [70] | Powerline corridor | 1–5 | PP | SU | – | × | |
| McLaughlin and Bowers [71] | Fire | 1–2 | – | SU | C, D | × | |
| Cave and Patten [72] | Fire | 1–2 | – | SU | D | × | × |
| Brown and Minnich [73] | Fire | 3–5 | – | CR | C | × | × |
| Roundy and Jordan [74] | Plowing | 12 | – | SU | D | × | × |
| Wilson et al. [75] | Fire | 1 | – | SU | D | × | |
| Kade and Warren [8] | Military (roads, clearing) | 56 | – | CR | C, D | × | |
| Alford et al. [29] | Fire | 5–21 | CS | SU | – | × | |
| Abella et al. [76] | Fire | 1–2 | PP | SU | C, F | × | × |
| Primary succession | |||||||
| Webb et al. [30,20] | Debris flow | 5-millennia | CS | BB-MS | C, D | × | |
| McAuliffe [77] | Debris flow | 100s-millennia | CS | MS | D | × | |
| McAuliffe [78] | Debris flow | Various6 | CS | CR-MS | C | × | |
| Bowers et al. [33] | Debris flow | 5–3,100 | CS | MS | C, D | × | |
Acknowledgments
References
- Lovich, JE; Bainbridge, D. Anthropogenic degradation of the southern California desert ecosystem and prospects for natural recovery and restoration. Environ. Manage 1999, 24, 309–326. [Google Scholar]
- Artz, MC. Impacts of linear corridors on perennial vegetation in the East Mojave Desert: implications for environmental management and planning. Nat. Areas J 1989, 9, 117–129. [Google Scholar]
- Bean, TM; Smith, SE; Karpiscak, MM. Intensive revegetation in Arizona’s hot desert: the advantages of container stock. Native Plants J 2004, 5, 173–180. [Google Scholar]
- Castellanos, AE; Martinez, MJ; Llano, JM; Halvorson, WL; Espiricueta, M; Espejel, I. Successional trends in Sonoran Desert abandoned agricultural fields in northern Mexico. J. Arid Environ 2005, 60, 437–455. [Google Scholar]
- Rowlands, PG. The Effects of Disturbance on Desert Soils, Vegetation and Community Processes with Emphasis on off Road Vehicles: A Critical Review; ; Special publication, U.S. Bureau of Land Management: Jackson, MI, USA, 1980. [Google Scholar]
- Vogel, J; Hughson, DL. Historical patterns of road networks in Mojave National Preserve. In The Mojave Desert: Ecosystem Processes and Sustainability; Webb, RH, Fenstermaker, LF, Heaton, JS, Hughson, DL, McDonald, EV, Miller, DM, Eds.; University of Nevada Press: Reno, NV, USA, 2009; pp. 196–210. [Google Scholar]
- Prose, DV; Metzger, SK. Recovery of soils and vegetation in World War II military base camps, Mojave Desert. In U.S. Geological Survey Open-File Report 85–234; US Geological Survey: Denver, CO, USA, 1985. [Google Scholar]
- Kade, A; Warren, SD. Soil and plant recovery after historic military disturbances in the Sonoran Desert, USA. Arid Land Res. Manag 2002, 16, 231–243. [Google Scholar]
- Knapp, PA. Secondary plant succession and vegetation recovery in two western Great Basin Desert ghost towns. Biol. Conserv 1992, 60, 81–89. [Google Scholar]
- Esque, TC; Schwalbe, CR; DeFalco, LA; Duncan, RB; Hughes, TJ. Effects of desert wildfire on desert tortoise (Gopherus agassizii) and other small vertebrates. Southwest. Nat 2003, 48, 103–111. [Google Scholar]
- Grantz, DA; Vaughn, DL; Farber, R; Kim, B; Zeldin, M; Van Curen, T; Campbell, R. Seeding native plants to restore desert farmland and mitigate fugitive dust and PM10. J. Environ. Qual 1998, 27, 1209–1218. [Google Scholar]
- Brooks, ML; Matchett, JR. Spatial and temporal patterns of wildfires in the Mojave Desert, 1980–2004. J. Arid Environ 2006, 67, 148–164. [Google Scholar]
- DeFalco, LA; Esque, TC; Scoles-Sciulla, SJ; Rodgers, J. Desert wildfire and severe drought diminish survivorship of the long-lived Joshua tree (Yucca brevifolia; Agavaceae). Am. J. Bot 2010, 97, 243–250. [Google Scholar]
- Esque, TC; Schwalbe, CR; Haines, DF; Halvorson, WL. Saguaros under siege: invasive species and fire. Desert Plants 2004, 20, 49–55. [Google Scholar]
- Abella, SR. Post-fire plant recovery in the Mojave and Sonoran Deserts of western North America. J. Arid Environ 2009, 73, 699–707. [Google Scholar]
- Allen, CD. Interactions across spatial scales among forest dieback, fire, and erosion in northern New Mexico landscapes. Ecosystems 2007, 10, 797–808. [Google Scholar]
- Bainbridge, DA. A Guide for Desert and Dryland Restoration; Island Press: Washington, DC, USA, 2007. [Google Scholar]
- Fernandez-Bernal, A; De La Rosa, MA. A systematic review of species performance and treatment effectiveness for revegetation in the Mojave Desert, USA. In Arid Environments and Wind Erosion; Fernandez-Bernal, A; De La Rosa, MA. Nova Science Publishers Inc.: Hauppauge, NY, USA, 2009; pp. 45–74. [Google Scholar]
- Walker, LR; del Moral, R. Primary Succession and Ecosystem Rehabilitation; Cambridge University Press: New York, NY, USA, 2003. [Google Scholar]
- Webb, RH; Steiger, JW; Newman, EB. The response of vegetation to disturbance in Death Valley National Monument, California. In US Geological Survey Bulletin 1793; US Government Printing Office: Washington, DC, USA, 1988. [Google Scholar]
- Muller, CH. Plant succession in the Larrea-Fluorensia climax. Ecology 1940, 21, 206–212. [Google Scholar]
- Shreve, F. The desert vegetation of North America. Bot. Rev 1942, 8, 195–245. [Google Scholar]
- Wells, PV. Succession in desert vegetation on streets of a Nevada ghost town. Science 1961, 134, 670–671. [Google Scholar]
- Vasek, FC. Early successional stages in Mojave Desert scrub vegetation. Israel J. Bot 1979/80, 28, 133–148. [Google Scholar]
- Cody, ML. Slow-motion population dynamics in Mojave Desert perennial plants. J. Veg. Sci 2000, 11, 351–358. [Google Scholar]
- Guo, Q. Slow recovery in desert perennial vegetation following prolonged human disturbance. J. Veg. Sci 2004, 15, 757–762. [Google Scholar]
- Bolling, JD; Walker, LR. Plant and soil recovery along a series of abandoned desert roads. J. Arid Environ 2000, 46, 1–24. [Google Scholar]
- Prose, DV; Wilshire, HG. The lasting effects of tank maneuvers on desert soil sand intershrub flora. In U.S. Geological Survey Open-File Report 00-512; US Geological Survey: Menlo Park, CA, USA, 2000. [Google Scholar]
- Alford, EJ; Brock, JH; Gottfried, GJ. Effects of fire on Sonoran Desert plant communities. In Connecting Mountain Islands and Desert Seas: Biodiversity and Management of the Madrean Archipelago II; , Proceedings RMRS-P-36; Gottfried, GJ; Gebow, BS; Eskew, LG; Edminster, CB. (Compiler) US Department of Agriculture, Forest Service, Rocky Mountain Research Station: Fort Collins, CO, USA, 2005; pp. 451–454. [Google Scholar]
- Webb, RH; Steiger, JW; Turner, RM. Dynamics of Mojave Desert shrub assemblages in the Panamint Mountains, California. Ecology 1987, 68, 478–490. [Google Scholar]
- Carpenter, DE; Barbour, MG; Bahre, CJ. Old field succession in Mojave Desert scrub. Madroño 1986, 33, 111–122. [Google Scholar]
- Vasek, FC. Plant succession in the Mojave Desert. Crossosoma 1983, 9, 1–23. [Google Scholar]
- Bowers, JE; Webb, RH; Pierson, EA. Succession of desert plants on debris flow terraces, Grand Canyon, Arizona, USA. J. Arid Environ 1997, 36, 67–86. [Google Scholar]
- Rundel, PW; Gibson, AC. Ecological Communities and Processes in a Mojave Desert Ecosystem: Rock Valley, Nevada; Cambridge University Press: New York, NY, USA, 1996. [Google Scholar]
- Crosswhite, FS; Crosswhite, CD. The Sonoran Desert. In Reference Handbook on the Deserts of North America; Bender, GL, Ed.; Greenwood Press: Westport, CT, USA, 1982; pp. 163–319. [Google Scholar]
- Smith, SD; Monson, RK; Anderson, JE. Physiological Ecology of North American Desert Plants; Springer-Verlag: New York, NY, USA, 1997. [Google Scholar]
- Western Regional Climate Center. Western U.S. Historical Climate Summaries; Western Regional Climate Center: Reno, NV, USA, 2009. Available online: http://www.wrcc.dri.edu/ (Accessed on 5 August 2009).
- Beatley, JC. Phenological events and their environmental triggers in Mojave Desert ecosystems. Ecology 1974, 55, 856–863. [Google Scholar]
- Brown, DE. Biotic Communities: Southwestern United States and Northwestern Mexico; University of Utah Press: Salt Lake City, UT, USA, 1994. [Google Scholar]
- Rowlands, P; Johnson, H; Ritter, E; Endo, A. The Mojave Desert. In Reference Handbook on the Deserts of North America; Bender, GL, Ed.; Greenwood Press: Westport, CT, USA, 1982; pp. 103–162. [Google Scholar]
- Bolling, JD; Walker, LR. Fertile island development around perennial shrubs across a Mojave Desert chronosequence. West. N. Am. Nat 2002, 62, 88–100. [Google Scholar]
- Rickard, WH; Shields, LM. An early stage in the plant recolonization of a nuclear target area. Radiat. Bot 1963, 3, 41–44. [Google Scholar]
- Davidson, E; Fox, M. Effects of off-road motorcycle activity on Mojave Desert vegetation and soil. Madroño 1974, 22, 381–412. [Google Scholar]
- Vasek, FC; Johnson, HB; Eslinger, DH. Effects of pipeline construction on creosote bush scrub vegetation of the Mojave Desert. Madroño 1975, 23, 1–13. [Google Scholar]
- Vasek, FC; Johnson, HB; Brum, GD. Effects of power transmission lines on vegetation of the Mojave Desert. Madroño 1975, 23, 114–130. [Google Scholar]
- Lathrop, EW; Archbold, EF. Plant response to Los Angeles aqueduct construction in the Mojave Desert. Environ. Manage 1980, 4, 137–148. [Google Scholar]
- Lathrop, EW; Archbold, EF. Plant responses to utility right of way construction in the Mojave Desert. Environ. Manage 1980, 4, 215–226. [Google Scholar]
- Webb, RH; Wilshire, HG. Recovery of soils and vegetation in a Mojave Desert ghost town, Nevada. J. Arid Environ 1980, 3, 291–303. [Google Scholar]
- Lathrop, EW. Recovery of perennial vegetation in military maneuver areas. In Environmental Effects of Off-Road Vehicles; Webb, RH, Wilshire, HG, Eds.; Springer-Verlag: New York, NY, USA, 1983; pp. 265–277. [Google Scholar]
- Webb, RH; Wilshire, HG; Henry, MA. 1983; Natural recovery of soils and vegetation following human disturbance. In Environmental Effects of Off-Road Vehicles; Webb, RH, Wilshire, HG, Eds.; Springer-Verlag: New York, NY, USA, 1983; pp. 279–302.
- Callison, J; Brotherson, JD; Bowns, JE. The effects of fire on the blackbrush (Coleogyne ramosissima) community of southwestern Utah. J. Range. Manage 1985, 38, 535–538. [Google Scholar]
- Prose, DV; Metzger, SK; Wilshire, HG. Effects of substrate disturbance on secondary plant succession: Mojave Desert, California. J. Appl. Ecol 1987, 24, 305–313. [Google Scholar]
- Medica, PA; Saethre, MB; Hunter, RB. Recovery of a desert community after fire in the northern Mojave. In The Desert Tortoise Council Proceedings of 1994 Symposium; Desert Tortoise Council, Inc: San Bernardino, CA, USA, 1994; pp. 68–92. [Google Scholar]
- Gabbert, WD; Schultz, BW; Angerer, JP; Ostler, WK. Plant succession on disturbed sites in four plant associations in the northern Mojave Desert. In Proceedings: Wildland Shrub and Arid Land Restoration Symposium; , General Technical Report INT-GTR-315; Roundy, BA; McArthur, ED; Haley, JS; Mann, DK. (Compiler) US Department of Agriculture, Forest Service, Intermountain Research Station: Ogden, UT, USA, 1995; pp. 183–188. [Google Scholar]
- Minnich, RA. Wildland fire and early postfire succession in Joshua tree woodland and blackbrush scrub of the Mojave Desert of California. San Bernardino County Museum Association Quarterly 1995, 42, 99–106. [Google Scholar]
- Lei, SA. Postfire woody vegetation recovery and soil properties in blackbrush (Coleogyne ramosissima) shrubland ecotones. J. Arizona-Nevada Acad. Sci 1999, 32, 105–115. [Google Scholar]
- Walker, LR; Powell, EA. Effects of seeding on road revegetation in the Mojave Desert, southern Nevada. Ecol. Restor 1999, 17, 150–155. [Google Scholar]
- Loik, ME; St Onge, CD; Rogers, J. Post-fire recruitment of Yucca brevifolia and Yucca schidigera in Joshua Tree National Park, California. In U.S. Geological Survey Open-File Report 00-62; US Geological Survey: Reston, VA, USA, 2000; pp. 79–85. [Google Scholar]
- Steiger, JW; Webb, RH. Recovery of perennial vegetation in military target sites in the eastern Mojave Desert, Arizona. In U.S. Geological Survey Open-File Report 00-355; US Geological Survey: Reston, VA, USA, 2000. [Google Scholar]
- Brooks, ML. Peak fire temperatures and effects on annual plants in the Mojave Desert. Ecol. Appl 2002, 12, 1088–1102. [Google Scholar]
- Brooks, ML; Matchett, JR. Plant community patterns in unburned and burned blackbrush (Coleogyne ramosissima Torr.) shrublands in the Mojave Desert. West. N. Am. Nat 2003, 63, 283–298. [Google Scholar]
- Webb, RH; Thomas, KA. Recoverability of severely disturbed soils and vegetation in the Mojave Desert, California, USA. In Desertification in the Third Millennium; Alsharhan, AS, Wood, WW, Goudie, A, Fowler, A, Abdellatif, EM, Eds.; Swets and Zeitlinger: Lisse, The Netherlands, 2003; pp. 283–289. [Google Scholar]
- Webb, RH; Murov, MB; Esque, TC; Boyer, DE; DeFalco, LA; Haines, DF; Oldershaw, D; Scoles, SJ; Thomas, KA; Blainey, JB; Medica, PA. Perennial vegetation data from permanent plots on the Nevada Test Site, Nye County, Nevada. In U.S. Geological Survey Open-File Report 03-336; US Geological Survey: Tucson, AZ, USA, 2003. [Google Scholar]
- Abella, SR; Newton, AC; Bangle, DN. Plant succession in the eastern Mojave Desert: an example from Lake Mead National Recreation Area, southern Nevada. Crossosoma 2007, 33, 45–55. [Google Scholar]
- Abella, SR; Engel, EC; Lund, CL; Spencer, JE. Early post-fire plant establishment on a Mojave Desert burn. Madroño 2009, 56, 137–148. [Google Scholar]
- Scoles-Sciulla, SJ; DeFalco, LA. Seed reserves during surface soil reclamation in eastern Mojave Desert. Arid Land Res. Manage 2009, 23, 1–13. [Google Scholar]
- Vamstad, MS; Rotenberry, JT. Effects of Fire on Vegetation and Small Mammal Communities in a Mojave Desert Joshua Tree Woodland; Joshua Tree National Park: Twentynine Palms, CA, USA, 2009. [Google Scholar]
- Johnson, CD; Ditsworth, TM; Beley, JR; Butt, SM; Balda, RP. Arthropods, plants and transmission lines in Arizona: secondary succession in a Sonoran Desert habitat. J. Environ. Manage 1981, 13, 151–163. [Google Scholar]
- O’Leary, JF; Minnich, RA. Postfire recovery of the creosote bush scrub vegetation in the western Colorado Desert. Madroño 1981, 28, 61–66. [Google Scholar]
- Hessing, MB; Johnson, CD. Disturbance and revegetation of Sonoran Desert vegetation in an Arizona powerline corridor. J. Range. Manage 1982, 35, 254–258. [Google Scholar]
- McLaughlin, SP; Bowers, JE. Effects of wildfire on a Sonoran Desert plant community. Ecology 1982, 63, 246–248. [Google Scholar]
- Cave, GH; Patten, DT. Short-term vegetation responses to fire in the upper Sonoran Desert. J. Range. Manage 1984, 37, 491–496. [Google Scholar]
- Brown, DE; Minnich, RA. Fire and changes in creosote bush scrub of the western Sonoran Desert, California. Am. Midl. Nat 1986, 116, 411–422. [Google Scholar]
- Roundy, BA; Jordan, GL. Vegetation changes in relation to livestock exclusion and rootplowing in southeastern Arizona. Southwest. Nat 1988, 33, 425–436. [Google Scholar]
- Wilson, RC; Narog, MG; Koonce, AL; Corcoran, BM. Postfire regeneration in Arizona’s giant saguaro shrub community. In Proceedings of Conference on Biodiversity and Management of the Madrean Archipelago: the Sky Islands of Southwestern United States and Northwestern Mexico; , General Technical Report RM-GTR-264; US Department of Agriculture, Forest Service, Rocky Mountain Forest and Range Experiment Station: Fort Collins, CO, USA, 1995; pp. 424–431. [Google Scholar]
- Abella, SR; Gunn, JL; Daniels, ML; Springer, JD; Nyoka, SE. Using a diverse seed mix to establish native plants on a Sonoran Desert Burn. Native Plants J 2009, 10, 21–31. [Google Scholar]
- McAuliffe, JR. Demographic shifts and plant succession along a late Holocene soil chronosequence in the Sonoran Desert of Baja California. J. Arid Environ 1991, 20, 165–178. [Google Scholar]
- McAuliffe, JR. Landscape evolution, soil formation, and ecological patterns and processes in Sonoran Desert bajadas. Ecol. Monogr 1994, 64, 111–148. [Google Scholar]
- Abella, SR. A systematic review of wild burro grazing effects on Mojave Desert vegetation, USA. Environ. Manage 2008, 41, 809–819. [Google Scholar]
- Natural Resources Conservation Service. The PLANTS Database; National Plant Data Center: Baton Rouge, LA, USA, 2009. Available online: http://plants.usda.gov (Accessed on 5 August 2009).
- McCune, B; Grace, JB. Analysis of Ecological Communities; MjM Software Design: Gleneden Beach, OR, USA, 2002. [Google Scholar]
- McCune, B; Mefford, MJ. PC-ORD: Multivariate Analysis of Ecological Data; MjM Software Design: Gleneden Beach, OR, USA, 1999. [Google Scholar]
- Dufrêne, M; Legendre, P. Species assemblages and indicator species: the need for a flexible asymmetrical approach. Ecol. Monogr 1997, 67, 345–366. [Google Scholar]
- Kent, M; Coker, P. Vegetation Description and Analysis; CRC Press: Ann Arbor, MI, USA, 1992. [Google Scholar]
- Turner, RM; Webb, RH; Bowers, JE; Hastings, JR. The Changing Mile Revisited; The University of Arizona Press: Tucson, AZ, USA, 2003. [Google Scholar]
- Webb, RH; Belnap, J; Thomas, KA. Natural recovery from severe disturbance in the Mojave Desert. In The Mojave Desert: Ecosystem Processes and Sustainability; Webb, RH, Fenstermaker, LF, Heaton, JS, Hughson, DL, McDonald, EV, Miller, DM, Eds.; University of Nevada Press: Reno, NV, USA, 2009; pp. 343–377. [Google Scholar]
- Beatley, JC. Fluctuations and stability in climax shrub and woodland vegetation of the Mojave, Great Basin, and transition deserts of southern Nevada. Israel J. Bot 1980, 28, 149–168. [Google Scholar]
- Evens, JM. Vegetation in watercourses of the eastern Mojave Desert. Fremontia 2001, 29, 26–35. [Google Scholar]
- Lei, SA. Postfire seed bank and soil conditions in a blackbrush (Coleogyne ramosissima Torr.) shrubland. Bull. Southern California Acad. Sci 2001, 100, 100–108. [Google Scholar]
- Hunter, R; Turner, FB; Lindberg, RG; Hunter, KB. Effects of land clearing on bordering winter annual populations in the Mohave Desert. Great Basin Nat 1987, 47, 234–238. [Google Scholar]
- Leger, EA. The adaptive value of remnant native plants in invaded communities: an example from the Great Basin. Ecol. Appl 2008, 18, 1226–1235. [Google Scholar]
- Wallace, A; Romney, EM; Hunter, RB. The challenge of a desert: revegetation of disturbed lands. Great Basin Nat. Memoirs 1980, 4, 214–223. [Google Scholar]
- Craig, DJ; Craig, JE; Abella, SR; Vanier, CH. Factors affecting exotic annual plant cover and richness along roadsides in the eastern Mojave Desert, USA. J. Arid Environ 2010, 74, 702–707. [Google Scholar]
- Simons, LH. Rodent dynamics in relation to fire in the Sonoran Desert. J. Mamm 1991, 72, 518–524. [Google Scholar]
- McAuliffe, JR. Markovian dynamics of simple and complex desert plant communities. Am. Nat 1988, 131, 459–490. [Google Scholar]
- Carrillo-Garcia, A; Leon de la Luz, JL; Bashanl, Y; Bethlenfalvay, GJ. Nurse plants, mycorrhizae, and plant establishment in a disturbed area of the Sonoran Desert. Restor. Ecol 1999, 7, 321–335. [Google Scholar]
- Butterfield, BJ; Briggs, JM. Patch dynamics of soil biotic feedbacks in the Sonoran Desert. J. Arid Environ 2009, 73, 96–102. [Google Scholar]
- Vasek, FC; Lund, LJ. Soil characteristics associated with a primary plant succession on a Mojave Desert dry lake. Ecology 1980, 61, 1013–1018. [Google Scholar]
- Wallace, A; Romney, EM. The role of pioneer species in revegetation of disturbed desert areas. Great Basin Nat. Memoirs 1980, 4, 31–33. [Google Scholar]
- Connell, JH; Slatyer, RO. Mechanisms of succession in natural communities and their role in community stability and organization. Am. Nat 1977, 111, 1119–1144. [Google Scholar]
- Tsoutsos, T; Frantzeskaki, N; Gekas, V. Environmental impacts from the solar energy technologies. Energ. Policy 2005, 33, 289–296. [Google Scholar]
- US Bureau of Land Management and California Energy Commission. Staff Assessment and Draft Environmental Impact Statement and Draft California Desert Conservation Area Plan Amendment: SES Solar Two Project; US Bureau of Land Management, El Centro Field Office: El Centro, CA, USA, 2010. [Google Scholar]
- Rickard, WH; Sauer, RH. Self-revegetation of disturbed ground in the deserts of Nevada and Washington. Northwest Sci 1982, 56, 41–47. [Google Scholar]
- Shields, LM; Wells, PV; Rickard, WH. Vegetational recovery on atomic target areas in Nevada. Ecology 1963, 44, 697–705. [Google Scholar]
- Carpenter, DE. Old-Field Succession in Mojave Desert Scrub; ; MSc Thesis; University of California: Davis, CA, USA, 1983. [Google Scholar]
- Bolling, JD. Ecological Succession on Abandoned Roads in the Lake Mead National Recreation Area; ; M.Sc. thesis; University of Nevada Las Vegas: Las Vegas, NV, USA, 1996. [Google Scholar]
- Vamstad, MS. Effects of Fire on Vegetation and Small Mammal Communities in a Mojave Desert Joshua Tree Woodland; ; MSc thesis; University of California: Riverside, CA, USA, 2009. [Google Scholar]
- Johnson, CD; Belev, JR; Ditsworth, TM; Butt, SM. Secondary succession of arthropods and plants in the Arizona Sonoran Desert in response to transmission-line construction. J. Environ. Manage 1983, 16, 125–137. [Google Scholar]

| Reference | Disturbance type | TSD (yr) | Sampling Method1 | No. yrs.1 | Cover2 = mTSD + b | Yrs. to 100%3 | ||
|---|---|---|---|---|---|---|---|---|
| m | b | r | ||||||
| Johnson et al. [68] | Powerline corridor | 1–6 | PP | 6 | 16.294 | 20.5 | 0.42 | 5 |
| Hessing and Johnson [70] | Powerline corridor | 1–5 | PP | 5 | −7.372 | 88.1 | –0.81 | — |
| Callison et al. [51] | Fire | 1–37 | CS | 7 | 2.256 | 13.9 | 0.82 | 38 |
| Medica et al. [53] | Fire | 2–8 | PP | 3 | 4.522 | –7.0 | 0.95 | 24 |
| Minnich [55] | Fire | 1–47 | CS | 9 | 1.854 | 44.5 | 0.82 | 30 |
| Bolling and Walker [27] | Abandoned road | 5–88 | CS | 7 | 0.457 | 33.4 | 0.49 | 146 |
| Brooks and Matchett [61] | Fire | 6–14 | CS | 3 | 1.630 | 33.5 | 0.26 | 41 |
| Webb and Thomas [62] | Ghost town | 19–92 | CS | 24 | 1.130 | 0.0 | 0.66 | 88 |
| Webb et al. [63] | Fire | 4–41 | PP | 3 | 1.416 | 7.9 | 0.99 | 65 |
| Alford et al. [29] | Fire | 5–21 | CS | 4 | 2.635 | 21.9 | 0.99 | 30 |
| Scoles-Sciulla and DeFalco [66] | Abandoned road | 1–7 | CS | 4 | 0.299 | 0.0 | 0.73 | 335 |
| Vamstad and Rotenberry [67] | Fire | 2–65 | CS | 6 | 1.589 | 38.1 | 0.96 | 39 |
| 29 studies, 1 year of data each | Fire, other | 1–74 | — | — | 0.801 | 39.0 | 0.68 | 76 |
| Reference | Disturbance type | TSD (yr) | Sampling method1 | No. yrs.1 | Richness2 = mTSD + b | Yrs. to 100%3 | ||
|---|---|---|---|---|---|---|---|---|
| m | b | r | ||||||
| Hessing and Johnson [70] | Powerline corridor | 1–5 | PP | 5 | 1.175 | 75.2 | 0.26 | 21 |
| Callison et al. [51] | Fire | 1–37 | CS | 7 | −0.020 | 71.7 | 0.00 | — |
| Lei [56] | Fire | 1–17 | CS | 4 | 1.068 | 38.6 | 0.46 | 58 |
| Bolling and Walker [27] | Abandoned road | 5–88 | CS | 7 | 0.237 | 63.8 | 0.20 | 152 |
| Brooks and Matchett [61] - 0.01 ha | Fire | 6–14 | CS | 3 | 0.357 | 74.2 | 0.00 | 72 |
| Brooks and Matchett [61] - 0.1 ha | Fire | 6–14 | CS | 3 | −0.398 | 84.2 | −0.33 | — |
| Webb et al. [63] | Fire | 4–41 | PP | 3 | 3.482 | 55.3 | 1.00 | 13 |
| Scoles-Sciulla and DeFalco [66] | Abandoned road | 1–7 | CS | 4 | 13.861 | 0.0 | 0.73 | 7 |
| Vamstad and Rotenberry [67] | Fire | 2–65 | CS | 6 | −0.379 | 92.9 | −0.26 | — |
| 30 studies, 1 year of data each | Fire, other | 1–74 | — | — | 0.208 | 92.0 | 0.10 | 38 |
| Reference | Disturbance type | TSD (yr) | Sampling method1 | No. yrs.1 | Similarity = mTSD + b | Yrs. to 100%2 | ||
|---|---|---|---|---|---|---|---|---|
| m | b | r | ||||||
| Johnson et al. [68] | Powerline corridor | 1–6 | PP | 6 | 10.600 | 7.4 | 0.80 | 9 |
| Hessing and Johnson [70] | Powerline corridor | 1–5 | PP | 5 | −1.250 | 95.5 | −0.55 | — |
| Callison et al. [51] | Fire | 1–37 | CS | 7 | −0.518 | 24.9 | −0.30 | — |
| Medica et al. [53] | Fire | 2–8 | PP | 3 | 2.833 | 47.2 | 0.97 | 19 |
| Minnich [55] | Fire | 1–47 | CS | 9 | 0.560 | 42.8 | 0.51 | 102 |
| Lei [56] | Fire | 1–17 | CS | 4 | −0.448 | 23.4 | −0.32 | — |
| Bolling and Walker [27] | Abandoned road | 5–88 | CS | 7 | 0.295 | 44.7 | 0.35 | 187 |
| Brooks and Matchett [61] | Fire | 6–14 | CS | 3 | −0.692 | 12.5 | −0.72 | — |
| Webb et al. [63] | Fire | 4–41 | PP | 3 | 0.147 | 14.3 | 0.45 | 582 |
| Alford et al. [29] | Fire | 5–21 | CS | 4 | 2.160 | 28.0 | 0.91 | 33 |
| Scoles-Sciulla and DeFalco [66] | Abandoned road | 1–7 | CS | 4 | 4.158 | 0.0 | 0.73 | 24 |
| Vamstad and Rotenberry [67] | Fire | 2–65 | CS | 6 | 0.127 | 25.4 | 0.14 | 587 |
| 31 studies, 1 year of data each | Fire, other | 1–74 | — | — | 0.285 | 38.6 | 0.30 | 215 |
| Species | R1 | AD | AU | OD | OU | ADP | AUP |
|---|---|---|---|---|---|---|---|
| Increasers | ———— % ———— | ||||||
| Acamptopappus sphaerocephalus | 1.6 | 1.4 | 0.9 | 12 | 18 | 11.4 | 4.8 |
| Achnatherum hymenoides | 4.3 | 1.2 | 0.3 | 21 | 15 | 5.7 | 1.9 |
| Achnatherum speciosum | 7.4 | 5.9 | 0.8 | 30 | 33 | 19.5 | 2.4 |
| Baileya multiradiata | 2.9 | 1.3 | 0.5 | 18 | 12 | 7.2 | 3.7 |
| Bebbia juncea | 4.9 | 0.2 | 0.0 | 9 | 12 | 2.6 | 0.4 |
| Chamaesyce albomarginata | 36.5 | 1.2 | 0.0 | 9 | 6 | 12.8 | 0.5 |
| Encelia farinosa | 1.6 | 1.5 | 0.9 | 21 | 15 | 7.1 | 6.2 |
| Encelia frutescens | 84.2 | 1.4 | 0.0 | 9 | 6 | 15.9 | 0.3 |
| Encelia virginensis | 5.1 | 1.6 | 0.3 | 21 | 18 | 7.7 | 1.8 |
| Eriogonum inflatum | 85.0 | 0.2 | 0.0 | 9 | 3 | 2.1 | 0.1 |
| Ericameria nauseosa | 237.6 | 0.5 | 0.0 | 15 | 3 | 3.5 | 0.1 |
| Gutierrezia sarothrae | 7.6 | 2.6 | 0.3 | 18 | 21 | 14.6 | 1.6 |
| Hymenoclea salsola | 2.1 | 7.0 | 3.4 | 52 | 42 | 13.6 | 8.0 |
| Prunus fasciculata | 2.0 | 0.5 | 0.2 | 15 | 15 | 3.1 | 1.5 |
| Salazaria mexicana | 1.9 | 0.5 | 0.3 | 24 | 24 | 2.2 | 1.1 |
| Senna covesii | 5.4 | 0.5 | 0.1 | 6 | 6 | 7.7 | 1.4 |
| Sphaeralcea ambigua | 4.9 | 3.0 | 0.6 | 36 | 24 | 8.3 | 2.5 |
| Stephanomeria pauciflora | 14.8 | 2.2 | 0.1 | 24 | 21 | 9.2 | 0.7 |
| Thamnosma montana | 6.2 | 1.6 | 0.3 | 24 | 21 | 6.4 | 1.2 |
| Xylorhiza tortifolia | 26.7 | 0.4 | 0.0 | 18 | 9 | 2.0 | 0.1 |
| Versatile | |||||||
| Acamptopappus shockleyi | 0.8 | 0.3 | 0.3 | 18 | 15 | 1.4 | 2.2 |
| Ambrosia dumosa | 0.7 | 7.5 | 10.3 | 45 | 42 | 16.5 | 24.3 |
| Atriplex canescens | 0.6 | 0.1 | 0.2 | 12 | 15 | 1.0 | 1.4 |
| Cylindropuntia echinocarpa | 1.0 | 0.5 | 0.6 | 21 | 27 | 2.6 | 2.1 |
| Ephedra nevadensis | 1.0 | 4.2 | 4.1 | 45 | 52 | 9.3 | 7.9 |
| Ephedra viridis | 1.3 | 0.1 | 0.1 | 12 | 12 | 1.2 | 0.9 |
| Eriogonum fasciculatum | 1.0 | 0.5 | 0.5 | 24 | 27 | 1.9 | 1.7 |
| Lycium andersonii | 0.9 | 2.2 | 2.5 | 36 | 42 | 6.0 | 6.0 |
| Parkinsonia microphylla | 1.5 | 1.8 | 1.2 | 9 | 9 | 19.6 | 13.0 |
| Pleuraphis rigida | 0.7 | 2.0 | 2.9 | 12 | 21 | 16.6 | 13.6 |
| Yucca baccata | 0.9 | 0.3 | 0.3 | 12 | 12 | 2.5 | 2.7 |
| Yucca schidigera | 0.5 | 0.2 | 0.5 | 9 | 15 | 2.6 | 3.0 |
| Decreasers | |||||||
| Ambrosia deltoidea | 0.3 | 1.0 | 3.9 | 9 | 9 | 11.3 | 42.6 |
| Coleogyne ramosissima | 0.1 | 1.0 | 13.9 | 33 | 39 | 2.9 | 35.3 |
| Cylindropuntia acanthocarpa | 0.2 | 0.1 | 0.3 | 18 | 24 | 0.4 | 1.3 |
| Cylindropuntia bigelovii | 0.3 | 0.3 | 1.0 | 9 | 12 | 3.2 | 8.4 |
| Cylindropuntia ramosissima | 0.2 | 0.0 | 0.1 | 9 | 21 | 0.3 | 0.5 |
| Echinocereus engelmannii | 0.1 | 0.0 | 0.1 | 6 | 15 | 0.1 | 0.6 |
| Ericameria cooperi | 0.5 | 0.6 | 1.4 | 24 | 27 | 2.7 | 5.1 |
| Grayia spinosa | 0.1 | 0.8 | 5.1 | 15 | 24 | 5.0 | 21.1 |
| Juniperus californica | 0.0 | 0.0 | 0.9 | 6 | 12 | 0.6 | 7.1 |
| Krameria erecta | 0.4 | 0.2 | 0.5 | 18 | 21 | 1.2 | 2.5 |
| Krascheninnikovia lanata | 0.2 | 0.1 | 0.7 | 18 | 21 | 0.8 | 3.4 |
| Larrea tridentata | 0.4 | 8.1 | 21.5 | 48 | 64 | 16.7 | 33.8 |
| Menodora spinescens | 0.3 | 0.2 | 0.6 | 12 | 15 | 1.7 | 4.0 |
| Prosopis glandulosa | 0.0 | 0.0 | 0.4 | 3 | 6 | 0.1 | 6.8 |
| Yucca brevifolia | 0.1 | 0.1 | 0.9 | 15 | 21 | 0.6 | 4.3 |
| Reference | Disturbance type | TSD (yr) | Sampling method1 | No. yrs. sampled1 | y2 = mTSD + b | Yrs. to 100%3 | ||
|---|---|---|---|---|---|---|---|---|
| m | b | r | ||||||
| Cover | ||||||||
| Johnson et al. [68] | Powerline | 1–6 | PP | 6 | 412.520 | −149.3 | 0.43 | 1 |
| Callison et al. [51] | Fire | 1–37 | CS | 7 | −8.681 | 420.1 | −0.43 | — |
| Brooks and Matchett [61] | Fire | 6–14 | CS | 3 | 35.468 | 39.4 | 0.99 | 2 |
| Vamstad and Rotenberry [67] | Fire | 2–65 | CS | 6 | −0.221 | 121.2 | 0.20 | — |
| Richness | ||||||||
| Callison et al. [51] | Fire | 1–37 | CS | 7 | −0.897 | 94.3 | −0.30 | — |
| Brooks [60] - below shrub | Fire | 1–4 | PP | 4 | 6.661 | 13.5 | 0.97 | 13 |
| Brooks and Matchett [61] - 1 m2 | Fire | 6–14 | CS | 3 | 5.559 | 59.7 | 0.92 | 7 |
| Brooks and Matchett [61] - 0.01 ha | Fire | 6–14 | CS | 3 | 2.860 | 63.5 | 0.64 | 13 |
| Vamstad and Rotenberry [67] | Fire | 2–65 | CS | 6 | 0.132 | 110.1 | 0.41 | — |
| Similarity | ||||||||
| Callison et al. [51] | Fire | 1–37 | CS | 7 | 0.522 | 50.4 | 0.55 | 95 |
| Brooks and Matchett [61] | Fire | 6–14 | CS | 3 | −5.596 | 92.2 | −0.91 | — |
| Vamstad and Rotenberry [67] | Fire | 2–65 | CS | 6 | 0.099 | 52.1 | 0.14 | 480 |
© 2010 by the authors; licensee Molecular Diversity Preservation International, Basel, Switzerland. This article is an open-access article distributed under the terms and conditions of the Creative Commons Attribution license (http://creativecommons.org/licenses/by/3.0/).
Share and Cite
Abella, S.R. Disturbance and Plant Succession in the Mojave and Sonoran Deserts of the American Southwest. Int. J. Environ. Res. Public Health 2010, 7, 1248-1284. https://doi.org/10.3390/ijerph7041248
Abella SR. Disturbance and Plant Succession in the Mojave and Sonoran Deserts of the American Southwest. International Journal of Environmental Research and Public Health. 2010; 7(4):1248-1284. https://doi.org/10.3390/ijerph7041248
Chicago/Turabian StyleAbella, Scott R. 2010. "Disturbance and Plant Succession in the Mojave and Sonoran Deserts of the American Southwest" International Journal of Environmental Research and Public Health 7, no. 4: 1248-1284. https://doi.org/10.3390/ijerph7041248