Article

Analysis of Airborne Betula Pollen in Finland; a 31-Year Perspective

1
Department of Teacher Education, University of Turku, Finland
2
Aerobiology Unit, University of Turku, Finland
3
Biostatistics and Epidemiology Branch, Health Effects Laboratory Division, National Institute for Occupational Safety and Health, Centers for Disease Control and Prevention, Morgantown, West Virginia, USA
4
Allergy and Clinical Immunology Branch, Health Effects Laboratory Division, National Institute for Occupational Safety and Health, Centers for Disease Control and Prevention, Morgantown, West Virginia, USA
*
Author to whom correspondence should be addressed.
Int. J. Environ. Res. Public Health 2009, 6(6), 1706-1723; https://doi.org/10.3390/ijerph6061706
Submission received: 31 March 2009 / Accepted: 20 May 2009 / Published: 26 May 2009
(This article belongs to the Special Issue Public Health: Feature Papers)

Abstract

:
In this 31-year retrospective study, we examined the influence of meteorology on airborne Betula spp. (birch) pollen concentrations in Turku, Finland. The seasonal incidence of airborne birch pollen in Turku occurred over a brief period each year during spring (April 30 – May 31). Mean peak concentrations were restricted to May (May 5 to 13). Statistically significant increases in the annual accumulated birch pollen sum and daily maximum values were observed over the study period. Birch pollen counts collected in April were retrospectively shown to increase over the duration of the study. Increases in April temperature values were also significantly associated with the earlier onset of the birch pollen season. Furthermore, the number of days where daily birch pollen concentrations exceeded 10 and 1,000 grains/m3 also increased throughout the study period. These data demonstrate that increases in temperature, especially during months preceding the onset of the birch pollen season, favor preseason phenological development and pollen dispersal. Birch pollen derived from other geographical locations may also contribute to the aerospora of Turku, Finland. To date, the public health burden associated with personal exposure to elevated birch pollen loads remains unclear and is the focus of future epidemiological research.

1. Introduction

Bioaerosols emanating from botanical sources pose a significant environmental health risk. Airborne Betula spp. (birch) pollen is one of the most recognized aeroallergens in northern European countries. Personal exposure to as few as 10 grains/m3 is known to exacerbate seasonal allergic rhinitis and asthma in birch sensitized individuals [13]. In Scandinavia, approximately 10–20 % of the atopic population is sensitized to pollen aeroallergen sources [1,46]. During the last two decades allergic sensitization has increased throughout the developed world [3,7]. Exposure to elevated concentrations of birch pollen has been proposed to be a potential etiological agent associated with this increase. However, variables that influence birch pollen dispersal such as the long-term effects of meteorology on flower phenology and inflorescence development remain uncharacterized in many Scandinavian environments.
Birch pollen is one of the most abundant aeroallergens in Europe. The birch inflorescence is characterized by flowers that produce millions of pollen grains that disseminate into the atmosphere following wind disturbance. Concentrations of birch pollen, as with most other anemophilous tree pollen types, may fluctuate year to year by more than an order of magnitude [810]. In boreal climates, the annual variation in airborne pollen counts may be even more extreme [11]. Temperature is an important predictor of the timing of birch flower phenology in boreal regions [12,13]. Meteorological parameters especially spring temperature, break dormancy and facilitate the development of inflorescences and pollen [14]. Recent studies have hypothesized that elevated temperature during this period permits the preseason development of inflorescences and enables early pollen dispersal [15,16]. This phenomenon is thought to extend and intensify birch pollen seasons across many European regions. To date, the long-term influence of meteorological variables immediately preceding the birch pollen season requires further longitudinal assessment in Turku, Finland.
In this retrospective study, we aimed to understand the impacts of variability in meteorological parameters on the dispersal of birch pollen in a Finnish environment. This information will assist in planning allergen avoidance strategies for birch sensitized individuals as well as help to provide unique insight into the increasing prevalence and future burden of allergic diseases in Finland and other Scandinavian countries.

2. Materials and Methods

2.1. Study Area

Finland is classified as a temperate coniferous-mixed forest zone. The city of Turku is located on the south western coastal plain of Finland (60° 27′ N 22° 17′ E) and close to the Baltic Sea. The pollen trapping site was situated at Turku University, approximately one kilometer north east of the city center and eight kilometers south west of the coast. The elevation of the trapping site was 59 meters above sea level and was located on top of a Turku University building. The site was predominantly surrounded by residential premises occupied by various plant species including; Acer platanoides, Alnus spp., Artemisia spp., Betula pendula, B. pubescens, Picea abies, Pinus sylvestris, Populus tremula, Sorbus spp., Tilia cordata, and Poaceae species.

2.2. Pollen Sampling Methods

Birch pollen sampling occurred in Turku, Finland, from 1974 to 2004 (data kindly provided by The Finnish Aerobiology Unit). Airborne birch pollen was collected using a seven-day Burkard volumetric sampler (Burkard Manufacturing Co. Ltd., Rickmansworth, Hertfordshire, UK). Air sampling methods followed the aerobiological standards set by the British Aerobiology Federation [17]. The Burkard sampler was calibrated to continuously sample air at ten liters per minute and the atmospheric particulate matter was deposited onto tapes coated with a thin film of mounting medium. Pollen grains were resolved using light microscopy, stained with Calberla's staining solution, and quantified using randomized fields according to the methods of Mäkinen [18]. Birch pollen counts were converted to daily averages per cubic meter of air. Due to similar morphological characteristics, the two Betula species, B. pendula (silver birch) and B. pubescens (downy birch), were included in the same Betula pollen category [10].

2.3. Meteorological Data

The meteorological data was obtained from the Finnish Institute of Meteorology. The Turku research station is situated at Turku airport, approximately 20 kilometers from the trapping site. The data included average temperature and precipitation. The annual mean temperature is defined as the mean of daily average temperature for the study period (31 years) and is also referred to as the long-term average temperature. The yearly total precipitation was defined as the sum of monthly total precipitation for the specified year.

2.4. Statistical Analyses

Data corresponding to 31 years (1974–2004) of pollen monitoring and meteorological records were documented graphically and evaluated statistically. Daily pollen counts were classified into three categories (≥10, ≥100, ≥1,000 grains/m3), a standard that was developed by The Aerobiology Unit, University of Turku, Finland [2]. Regression analyses and smoothing were used to detect long-term trends in daily average precipitation, temperature, and pollen concentrations in the air. The moving average was calculated to provide an objective measure of trend direction by smoothing the meteorological and birch pollen data [19]. This was accomplished by using the method of moving averages; where moving averages using a 12-month window were created using the monthly data. Given a sequence { α i } i = 1 N, an n-moving average is a new sequence { s i } i = 1 N n + 1 defined from the αi by taking the average of subsequences of n terms as follows [19]:
S i = 1 n i i + n 1 α i ,
Where:
N
total number of months; N = 372 (31 years × 12 months/year = 372)
i
month; i = 1, 2, 3, …, 372
αi
monthly data for temperature or total precipitation or pollen count for the month i.
n
number of months being averaged; n = 12
The annual and monthly pollen index was skewed to the right and also exhibited a heterogeneous variability that changed proportionally with the mean count. Natural log transformation was used to stabilize the variance, normalize the series, and the probability values (p-values) for all subsequent statistical analyses of pollen concentration were based on the transformed scale. The start and end date of the birch pollen season were when the accumulated pollen concentration reached 5% and 95% of the annual total [20]. Univariate statistical methods including correlation and regression analyses and graphical techniques were also used to examine the relationship between seasonal weather data and birch pollen aerobiology including annual and daily maximum pollen concentration, the number of days from the beginning of the year to the date of maximum pollen count, as well as the starting, ending and duration of birch pollen season. The following weather data were used as predictors: monthly total precipitation or monthly mean temperature from January to May of the current year and June to December of the prior year. The trend in monthly and annual total precipitation and mean temperature over the study period was examined using simple linear regression analyses where year is the predictor variable and annual or monthly meteorological variables were the response variables. Similarly, the trend in annual and seasonal pollen index (annual pollen index, monthly pollen index, daily maximum pollen index, and the number of days from the beginning of the year to the date of maximum pollen index) over the study period was examined using simple linear regression analyses with year as the predictor variable. A Pearson correlation analysis was used to determine the association between birch pollen season variables (starting date, ending date, and duration of pollen season) and monthly mean temperature or total precipitation. Similarly, the association between birch pollen load variables (annual pollen index, daily maximum pollen index, and the number of days from the beginning of the year to the date of maximum pollen index) was examined using Pearson correlation analysis. All statistical analyses were performed using the SAS/STAT software, version 9.2 for Windows.

2.5. Bonferroni Correction

In statistical tests with an alpha level of 0.05, one out of every twenty tests would be expected to generate a significant result simply by chance. The 0.05 level is a criterion for significance if an a priori hypothesis is constructed. However, in the current study a range of a posteriori (or post hoc) tests were used. To account for potential spurious significant results in the analysis, Bonferroni correction was used [19]. The result of a single test would be considered significant if its associated probability is less than the Bonferroni-adjusted level. The Bonferroni-adjusted significance level is calculated as Ijerph 06 01706i1 where α is the standard level of significance and k is the number of tests. In this study, we present the Bonferroni-adjusted significance levels where it is appropriate; however, all interpretations of results were presented using the standard significance level of 0.05.

3. Results

3.1. Meteorological Data

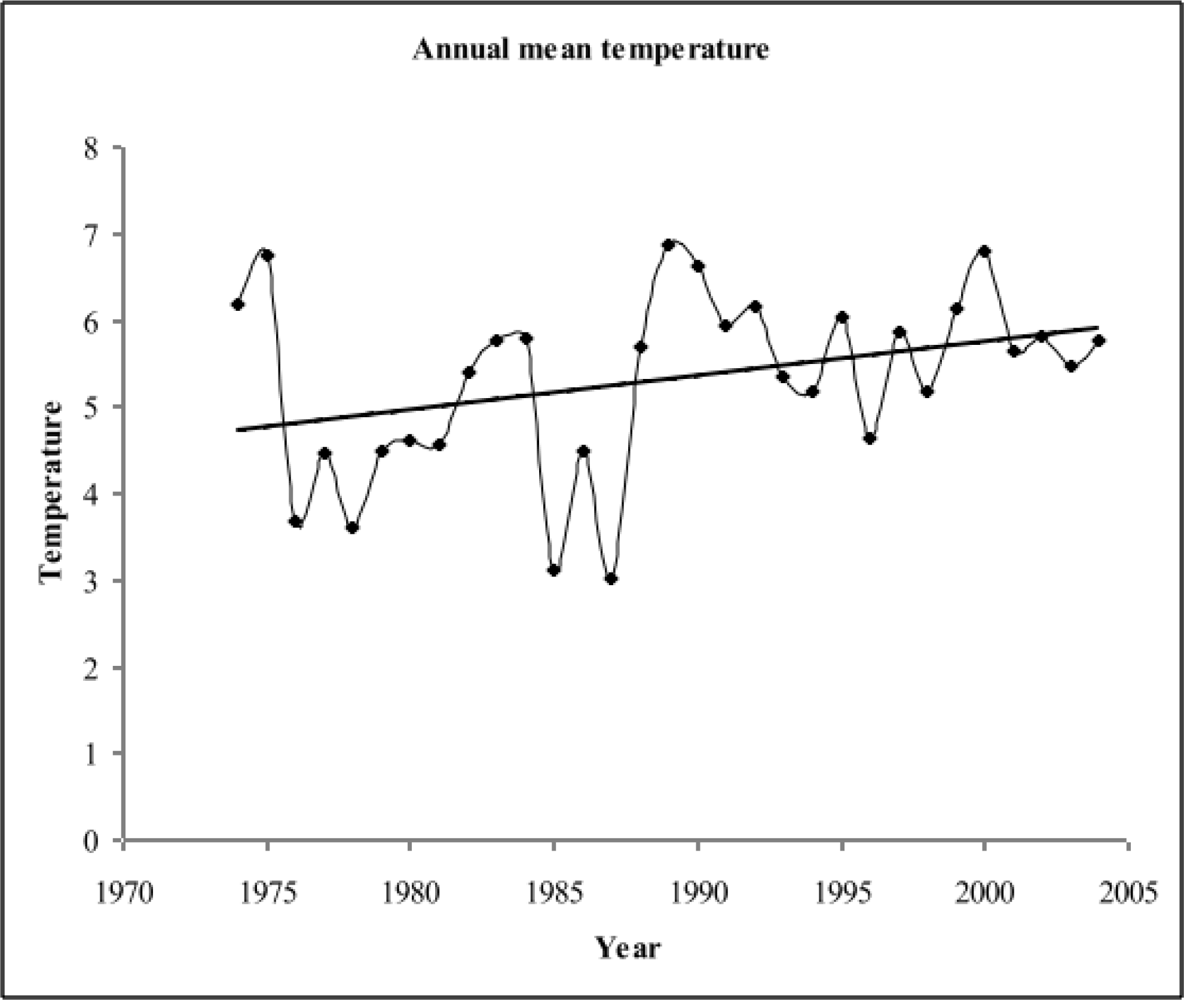
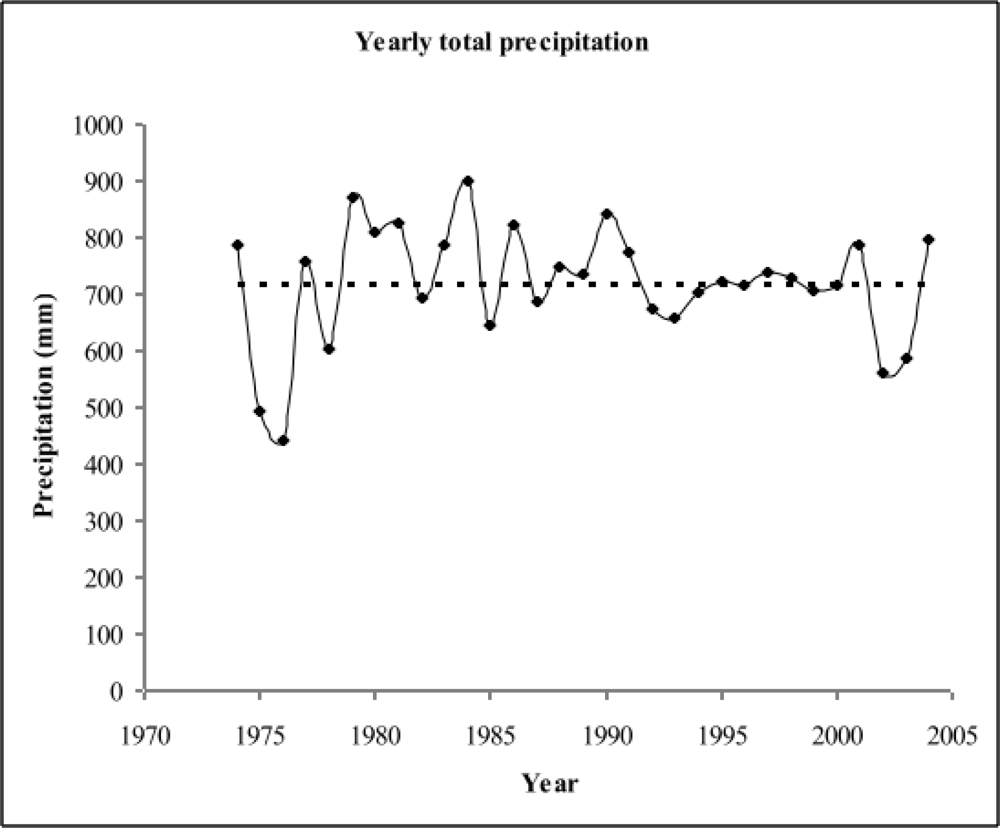
3.1.1. Long term trend in annual temperature and precipitation

During the study period (1974–2004), the annual average temperature ranged from 3.0 °C (1987) to 6.9 °C (1989), with an average of 5.3 °C (SD = 1). There were two periods that were above and below the mean temperature; pre-1988 temperatures were below the long-term average and post-1988 temperatures were slightly above average (Figure 1). Annual mean temperature demonstrated an increasing trend but this was not statistically significant (p = 0.0533, Figure 1 and Table 1).
The analysis of annual precipitation did not reveal a statistically significant change over the observed 30 years (p = 0.9836, Table 1 and Figure 2). Annual total precipitation ranged from 442.5 mm (1976) to 900 mm (1984) with a mean value of 719.9 mm (SD = 103.7).

3.1.2. Long term trend in monthly temperature and precipitation

The distribution of monthly mean temperature and monthly total precipitation for the study period were examined. June, July, and August were the hottest months of the year; whereas July and August were the wettest months of the year. The study area also received a significant amount of precipitation during the fall and early winter. In Table 1, the statistical analysis demonstrated that temperature in April, July, and August changed significantly over the observed study interval. From an aerobiological perspective, emphasis should focus on identifying trends during spring since birch actively develops inflorescences in birch flowers prior to bud burst during this period [15].

3.2. Birch Pollen Data

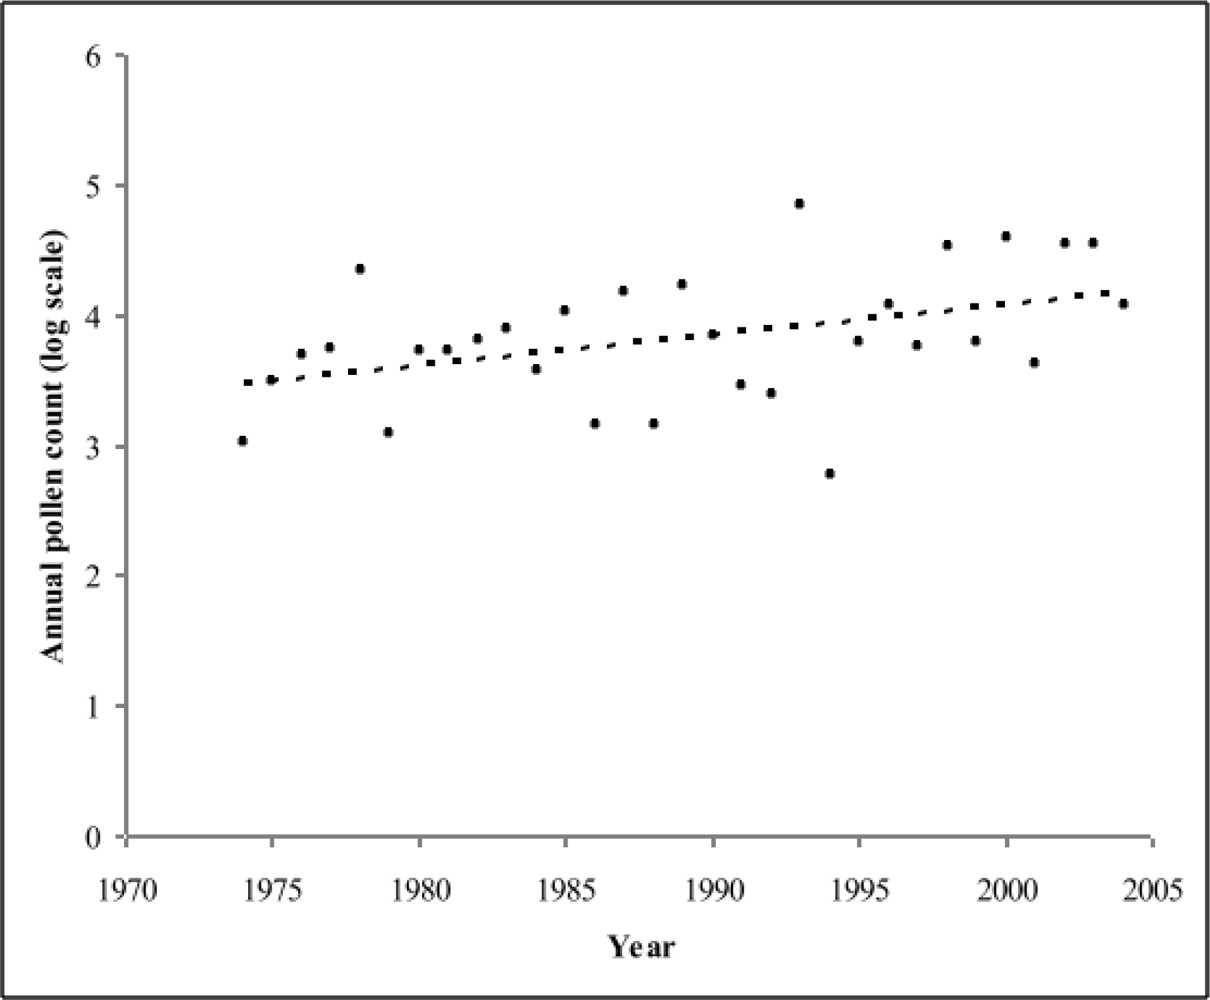
3.2.1. Trend in annual and seasonal pollen count

A statistically significant increase was observed in the annual accumulated pollen sum over the entire study period. The annual accumulated birch pollen sum ranged from 590 grains (1994) to 70,445 grains (1993; Table 2).
The variability of the annual cumulative pollen time series increased with increasing total pollen count indicating a heterogeneous variance. As a result, the annual cumulative pollen counts were log transformed to normalize the series and stabilize the variance. Regression analyses using the log transformed annual pollen count data demonstrated a significant linear increase in pollen concentrations during the study interval (R2 = 0.174, p = 0.0197, Table 2, Figure 3).
The distribution of total monthly pollen counts is shown in Figure 4. April and May were the predominant months with elevated concentrations of airborne birch pollen in the atmosphere of Turku, Finland. Regression analyses demonstrated a strong and significant increase in pollen counts during April over the study period (R2 = 0.429, p < 0.0001; Table 3).

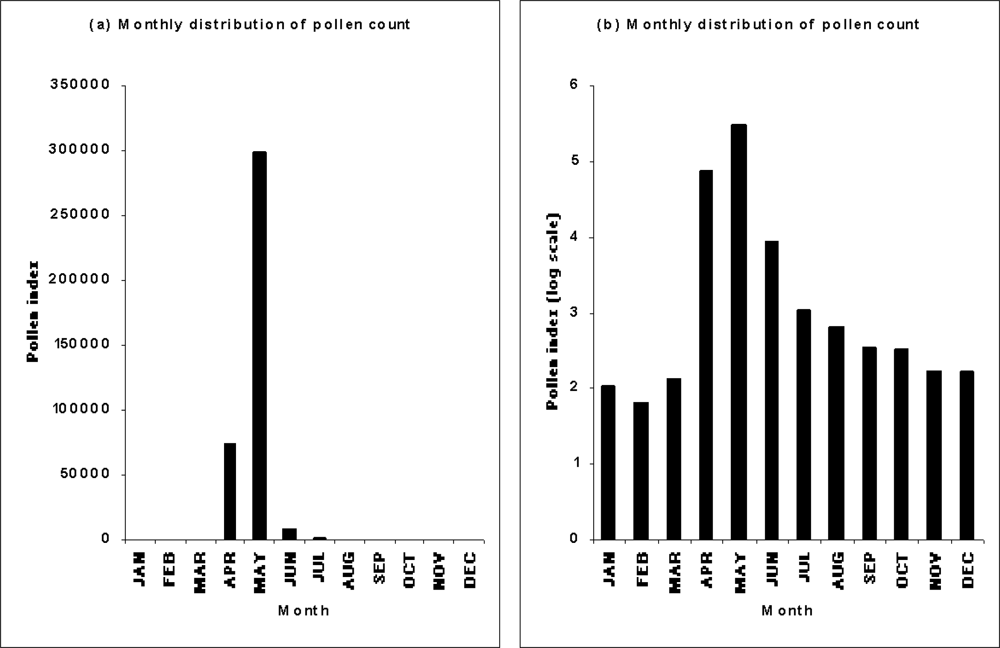
3.2.2. Behavior of pollen release and pollen transport

The maximum daily birch pollen count and the date of occurrence were estimated for each year (Table 2). On average, maximum counts occurred on the 9th day of May (number of days from the beginning of the year = 129.3, 95% CI = 125.6–133.0). The daily maximum pollen concentration (R2 = 0.18, p = 0.0175, Table 2) was observed to significantly increase over the study interval. In addition, the number of days before maximum daily pollen occurrence showed a trend towards earlier pollen release during later years (R2 = 0.287, p = 0.0019).

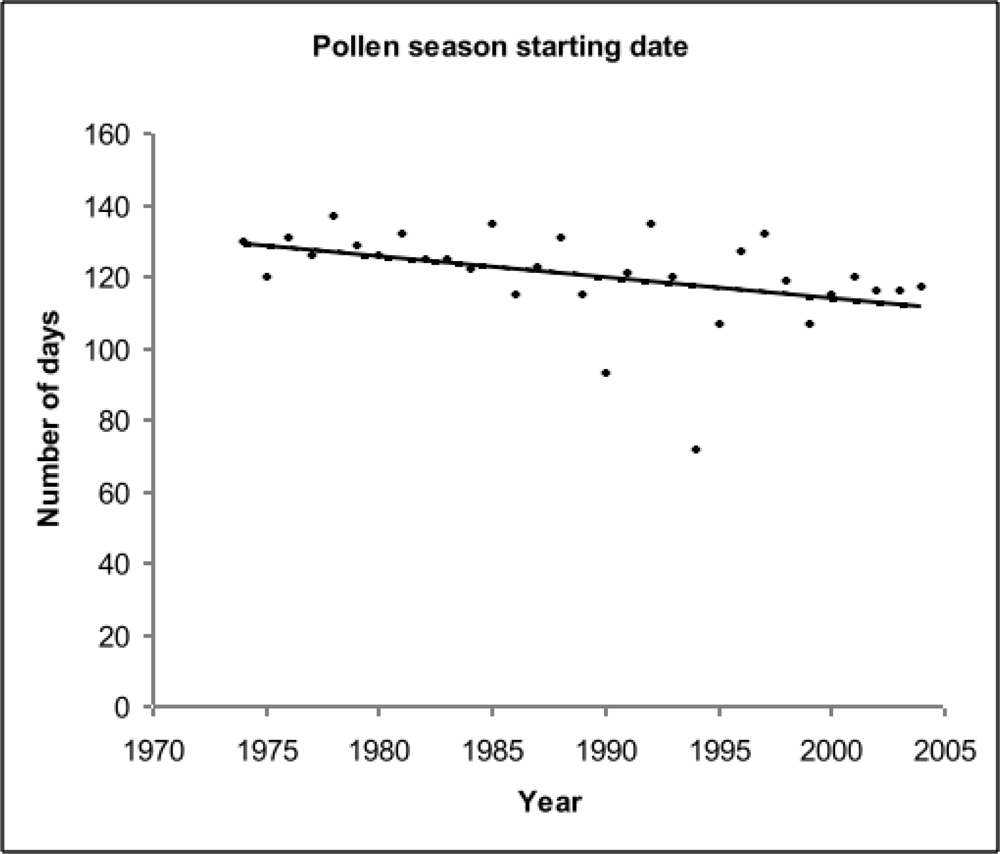
3.2.3. Birch pollen season

The start and end of the birch pollen season was estimated as the number of days from the beginning of the year (January 1st) to the dates when the accumulated pollen concentration reached 5% and 95% of the annual total. Using this approach, the birch pollen season commenced between April 30/May 1 and ended on May 31. The mean number of days from the beginning of the year to the start and end of the pollen season were 120.6 days (95% CI = 115.8–125.4) and 151.1 days (95% CI = 143.4–158.8), respectively. The average duration of the pollen season was 30.5 days (95% CI = 20.6–40.4). The two exceptions when the pollen season start date was premature were observed in 1990 (started early April, 93 days from the beginning of the year) and 1994 (started mid March, 72 days from the beginning of the year). The decreasing trend in the number of days to the start of the birch pollen season across the study period (R2 = 0.161, p = 0.0252, Figure 5) indicates a tendency for earlier pollen release (earlier season start) during later years. No significant trends were observed for the other birch parameters including the ending date and duration of the pollen season.

3.2.4. Associations between birch pollen season and meteorological parameters

Pearson correlation analysis of the different aspects of the birch pollen season (beginning, end, and duration of the pollen season) with the meteorological data (temperature and precipitation of the current and prior year) is demonstrated in Table 4. Significant negative correlations were observed between the starting date of the birch pollen season and April temperature (r = −0.59, p = 0.0005) of the current year. In contrast, significant positive correlations were observed with temperature in November of the prior year (r = 0.40, p = 0.0305). These data suggest that elevated temperature in April favors earlier pollen development and release, whereas warmer temperatures recorded in November may alter the vernalisation period and favor a delayed start to the Birch pollen season. Significant negative correlations were also observed between the ending date of the pollen season and temperature in February (r = −0.36, p = 0.0448) of the current year and June (r = −0.45, p = 0.0133) and September (r = −0.63, p = 0.0002) of the prior year. Duration of the pollen season did not show any statistically significant associations with monthly temperature of the current year, however, significant negative correlations were observed with prior year temperature in June (r = −0.40, p = 0.0300) and September (r = −0.47, p = 0.0084). Statistically significant negative correlations were also observed between precipitation in January (r = −0.42, p = 0.0194) and March (r = −0.53, p = 0.0023) and the start date of the pollen season, whereas precipitation in March (r = 0.39, p = 0.0302) and April (r = 0.36, p = 0.0499) was positively correlated with duration of the pollen season. These findings suggest that temperature in the months preceding the pollen season favor the early release of pollen. The influence of other meteorological parameters such as precipitation in association with temperature will be explored in future studies using hierarchical multiple regression analysis.

3.2.5. Correlation of birch pollen concentration (annual, daily maximum, and date of daily maximum) with temperature and precipitation

Pearson correlation analysis of the annual cumulative pollen sum, daily pollen count, and date of maximum daily pollen count with seasonal temperature and precipitation is shown in Table 5. Significant negative correlations were observed between the number of days from the beginning of the year to the maximum daily occurrence of birch pollen and the mean temperature in April (r = −0.61, p = 0.0002), mean temperature of February to April (FMA, r = −0.48, p = 0.0055), and mean temperature of February to May (FMAM, r = −0.46, p = 0.0084) of the current year. Statistically significant negative correlations were identified between temperature in July and September of the prior year and the number of days from the beginning of the year to the maximum daily occurrence of pollen. In contrast, significant positive correlations were observed between temperature in July and September of the prior year and the annual pollen index and the daily maximum pollen index (Table 5).

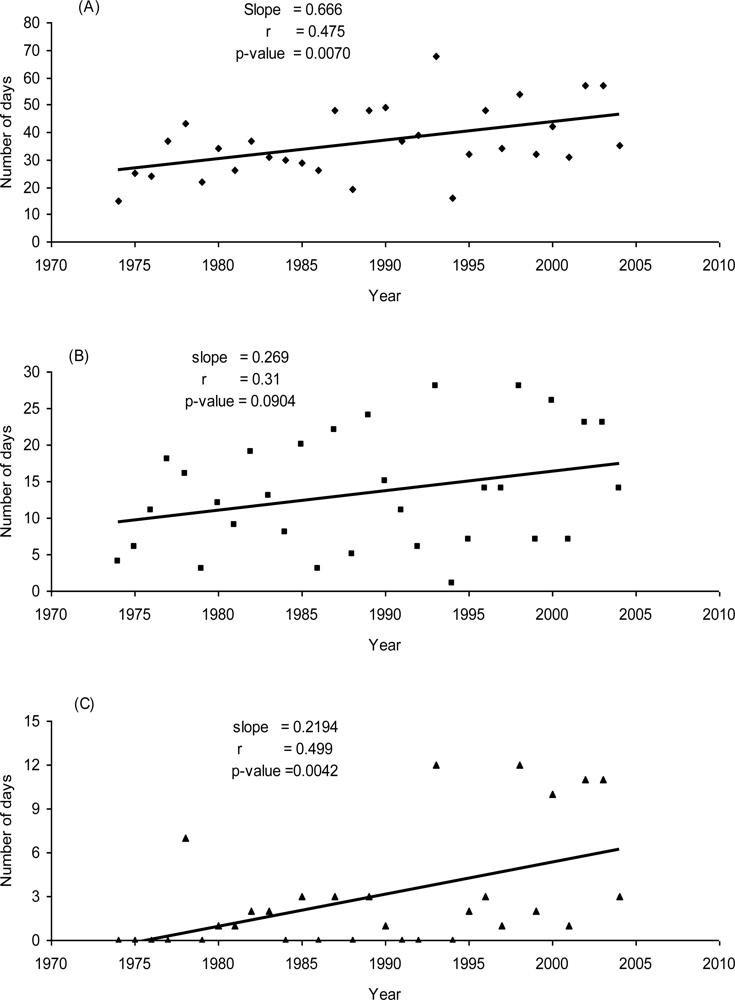
3.2.6. The number of days with daily birch pollen concentration exceeding 10, 100, and 1000 grains/m3 of air during seasons 1974–2004

The number of days when the daily average birch pollen load exceeded ≥ 10 grains/m3 of air significantly increased throughout the duration of the study (p = 0.0070; Figure 6A). This was also observed in data derived from when the daily pollen load exceeded 1000 grains/m3 (p = 0.0042; Figure 6C). Daily average birch pollen counts ≥100 grains/m3 were regularly recorded during the last 11 years, but prior to this period daily average birch pollen counts were predominantly < 100 grains/m3.

4. Discussion

The results from this retrospective study show statistically significant increases in the annual and daily average birch pollen concentrations over the 31-year study period. The timing of the birch pollen seasons were also shown to commence earlier each year throughout the duration of the study. Similar results have been previously reported in Leiden, The Netherlands [21], and Derby, England [8]. Our analyses additionally demonstrated statistically significant correlations between the onset of the birch pollen season and daily average temperature recorded in April. These results are in agreement with previous European studies that have reported associations between spring warming events and earlier starting dates of the birch pollen season [9,15,16,2225]. Meteorological parameters in the preceding year influence aspects of the birch pollen season as demonstrated in previous investigations that have shown that the initiation and growth of male catkins, until the formation of microspores, occurs during the year before flowering [26]. The amount of birch pollen recorded in a season can also be related to meteorological variables of the preceding year [24,27]. Moreover, climate change in spring has also been proposed to affect the timing and incidence of spring flowering events [2831]. These findings, in addition to the results presented in this study, further demonstrate that pre-seasonal temperature increases in spring could break winter dormancy and cause birch pollen seasons to commence earlier.
Alternative parameters such as long distance pollen dispersal in association with meteorological parameters have also been proposed to influence the onset of the birch pollen season in other regions of Scandinavia [11,32]. Long distance birch pollen dispersal can contribute significant concentrations of pollen to the aerospora of other geographic locations in Europe [11,32,33]. In the present study, it is possible that the earlier birch pollen season start dates observed in 1990 and 1994 resulted from the contribution of long distance birch pollen derived from other regional sources. This is an important consideration for the future interpretation of aerobiological data derived from Turku, Finland.
Trends in elevated annual birch pollen counts may also be influenced by retrospective impacts of urbanization on local Betula spp. communities. The supplementary planting of ornamental birch species throughout Turku and the size of residential Turku environments are variables that may lead to the spatial intensification of the airborne pollen biomass. Unlike several studies located in the United Kingdom [27,34,35] and Denmark [36], the majority of longitudinal European airborne pollen analyses have not addressed these aspects. It appears that this scenario, compared to long distance transport of pollen, could also be important predicting parameters of the birch pollen season in Turku, Finland. Furthermore, other urbanization impacts, such as soil nutrification, habitat fragmentation, disturbance, and the urban heat island effect may have enhanced the growth rates of local birch species. These aspects may directly enhance regional birch phenology. It is hypothesized that temporal increases in plant growth will result in exponential increases in inflorescence presentation. Although these aspects were not directly explored in the present study, future studies should explore these parameters when interpreting birch pollen data derived from retrospective datasets.
During the study period, statistically significant increases in the number of days where daily average birch pollen counts exceeded 10 and 1000 grains/m3 were observed. Increases in the duration of the birch pollen season, in addition to daily pollen concentrations greater than 10 grains/m3 of air, represent a significant risk factor for the exacerbation of respiratory morbidity in birch sensitized individuals [2]. Longitudinal epidemiological studies have shown decadal increases in the prevalence of allergic sensitization and asthma in developed countries [1,3740]. It is commonly hypothesized that these increases are associated with environmental factors, personal hygiene, and improved standards of living [39,41]. However, the results of this study indicate that the higher birch pollen burden recorded during the last decade may also function as a predisposing factor for the development of atopic sensitization in Turku, Finland. Moreover, Scandinavian studies demonstrate that personal exposure to elevated amounts of birch pollen during infancy is a risk factor for the development of birch pollen allergic sensitization [42,43], and even asthma [44]. Similar observations have been made with other environmental aeroallergens, including grass, mugwort, and olive pollen [45], as well as dust mite allergens [46].
In conclusion, we have shown significant increases in the annual birch pollen index and maximum daily average birch pollen concentrations recorded at Turku during the last 31 years. The onset of birch pollen seasons was also observed to occur earlier over the study period. The onset of the birch pollen season was also associated with daily average temperature in April. In addition to these findings, the number of days where elevated concentrations exceeded 10 and 1000 grains/m3 air increased throughout the duration of the study. Our results suggest that elevated spring temperature in months preceding the start of the birch pollen season favor earlier inflorescence development and pollen dispersal. To date, the public health burden of elevated pollen concentrations on patients sensitized to birch have not been addressed in Turku, Finland and will be the focus of future research.

Acknowledgments

The authors would like to thank the Finnish Aerobiology group, the University of Turku, Finland for the 1974–2004 pollen data. We especially thank Dr. Auli Rantio-Lehtimäki for her support and encouragement to pursue this study. The findings and conclusions in this report are those of the author(s) and do not necessarily represent the views of the National Institute for Occupational Safety and Health.

References

  1. Haahtela, T; von Hertzen, L; Mäkelä, M; Hannuksela, M. The Allergy Programme Working Group. Finnish Allergy Programme 2008–2018 - time to act and change the course. Allergy 2008, 63, 634–645. [Google Scholar]
  2. Viander, M; Koivikko, A. The seasonal symptoms of hyposensitized and untreated hay fever patients in relation to birch pollen counts: correlation with nasal sensitivity, prick test and RAST. Clin. Allergy 1978, 8, 387–396. [Google Scholar]
  3. World Health Organisation, Regional Office for Europe. Phenology and human health: allergic disorders: report on WHO meeting Rome, Italy 16–17 January 2003; WHO Regional Office for Europe: Copenhagen, Denmark, 2003. [Google Scholar]
  4. Aberg, N. Asthma and allergic rhinitis in Swedish conscripts. Clin. Exp. Allergy 1989, 19, 59–63. [Google Scholar]
  5. Eriksson, NE; Wihl, JA; Arrendal, H; Strandhede, SO. Tree pollen allergy. II. Sensitisation to various tree pollen allergens in Sweden. A multi-centre study. Allergy 1984, 36, 610–617. [Google Scholar]
  6. Haahtela, T; Lindholm, H; Bjorksten, F; Koskenvuo, K; Laitinen, LA. Prevalence of asthma in Finnish young men. Br. Med. J 1990, 301, 266–268. [Google Scholar]
  7. Moverare, R; Kosunen, TU; Haahtela, T. Change in the pattern of IgE reactivity to timothy grass and birch pollen allergens over a 20-year period. J. Inv. Allergol. Clin. Immunol 2006, 16, 274–278. [Google Scholar]
  8. Emberlin, J; Savage, M; Woodman, R. Annual variations in the concentrations of Betula pollen in the London area, 1961–1990. Grana 1993, 32, 359–363. [Google Scholar]
  9. Emberlin, J; Mullins, J; Corden, J; Millington, W; Brooke, M; Savage, M; Jones, S. The trend to earlier birch pollen seasons in the UK: Abiotic response to changes in weather conditions? Grana 1997, 36, 29–33. [Google Scholar]
  10. Hicks, S; Helander, M; Heino, S. Birch pollen production, transport and deposition for the period 1984–1993 at Kevo, northernmost Finland. Aerobiologia 1994, 10, 183–191. [Google Scholar]
  11. Ranta, H; Kubin, E; Siljamo, P; Sofiev, M; Linkosalo, T; Oksanen, A; Bondestam, K. Long-distance pollen transport cause problems for determining the timing of birch pollen season in Fennoscandia by using phenological observations. Grana 2006, 45, 297–304. [Google Scholar]
  12. Koenig, WD; Knops, JMH. Patterns of annual seed production by northern hemisphere trees: A global perspective. Amer. Naturalist 2000, 155, 59–69. [Google Scholar]
  13. Ranta, H; Oksanen, A; Hokkanen, T; Bondestam, K; Heino, S. Masting by Betula species; applying the resource budget model to North European data sets. Int. J. Biometeorol 2005, 49, 146–151. [Google Scholar]
  14. Linkosalo, T. Regularities and patterns in the spring phenology of some boreal trees. Silva Fenn 1999, 33, 237–245. [Google Scholar]
  15. Emberlin, J; Detandt, M; Gehrig, R; Jäger, S; Nolard, N; Rantio-Lehtimäki, A. Responses in the start of Betula (birch) pollen seasons to recent changes in spring temperatures across Europe. Int. J. Biometeorol 2002, 46, 159–170. [Google Scholar]
  16. Emberlin, J; Laaidi, M; Detandt, M; Gehrig, R; Jäger, S; Myszkowska, D; Nolard, N; Rantio-Lehtimäki, A; Stach, A. Climate change and evolution of the pollen content of the air in seven European countries: The example of Birch. Rev. Fr. Allergol. Immunol. Clin 2007, 47, 57–63. [Google Scholar]
  17. British Aerobiology Federation. Airborne pollens and spores, a guide to trapping and counting; British Aerobiology Federation: Harpenden, UK, 1996. [Google Scholar]
  18. Mäkinen, Y. Random sampling in the study of microscopic slides. Rep. Aerobiol. Lab Univ. Turku 1981, 5, 27–43. [Google Scholar]
  19. Shirely, D; Stanley, W; Daniel, C. Statistics for research; John Wiley & Sons Inc: New York, USA, 2003. [Google Scholar]
  20. Nilsson, S; Persson, S. Tree pollen spectra in the Stockholm region (Sweden), 1973–1980. Grana 1981, 20, 179–182. [Google Scholar]
  21. Jäger, S; Spieksma, FTM; Nolard, N. Fluctuations and trends in airborne concentrations of some abundant pollen types, monitored at Vienna, Leiden and Brussels. Grana 1991, 30, 309–312. [Google Scholar]
  22. Spieksma, FTM; Emberlin, JC; Hjelmroos, M; Jäger, S; Leuschner, RM. Atmospheric birch (Betula) pollen in Europe: Trends and fluctuations in annual quantities and the starting dates of the seasons. Grana 1995, 34, 51–57. [Google Scholar]
  23. Frei, T. The effects of climate change in Switzerland 1969–1996 on airborne pollen quantities from hazel, birch and grass. Grana 1998, 37, 172–179. [Google Scholar]
  24. Rasmussen, AA. The effects of climate change on the birch pollen season in Denmark. Aerobiologia 2002, 18, 253–265. [Google Scholar]
  25. Mendez, J; Comtois, P; Iglesias, I. Betula pollen: One of the most important aeroallergens in Ourense, Spain. Aerobiological studies from 1993 to 2000. Aerobiologia 2005, 21, 115–123. [Google Scholar]
  26. Dahl, A; Strandhede, SO. Predicting the intensity of the birch pollen season. Aerobiologia 1996, 12, 97–106. [Google Scholar]
  27. Stach, A; Emberlin, J; Smith, M; Adams-Groom, B; Myszkowska, D. Factors that determine the severity of Betula spp. pollen seasons in Poland (Poznan and Krakow) and the United Kingdom (Worcester and London). Int. J. Biometeorol 2008, 52, 311–321. [Google Scholar]
  28. Sparks, T; Jeffree, EP; Jeffree, CE. An examination of the relationship between flowering times and temperature at the national scale using long-term phonological records from the UK. Int. J. Biometeorol 2000, 44, 82–87. [Google Scholar]
  29. Menzel, A. Phenological anomalies in Germany and their relation to air temperature and NAO. Clim. Change 2003, 57, 243–263. [Google Scholar]
  30. Root, TL; Price, JT; Hall, KR; Schneider, SH; Rosenzweig, C; Pounds, JA. Fingerprints of global warming on wild animals and plants. Nature 2003, 421, 57–60. [Google Scholar]
  31. Crepinsek, Z; Kajfez-Bogataj, L; Bergant, K. Modelling of weather variability effect on phytophenology. Ecol. Model 2006, 194, 256–265. [Google Scholar]
  32. Hjelmroos, M. Evidence of long-distance transport of Betula pollen. Grana 1991, 30, 215–228. [Google Scholar]
  33. Estrella, N; Menzel, A; Krämer, U; Behrendt, H. Integration of flowering dates in phenology and pollen counts in aerobiology: analysis of their spatial and temporal coherence in Germany (1992–1999). Int. J. Biometeorol 2006, 51, 49–59. [Google Scholar]
  34. Corden, J; Millington, W; Bailey, J; Brookes, M; Caulton, E; Emberlin, J; Mullins, J; Simpson, C; Wood, AA. UK regional variations in Betula pollen. Aerobiologia 2000, 16, 227–232. [Google Scholar]
  35. Emberlin, J. Interaction between air pollutants and aeroallergens. Clin. Exp. Allergy 1995, 25, 33–39. [Google Scholar]
  36. Skjøth, CA; Geels, C; Hvidberg, M; Hertel, O; Brandt, J; Frohn, LM; Hansen, KM; Hedegård, GB; Christensen, J; Moseholm, L. An inventory of tree species in Europe - an essential data input for air pollution modelling. Ecol Model 2008. [Google Scholar]
  37. Björksten, B; Dumitrascu, D; Foucard, T; Khetsuriani, N; Khaitov, R; Leja, M; Lis, G; Pekkanen, J; Priftanji, A; Riikjarv, MA. Prevalence of childhood asthma, rhinitis and eczema in Scandinavia and Eastern Europe. Eur. Respir. J 1998, 12, 432–437. [Google Scholar]
  38. Latvala, J; von Hertzen, L; Lindholm, H; Haahtela, T. Trends in prevalence of asthma and allergy in Finnish young men: a nationwide study from 1966 to 2003. Br. Med. J 2005, 330, 1186–1187. [Google Scholar]
  39. Von Mutius, E; Martinez, FD; Fritzsch, C; Nicolai, T; Roell, G; Thiemann, HH. Prevalence of asthma and atopy in two areas of west and East Germany. Am. J. Respir. Crit. Care Med 1994, 149, 358–364. [Google Scholar]
  40. Rimpelä, A; Savonius, B; Rimpelä, M; Haahtela, T. Asthma and allergic rhinitis among Finnish adolescents in 1977–1991. Scand. J. Soc. Med 1995, 23, 60–65. [Google Scholar]
  41. Von Hertzen, LC; Mäkelä, MJ; Petäys, T; Jousilahti, P; Kosunen, TU; Laatikainen, T; Vartiainen, E; Haahtela, T. Growing disparities in atopy between the Finns and the Russians - a comparison of two generations. J. Allergy Clin. Immunol 2006, 117, 151–157. [Google Scholar]
  42. Björksten, F; Suoniemi, I; Koski, V. Neonatal birch-pollen contact and subsequent allergy to birch pollen. Clin. Allergy 1980, 10, 585–591. [Google Scholar]
  43. Kihlström, A; Lilja, G; Pershagen, G; Hedlin, G. Exposure to high doses birch pollen during pregnancy, and risk of sensitization and atopic disease in the child. Allergy 2003, 58, 871–877. [Google Scholar]
  44. Kihlström, A; Lilja, G; Pershagen, G. Exposure to birch pollen in infancy and development of atopic disease in childhood. J. Allergy Clin. Immunol 2002, 110, 78–84. [Google Scholar]
  45. Björksten, F; Suoniemi, I. Time and intensity of first pollen contacts and risk of subsequent pollen allergies. Acta Med. Scand 1981, 209, 299–303. [Google Scholar]
  46. Karachaliou, FH; Panagiotopoulou, K; Manousakis, M; Sinaniotis, K; Papageorgiou, F. Month of birth, atopic disease, and sensitisation to common aeroallergens in Greece. Ped. Allergy Immunol 1995, 6, 216–219. [Google Scholar]
Figure 1. Annual mean temperature (°C) for Turku, Finland. Regression analysis was used to detect long-term trends in temperature (R2 = 0.123, p-value = 0.0533).
Ijerph 06 01706f1
Figure 2. Annual precipitation (mm) for Turku, Finland. Regression analysis was used to detect long-term trends in precipitation (R2 = 0.00001, p-value = 0.9836).
Ijerph 06 01706f2
Figure 3. The trend in log-transformed annual cumulative birch pollen sum for the study period covering 1974–2004 and the fitted regression line (R2 = 0.174, p-value = 0.0197).
Ijerph 06 01706f3
Figure 4. Distribution of monthly total birch pollen index for the study period (1974–2004) using actual (a) and log-transformed index (b).
Ijerph 06 01706f4
Figure 5. Regression analysis of the onset of the birch pollen season for the study period 1974–2004. (R2 = 0.161, slope −0.5762, p = 0.0252).
Ijerph 06 01706f5
Figure 6. The trend in the number of days when daily average birch pollen concentration exceeded 10 (A), 100 (B), and 1000 (C) grains/m3 of air for each season. The slope of the regression line, the correlation coefficient and the p-value are shown.
Ijerph 06 01706f6
Table 1. Summary of seasonal trends in temperature and precipitation covering the study period 1974–2004; results of regression analyses (independent variable = years, dependent variable = temperature or precipitation, n = 31). The slope of the regression line, R2 and the p-value for significance of the slope are given. Statistical significance is based on alpha levels of < 0.05 (*), < 0.01 (**), and the Bonferroni-adjusted level of significance < 0.004 (***).
TemperaturePrecipitation
MonthSlopeCoefficient of determination (R2)p-valueSlopeCoefficient of determination (R2)p-value
Jan0.06730.0230.41590.41880.0200.4429
Feb0.07410.0280.37110.13850.0010.8713
Mar0.06520.0800.12210.37000.0320.3379
Apr0.08040.2030.0109*−0.05450.0010.8917
May−0.00940.0030.7750−0.07990.0010.8782
Jun0.00740.0010.84030.64730.0430.2637
Jul0.08730.2300.0063**−0.07160.00020.9346
Aug0.07060.1630.0242*−0.15360.0010.8491
Sep0.04010.0530.2147−0.88420.0400.2790
Oct0.01010.0020.80600.01190.000010.9862
Nov−0.04780.0390.2872−0.73880.0240.4104
Dec0.03810.0130.54450.43990.0140.5242
Annual10.03990.1230.05330.04390.000010.9836
1Annual mean temperature or annual total precipitation
Table 2. The annual accumulated birch pollen sum, daily maximum pollen count, and number of days to the maximum daily occurrence of pollen and the date of occurrence, covering the period from 1974 to 2004, including slope of trend regression line, correlation coefficient, and probability value (based on log transformed values).
YearAnnual cumulative pollen (grains)Daily maximum(grain/m3)Number of days to daily maximumMonthDay
19741065231137517
19753119646133513
19764931798136515
19775574679140520
1978221945859141521
19791235126141521
19805379100412958
198154131383136516
19826493168312858
19837956157912858
19843804658136515
1985108231933139519
19861454194118428
1987152913910137517
19881459252133512
1989170426321117427
199070781550114424
19912883269151531
19922512595143522
1993704451629112252
199459010312757
199561252208111421
1996119243581133512
199757081207135515
199833933573712353
199961252208111421
2000387138832120429
20014181165912151
200235215552612353
200335209552612353
2004118971670121430
Slope of regression line0.05330.0604−0.0046
Correlation coefficient0.4170.424−0.536
p-value0.01970.01750.0019
Table 3. Summary of monthly trends in airborne birch pollen counts covering the study period 1974–2004; results of regression analyses (independent variable = years, dependent variable = pollen count in log scale, n = 31). The slope of the regression line, R2 and the p-value for significance of the slope are given. Statistical significance is based on alpha levels of < 0.05 (*), < 0.01 (**), and the Bonferroni-adjusted level of significance < 0.004 (***).
MonthlySlopeCoefficient of determination (R2)p-value
Apr0.10210.429< 0.0001***
May0.01210.0350.3123
Jun0.00100.00040.9196
Jul0.01340.0170.2297
Table 4. Correlation of the different birch pollen season variables (starting date, ending date, and duration of the pollen season) with monthly temperature and precipitation, covering the period from 1974 to 2004 (n = 31, the correlation coefficient and the probability value are given). Statistical significance is based on alpha levels of < 0.05 (*), < 0.01 (**), and the Bonferroni-adjusted level of significance < 0.003 (***).
TemperaturePrecipitation
MonthStarting dateEnding dateDurationStarting dateEnding dateDuration
Prior YearJun0.10−0.45*−0.40*−0.140.230.25
Jul−0.26−0.29−0.060.120.02−0.11
Aug0.16−0.15−0.15−0.210.170.22
Sep0.08−0.63***−0.47**0.310.000.08
Oct0.160.080.050.06−0.19−0.29
Nov0.40*−0.04−0.190.42*−0.03−0.24
Dec−0.04−0.01−0.05−0.37*−0.020.15
Current YearJan−0.170.010.11−0.42*−0.140.17
Feb−0.01−0.36*−0.080.02−0.19−0.04
Mar−0.24−0.120.18−0.53**0.350.39*
Apr−0.59***−0.290.09−0.210.240.36*
May0.14−0.18−0.260.04−0.10−0.02
FMA1−0.25−0.36*0.04−0.250.060.24
FMAM2−0.19−0.37*−0.03−0.220.020.22
Annual3−0.31−0.190.15−0.080.020.15
1Average temperature for February, March and April (FMA) or mean of total precipitation for FMA
2Average temperature for February, March, April and May (FMAM) or mean of total precipitation for FMAM
3Annual mean temperature or total annual precipitation
Table 5. Correlation of the different birch pollen load variables (annual count, daily maximum count, and number of days to maximum daily count) with monthly temperature and precipitation, covering the period from 1974 to 2004 (n=31, the correlation coefficient and the probability value are given). Statistical significance is based on alpha levels of < 0.05 (*), < 0.01 (**), and the Bonferroni-adjusted level of significance < 0.003 (***).
TemperaturePrecipitation
MonthAnnualDaily maximumNumber of days to daily maximumAnnualDaily maximumNumber of days to daily maximum
Prior yearJun0.60**0.58***−0.11−0.25−0.17−0.05
Jul0.40*0.38*−0.49**0.150.100.21
Aug0.360.27−0.05−0.22−0.16−0.08
Sep0.45*0.47**−0.45*0.02−0.030.29
Oct−0.26−0.150.090.200.31−0.03
Nov−0.05−0.050.290.050.090.23
Dec0.010.09−0.07−0.18−0.12−0.25
Current yearJan−0.07−0.01−0.21−0.02−0.09−0.25
Feb0.210.25−0.32−0.17−0.16−0.08
Mar0.040.04−0.33−0.11−0.03−0.21
Apr0.200.24−0.61***−0.26−0.22−0.17
May0.220.18−0.070.040.020.00
FMA10.200.24−0.48**−0.27−0.22−0.20
FMAM20.240.27−0.46**−0.24−0.21−0.19
Annual3−0.040.02−0.43*−0.33−0.33−0.06
1Average temperature for February, March and April (FMA) or mean of total precipitation for FMA
2Average temperature for February, March, April and May (FMAM) or mean of total precipitation for FMAM
3Annual mean temperature or total annual precipitation

