Introduction
Remote sensors detect electromagnetic radiation (EMR) that is reflected or emitted from an object; and users can derive information about the object by studying the EMR signals. Remote sensing of terrestrial vegetation has been successful due to the unique spectral characteristics of green plants: low reflectance in red and high reflectance in Near-InfraRed (NIR) [
1]. The important plant pigments, Chlorophyll
a and
b, strongly absorb the energy in the blue (centered at 450 nm) and the red (centered at 670 nm) wavelengths for photosynthesis; and the internal spongy mesophyll structure of the plants’ leaves is responsible for the high reflectance in the near-infrared (NIR) region (700 – 1300 nm) [
2].
Spectral indices typically combine multi-dimensional spectral data into a manageable single value. Spectral indices for vegetation, including Simple Vegetation Index (SVI = NIR reflectance – Red reflectance) and Normalized Difference Vegetation Index (NDVI), have been created by utilizing the characteristics of vegetation reflectance in the red and NIR regions. NDVI, (NIR reflectance – Red reflectance) / (NIR reflectance + Red reflectance), has been extensively applied in vegetation studies using multi-spectral satellite wavebands. Use of NDVI has been a preferred method in vegetation studies due to its simplicity and versatility that enables comparison of data obtained under varying illumination conditions. The index values have been correlated with diverse plant characteristics, such as vegetation cover [
3], vegetation type [
4], water content [
5], biomass & productivity [
6], chlorophyll amount [
1], PAR (Photosynthetically Active Radiation) absorbed by a crop canopy [
7], and flooded biomass [
8] at a broad span of scales from individual leaf areas to global vegetation dynamics.
Normalized Difference Vegetation Index has also been used in studies of aquatic vegetation, especially floating and emergent aquatics [
9,
10]. However, Beget and Di Bella [
8] showed that NDVI values calculated from satellite bands decreased with increasing flooding levels and would not be a good indicator for agricultural crops flooded with water depths of 25 cm or greater even when the water was clear and the measurements were made inside a black chamber to exclude external scattering and light diffusion. It is because of the general pattern of vegetation reflectance with increasing flooding depths, reduced red absorption and NIR peak by vegetation [
11,
12]. The application of NDVI to submerged aquatic vegetation (SAV) that is adapted to the underwater life will be more difficult. SAV plants have reduced internal leaf structures and lack waxy cuticles compared to terrestrial or emergent plants, which would further affects the practical application of the common vegetation index.
In order to experimentally test if NDVI derived from satellite sensors (a multispectral index) can be used to depict SAV canopies in shallow waters, we collected reflectance data of common aquatic vegetation over controlled (outdoor tanks) experimental setting using a hand-held spectroradiometer. We analyzed the data to: (1) compare spectral reflectance characteristics of aquatic plants that are adapted to grow above water surface (emergent/floating vegetation) and below water surface (SAV); (2) document the effects of SAV in the composite upwelling energy from a water body; and (3) test if NDVI values for underwater plants can be improved if corrected for spectral attenuation caused by water.
Materials and Methods
Controlled Experimental Spectral Data Collection
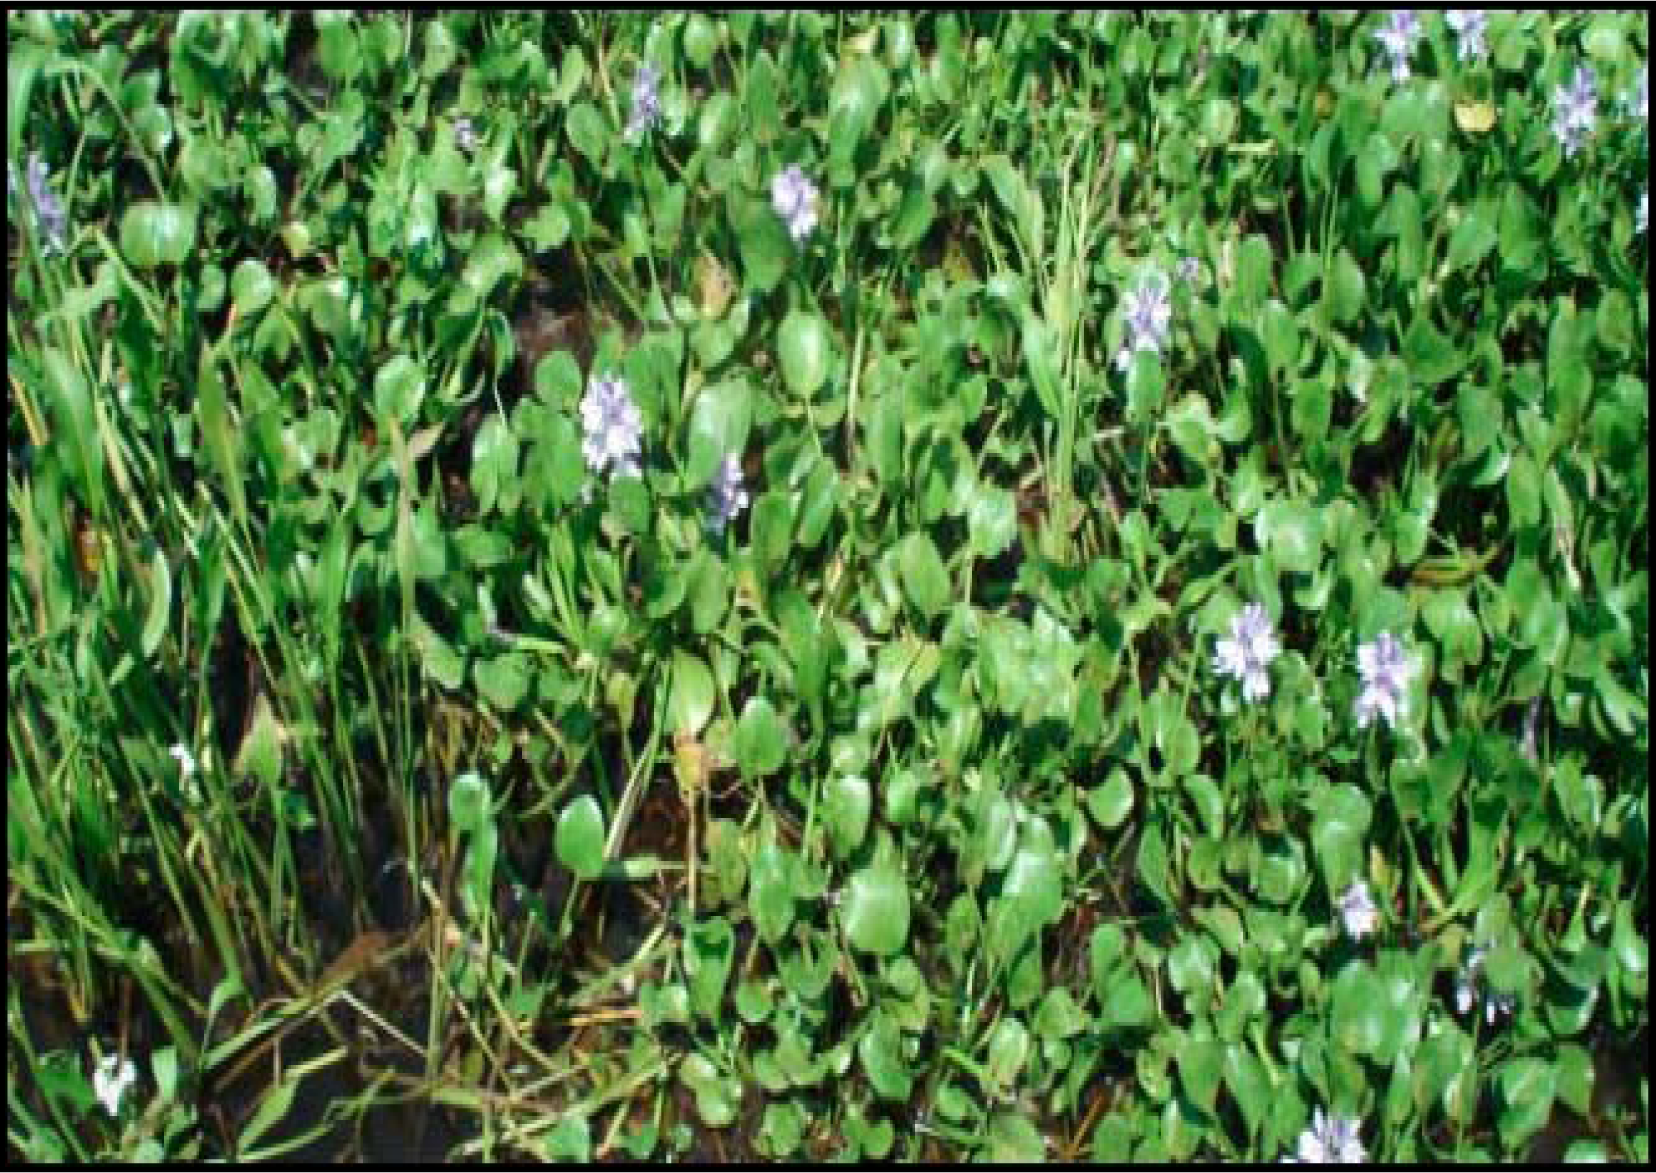
Close range spectral measurements of downwelling and upwelling energy were made over outdoor tanks (0.5 m deep, 100 gallon tank) that contained the floating/emergent waterhyacinth (
Eichhornia crassipes) (
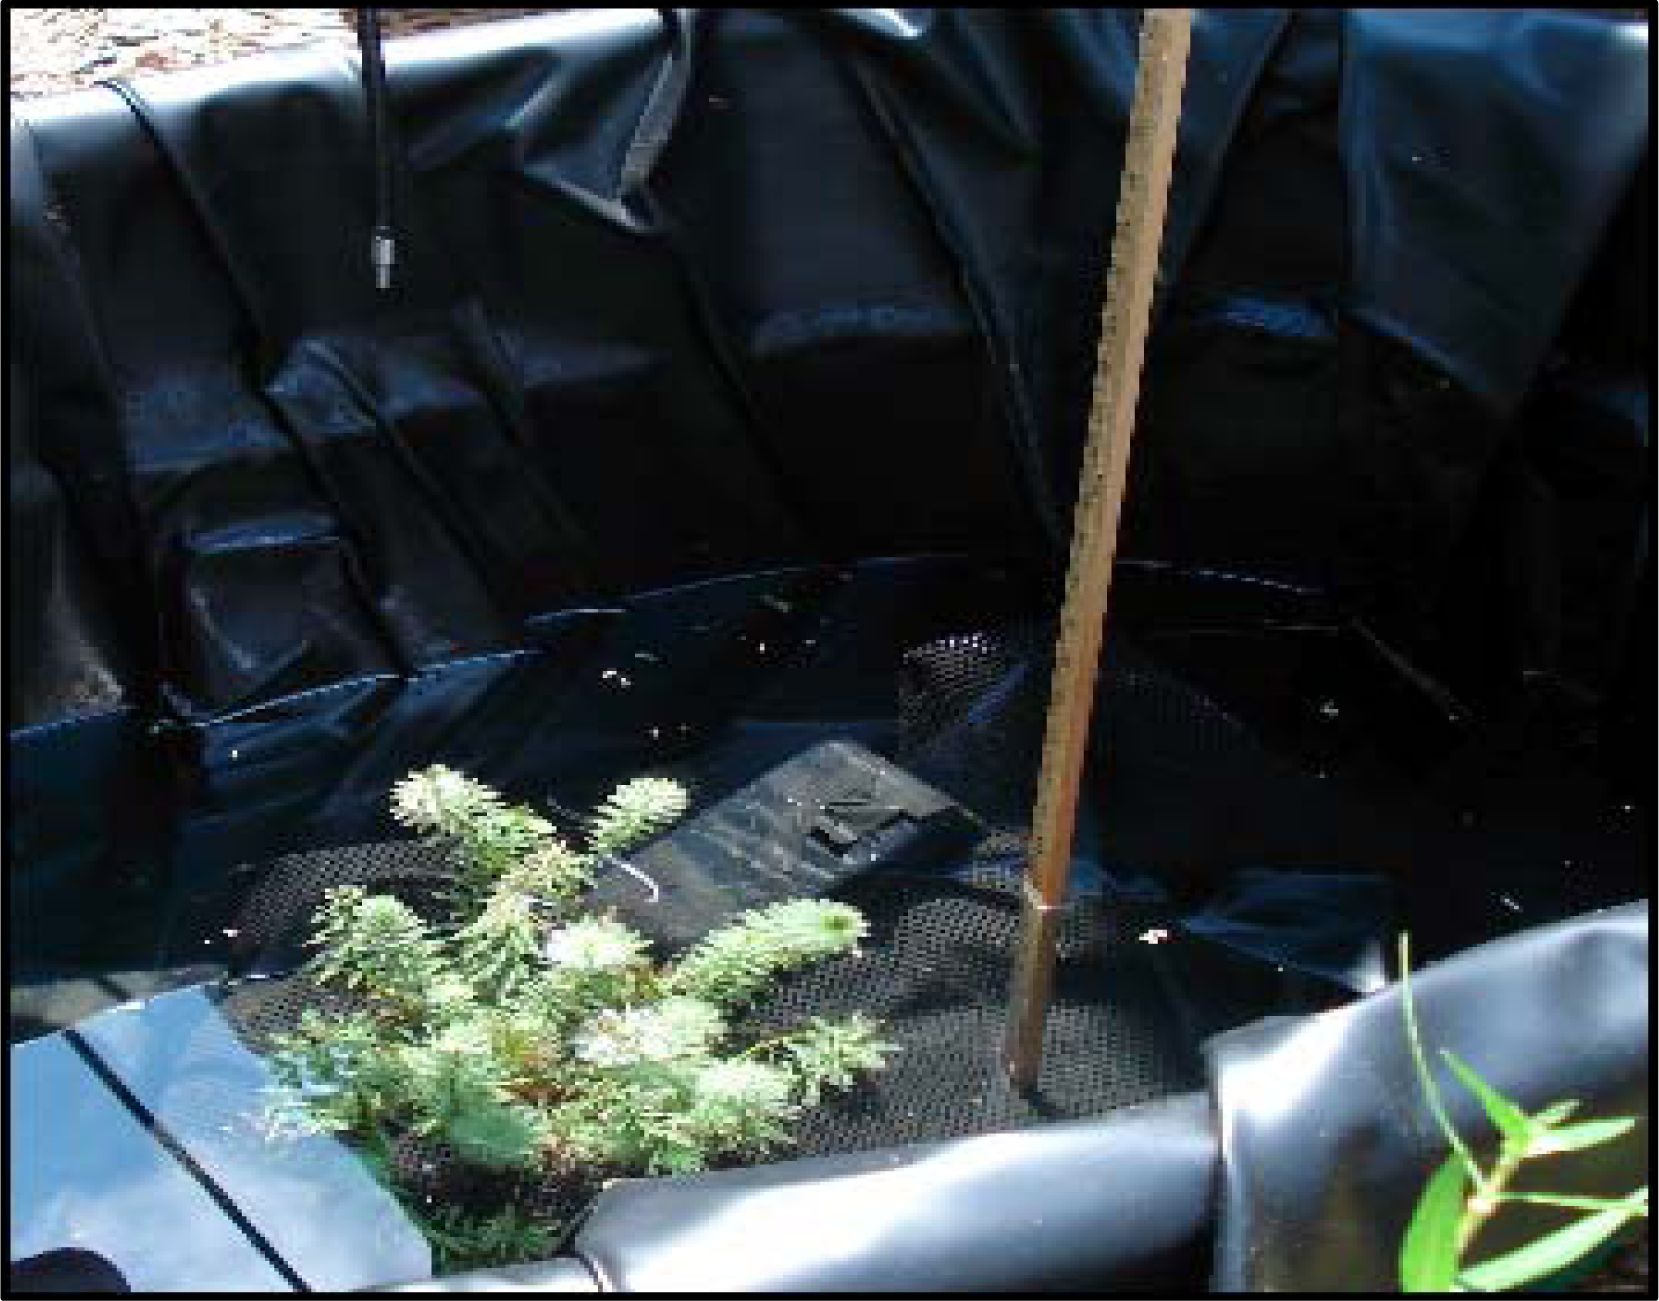
Fig. 1) or the submerged species, parrot feather (
Myriophyllum aquaticum), fanwort (
Cabomba caroliniana), and coontail (
Ceratophyllum demersum) (
Fig. 2). Spectral measurements were made on clear skies at near solar noon to minimize variability of solar elevation.
For the emergent plants, a GER 1500 spectroradiometer (Spectra Vista Corporation) was used to scan healthy green E. crassipes (waterhyacinth) leaves, brown senescing E. crassipes leaves, submerged healthy E. crassipes leaves, and purple E. crassipes flowers. The measurements were made 10 cm above the target plant parts in order to obtain the fine spatial resolution data to distinguish reflectance from different parts of the plants (instantaneous field of view was 8°).
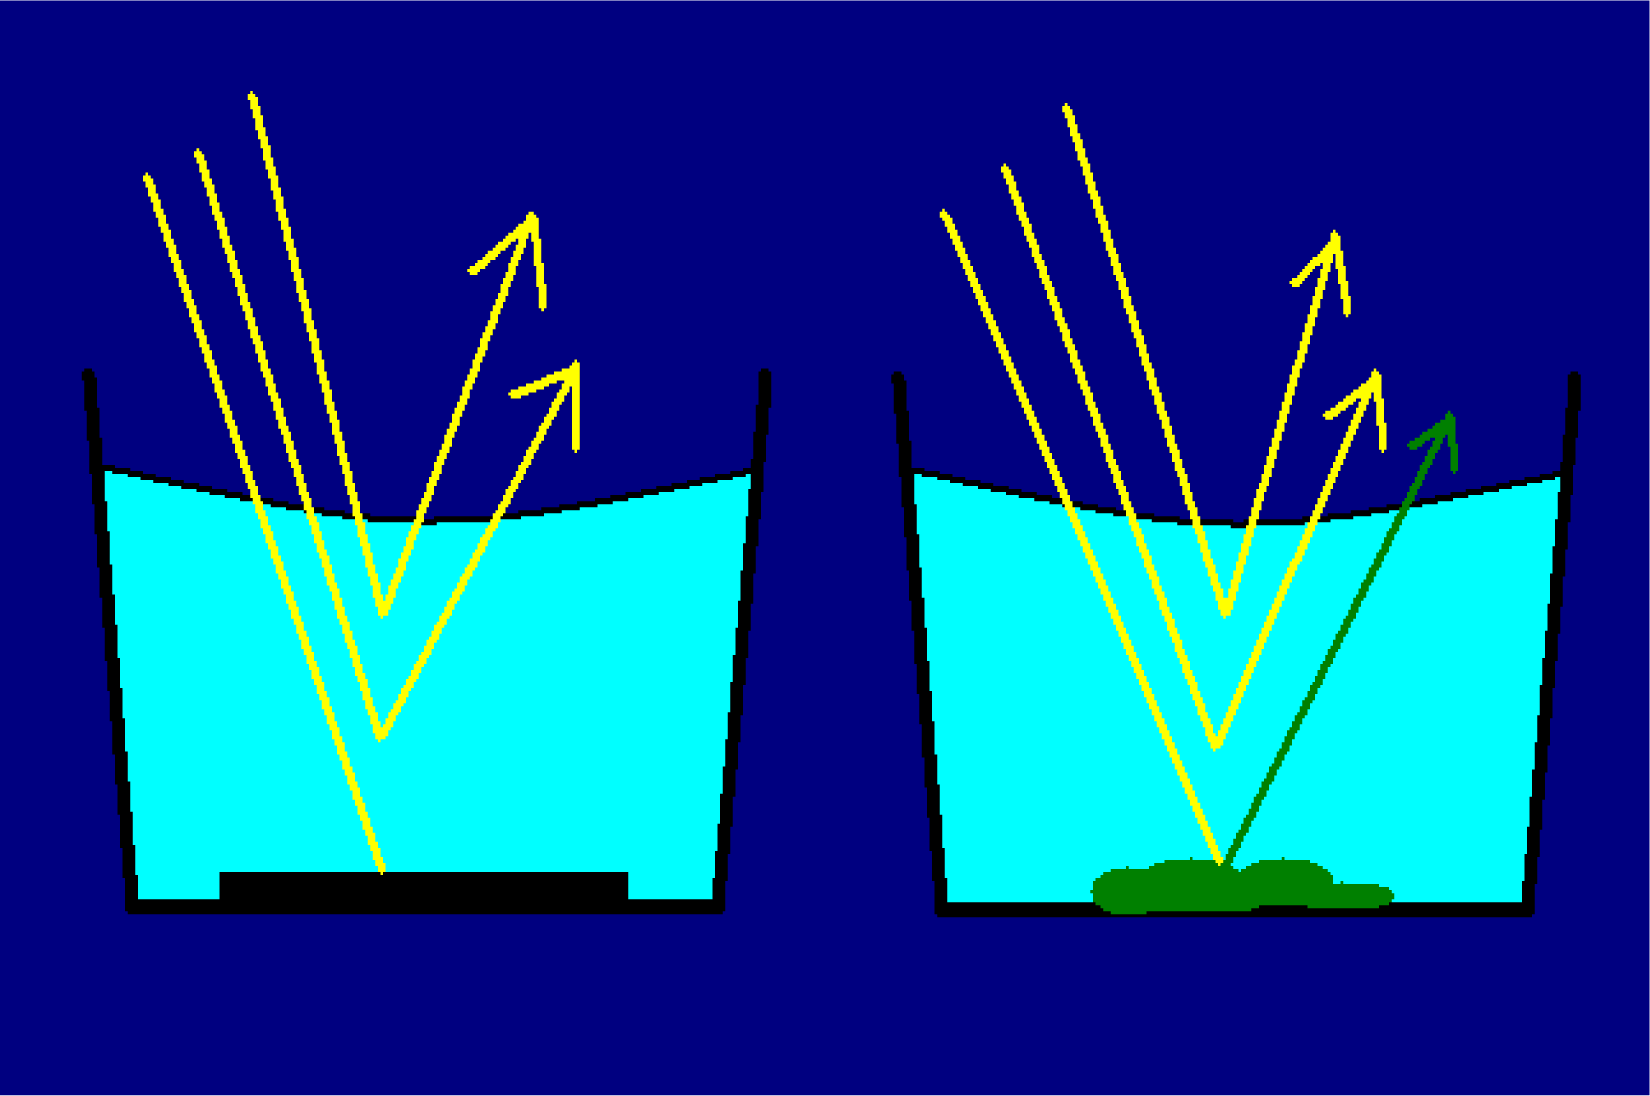
To obtain the depth-induced variations in the spectral responses of SAV, a mixture of M. aquaticum, C. demersum and C.caroliniana was threaded through a black mesh sheet and fixed on the bottom of a black-lined tank. The plants were planted at a density similar to the mean natural density during the local growing season. The inside of the tanks were lined with black plastic pond liners to eliminate reflectance from the interior surface. The tank was initially filled to the top (approximately 50cm) using city tap water, then the water was continuously siphoned out with upwelling spectral measurements taken every 1.0cm in water-depth change until canopy level (10–20cm) was reached. As the water level is lowered, the sensor head was also lowered to keep a constant distance between water surface and the sensor.
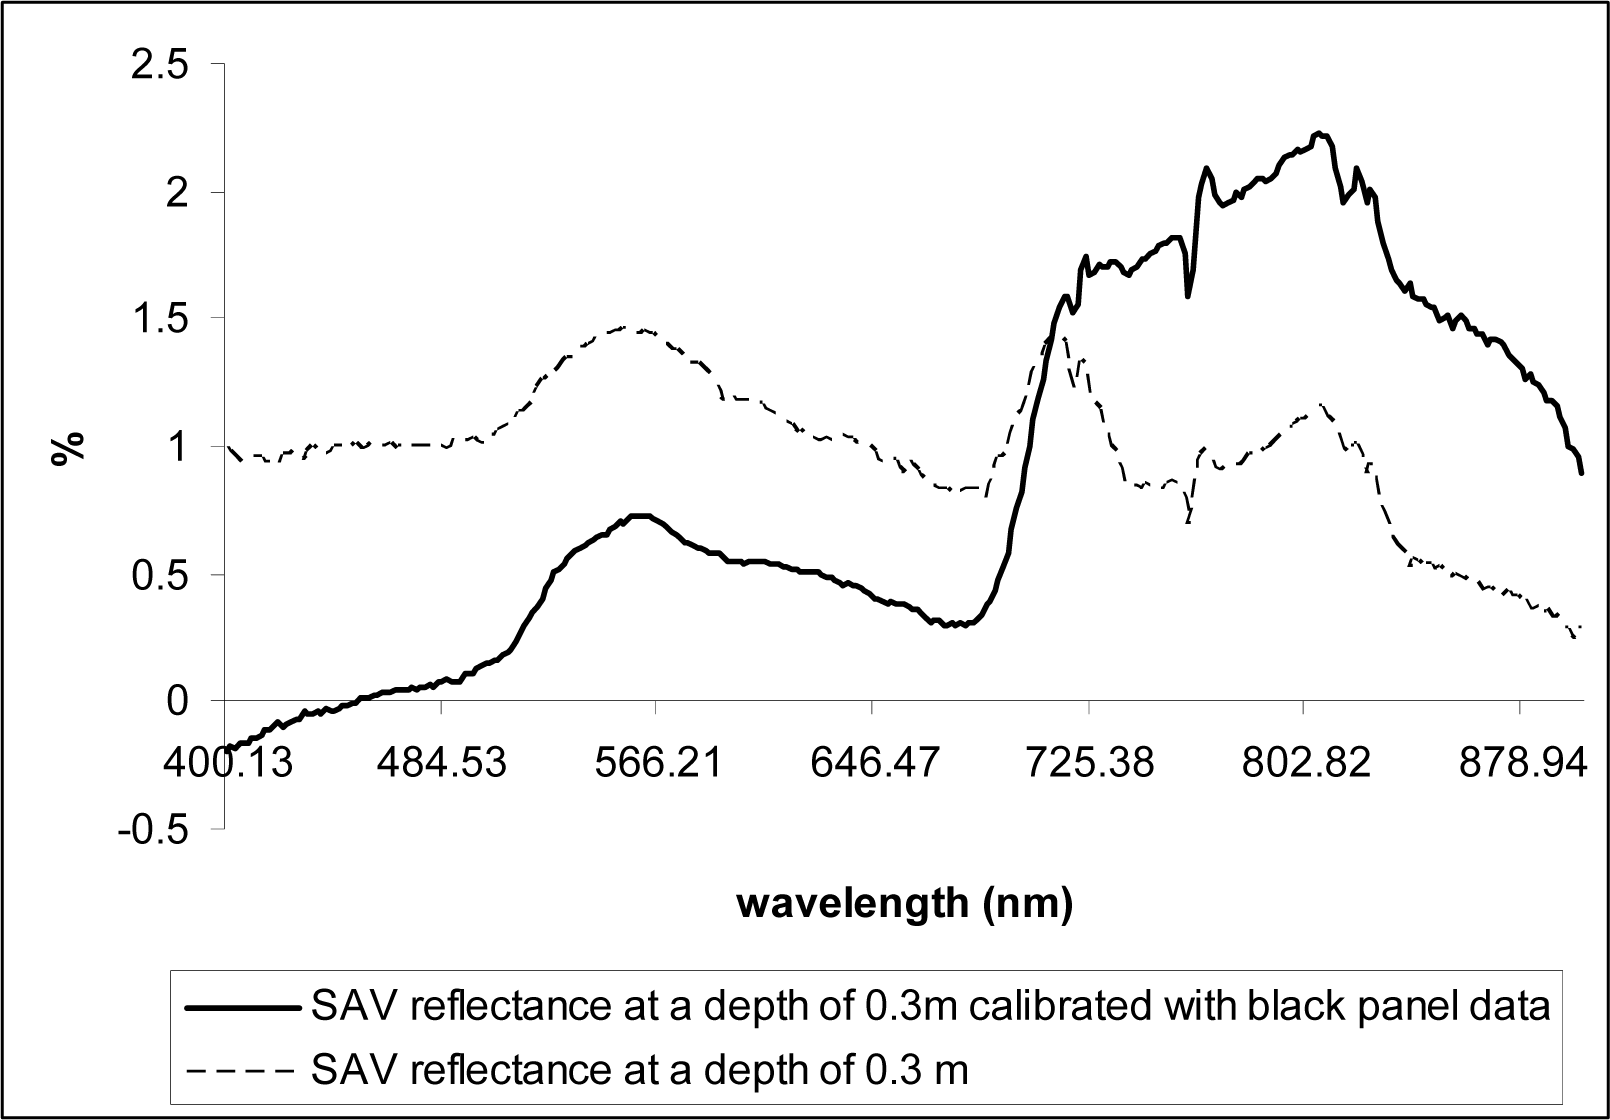
The same measurements were taken over a black panel (35cm × 62cm) deployed at the bottom of the same tank to obtain data on the water depth-induced spectral variations but without the bottom reflectance effects (vegetation), assuming the black panel absorbs incoming radiation that reaches the bottom of the tank (
Fig. 3).
Throughout the study, at least three replicate scans were taken for each depth and each setting and the mean values were used in analyses. Downwelling radiance was measured at the beginning of each set of collection using a white spectralon panel (99% reflectance) for calibration of the data collected on different days.
Calibration of Spectral Data
The spectral data were used for the computation of percent reflectance where reflectance (%) = (upwelling radiance) / (downwelling radiance) * 100. Reflectance values were calculated only between 400–900 nm to eliminate low signal-to-noise ratio of the data collected in the shorter and the longer wavelengths. The resulting data contained 315 contiguous bands.
Data Analysis
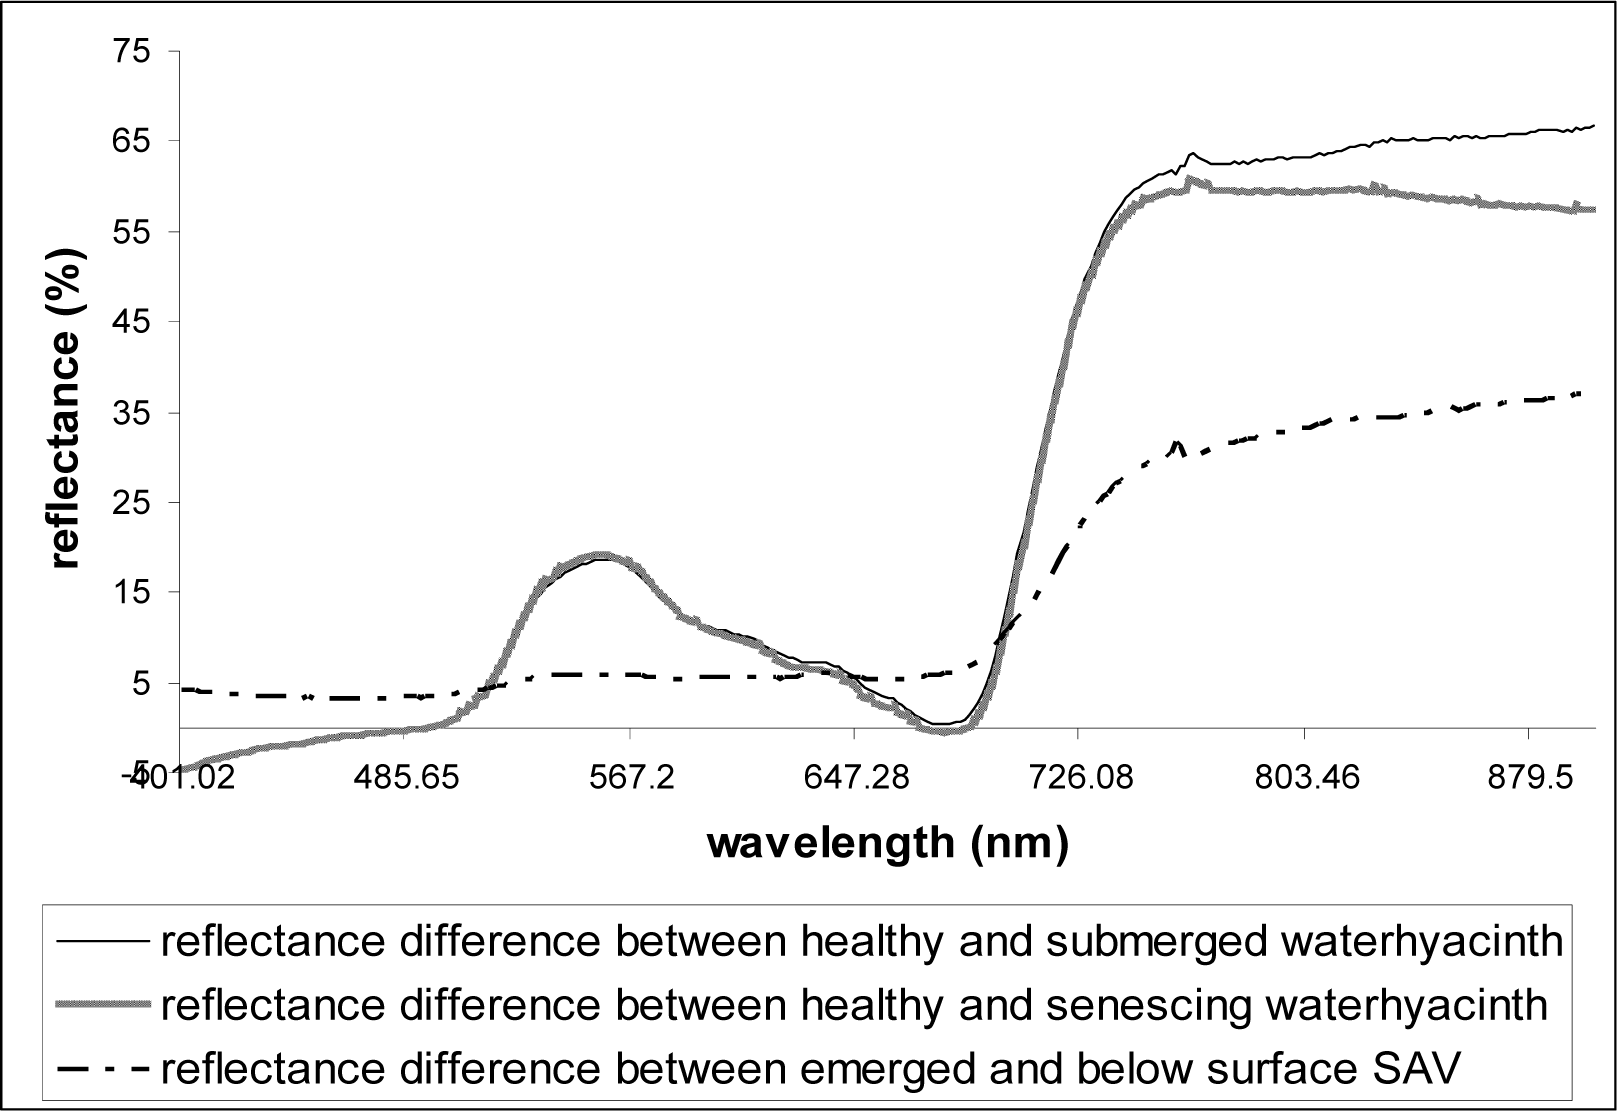
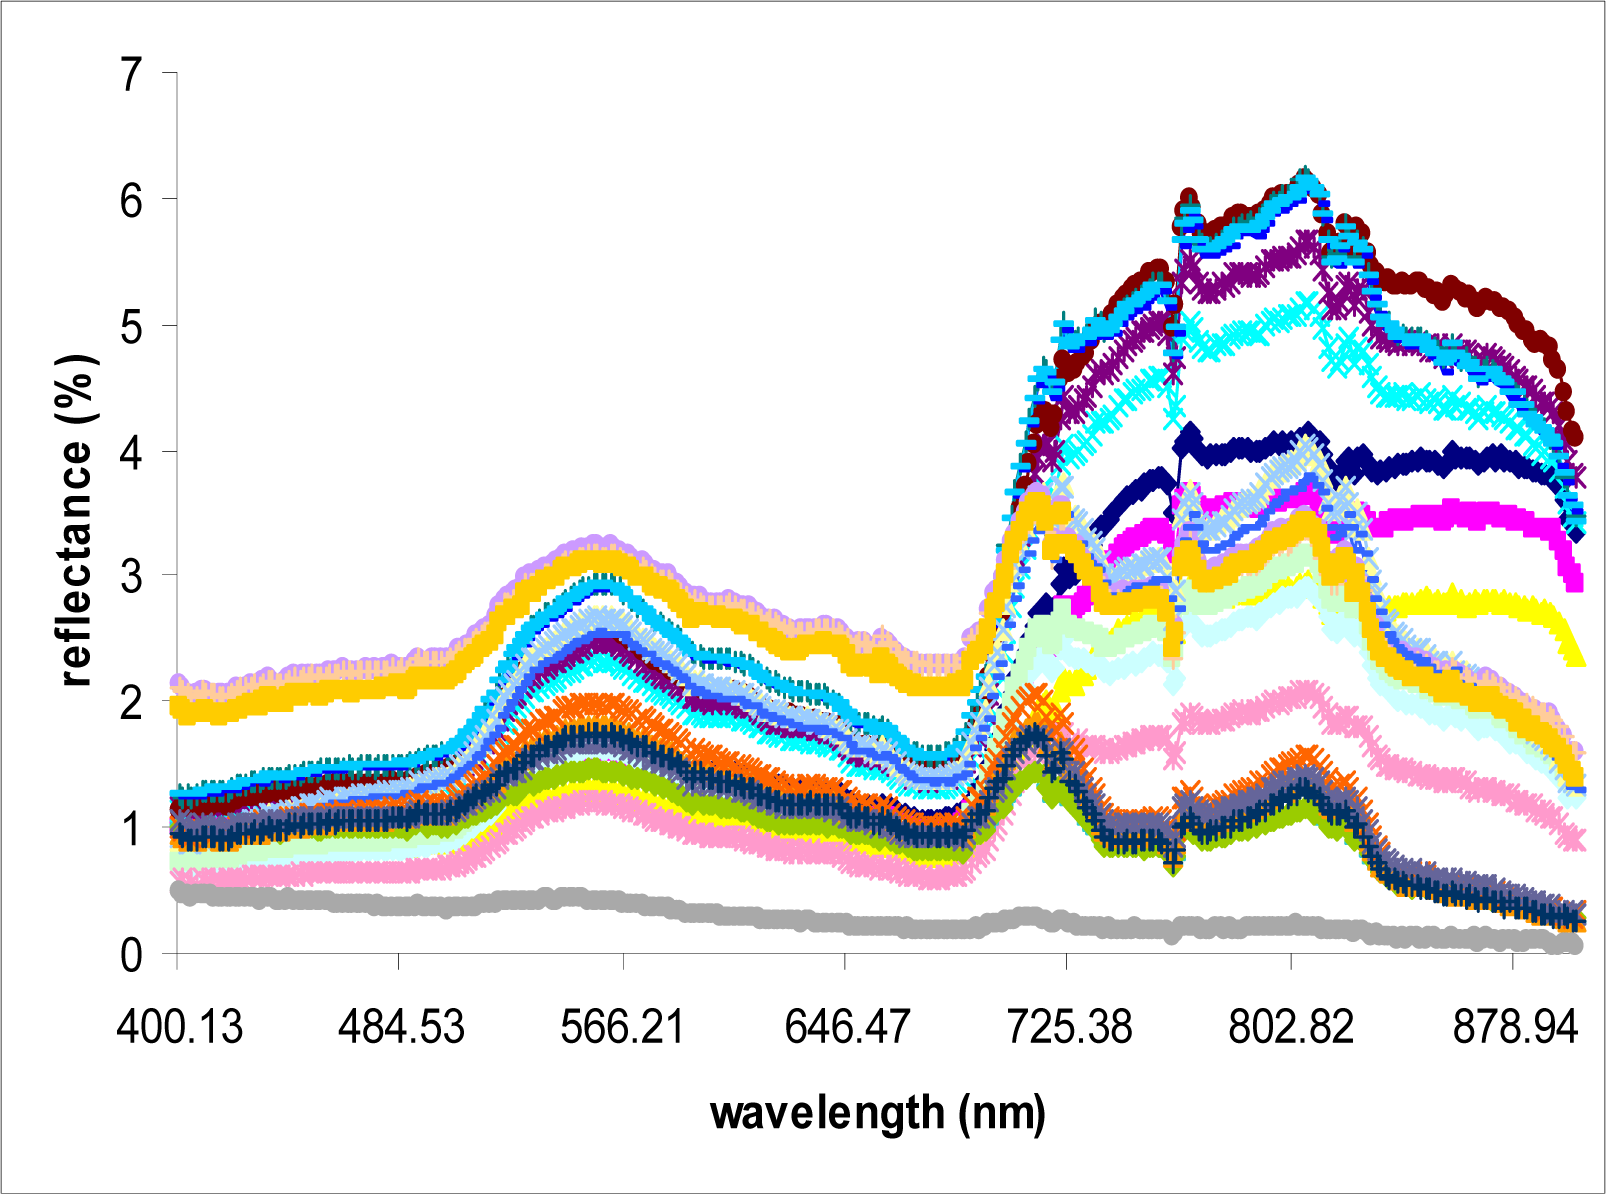
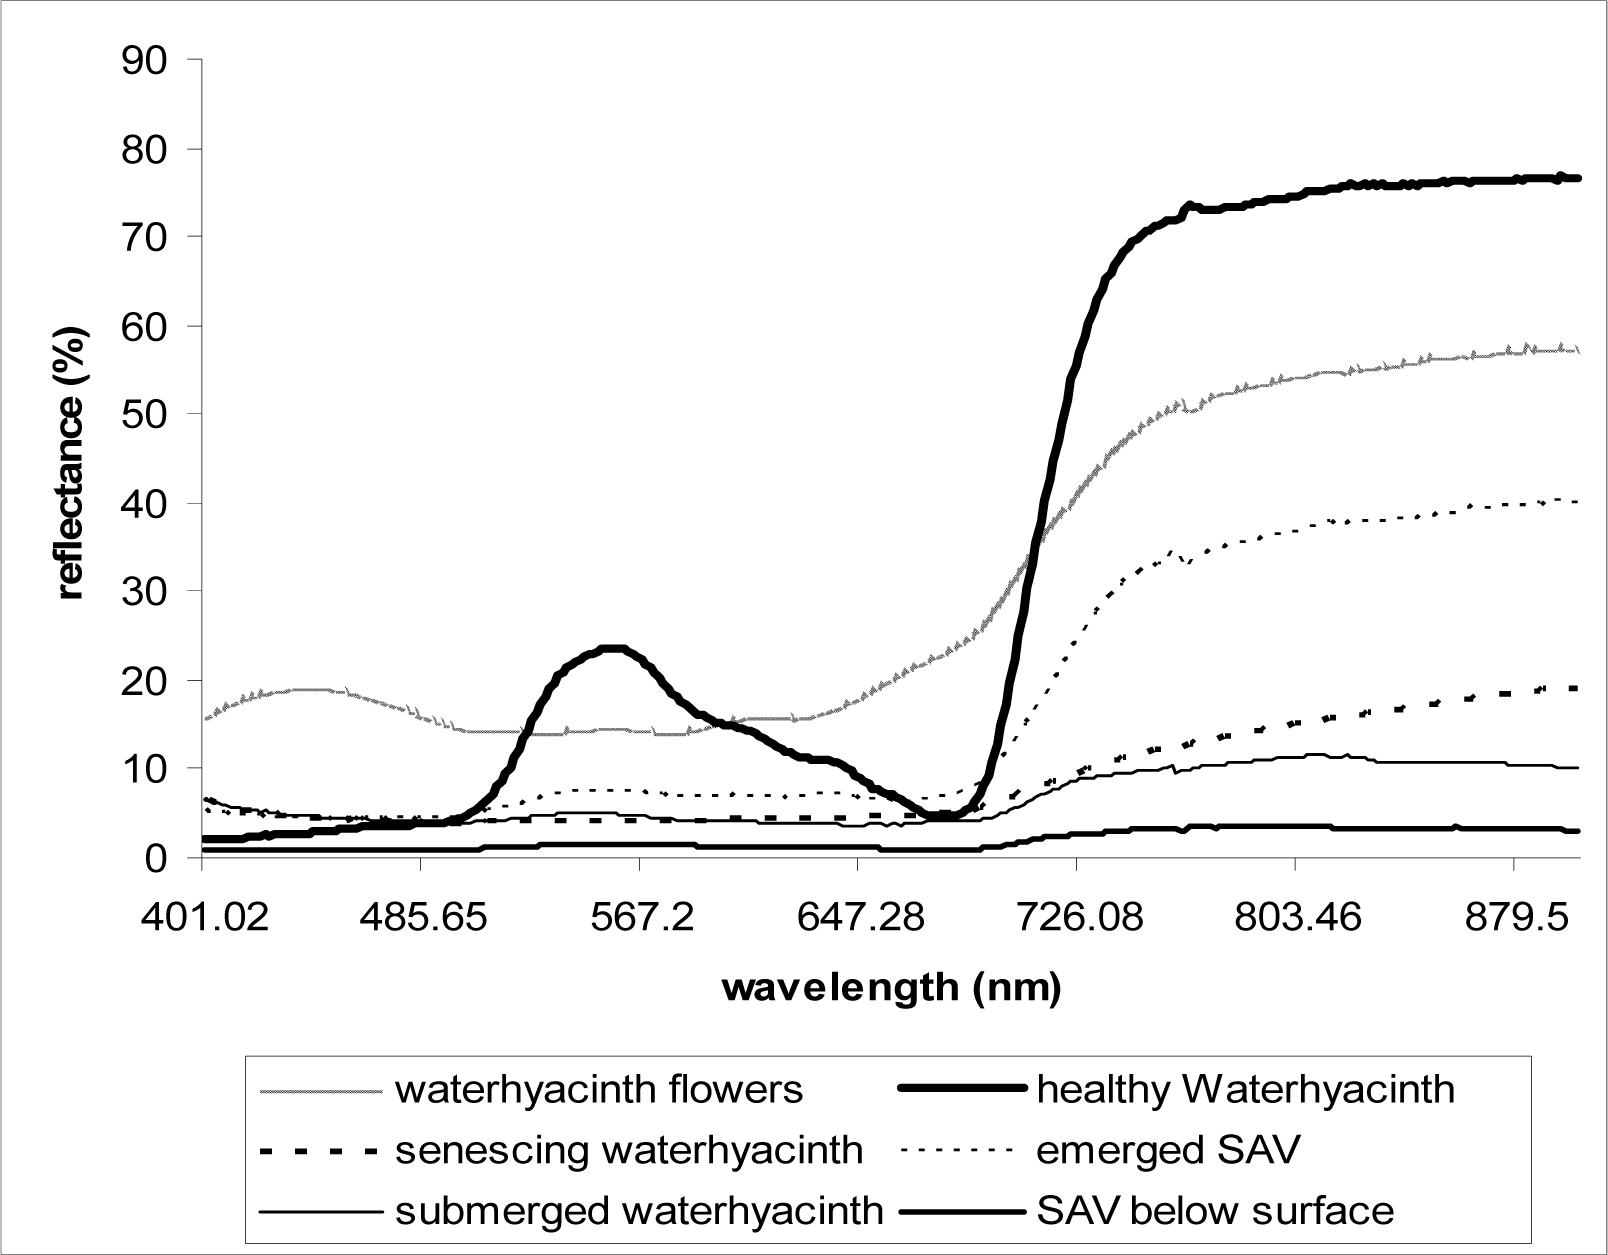
As described above, at least three replicate scans were taken for each setting (each depth) and the mean values were used in analyses. Reflectance data were plotted against the wavelengths 400–900nm. From the plot of the spectral data collected over healthy waterhyacinth, senescing waterhyacinth, submerged waterhyacinth, waterhyacinth flowers, emerged SAV, and SAV canopy just below water surface, the wavelength and the corresponding reflectance value (%) of each reflectance peaks and dips were observed and calculated. In order to see the effects of flooding on the reflectance, the spectral reflectance of flooded vegetation was subtracted from the spectral reflectance of healthy emerged vegetation for each plant type (waterhyacinth and SAV).
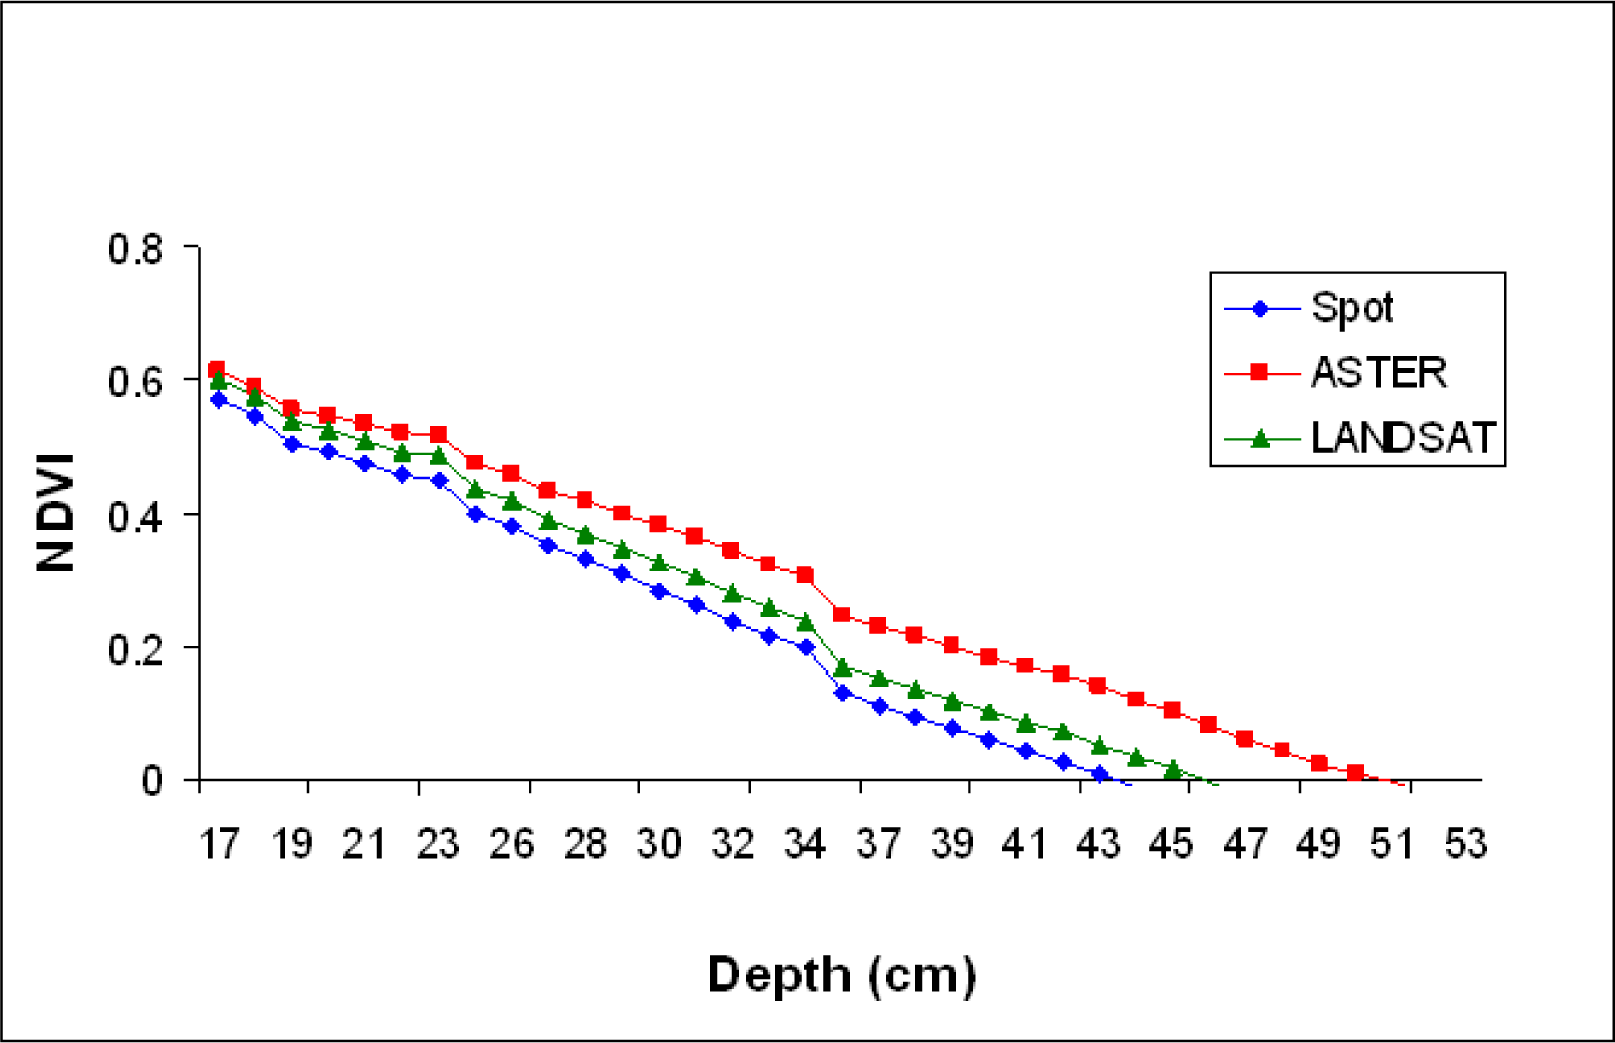
The spectral reflectance was averaged for the RED and NIR bands to simulate reflectance from satellites sensors of ASTER, SPOT 5, and LANDSAT 7 ETM+ (
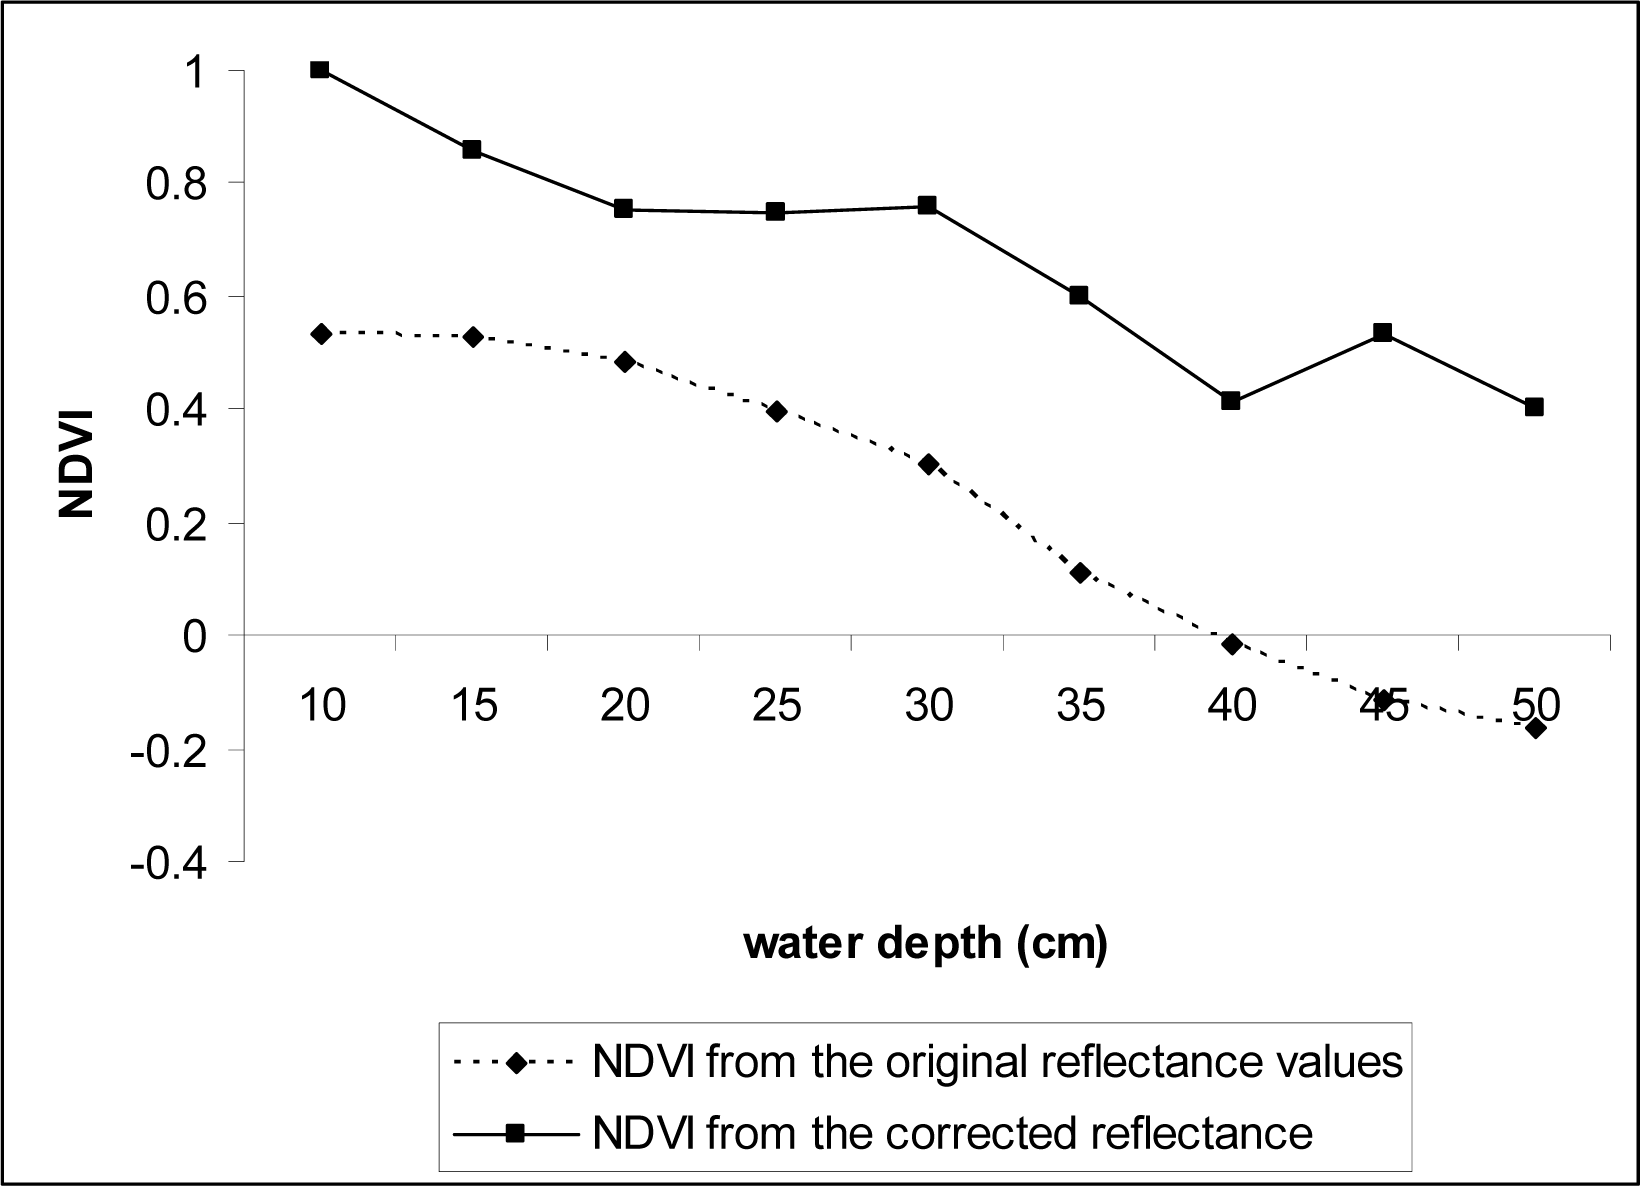
Table 1). NDVI values were then calculated for each depth using the averaged NIR and RED reflectance values. Spectral reflectance data collected over the black panel were subtracted from the SAV spectral reflectance collected at the comparable water depth to reduce the water effect (corrected for water effect) (
Fig.3). NDVI values were re-calculated using the corrected data.
Discussion
As demonstrated in previous studies [
13,
14], our results support that NDVI can serve as a good indicator to delineate healthy waterhyacinth (
Table 2) and other emergent/floating water plants because of the high reflectance in the NIR regions and low red reflectance (
Fig. 4), the spectral responses that resemble the terrestrial vegetation spectral signals. Our results also indicate NDVI can be used to distinguish and classify floating plants by their health status (
Fig. 4 and
Table 2), but confusing classification results may occur as the NDVI values for senescing waterhyacinth, submerged waterhyacinth, and SAV canopy at water surface appear similar (
Table 2). Particularly, the effects of senescence and submergence on the vegetation reflectance were very similar even at the hyperspectral resolution (
Figs. 4 and
5). The purple/violet-colors of waterhyacinth flowers (
Fig. 1) can also affect classification of the plants using NDVI during the peak flowering season because the relatively increased reflectance at red (
Fig. 4) for the flowers results in lower NDVI values (
Table 2). These aspects should be considered when taking ground-truth measurements in order to reduce errors in image classification and delineation.
Submerged aquatic vegetation (SAV) plants that are adapted to underwater life had lower NDVI values than those of floating plants even when emerged above water surface (
Table 2,
Fig. 4). The red reflectance for the emerged SAV was higher than healthy waterhyacinth, which indicates lower red absorption by the plant pigments in SAV; and the NIR reflectance was also significantly lower than that of waterhyacinth. This is probably due to the SAV’s lower chlorophyll content of the leaves per unit of tissue and weight [
15] and the higher water contents in and on SAV leaves. One interesting factor is that SAV below water surface had the higher NDVI values than submerged waterhyacinth at the same depth, which probably explains the red absorption by waterhyacinth is more significantly affected by submergence compared to SAV that is adapted to utilize the red color more efficiently in submerged conditions.
NDVI appears to be useful in delineating SAV canopy at the water surface (NDVI values close to 0.6), but the values decreased linearly with water depth increases, becoming ineffective for underwater vegetation detection even at the depth of 0.3 m (
Fig. 9). However, the NDVI values significantly increased at all depths that we tested (0.1 – 0.5 m) when corrected for water attenuation using the data obtained from the black panel, indicating the index values can be used for studies of SAV that from canopies near water surface if information on spectral reflectance attenuation caused by water volume increases is collected in the field and used to correct the original spectral reflectance data.
The importance of this research is linked to the need for mapping the distribution, composition, and abundance of aquatic vegetation in shallow inland and coastal waters using satellite images. Aquatic plants provide food to aquatic organisms, serve as nursery habitats, help reduce shoreline erosion, and influence the supply of oxygen in water. However, fast growing aquatic plants especially free-floating or floating-leaved plants of inland water bodies can become invasive by outcompeting native species. Therefore, information on aquatic vegetation distribution, composition, and abundance is widely used as an indicator of aquatic environmental quality; and the improved mapping capability for those plants will enhance the ability to assess underwater habitat changes.
Our study suggest that the conventional NDVI: (1) can be used to depict SAV canopies at water surface; (2) is not a good indicator for SAV that is adapted to live underwater or other aquatic plants that are submerged from less common events such as flooding even at shallow waters (0.3 m); and (3) the index values can significantly improve if information on spectral reflectance attenuation caused by water volume increases is collected simultaneously through ground-truthing.


