Microstructures and Nanostructures for Environmental Carbon Nanotubes and Nanoparticulate Soots

Department of Metallurgical and Materials Engineering, The University of Texas at El Paso, El Paso, TX 79968, USA
Int. J. Environ. Res. Public Health 2008, 5(5), 321-336; https://doi.org/10.3390/ijerph5050321
Submission received: 18 September 2008
/
Accepted: 5 December 2008
/
Published: 31 December 2008
(This article belongs to the Special Issue Proceedings from the Fifth International Symposium on Recent Advances in Environmental Health Research)
Abstract
:This paper examines the microstructures and nanostructures for natural (mined) chrysotile asbestos nanotubes (Mg3 Si2O5 (OH)4) in comparison with commercial multiwall carbon nanotubes (MWCNTs), utilizing scanning and transmission electron microscopy (SEM and TEM). Black carbon (BC) and a variety of specific soot particulate (aggregate) microstructures and nanostructures are also examined comparatively by SEM and TEM. A range of MWCNTs collected in the environment (both indoor and outdoor) are also examined and shown to be similar to some commercial MWCNTs but to exhibit a diversity of microstructures and nanostructures, including aggregation with other multiconcentric fullerenic nanoparticles. MWCNTs formed in the environment nucleate from special hemispherical graphene “caps” and there is evidence for preferential or energetically favorable chiralities, tube growth, and closing. The multiconcentric graphene tubes (∼5 to 50 nm diameter) differentiate themselves from multiconcentric fullerenic nanoparticles and especially turbostratic BC and carbonaceous soot nanospherules (∼8 to 80 nm diameter) because the latter are composed of curved graphene fragments intermixed or intercalated with polycyclic aromatic hydrocarbon (PAH) isomers of varying molecular weights and mass concentrations; depending upon combustion conditions and sources. The functionalizing of these nanostructures and photoxidation and related photothermal phenomena, as these may influence the cytotoxicities of these nanoparticulate aggregates, will also be discussed in the context of nanostructures and nanostructure phenomena, and implications for respiratory health.
Introduction
Chronic and acute health effects of particulate matter (PM) are well established, especially in occupational environments. Chronic bronchitis, pneumoconiosis, fibrosis and cancers of the respiratory system are associated with long term exposure to inhalable PM such as silica, graphite, asbestos and combustion PM. Acute effects of PM inhalation include hospital admissions associated with asthma, bronchitis, pneumonia, COPD and cardiovascular disease [1–13]. Cardiovascular morbidity and mortality in particular are associated with PM exposure [4–6]. Among more than 65,000 women followed in the Women’s Health Initiative Study [7] a 10 μg/m3 increase in PM2.5 was associated with a 24% increased risk for a cardiovascular event, and a 76% increase in the risk of death from cardiovascular disease.
Chronic animal studies have demonstrated the carcinogenicity of quartz (silica) PM. The role of reactive oxygen species (ROS) generation, a characteristic of silica PM, in DNA oxidative damaging effects and carcinogenesis has also been well documented [8–10]. Oxidative effects have also been widely shown in the carcinogenic processes induced by asbestos, where the size and shape of asbestos fibers and their composition contribute to overall toxicity [11–14]. In-vitro and in-vivo inhalation studies have illustrated the greater toxicity of longer, thinner asbestos fibers [15] while iron-containing amphibole asbestos such as crocidolite (Na2Fe2+3Fe23+ Si8O22 (OH, F)2) and amosite ((Fe2+, Mg)7 Si8O22(OH)2) seem to contribute to carcinogenicity through the release of Fe2+ ions which catalyze the production of hydroxyl radicals through Fenton chemistry, and consequent induction of oxidative DNA damage [14,16,17]. Earlier work by Hansen and Mossman [18] demonstrated that nonfibrous PM was less active than fibrous PM such as crocidilite asbestos among others, suggesting that the geometry of PM to be of critical importance in the generation of ROS-especially superoxide – from cells of the respiratory tract.
Mesothelial cells, the progenitor cells of the asbestos-induced tumor mesothelioma, are particularly sensitive to the toxic effects of asbestos as demonstrated by in vitro studies on mesothelial cells exposed to asbestos, including chrysotile (serpentine) asbestos (Mg3Si2O54(OH)) which has been the most commonly used asbestos worldwide. Unlike other asbestos forms, chrysotile consists of very long, aggregated nanotubes having primary (outer) diameters of ∼30 mm.
It is now well established that ultrafine or nano-PM pose a much greater health risk than fine and course PM (PM larger than ∼1 μm in diameter) [19–23]. This includes natural mineral or geologic PM such as nano-silica (SiO2) and asbestos, as well as anthropogenic PM such as combustion PM or soots composed of aggregated, complex branched, fractal geometries containing hundreds to thousands of primary spherules 15 to 80 nm in diameter [24]. Fullerenes and carbon nanotubes have also been observed to be products of combustion, especially flame combustion [25, 26], and multiwall carbon nanotubes (MWCNTs) have been shown to be ubiquitous in both indoor and outdoor air, albeit in low concentrations [27,28]. Furthermore, these carbonaceous nano-PM produce ROS and are variously cytotoxic [29]. Soots with adsorbed or mostly intercalated PAHs and PAHs alone also produce ROS [30], and it is unknown whether the range of toxicity and related respiratory health effects of diesel particulate matter (DPM) are a consequence of the PAH content or the turbostratic graphene structure of the primary nanospherules composing DPM [31]. In recent work of Jung, et al. [32], flame-derived soot nano-PM induced ten times the ROS response in surrogate lung fluid than BC. This is consistent with even more recent work of Garza, et al. [33] where flame derived soot was observed to be more cytotoxic and a larger ROS producer than many other soot PM, including wood, diesel, tire, and candle soot PM.
Chronic inflammation is a recognized potential contributor in the etiology of malignant tumors as phagocytic cells release ROS. This is characteristic of asbestos-related diseases such as pulmonary fibrosis, lung cancer and mesothelioma, and other pleuro pulmonary disorders; especially in connection with occupational exposures at high concentrations (Manning, et al. [34]). It is these related characteristics which are of concern for long term carbon nanotube exposure especially since anthropogenic and commercial arc-evaporation grown multiwall carbon nanotubes (MWCNTs) have been shown to be microstructurally identical to chrysotile asbestos nanotubes (Murr and Soto [35]).
While asbestos nanofibers, both serpentine (chrysotile) and a host of amphibole asbestoses, are now well documented carcinogens, wood soot and especially residual chimney deposits consisting of aggregated nano(soot)-PM and oily creosote (phenol, cresols and guaiacol) was the first environmental agent recognized as a cause of cancer. Young boys aged 9 to 12, forced to climb and sweep chimneys between about 1500 to 1800, developed cancer of the scrotum and testicles, first, recognized by Percival Potts, an English medical doctor, in 1775 (Hall [36]). Like nanotubes, soots exhibit microstructural similarities as well, although they are considerably different from nanotubes or nanotube materials. While soots and BC appear to be microstructurally similar, they can vary in PAH content and concentration depending upon the combustion conditions. Similar variations can occur for MWCNTs.
In this study, the microstructures and nanostructures of BC and combustion soot PM from a number of sources have been examined by field emission scanning electron microscopy (FESEM) and transmission electron microscopy (TEM). The PAH contents for the soot PM have been previously determined by Shi, et al. [37]. The microstructure and nanostructure of chrysotile asbestos was also examined by TEM and compared with commercial (surrogate) MWCNTs and examples of anthropogenic MWCNTs collected in the environment. These nanostructural details are compared and discussed in the context of comparative cytotoxicities and ROS production utilizing an immortalized human epithelial lung (carcinoma) model cell line (A549).
Experimental Methodologies
Environmental PM, especially nano-PM including MWCNT aggregates containing multiconcentric fullerenes and soot PM, as well as clusters of complex, branched soot nanospherules or primary nanoparticles, was collected in both the indoor and outdoor air utilizing a thermal precipitator described previously [38]. This relatively simple, portable device collects fine and nano-PM on silicon monoxide/formvar-coated, 3 mm grids which can be directly examined in the TEM. These coated grids were also used to examine chrysotile asbestos particles by placing them between two grids in a sandwich arrangement. In addition, soots from specific combustion sources such as diesel exhausts, burning wood, burning tire pieces, candles, and a natural gas cooking range were also collected by thermal precipitation and examined in the TEM [38]. These specific combustion source soots were also collected by high volume air flow mass collectors on large glass fiber filters as previously described [37], and these mass collections also examined by scraping collected PM onto TEM coated grid sandwiches and examined in the TEM. Finally, indoor PM collected on metal plates in an electrostatic collector were also scrapped onto the silicon monoxide/formvar 3mm grids and examined in the TEM. The TEM was a Hitachi H-8000 analytical system fitted with an energy dispersive (X-ray) spectrometer (EDS) and a goniometer-tilt stage. The TEM was operated at 200kV accelerating potential.
Mass filter-collected soot PM from specific combustion sources noted were also examined directly on filter specimens in a Hitachi S-4800 field emission SEM (FESEM) often utilizing low-voltage (0.8 to 1 kV) secondary electron (SE) imaging which avoided the necessity to coat the PM with conducting, high atomic number metals (such as Au or Ir). This system was also fitted with an analytical EDS attachment.
The cytotoxicity and ROS production for commercial MWCNT aggregate material and BC along with the nano-PM soot sources described above were examined in previous work [29, 33], and these results will serve as illustrations of the potential respiratory health effects. In addition, Shi, et al. [37] have examined the PAH content for most of the carbonaceous nano-PM to be examined and compared in this work. These results will also provide an important context for the nanostructural issues to be described along with the longer term potential for respiratory health effects.
Results and Discussion
Chrysotile Asbestos Microstructure and Nanostructure
Figure 1 shows a composite overview for chrysotile-nanotube asbestos. A small geological, mined sample is shown in Figure 1(a) while Figure 1(b) shows a representation of individual nanotube fibers, small fragments, and a range of fiber bundles or aggregates. Several very long fibers representing the serpent or serpentine morphology are evident with length/diameter aspect ratios >100 and some fragments with aspect ratios <4. Figure 1(c) shows a small aggregate of individual chrysotile nanotubes, many with end caps, while Figure 1(d) illustrates the characteristic selected-area electron diffraction (SAED) pattern showing diffraction spots and diffraction streaks perpendicular to the fiber axes and the concentric, curved crystalline layers illustrated schematically in Figure 1(e). The curved crystal (atomic) layer structure is separated ∼7.3Å (0.73 nm) [39]. Individual chrysotile asbestos nanotubes have core or internal tube diameters of around 5 nm, with outer diameters of ∼30 nm. There are some dimensional (core and fiber diameter) variances, and individual fibers can be 10 times longer than those shown in Figure 1(b), having aspect ratios >103. Mined samples much larger than Figure 1(a) are crushed and the fibrous asbestos spun into continuous yarns or separated into oriented fiber bundles which can be variously processed into composite products such as asbestos-cement pipes, plates, and structural support members among others [40]. Occupational environments, including mining and milling, produce fragments and individual fibers which are easily airborne. Aggregation is often intrinsic as shown in Figure 1(b) and (c) while electrostatic charges often enhance aggregation. Fiber ends are closed or capped as described later, but brittle and easily broken, in spite of very high tensile strengths.
Nanostructure of Commercially Produced Multiwall Carbon Nanotubes
There are two prominent processes for the production or growth of carbon nanotubes, both single wall and multiwall: carbon arc evaporation and combustion or pyrolytic catalysis. In arc evaporation, carbon nanotubes nucleate and grow homogeneously (or pseudo-homogeneously) from a specific, hemispherical, graphene end cap. To some extent, this might also be considered pseudo-heterogeneous nucleation and growth since a hemispherical carbon nucleus initiates the growth. Lair, et al. [42,43] have illustrated this nucleation and growth process using computer simulations where it was demonstrated that these hemispherical (cap) nuclei can form fullerenes by closing, but it is slightly more energetically favorable to extend beyond the hemispherical nucleus to add benzenoid sections growing into an extended tube. Correspondingly metal catalyst nano-PM promotes classical heterogeneous carbon nanotube growth. Of course the efficiency of tube growth as well as multiwall carbon nanotube growth will depend upon the combustion thermo-kinetics as well as the specific fuel or combustion source.
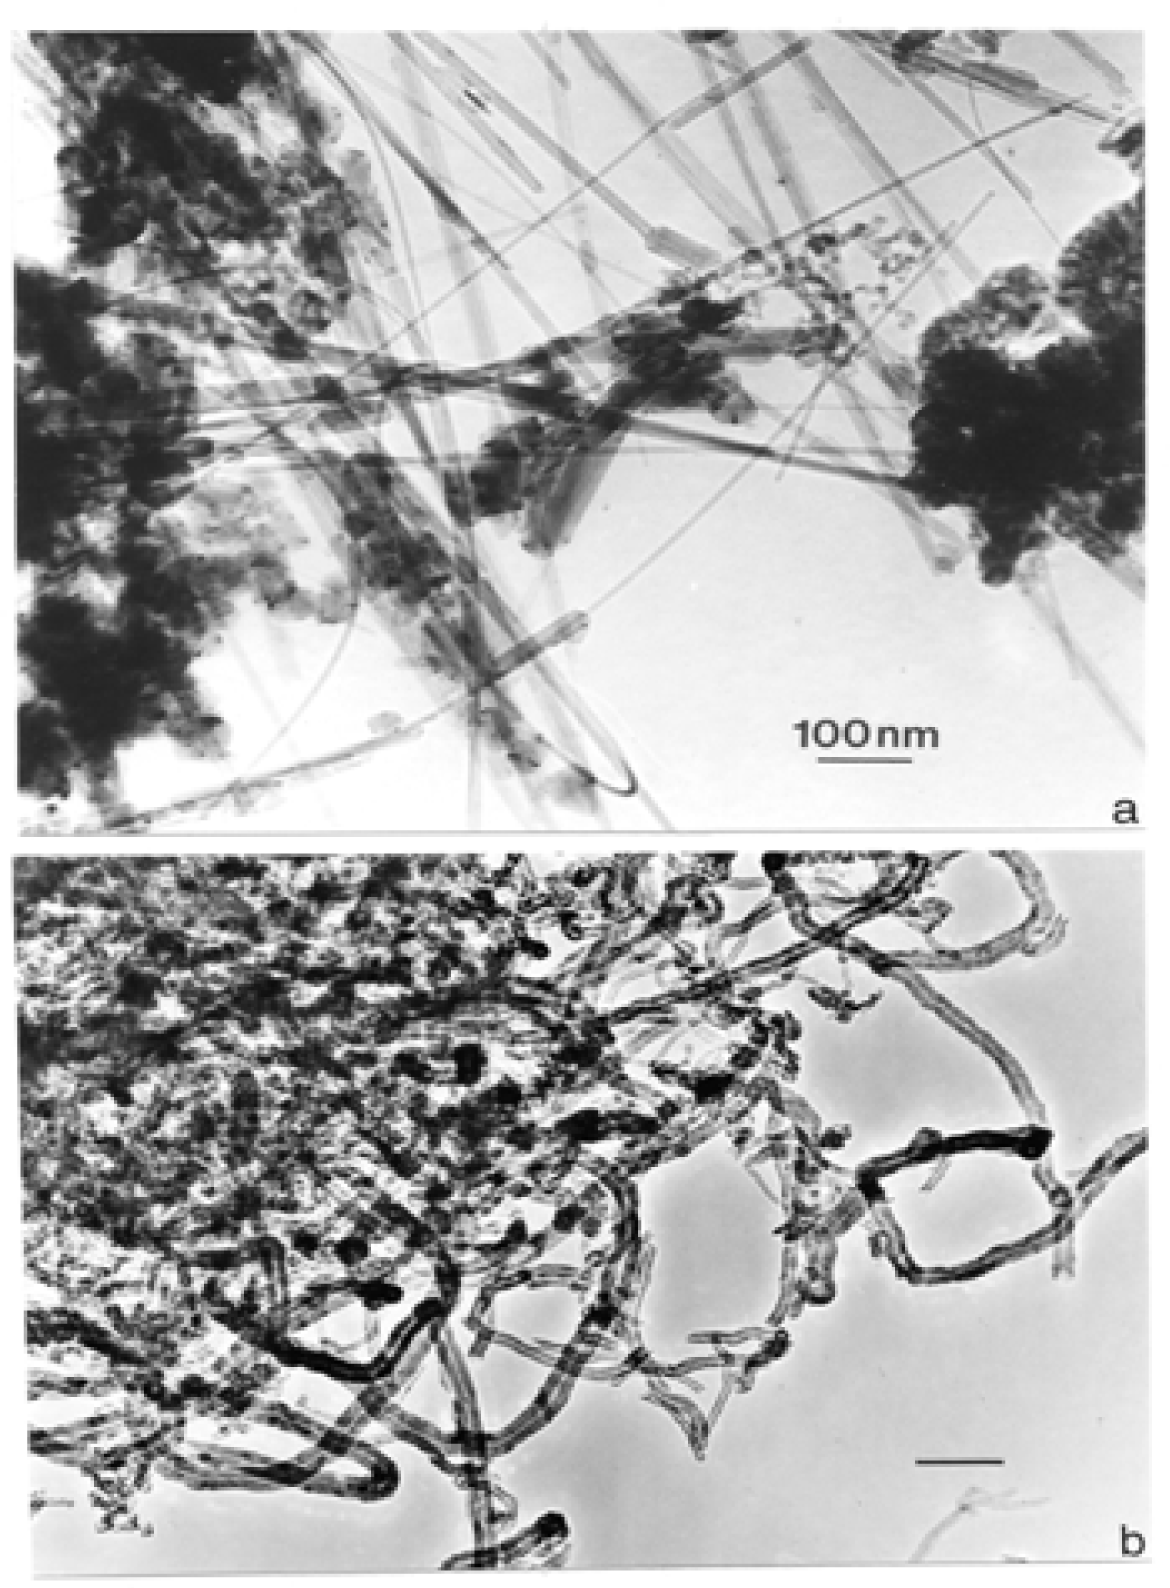
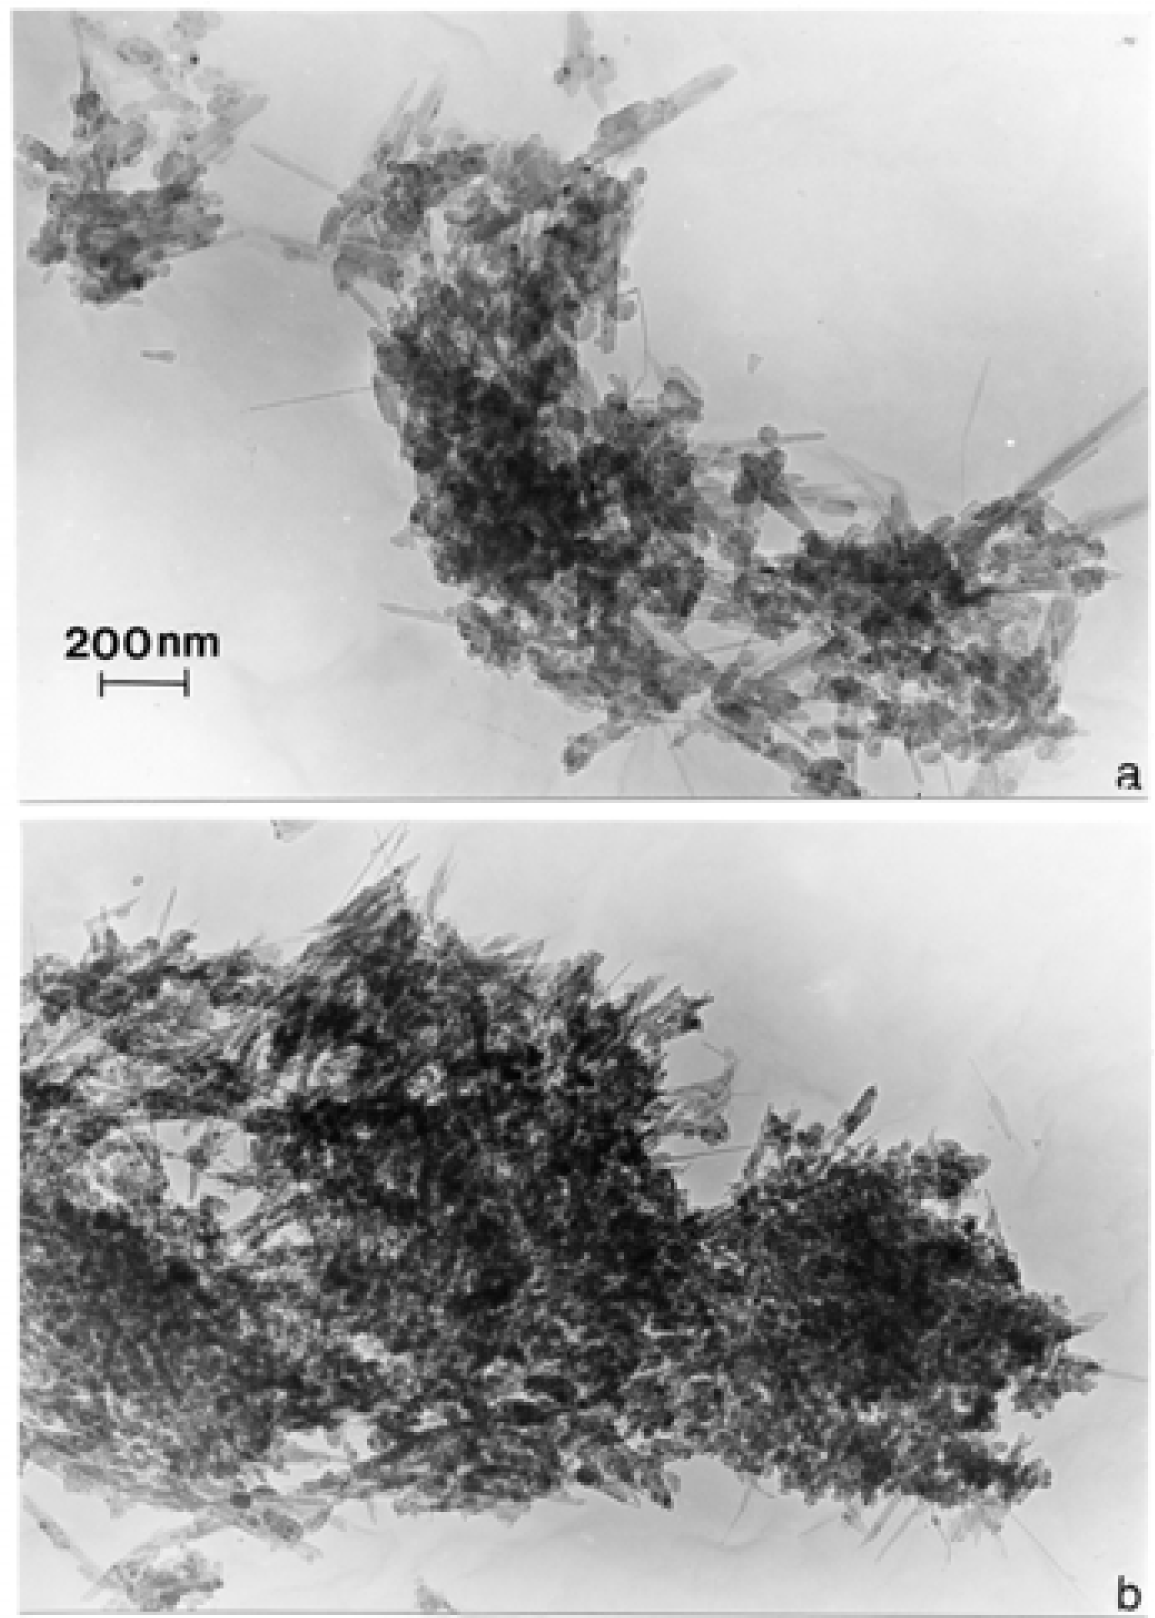
Figure 2 shows TEM bright-field images of MWCNTs produced by arc evaporation growth (Fig. 2(a)) and metal (nickel) nano-PM catalyst growth (Fig. 2(b)). It is particularly interesting to compare Fig. 2(a) with Fig. 1(b) where the MWCNT microstructure and nanostructures (especially nanotube diameters) are almost undiscernable. However, the catalyst-grown MWCNTs in Fig. 2(b) are microstructurally (or morphologically) distinct although the distribution of nanotube diameters are similar to those in Fig. 2(a): <5 nm to ∼ 25 nm.
Figure 3 illustrates an aggregate of even larger MWCNTs or a wider distribution of MWCNT diameters (5–50 nm) along with a similar size distribution of multiconcentric fullerenic PM, and a corresponding distribution of multiconcentric nano-PM tube sizes (lengths) extending from polyhedral (or faceted) fullerenic PM with aspect ratios (tube length to tube diameter) of ∼1 (1:1) to 100 (100:1) observed in the TEM.
Nanostructure of Anthropogenic and Combustion Generated MWCNT Aggregates
Figure 4 shows two examples of MWCNT and faceted, multiconcentric fullerenic PM aggregates collected in the indoor and outdoor environment by thermal precipitation and observation in the TEM. These aggregates, in excess of 2 μm in dimension, can contain >1000 primary (or individual) MWCNTs or multiconcentric fullerenic nano-PM. These carbon nano-PM nucleate and grow in flame combustion regimes along with related nano-PM soot aggregates as described generally by Homann [26].
Figure 5 illustrates fundamental aspects of arc-grown and anthropogenic (combustion generated) carbon nanotube nucleation and growth as described briefly below. Figure 5(a) shows a bright-field TEM image of MWCNT-multiconcentric fullerene aggregates collected from an arc evaporation growth process which appear similar to those shown in fig. 3, as well as the propane (flame)-generated MWCNT aggregates in fig. 4(a). Figure 5(b) shows a simple reaction schematic for methane (flame) combustion generated carbon nanotube or fullerene nucleation and growth, while Fig. 5(c) shows several examples of nucleating, hemispherical carbon (graphene) caps generated by computer simulation in the work of Lair, et al. [42, 43]. These hemispherical caps obey Euler’s law which requires 6 pentagons per hemisphere, where in the case of a C60 hemisphere (half the C60 polyhedron) there are also 10 hexagons. The C60 polyhedron is a truncated icosahedron emulating a soccer ball. Note that the (10,0) caps in fig. 5(c) contain 6 pentagons and 10 hexagons while the (9,0) and (18,0) caps contain an odd number of hexagons: 9 and 31 respectively, and 6 required pentagons. Figure 5(d) illustrates the graphene layer (2-dimensonal lattice) convention for cap and tube types. In this hexagonal carbon structure lattice, tubes are described by a chiral angle, θ: 0 < θ <30°. °θ = 0 is described by (n, m): n ≠ 0, m = 0 referred to as type 1 or zig-zag tubes (noted by 1 in fig. 5(d)) while n = m describes tubes where θ = 30°, referred to as type 2 or arm chair tubes (noted by 3 and 4 in fig. 5(d)). Chiral tubes (0 < θ<30°) have the tube axis perpendicular to the chiral vector, C, in fig. 5(d), defined by: C = na1 + ma2, where | a1 | = | a2 | = | a | = 2.46 Å; the distance between carbon atoms along the dotted θ = 0° line in fig. 5(d). In effect, tubes can be envisioned by rolling up the graphene sheet from (0, 0) to n, m) along C so that the tube axis (large, bold arrows in fig. 5(d)) is perpendicular to C. Consequently, C rolled up and extending from (0, 0) to (n, m) represents the scalar tube circumference, | C | = πd(n,m):
This also characterizes the cap diameters illustrated in the examples shown in fig. 5(c).
Figure 6 shows some simple “chicken wire” models for the categories or types of carbon nanotubes illustrated in fig. 5(d) (fig. 6(a) – (c)) along with conceptual models for chiral tubes growing over zig-zag and arm chair tubes; double wall carbon nanotubes, respectively in fig. 6(d) and (e), respectively.
Figure 7 shows the details of double-wall carbon nanotube nucleation and growth based upon recent computer simulations and ab-initio computations by Lair, et al. [44]. In fig. 7(a) and (b), double caps characteristic of armchair tube growth (n = m) or arm chair over arm chair (A/A) shown in the simulation in fig. 7(b) illustrate the energetically favorable double-wall carbon nanotube nucleation and growth. Similarly, fig. 7(c) shows an exaggeration of double-wall chiral tube growth based upon heat of fusion and atom energy computations [44] where the outer tube is observed to grow slightly ahead of the inner (primary) tube; predicted earlier by Guo, et al. [45]. As these tubes grow, the computed energy per carbon atom decreases. The system energy is further reduced when the growing tube (or tubes) closes by a corresponding cap formation at the growing end [44]. In addition, the inner-growing carbon nanotube will cap first usually followed by the outer tube, although in some combustion, thermo-kinetic environments, the outer tube can cap a little later, forming various internal cap spacings for MWCNTs. The normal concentric cap and tube spacings are very close to the graphite half-cell spacing of 3.4Å (0.34 nm) shown schematically in fig. 7(d). Figure 7(d) also illustrates the graphite layer or hexagonal graphene carbon atom spacings referred to the graphite unit cell (shaded). Graphite crystal planes (001) and (002) are noted as well in fig. 7(d). While specific simulations and supporting computational data is not available for MWCNTs, it is assumed that computational implications for double-wall carbon nanotubes [44] can be effectively extrapolated to MWCNT nucleation and growth.
It can be noted in fig. 2(a) that in arc evaporation and related combustion or pyrolitic regimes, including fuel variations, graphitic crystal fragments and amorphous (or turbostratic) soot PM can form [26]. These turbostratic PM are composed ideally of mis-registered and irregular, curved graphene fragments which contain 1 or more pentagonal elements. These irregular, concentric layer components form primary soot nano-PM, while more regular concentric arrangements form multi-concentric fullerenes which are often delineated by regular, polyhedral forms containing facets. These features are illustrated in the TEM images for black carbon (BC) in fig. 8(a) and a propane-generated MWCNT/ multiconcentric fullerene PM aggregate shown for comparison in fig. 8(b). Figure 8(c) shows the diffuse, graphitic SAED pattern for the amorphous, turbostratic soot aggregate in fig. 8(a) while fig. 8(d) and (e) illustrate sharper, less diffuse SAED patterns for the more regular, polyhedral or graphene-layer, nano-PM in fig. 8(b). Correspondingly, fig. 8(f) and (g) compare the tube closure caps for chrysotile asbestos nanotubes and MWCNTs, respectively.
Careful examination of the end caps reveals their faceted nanostructure rather than geometrical hemisphere forms, although hemispherical end forms are also observed for MWCNTs, especially small diameter MWCNTs (dn,m ≤10 nm). These features are illustrated on comparing a natural gas-produced MWCNT aggregate in fig. 9(a) and a small aggregate of MWCNTs and multiconcentric fullerene PM from a propane truck exhaust in fig. 9(b). Figure 9(a) also shows the indexed graphite SAED pattern insert for the aggregate while the concentric nanotube structure is shown in the high-resolution TEM image insert.
Figure 10 compares a number of MWCNT aggregates collected from a variety of flame combustion sources noted, which illustrate a number of the nanostructure phenomena described, including tube closure issues, faceting, and the creation of regular and irregular polyhedral PM.
Figure 10(a) shows tapered nanotube ends with observable, spaced, internal caps on tube closures (arrow) which are also observed in the small nanotube aggregate in fig. 10(d). Figure 10(d) also shows a large, faceted, multiconcentric fullerene nanoparticle (arrow). Figure 10(b) shows an unusual, faceted nanoform (arrow) amongst aggregated MWCNTs and other multiconcentric fullerenes while fig. 10(c) shows aggregates of MWCNTs and regular multiconcentric fullerenic nano-PM. Figure 11 shows several faceted, multiconcentric nanoforms compared with a faceted, multiconcentric fullerenic or carbon “onion” shell nanoform from the earlier work of Dresselhaus, et al. [48] (fig. 11(a)). Figure 11(b) shows the large nanoform shown in the natural gas combustion sample in fig. 10(d) (arrow) while fig. 11(c) shows a magnified image for the faceted MWCNT shown previously in another natural gas combustion sample in fig. 9(a).
Figure 12 shows two additional examples for regular, faceted multiconcentric fullerene nano-PM aggregated with MWCNTs. Figure 12(a) in particular, and in contrast with other fuel gas combustion-produced aggregates, illustrates a propensity for multiconcentric fullerenic nanoforms in contrast to MWCNTs.
As noted and as illustrated in figs. 2 and 3 and figs. 8 and 12, MWCNTs have many nanoforms and microstructures, including a range of internal tube diameters, outer tube diameters, tube ends, and end cap nanostructures. Figure 13 shows some additional examples. Figure 13(a) shows examples of MWCNTs collected outdoors by thermal precipitation near a natural gas-burning electric generating station. These nanotubes exhibit rounded or hemispherical end caps. Figure 13(b) shows MWCNTs observed in wood soot collected by thermal precipitation and observed in the TEM [50].
Aggregated MWCNTs and especially aggregated mixtures of MWCNTs, fullerenic nano-PM, and nano silica (SiO2) grains are ubiquitous in the outdoor air in many locations and even in (quartz) (101) reflections (arrow) shows a preponderance of SiOnano-pm (∼5 nm diameter) antiquity [51]. Figure 14 illustrates an example of these complex aggregates collected by thermal precipitation in the El Paso, Texas (USA) air and observed in the analytical TEM. The dark-field image in fig. 13(b) utilizing the objective aperture over the superimposed graphite (100) and SiO2.
Figure 15 shows a MWCNT bundle (aggregate) about the size of a common bacterium (∼ 0.4 μm × 1 μm). Such MWCNT aggregates may be exaggerated by electrostatic charge either during source production, atmospheric residence, or collection, especially since this bundle was collected electrostatically indoors. The interesting issue presented on comparing the many atmospheric or environmental forms of MWCNTs shown in figs. 2 and 3 and figs. 4, 8 and 10, and 12 and 15 is that in the context of the plethora of nanostructures and nanoforms, it will certainly be extremely difficult if not impossible to distinguish contributions of manufactured MWCNTs from anthropogenic MWCNTs to environmental, nano-PM pollution.
Microstructure and Nanostructure for Combustion Soots and Black Carbon
Figure 16 illustrates some typical views of both indoor and outdoor soots: candle soot (CPM) (fig. 16(a)), wood soot (WPM) (fig. 16(b)), diesel soot (DPM) (fig. 16(c)), and tire soot or burning tire soot (TPM) (fig. 16(d)). These soot PM, although imaged somewhat differently, are not notably distinguishable either microstructurally (morphologically) or nanostructurally (primary spherules composing the branched, fractal-like aggregates are essentially the same and within the same size range (∼20 to 60 nm diameter), although depending upon specific combustion regimes and fuel sources, this range can extend from 10 nm to 80 nm. When collected by high volume air flow on fibrous filters, these large fractal-like PM can be compressed or further aggregated, creating some morphological distortion of the overall PM.
These PM can have fractal dimensions, Df, ranging from about 1.5 to 2.5 [52–55] which provides a scaling parameter relating the total number of primary (spherule) particles, Np, composing the aggregates as illustrated in fig. 16, to the ratio for the radius of gyration, rg, or mean aggregate diameter (2 rg) and primary particle diameter (2 rp): Np = ξ (rg/rp)Df, where ξ is a fitting or geometrical constant. It is observed that the primary spherule diameter for BC and soot PM can exhibit a wide distribution as noted above, and the radius of gyration or mean aggregate diameter (2 rg) can vary from 0.1 to 0.5 μm for Np ≅ 102 particles to 2.5 μm to >3 μm for Np ≥ 103 particles. Aggregate densities can also vary accordingly, and large, fractal aggregates can variously fragment into smaller components; especially at airway bifurcations in the lung during respiration.
As illustrated in fig. 17, primary soot PM spherules can be variously modeled as curved, overlapping graphene fragments which can form by incorporating at least one 5-memebr ring or pentagonal polygon into the hexagonal, pyrolizing benzenoid. These can be variously intercalated with polyynes, aromers, PAHs and fullerenes described as classes of particles particularly in hydrocarbon flames such as methane (CH4) and propane (C2H8) [26]. Combustion temperature, oxygen/fuel ratio, and related kinetic phenomena such as diffusion, turbulence, etc. will alter the structure of the primary soot or BC particle which can vary from highly amorphous or turbostratic to more regular, crystallographic graphite-like, closed-shell structures which in the extreme can include large carbon onions (fig. 11(a)) or multiconcentric fullerenes [48].
Lower combustion temperatures favor amorphous or turbostratic structures where there is no graphite crystal registry of the overlapping graphene fragments (fig. 7(d)). Primary soot PM composed of amorphous and fullerenic carbon have been described by Grieco, et al. [56] while Clague, et al. [57] indicated that diesel engine soot (DPM) and BC were virtually indistinguishable perturbed (amorphous) graphitic or turbostratic structures, while Vander Wal and Tomasek [58] demonstrated that low temperature thermal pyrolysis of acetylene (C2H2) and ethylene (C2H4) produced amorphous soots regardless of flow rate, while high temperature pyrolysis at high flow rates yielded mixtures of curved graphene fragments and fullerenic shells. Slower flow rates produced primary spherules with graphitic (crystalline) segments. Pyrolytic and combustion conditions which produce a preponderance of PAH isomers can yield primary soot PM with varying concentrations of intercalated PAH isomers with a range of molecular weights (MW). That is, curved graphene fragments can mix or intercalate with PAH isomers of varying MW and concentration as illustrated in fig. 17(a). BC is normally considered to have a primary spherule structure composed only of graphene fragments and no PAH. In some cases this was referred to as elemental carbon in contrast to PAH-containing soots which were considered to consist of elemental carbon (graphene fragments) and organic carbon (PAH isomers). Consequently, high PAH concentration produced soots with a so-called high organic fraction.. Shi, et l. [37] have examined a wide range of speciated soot (including WPM, DPM, TPM) in addition to commercial BC (fig. 17(c)). While the soots ranged in total PAH content from 7 ppm to 5000 ppm, the BC contained 4 ppm PAH (pyrene, MW 202 and phenanthrene, MW 178). Even carbon arc evaporation-produced MWCNT aggregates contained 20 ppm PAH (naphthalene, MW 128; acenaphthylene, MW 152; fluorine, MW 166; anthracene, MW 178, and phenanthrene, MW 178). As illustrated in fig. 2(a), these aggregates can contain fullerenic PM and soot PM. In addition, and as illustrated in fig. 16, the resulting fractal aggregates can vary in size and density. Figure 18 illustrates very large fractal aggregates of soot PM along with smaller fragments. The larger aggregate represents about one-fourth of the total and half of the mean diameter or diameter of gyration (2 r), which is estimated to be around 3 μm, with roughly 3 × 10 primary particles having diameters ranging from ∼10 to 40 nm.
Figure 2(a) in particular illustrates that MWCNTs, fullerenic PM, and soot PM are often co-produced in various pyrolytic and combustion regimes. Under specific combustion conditions, MWCNTs are produced from a wide range of fuels, including candle burning [59]. Natural gas and propane combustion normally produce a preponderance of soot PM, but MWCNTs are also produced as illustrated in figs. 4, 9, 10, 12, 13. Shi, et al. [37] have also measured the PAH content of soot PM collected form a natural gas kitchen burner, demonstrating that differences in fuel flow rate and the fuel/air ratio altered the PAH content as well as the MWCNT/soot PM ratio. Table 1 reproduces the PAH measurements of Shi, et al. [37] for a range of soot PM, including natural gas burner exhausts (from normal blue-flame combustion to air deficient (yellow flame) combustion). Commercial BC and MWCNT (arc evaporation produced) PM-PAH data is also included for comparison.
Although Arrieta, et al. [30] have demonstrated that PAH extracts from PM collected on filters in the El Paso, Texas, USA/Juarez, Mexico metroplex had significant biologic activity using two in-vitro assay systems, Soto, et al. [60] and Garza, et al. [61] also recently demonstrated that cytotoxicity assays using human epithelial A549 lung model cell cultures did not exhibit any correlation of 48 h cytotoxic responses with either PAH concentration or specific isomer content for the soot PM species listed in Table 1. Of course longer term exposure to soot PM with high concentrations of PAHs may present quite different responses in the human lung. In addition, short-term cytotoxicity assays demonstrating inflammatory response do not predict long term pulmonary responses nor do they indicate carcinogenic or mutagenic effects which may be related to ROS production by nano-PM interactions with specific cell types. This includes ROS production by functional chemistries associated with carcinogenic chemicals such as high molecular weight PAHs: generally those above benzo (b) fluoranthrene, MW 252 in Table 1, which are considered to be carcinogenic [62, 63]. Functional chemistries will be particularly important for soot nano-PM in the outdoor environment in particular where photooxidation and photothermal effects can alter even the simplest PAHs. For example naphthalene is readily converted by photooxidation to naphthaquinone which is an ROS producer. In addition photooxidation of other PAHs especially in the presence of ozone is another viable reaction sequence. Since these reactions are favored at benzenoid configurations corresponding to fragment edges and special bonding sites, functionalization of graphene fragment edges as well as carbon nanotube surfaces may also produce ROS. Examples of these reaction sequences are illustrated schematically in fig. 19. In fig. 19(a) benzene oxide is converted to phenol (OH) by photolysis of water while toluene is converted by OH to methyl hydroxyl-cyclohexadienyl radical in fig. 19(b). Figure 19(c) and (d) illustrate benzene and naphthalene conversion to quinones while fig. 19(e) illustrates the photooxidation of a graphene fragment. Nel, et al. [64] have recently discussed the biology of particle-induced ROS and a hierarchical oxidative stress model where pro-inflammatory cell response leads to ROS production and eventual cell death, which when combined with prospects of enhanced oxidative stress implied by fig. 19 amplify the potential for long-term, chronic health effects.
More importantly, synergistic effects of complex nano-PM in the environment such as aggregates of silica nanoparticles and MWCNTs as illustrated in fig. 14 along with nano-soot PM and other ROS producers such as metal oxides (especially iron oxides driving Fenton chemistry) may pose especially acute inflammatory responses and even long term chronic effects. Figure 20 provides another interesting example of small soot aggregates and short chrysotile asbestos nanotubes collected by thermal precipitation in the air near an interstate freeway in El Paso, Texas (USA). Asbestos fibers continue to be ubiquitous in some locations as residue from vehicle brake lining wear, industrial furnace linings, or other asbestos product degradation or exposure. Nearly 7 percent of the dust generated in the aftermath of the World Trade Center twin towers collapse in New York city as a consequence of the September 11, 2001 attack was asbestos-related, especially chrysotile asbestos [65]. In addition, of the more than 5 million metric tons of commercial BC utilized in the U.S. annually, 70% is used in tire production as a strengthening agent where the BC composition is nearly 30%. This BC appears as tire wear debris especially along roadways [66].
Indeed, Veranth, et al. [66] have indicated that roadway-related soil PM containing carbonaceous matter induced proinflammatory response, and Table 2 illustrates that soil PM can contain more higher molecular weight PAHs than atmospheric PM [68]. Table 2 also demonstrates that there are some similarities in the outdoor atmospheric PM, PAH content as well as some distinct differences. Indoor air for Chicago is also similar in some respects to outdoor air while the Chicago indoor air PM exhibits different PAH concentrations than the El Paso, Texas indoor air. Table 2 illustrates that both indoor air and outdoor air PM, PAH content is generally dominated by naphthalene. Seville, Spain outdoor air PM presents some significant PAH content variations. These PAH variations have been related to different combustion regimes including coal burning, wood burning, diesel and gasoline combustion, etc. [37]. Coal burning soot PM and gasoline exhibit similar PAH contents to other soot PM but there are notable differences [37, 73]. Tire crumb has also been used in place of coal in some electric power generation combustion regimes since it has double the heat capacity (or energy density) of coal [74]. Efficient burning of fuels, especially gasoline and diesel, produces much smaller primary spherule PM (fig. 17(b)) and often smaller fractal aggregates. However, as noted earlier, it is difficult to recognize soot species by electron microscope imaging, and speciation using PAH content or PAH ratios (so-called diagnostic ratios) is often vague at best [37].
Comparative Cytotoxicities and ROS Generation for Carbonaceous Nano-PM: Respiratory Health Issues
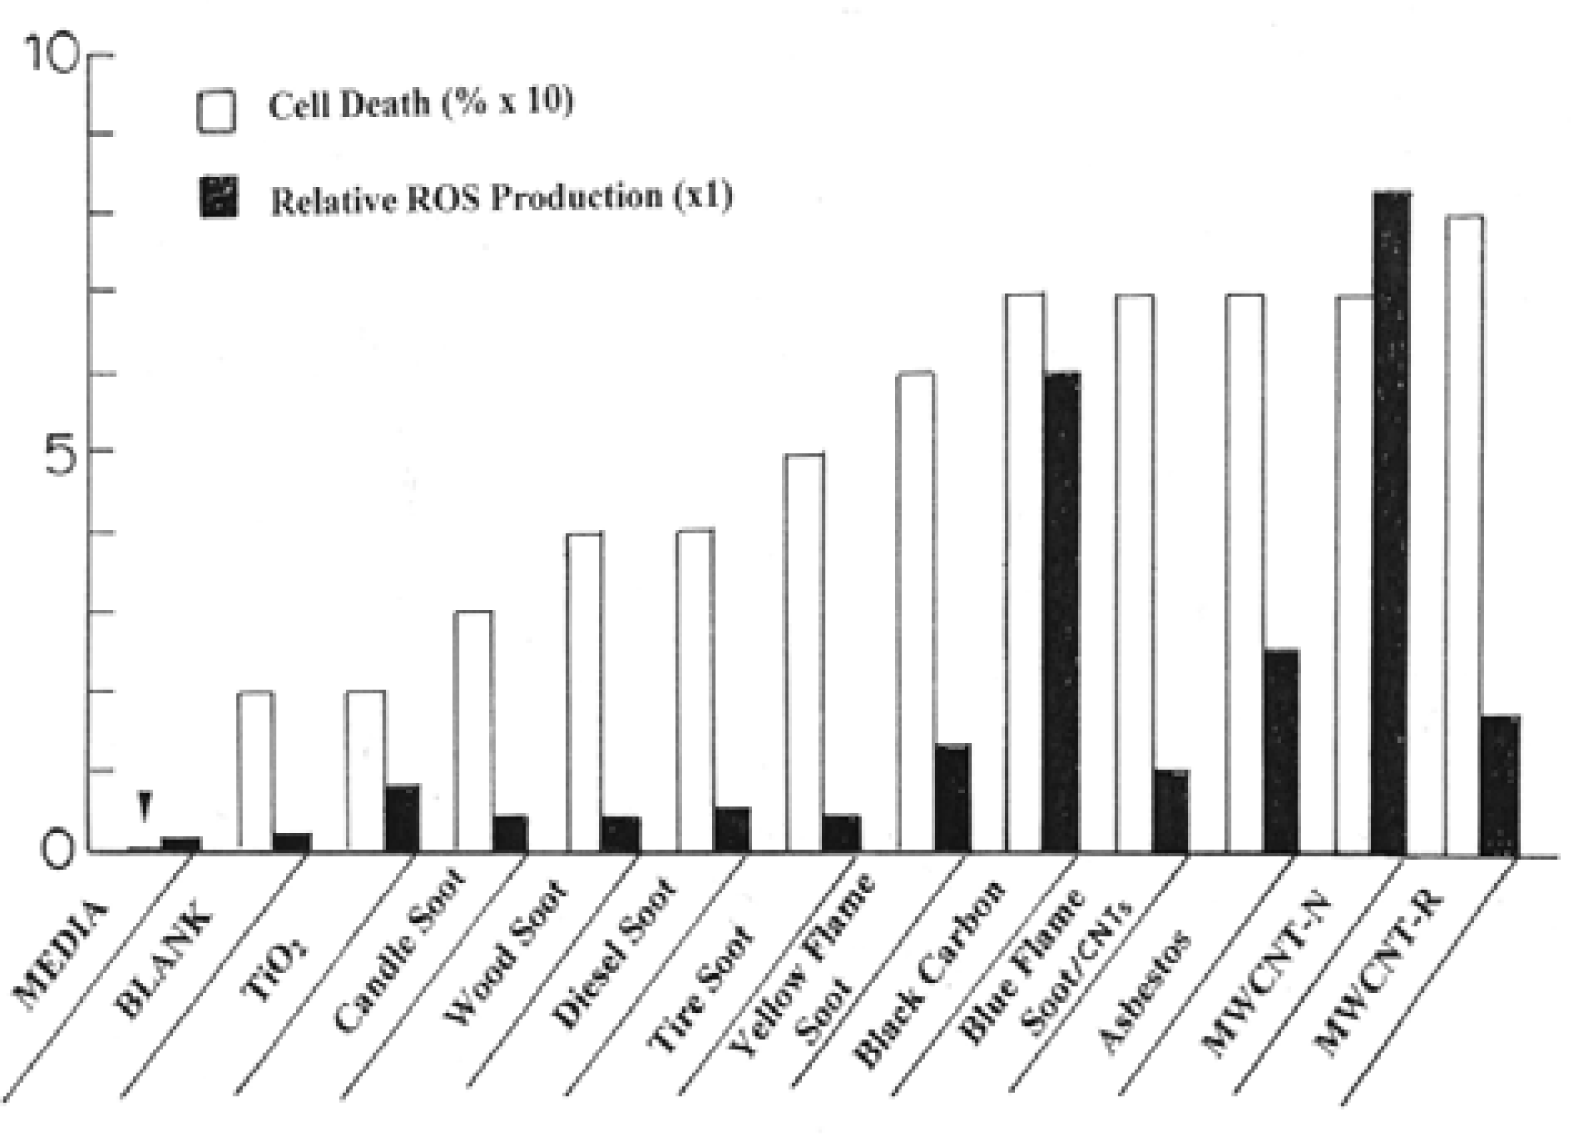
Figure 21 reproduces recent, comparative cytotoxicity assay and ROS production data for the carbonaceous nano-PM and chrysotile asbestos described herein. It can be noted that BC, natural gas blue-flame emission soot PM, asbestos, and the commercial MWCNT PM are among the most cytotoxic nano-PM aggregates. The catalytically grown MWCNT material (MWCNT-N) illustrated in fig. 2(b) exhibits both high cytotoxicity and short term ROS production. It is not known specifically whether the metal nano-catalysis PM influences these responses in a synergistic way, or whether the irregular MWCNT morphology has any effect. Since the BC response is similar, it is unlikely there is an obvious morphological or synergistic effect.
While in-vitro assays such as those represented in fig. 21 can provide information on the most common biological exposure responses, their ability to predict human compatibility and toxicity is not adequately developed. Furthermore, long term, chronic effects cannot be predicted even though there are well developed correlations for asbestos. In the absence of long term invivo studies of MWCNTs in animals and epidemiological correlations with human exposure, it might be assumed that since the nanostructures for chrysotile asbestos and carbon arc grown MWCNTs are essentially identical, inflammatory response for cell phagocytosis and long term ROS generation and DNA damage may exhibit some similarities, although assumptions regarding cancer-related effects of MWCNTs over the long term would be speculative. Nonetheless, in a recent in vivo study involving mouse mesothelia, MWCNTs identical to chrysotile asbestos (such as those in fig. 2(a)) produced short-term lesions identical to the asbestos [75].
Pope and Dockery [3] noted in a recent review that, “Scientific efforts to understand the health effects of air pollution have taken place within the context of contentious and controversial debate about public health policy, environmental regulations, the relative costs of pollution versus its abatement, and who pays these costs. The extent to which politics, pressure groups, special interests, and funding opportunities and sources influence the science and how it is interpreted is unknown, but these influences may contribute to our skepticism”. Indeed, add to these prospects for increasing production and use of MWCNTs and other nano-PM fueling emerging nanotechnologies, and the issues of respiratory health effects become even more complex. Nonetheless, it would seem prudent to seriously consider lessons learned from the past, especially in the context of asbestos production, manufacture, and proliferation world-wide; and the concommitant range of severe and fatal health consequences.
Conclusions
Chrysotile asbestos nanotubes and multiwall carbon nanotubes are microstructurally and nanostructurally identical in most respects. Both are cytotoxic and both are efficient ROS generators. Both have been demonstrated very recently to produce mesothelial lesions in mice [75]. Multiconcentric fullerene nanoparticles differentiate themselves from turbostratic soots and BC while nanosoots or primary soot nanospherules are differentiated by various concentrations of intercalated PAH isomers having different molecular weights. Candle, wood, tire, diesel, and natural gas burner soots as well as BC are all variously cytotoxic and generate ROS. BC, soots, and multiwall carbon nanotubes are all ubiquitous in both the indoor and outdoor environments.
Figure 1:.
Chrysotile asbestos nanotubes. (a) Small mineral sample form large mine in Quebec, Canada. (b) TEM image of individual nanotubes, broken fragments, and small aggregated bundles [42]. (c) Magnified TEM image of aggregated chrysotile nanotubes [41]. (d) SAED pattern corresponding to the aggregate in (c) showing streaking of diffraction spots. (e) Curved layer schematic tube sections spaced 7.5 Å. (After De Souza Santos [39]).
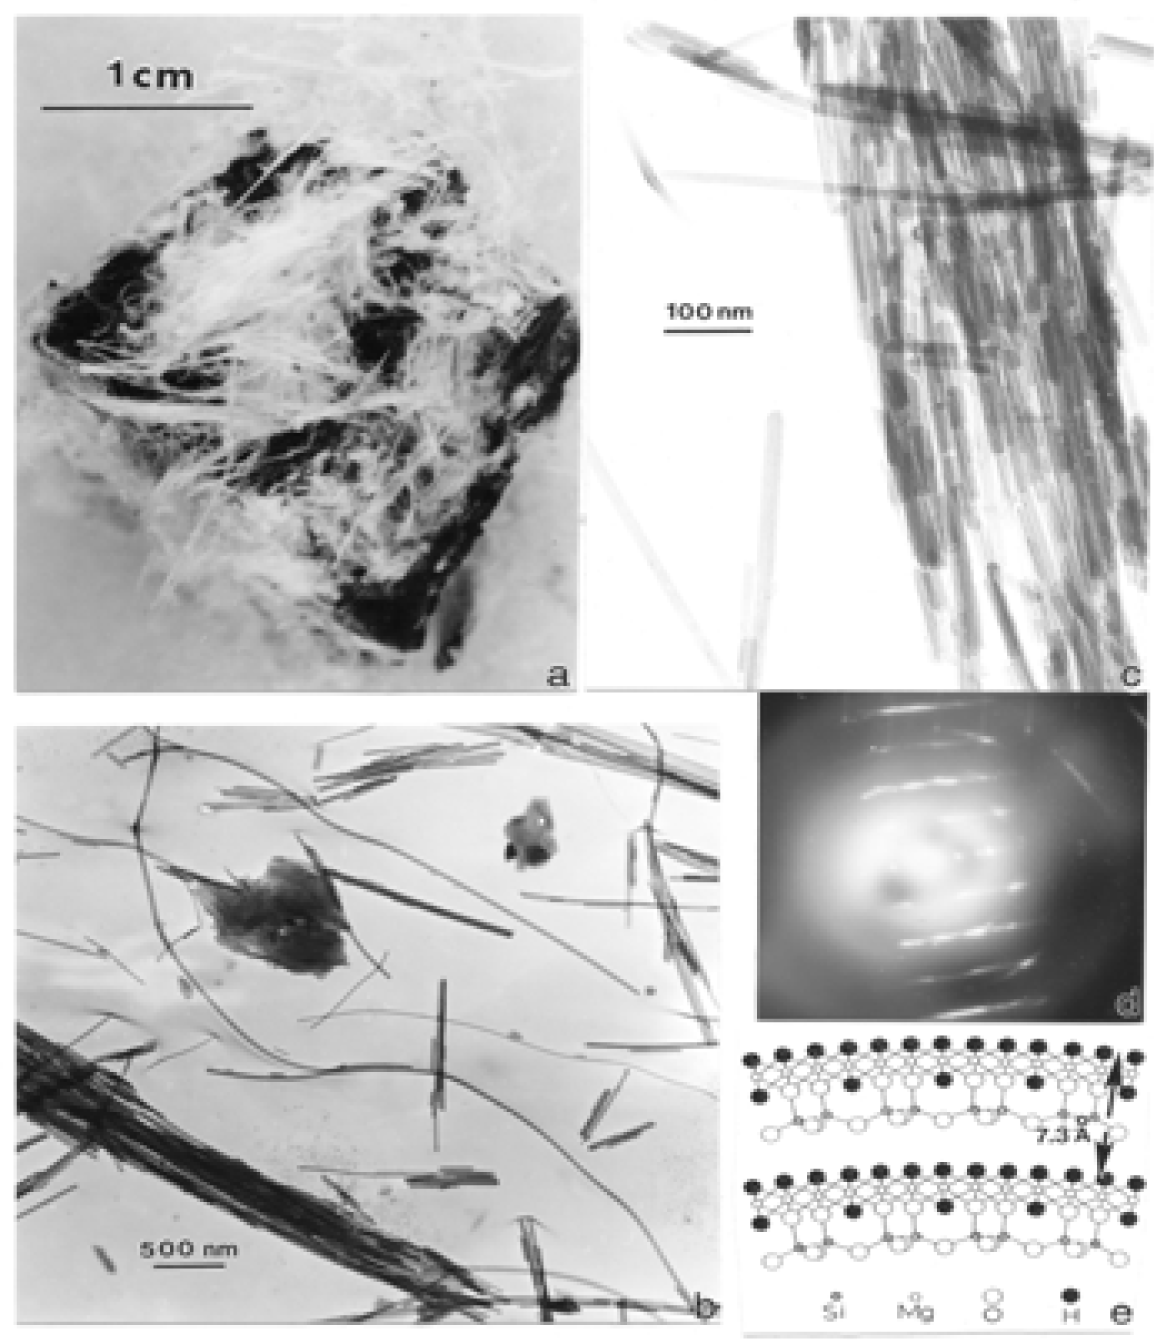
Figure 2:.
Arc evaporation produced MWCNTs (a) and metal catalyst produced MWCNTs (b). (b) is after Soto, et al. [29]. The magnification in (b) is shown in (a).
Figure 2:.
Arc evaporation produced MWCNTs (a) and metal catalyst produced MWCNTs (b). (b) is after Soto, et al. [29]. The magnification in (b) is shown in (a).

Figure 3:.
TEM image of MWCNT and multiconcentric fullerenes produced by injecting fine tire powder into an electric arc in helium.
Figure 3:.
TEM image of MWCNT and multiconcentric fullerenes produced by injecting fine tire powder into an electric arc in helium.
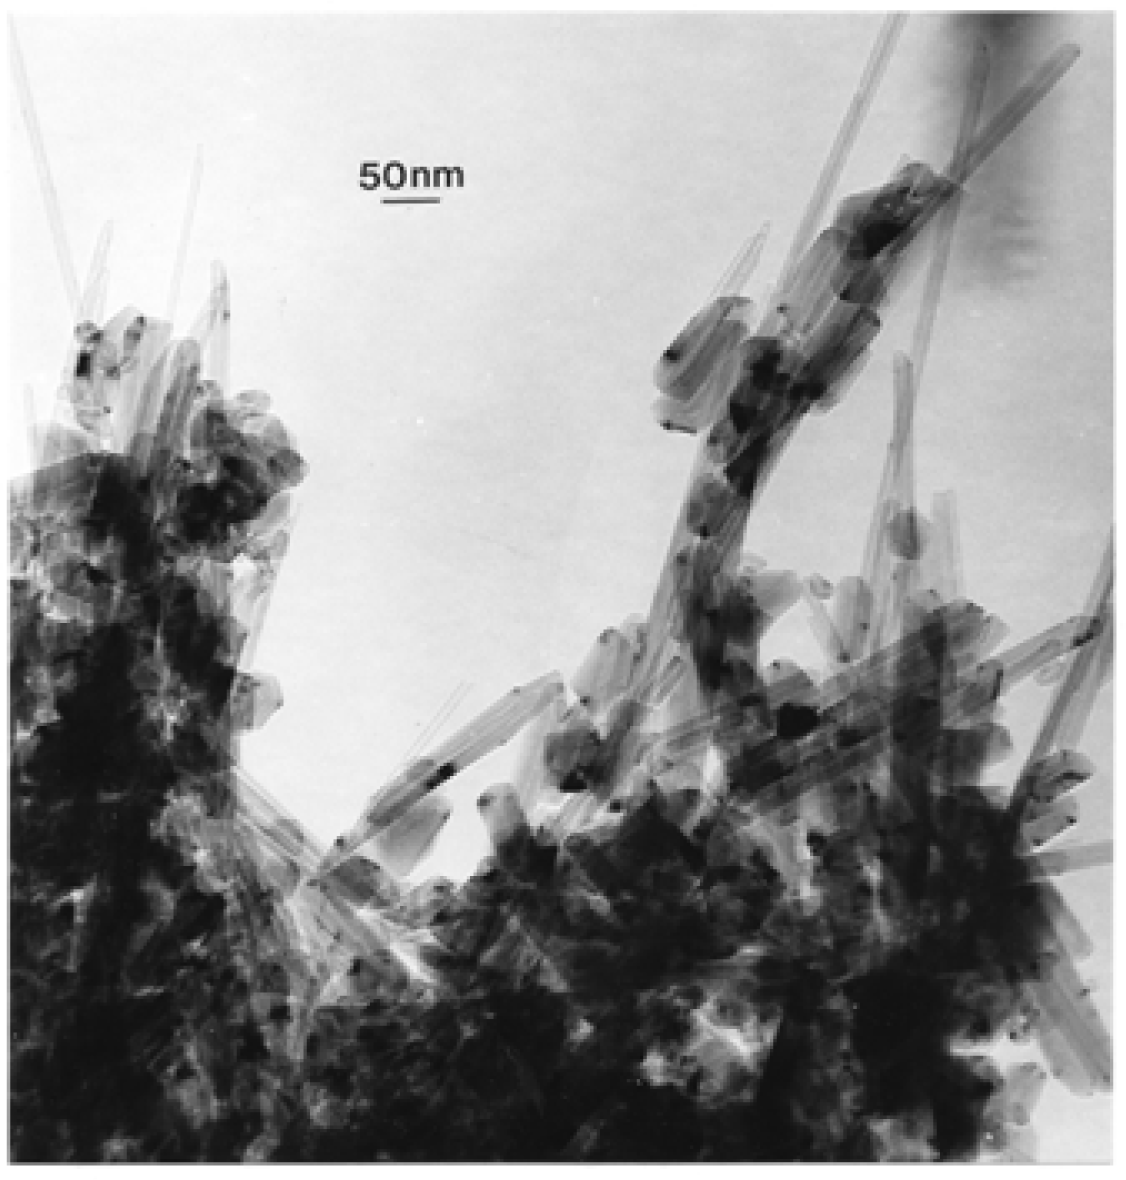
Figure 4:.
TEM bright-field images of MWCNT aggregates collected by thermal precipitation. (a) Variety of MWCNTs and multiconcentric fullerenic PM from propane kitchen range. (b) Dense aggregate of short MWCNTs and multiconcentric fullerenes from outdoor, industrial natural gas source.
Figure 4:.
TEM bright-field images of MWCNT aggregates collected by thermal precipitation. (a) Variety of MWCNTs and multiconcentric fullerenic PM from propane kitchen range. (b) Dense aggregate of short MWCNTs and multiconcentric fullerenes from outdoor, industrial natural gas source.

Figure 5:.
Nucleation growth and speciation of carbon nanotubes. (a) TEM image of aggregated MWCNTs and multiconcentric fullerenes collected above a natural gas kitchen burner by thermal precipitation [38]. (b) Carbon nanotube or fullerenic PM formation by methane combustion from hemispherical end caps. (c) Shows a few examples of end cap nuclei from Lair, et al. [42, 43]). (d) Shows single wall CNT conversions. 1 denotes zig-zag, 2 is chiral (0 < θ < 30°), 3 and 4 are armchair types. Large arrows are tube axes normal to C. (After Murr and Soto [46]).
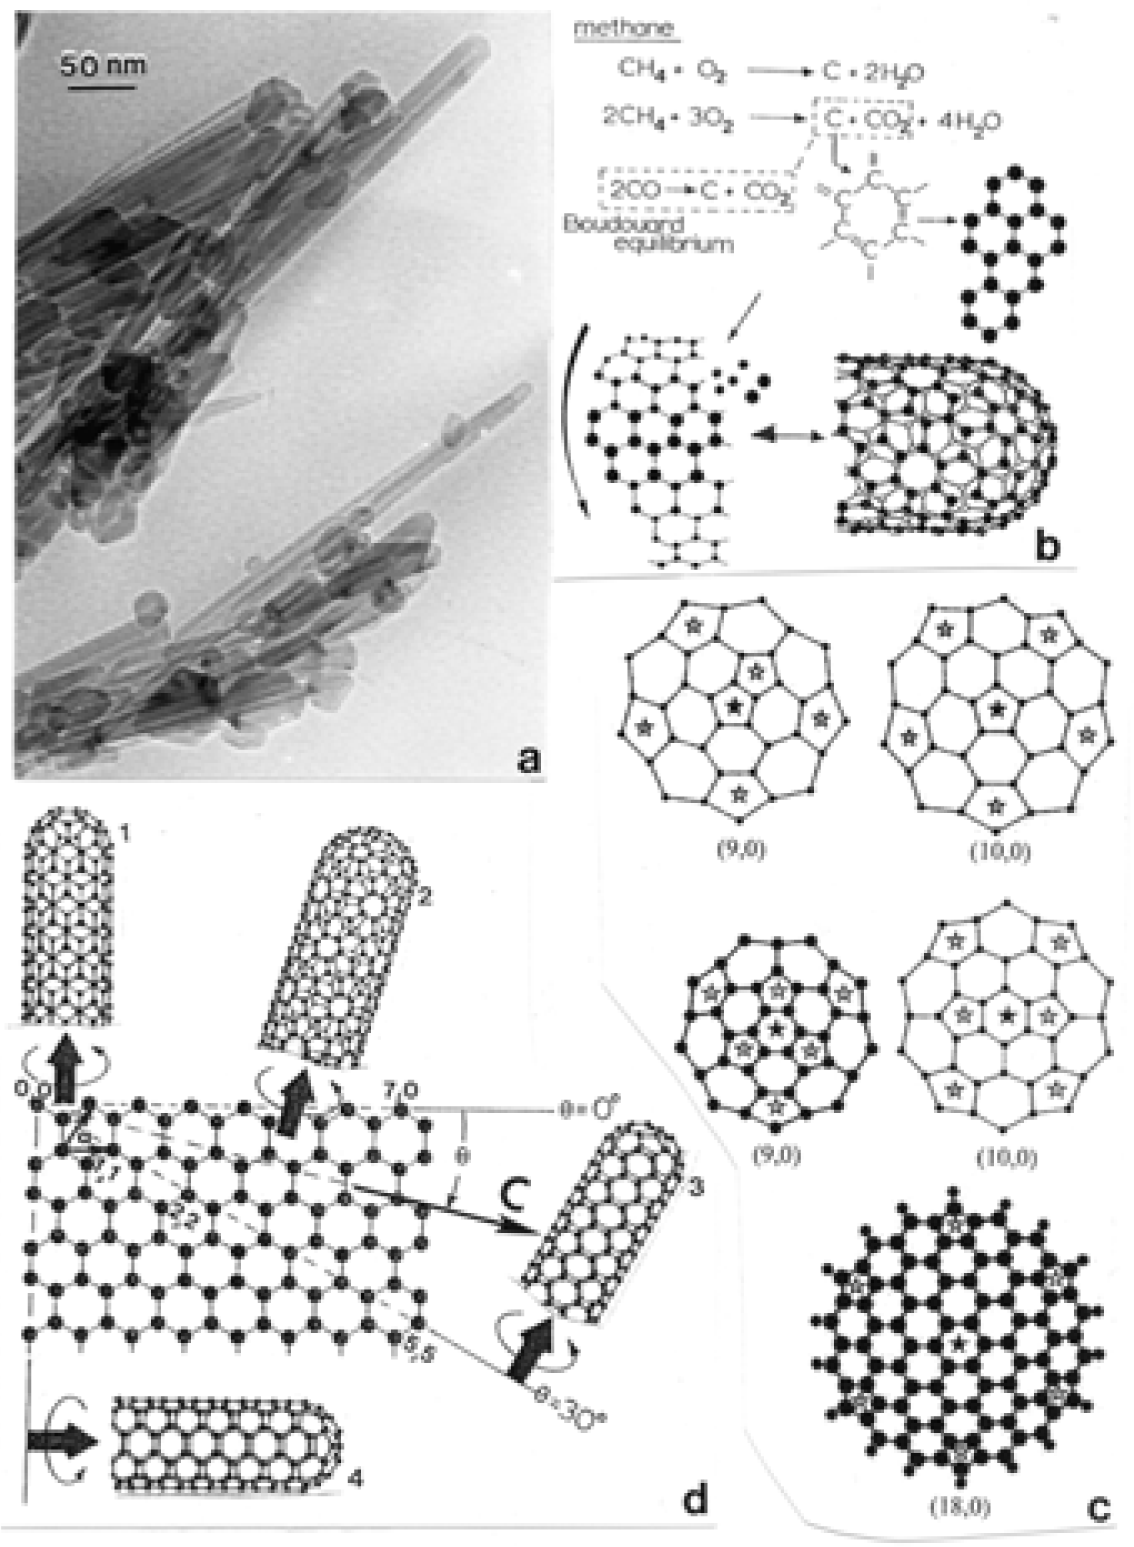
Figure 6:.
Simple wire models for carbon nanotube types. (a) Zig-zag tube; θ = 0°. (b) Chiral tube; θ = 13°. (c) Armchair tube; θ = 30°. (d) Chiral tube growing over zigzag tube. (e) Chiral tube growing over armchair tube.
Figure 6:.
Simple wire models for carbon nanotube types. (a) Zig-zag tube; θ = 0°. (b) Chiral tube; θ = 13°. (c) Armchair tube; θ = 30°. (d) Chiral tube growing over zigzag tube. (e) Chiral tube growing over armchair tube.
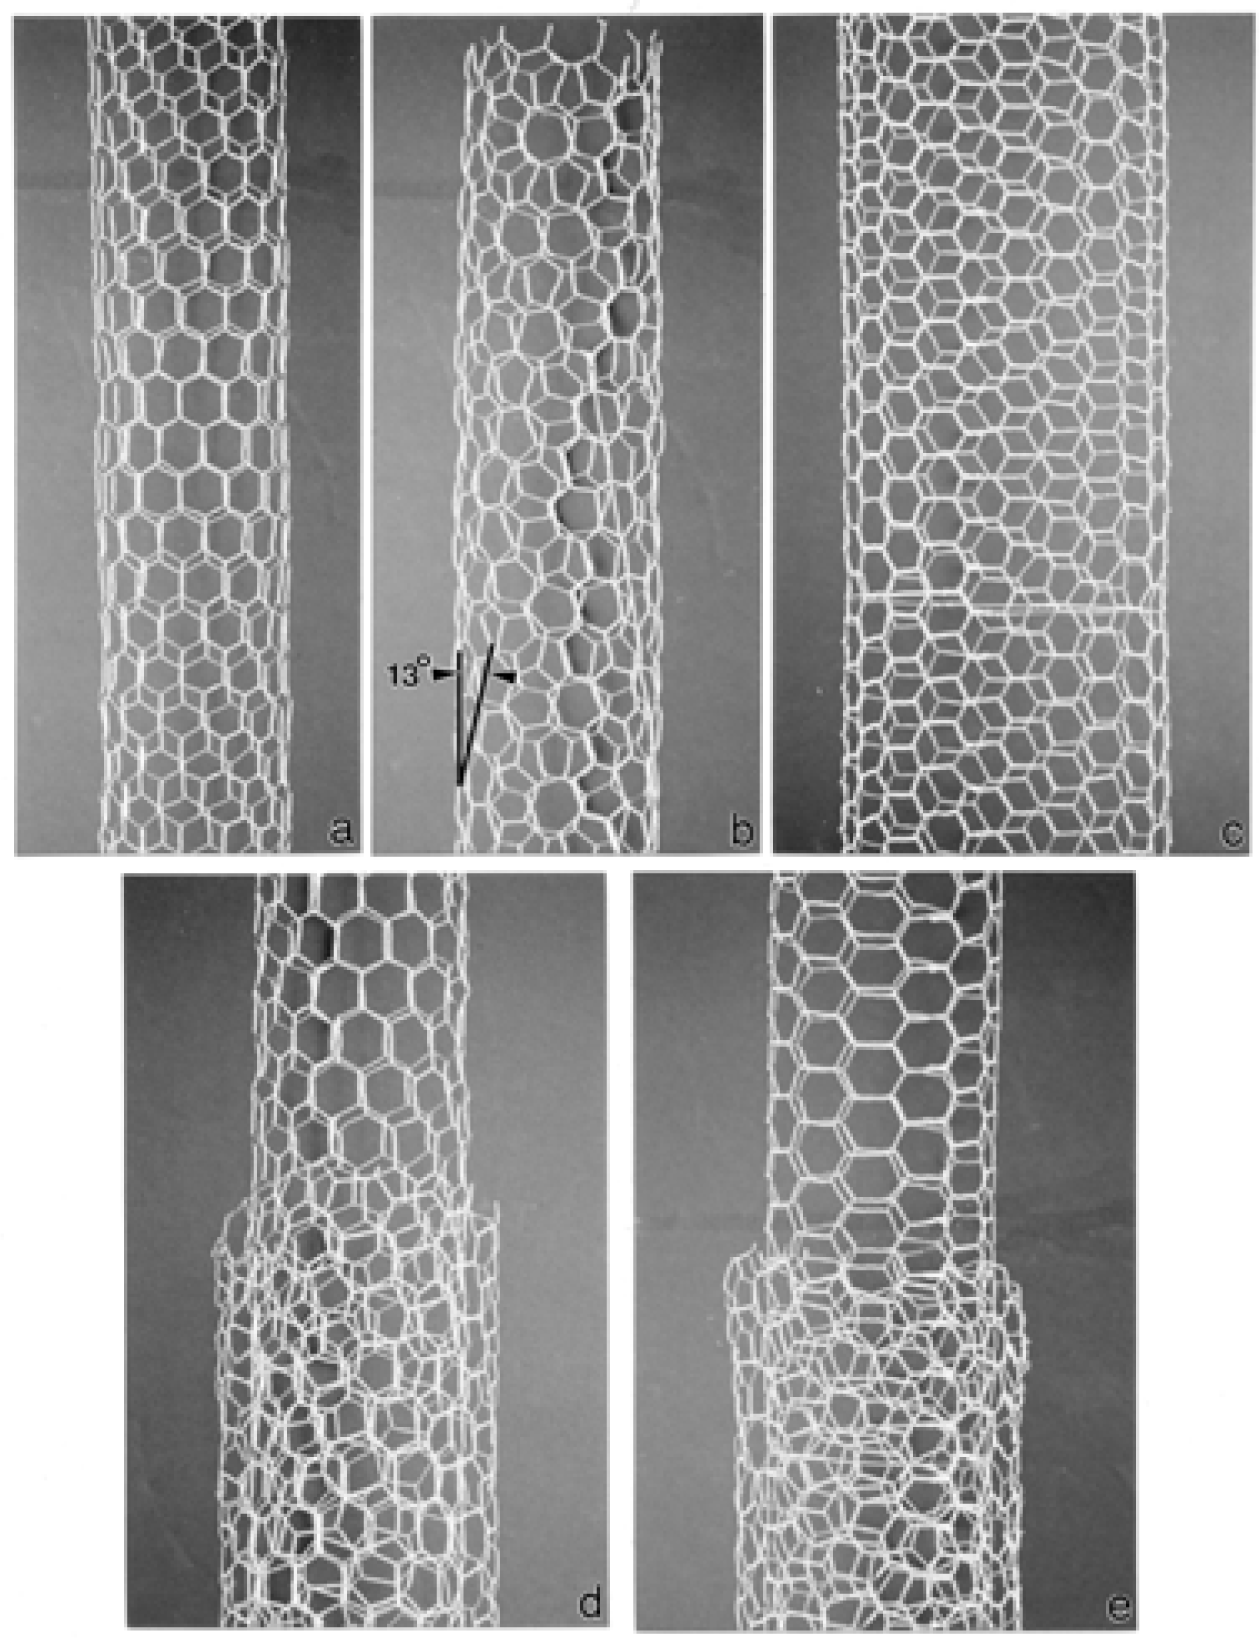
Figure 7:.
Carbon nanotube growth simulations and schematics. (a) Double cap nucleus. (b) Double tube nucleation and growth simulation from (a) forming an armchair tube growing over an armchair tube. ((a) and (b) are from Lair, et al. [44]. (c) Schematic showing a chiral tube growing over the same chiral tube. (d) Ideal graphite lattice and unit cell showing unit cell and graphene lattice dimensions.
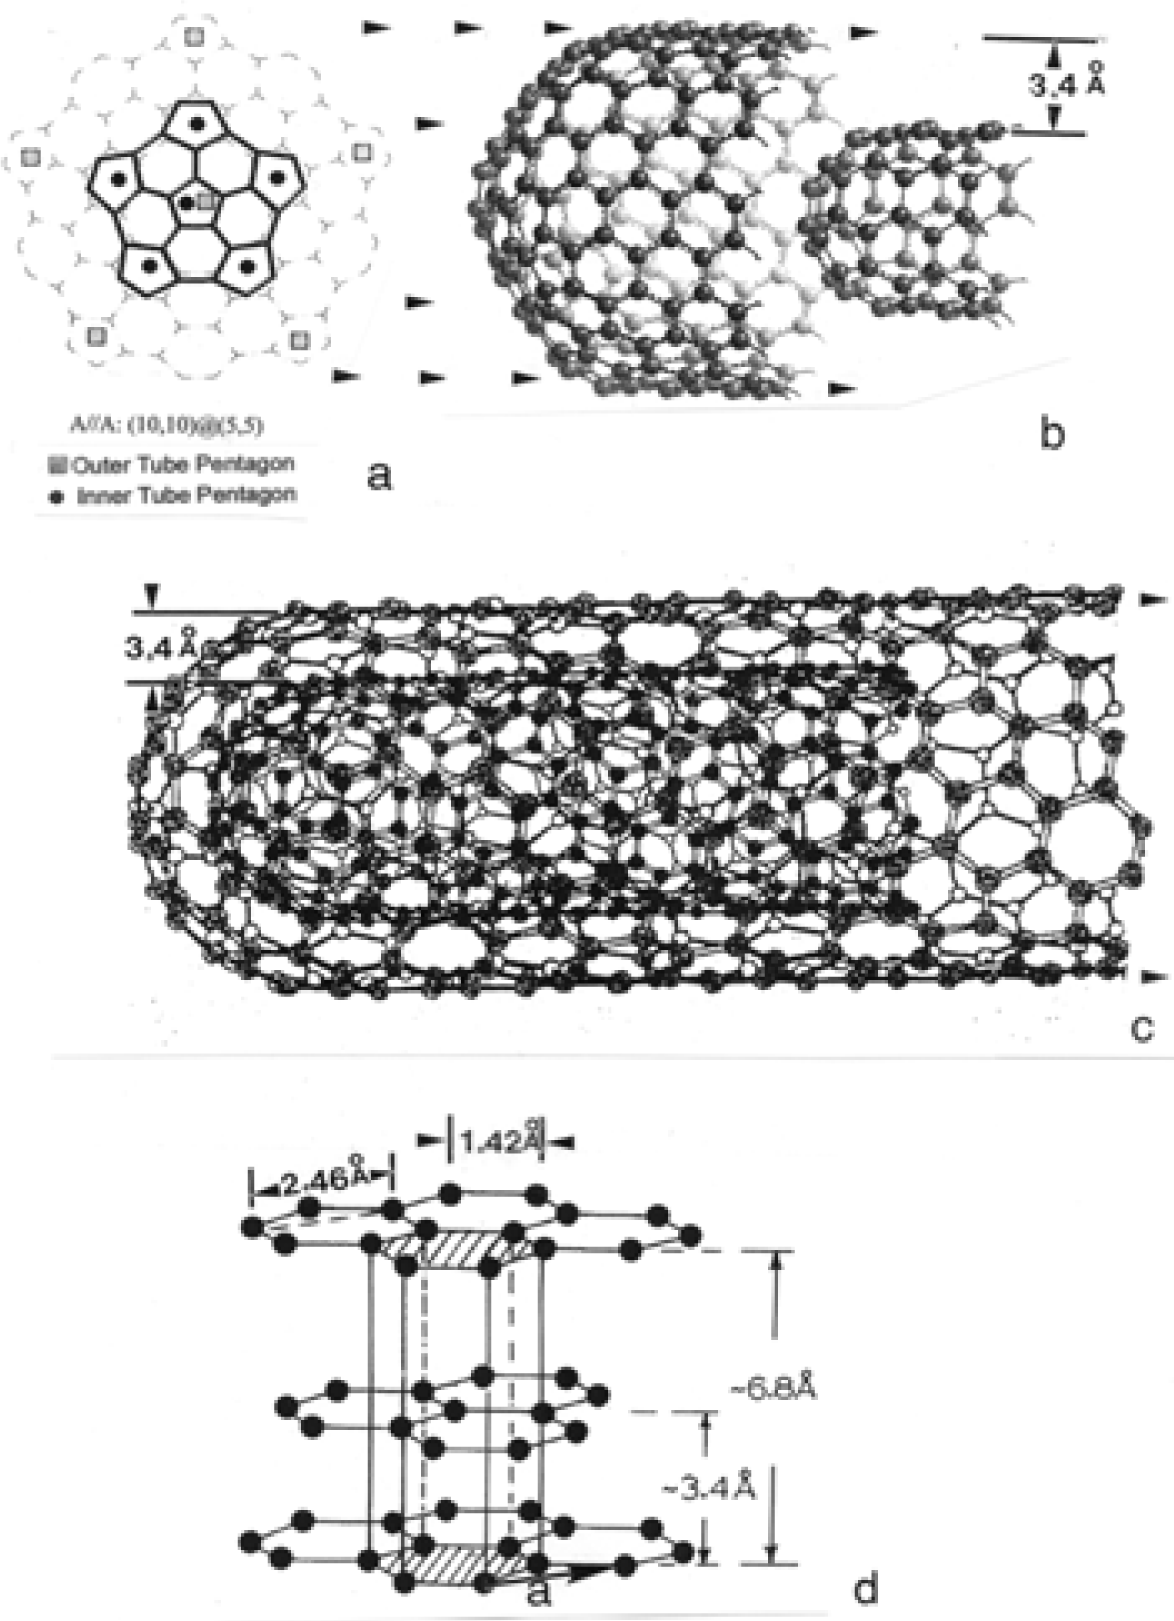
Figure 8:.
TEM images of a nano-soot PM aggregate (a) and a propane-combustion-generated MWCNT aggregate (b). (c) shows the SAED pattern for (a) white (d) and (e) represent (b) at different exposures. (f) shows a phase-contrast TEM image for chrysotile asbestos nanotubes. (g) shows a (reverse) phase contrast TEM image for natural gas-produced MWCNTs. The arrow illustrates the outer contrast fringe (black for chrysotile in (f) and white for MWCNTs in (g)). This occurs by imaging above or below the focal plane. Note the internal tube contrast also reverses. From Murr, et al. [47].
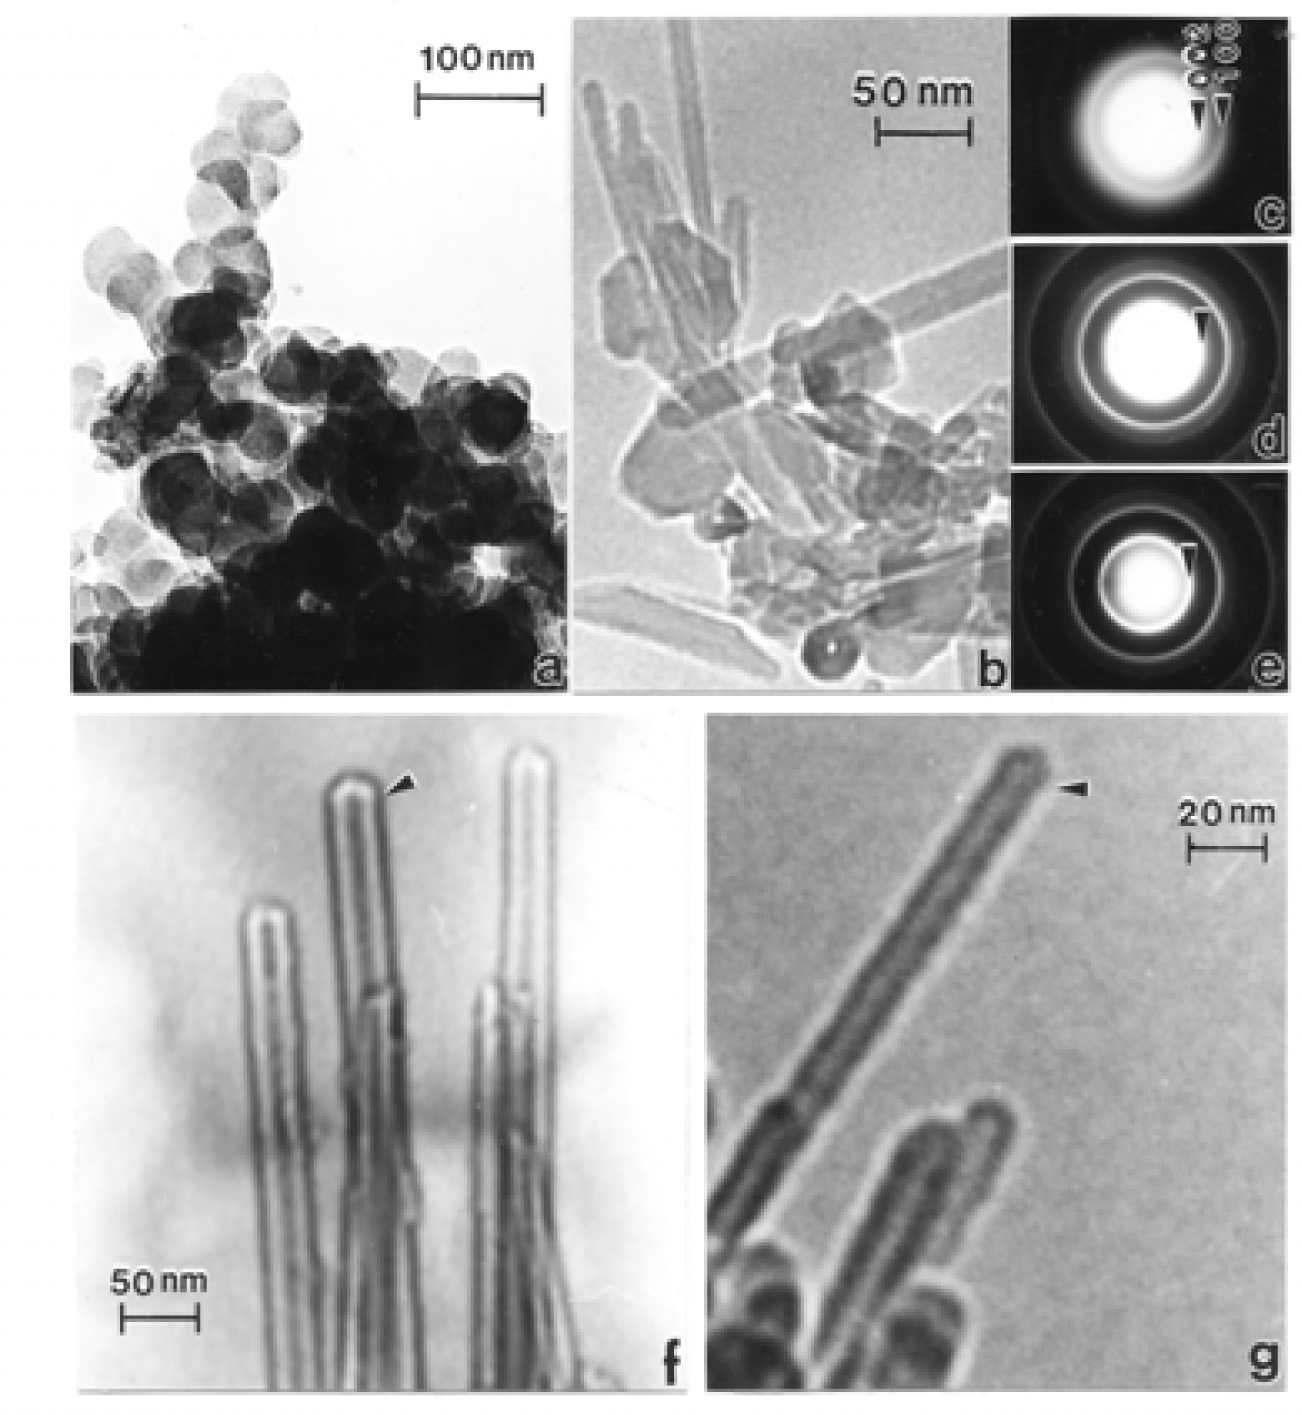
Figure 9:.
TEM images for MWCNT aggregates containing faceted, polyhedral structure. (a) Natural gas (flame) produced. SAED pattern show graphitic reflections noted while the high resolution image insert shows 13 concentric nanotube layers. (b) Propane truck exhaust MWCNT, multiconcentric fullerene aggregate collected by thermal precipitation.
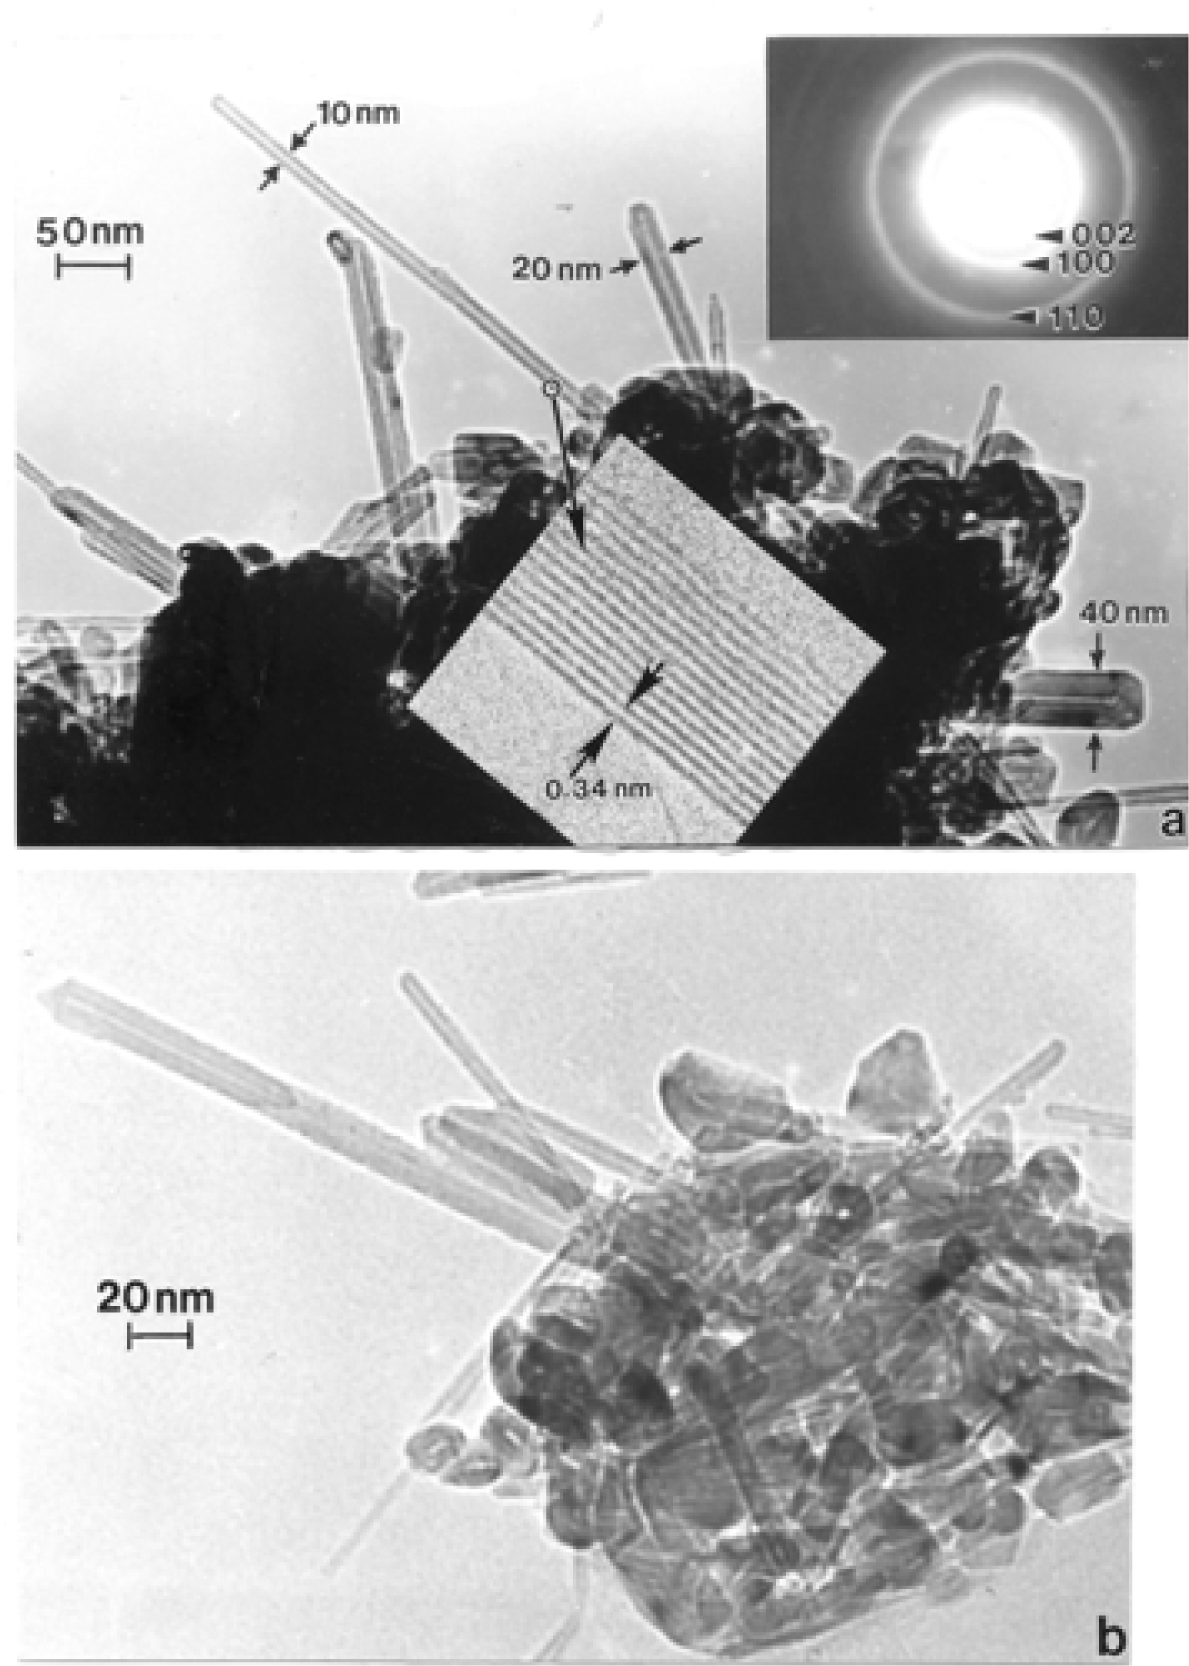
Figure 10:.
TEM image comparison for MWCNT/multiconcentric fullerene PM aggregates collected by thermal precipitation. (a) Pure methane air flame product. (b) Natural gas (96% methane)-air flame product (c) and (d) show propane-air flame products.
Figure 10:.
TEM image comparison for MWCNT/multiconcentric fullerene PM aggregates collected by thermal precipitation. (a) Pure methane air flame product. (b) Natural gas (96% methane)-air flame product (c) and (d) show propane-air flame products.
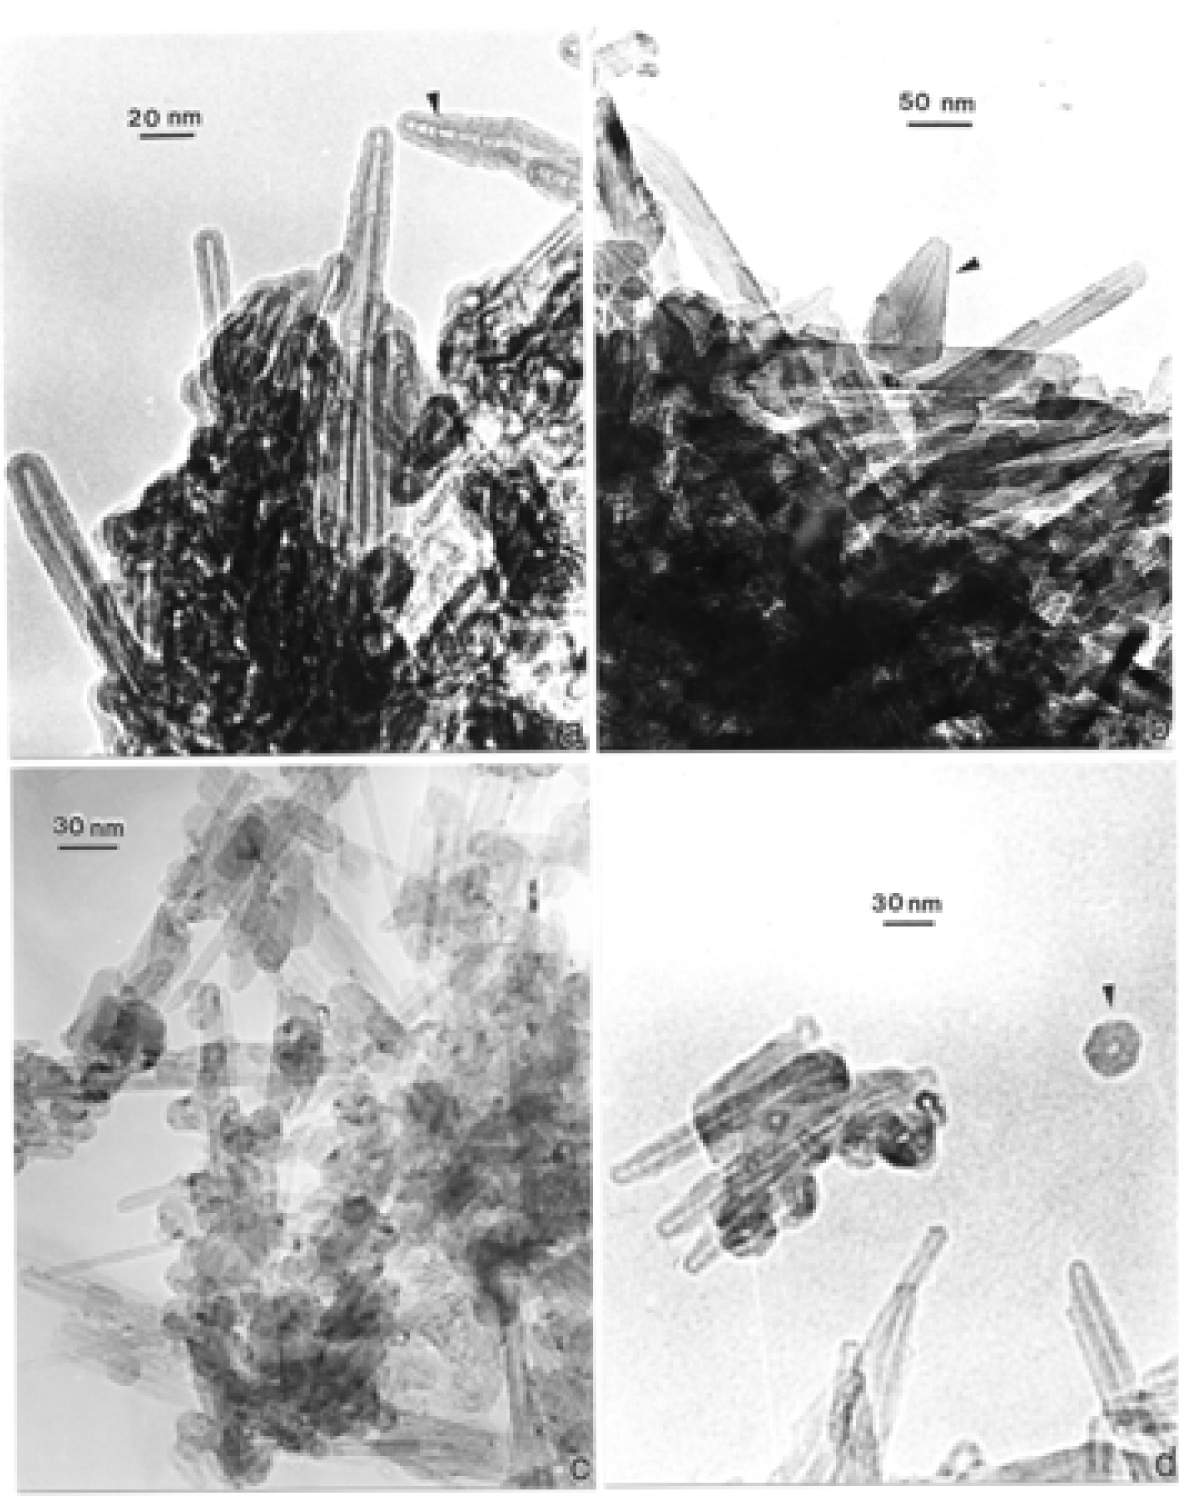
Figure 11:.
Nanostructural faceting of multiconcentric carbon nanoforms. (a) Schematic rendering of 5-layer carbon fullerene or carbon onion (After [48]). (b) Magnified view of carbon nanoform in fig. 10(d) for comparison with (a). (c) Magnified view of MWCNT end cap facets in fig. 9(a).
Figure 11:.
Nanostructural faceting of multiconcentric carbon nanoforms. (a) Schematic rendering of 5-layer carbon fullerene or carbon onion (After [48]). (b) Magnified view of carbon nanoform in fig. 10(d) for comparison with (a). (c) Magnified view of MWCNT end cap facets in fig. 9(a).
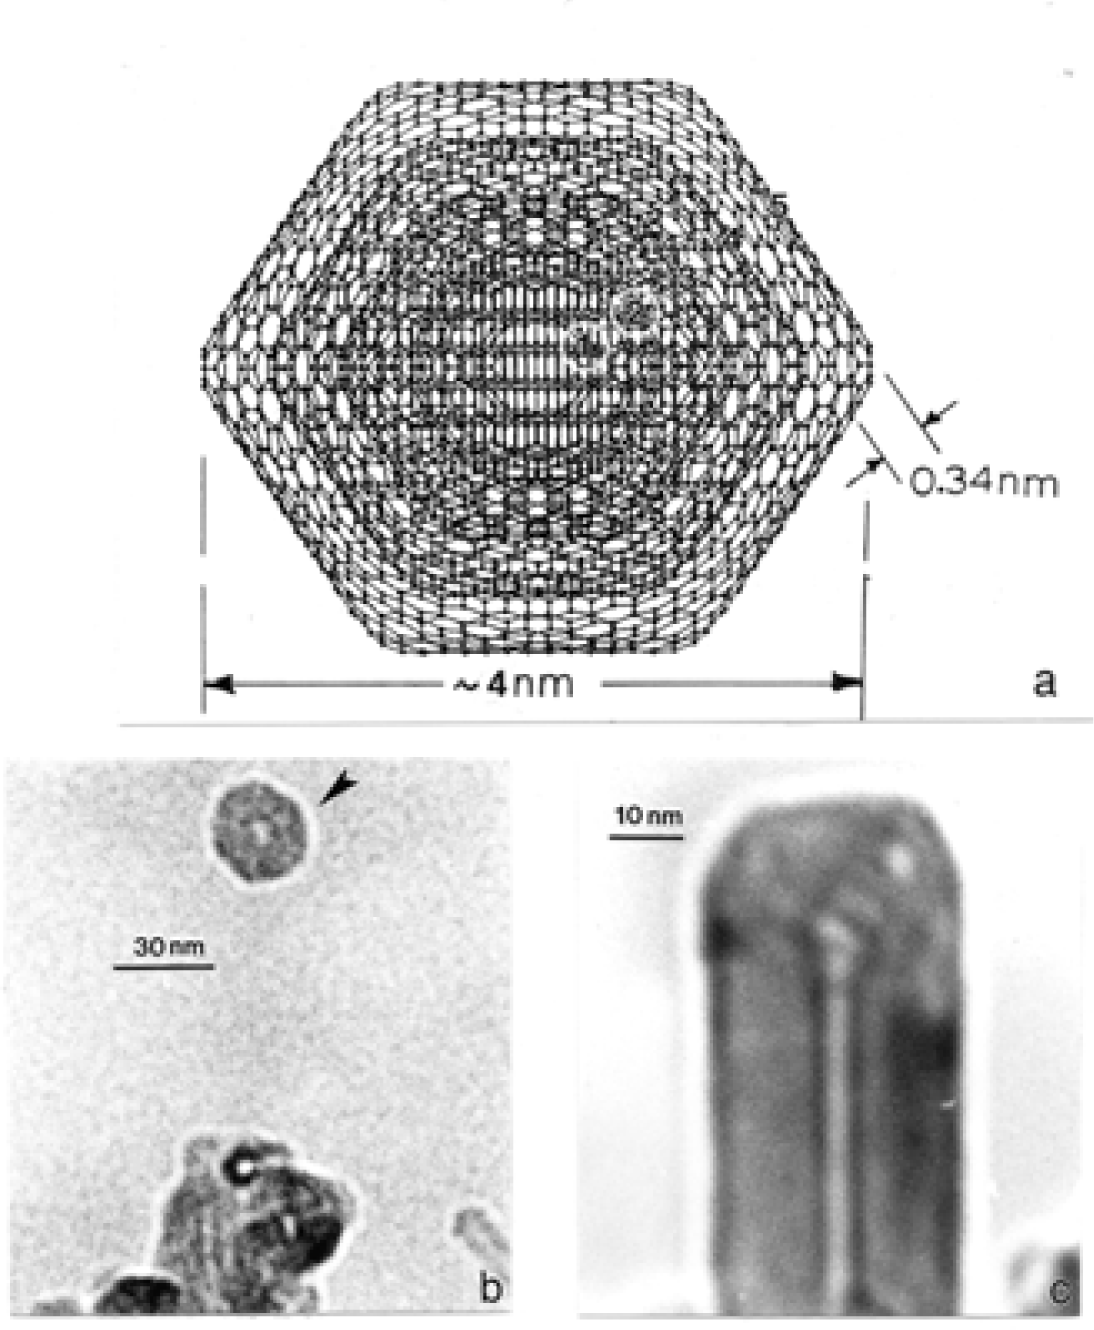
Figure 12:.
Propane flame-derived MWCNT aggregates collected by thermal precipitation and observed in the TEM. (a) Predominantly multiconcentric fullerene nano-PM. (b) Mixture of MWCNTs and multiconcentric, faceted fullerenic polyhedra. (From Murr, et al. [49]).
Figure 12:.
Propane flame-derived MWCNT aggregates collected by thermal precipitation and observed in the TEM. (a) Predominantly multiconcentric fullerene nano-PM. (b) Mixture of MWCNTs and multiconcentric, faceted fullerenic polyhedra. (From Murr, et al. [49]).
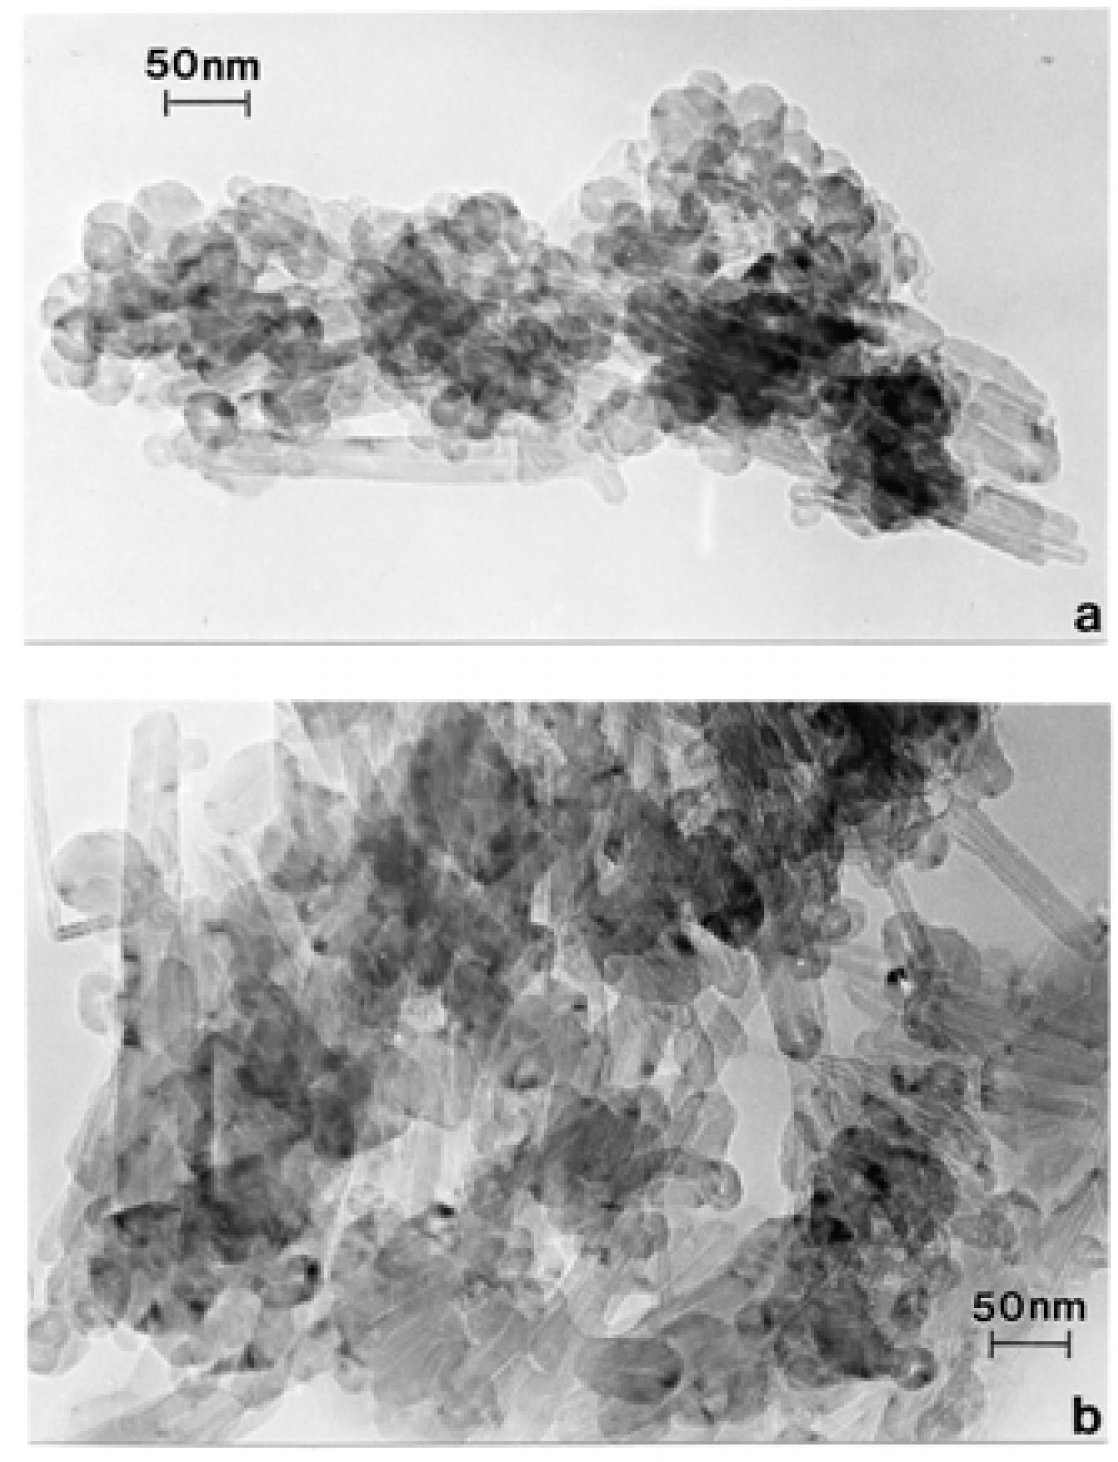
Figure 13:.
TEM images for environmental MWCNTs. (a) MWCNTs collected near a natural gas electric power generation plant. (b) MWCNTs and aggregated graphitic PM in wood soot. (From Murr and Guerrero [50]).
Figure 13:.
TEM images for environmental MWCNTs. (a) MWCNTs collected near a natural gas electric power generation plant. (b) MWCNTs and aggregated graphitic PM in wood soot. (From Murr and Guerrero [50]).
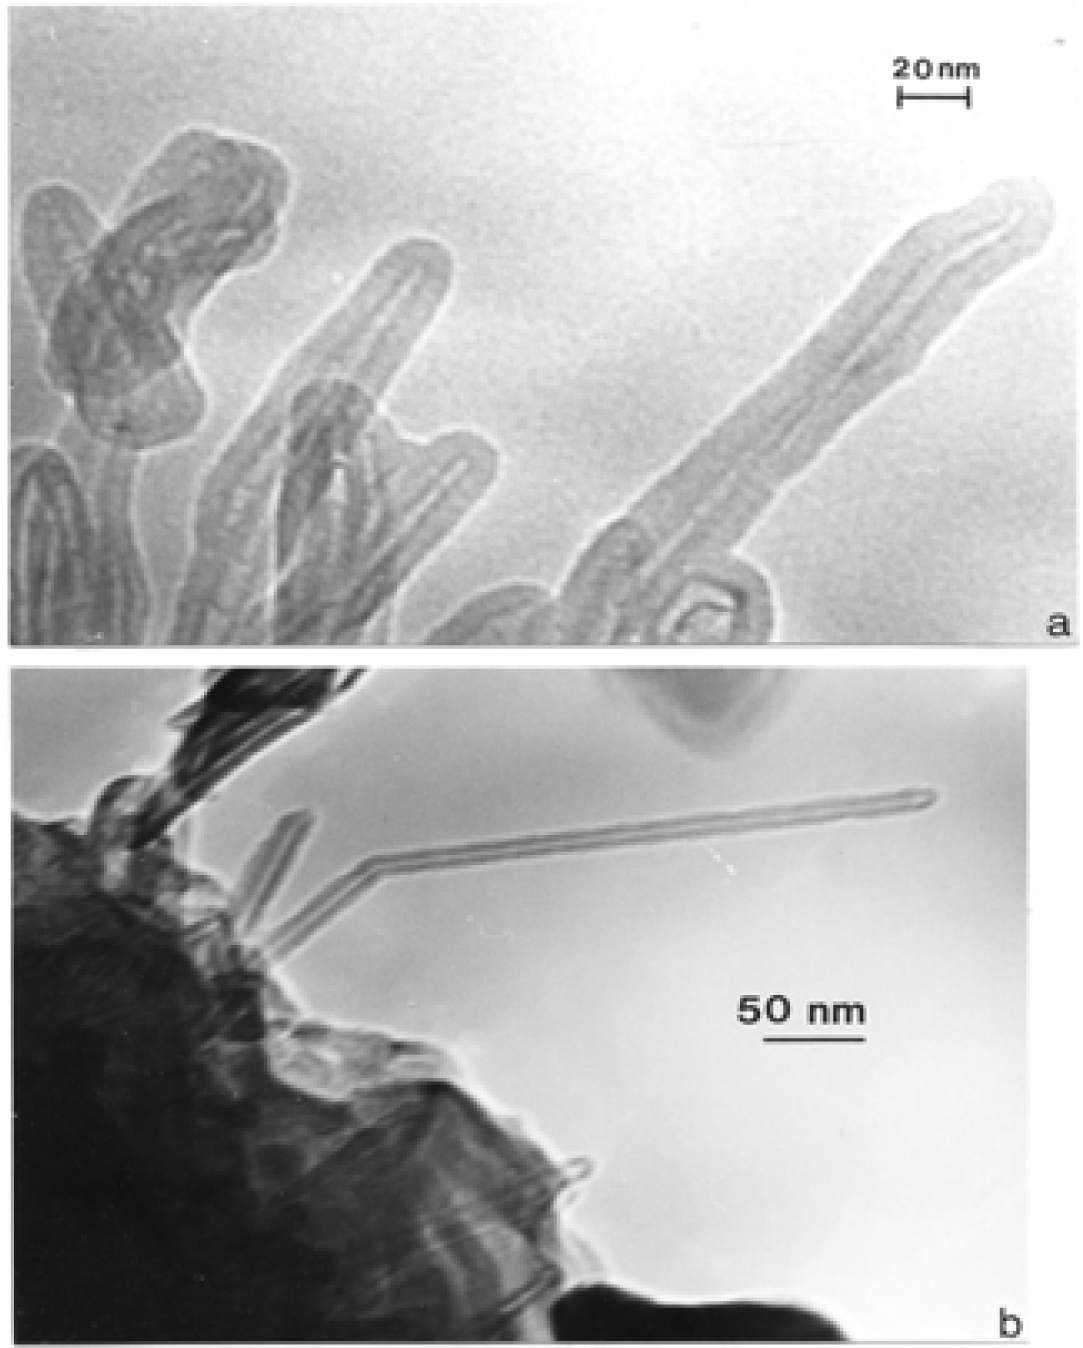
Figure 14:.
Complex aggregate composed of silica (SiO2) nano-PM and relatively short MWCNTs and other multiconcentric fullerenes observed in the analytical TEM. (a) Bright-field image. (b) Aperture dark-field image of (a) using the diffraction region marked by arrow in SAED pattern insert in (d). (c) Shows the corresponding EDS spectrum absent the oxygen signal. (From Murr, et al [47]).
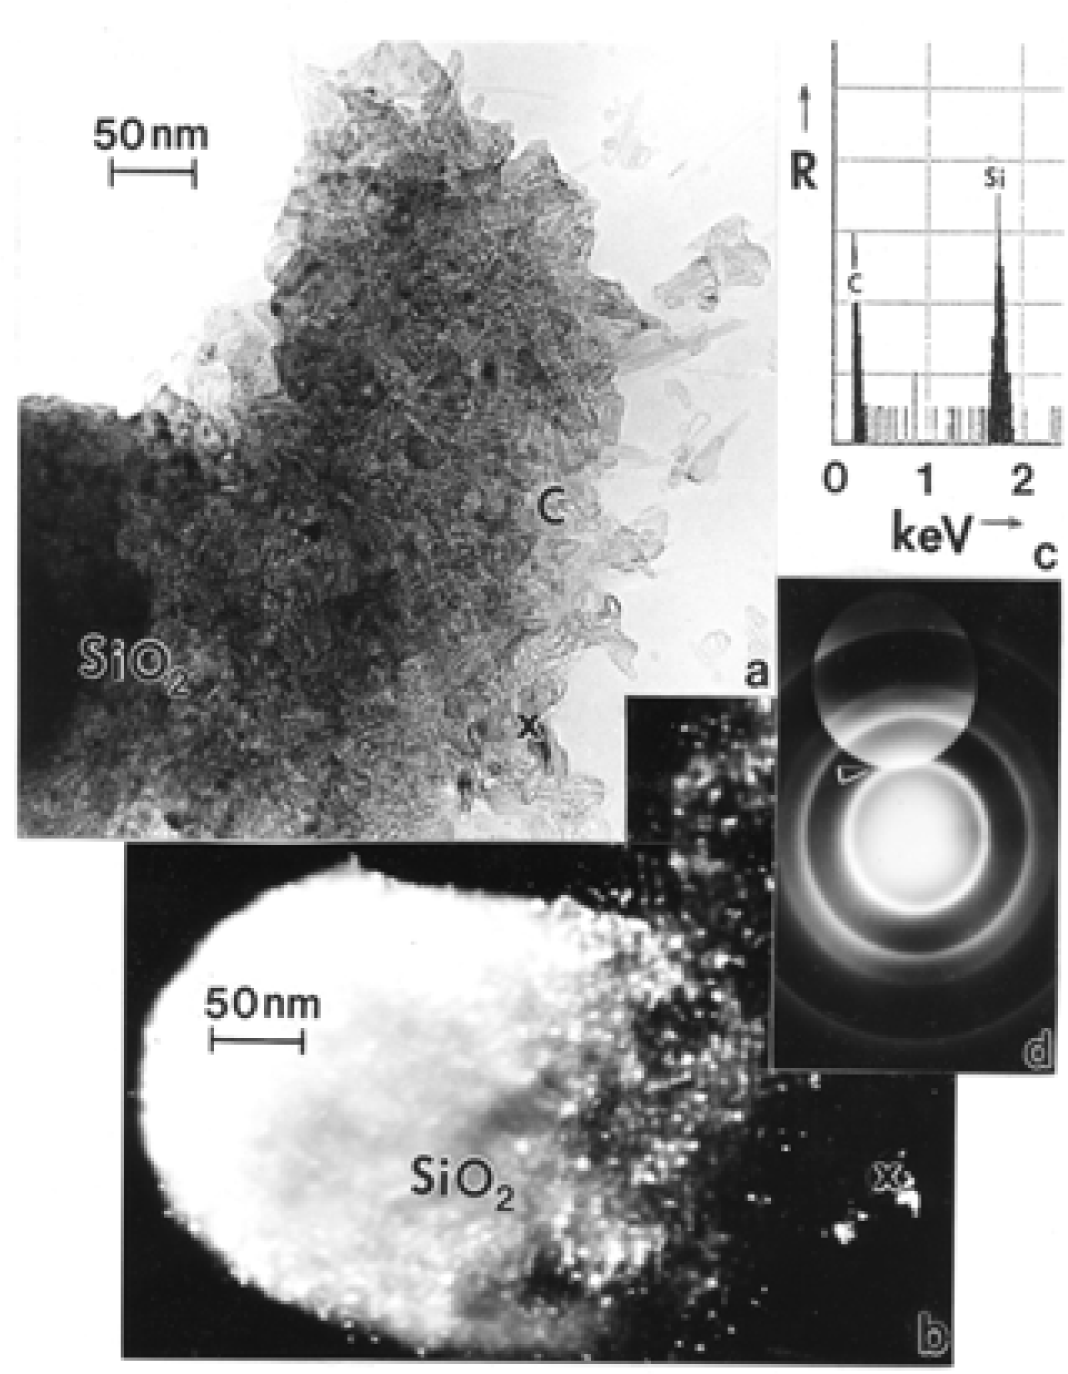
Figure 15:.
TEM image of MWCNT bundle collected indoors on an electrostatic plate.
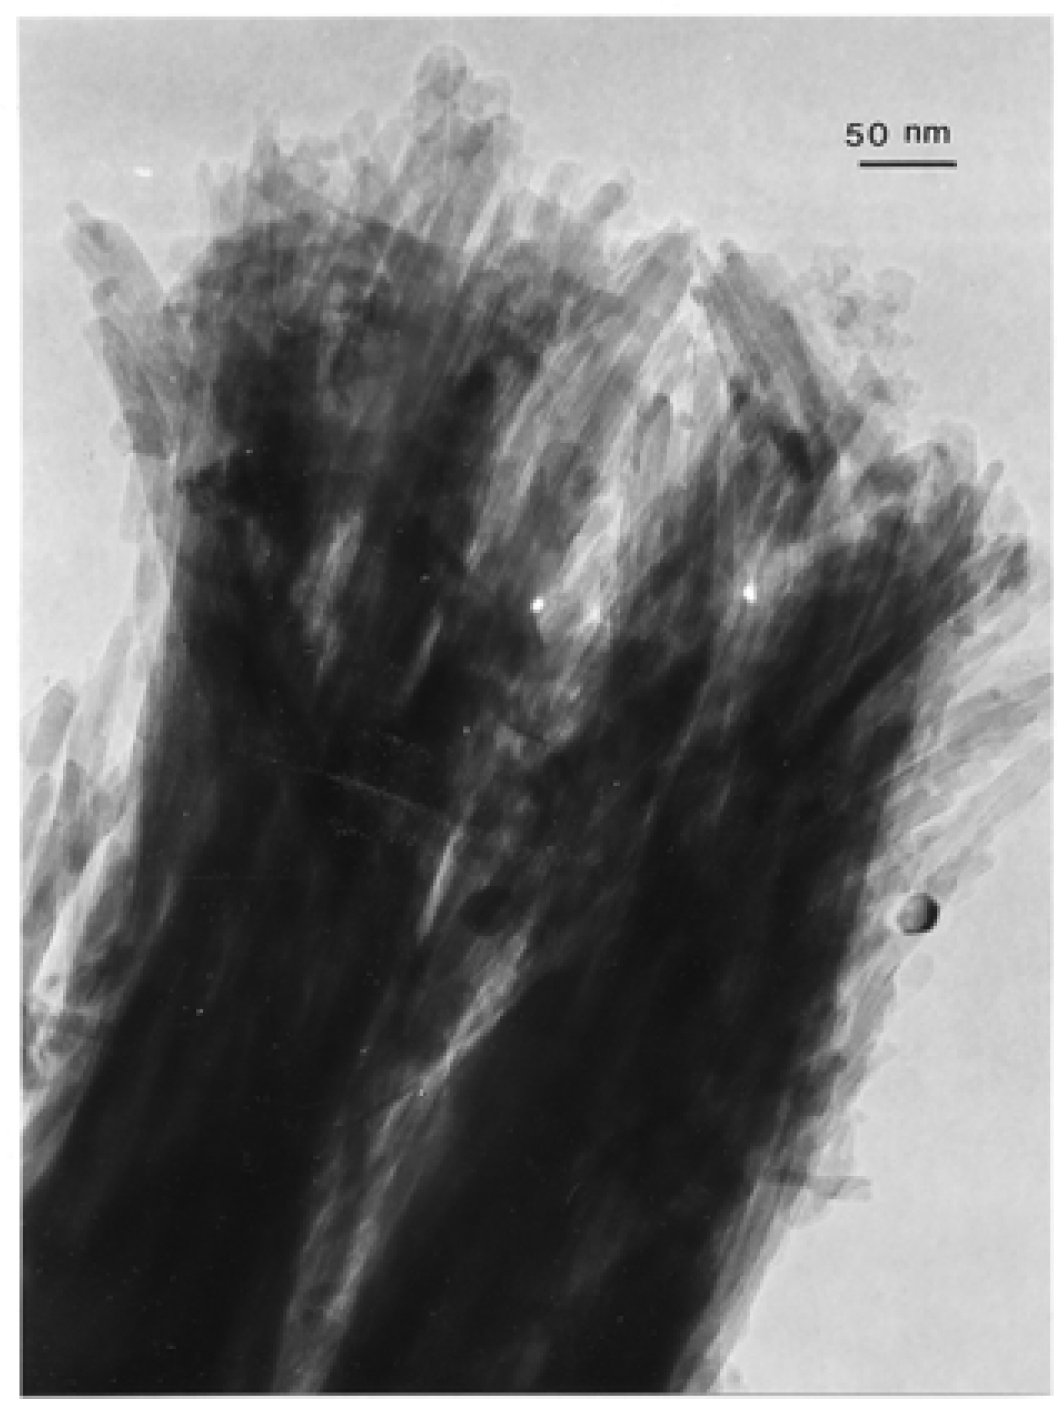
Figure 16:.
FESEM and TEM images of speciated soot PM. (a) FESEM view of candle soot (CPM). (b) Wood soot (WPM) observed in FESEM. (c) Diesel soot (DPM) observed in FESEM. (d) TEM image of tire soot (TPM). (a) to (c) PM collected on glass fiber filters. PM in (d) collected by thermal precipitation. (From Murr, et al [47]).
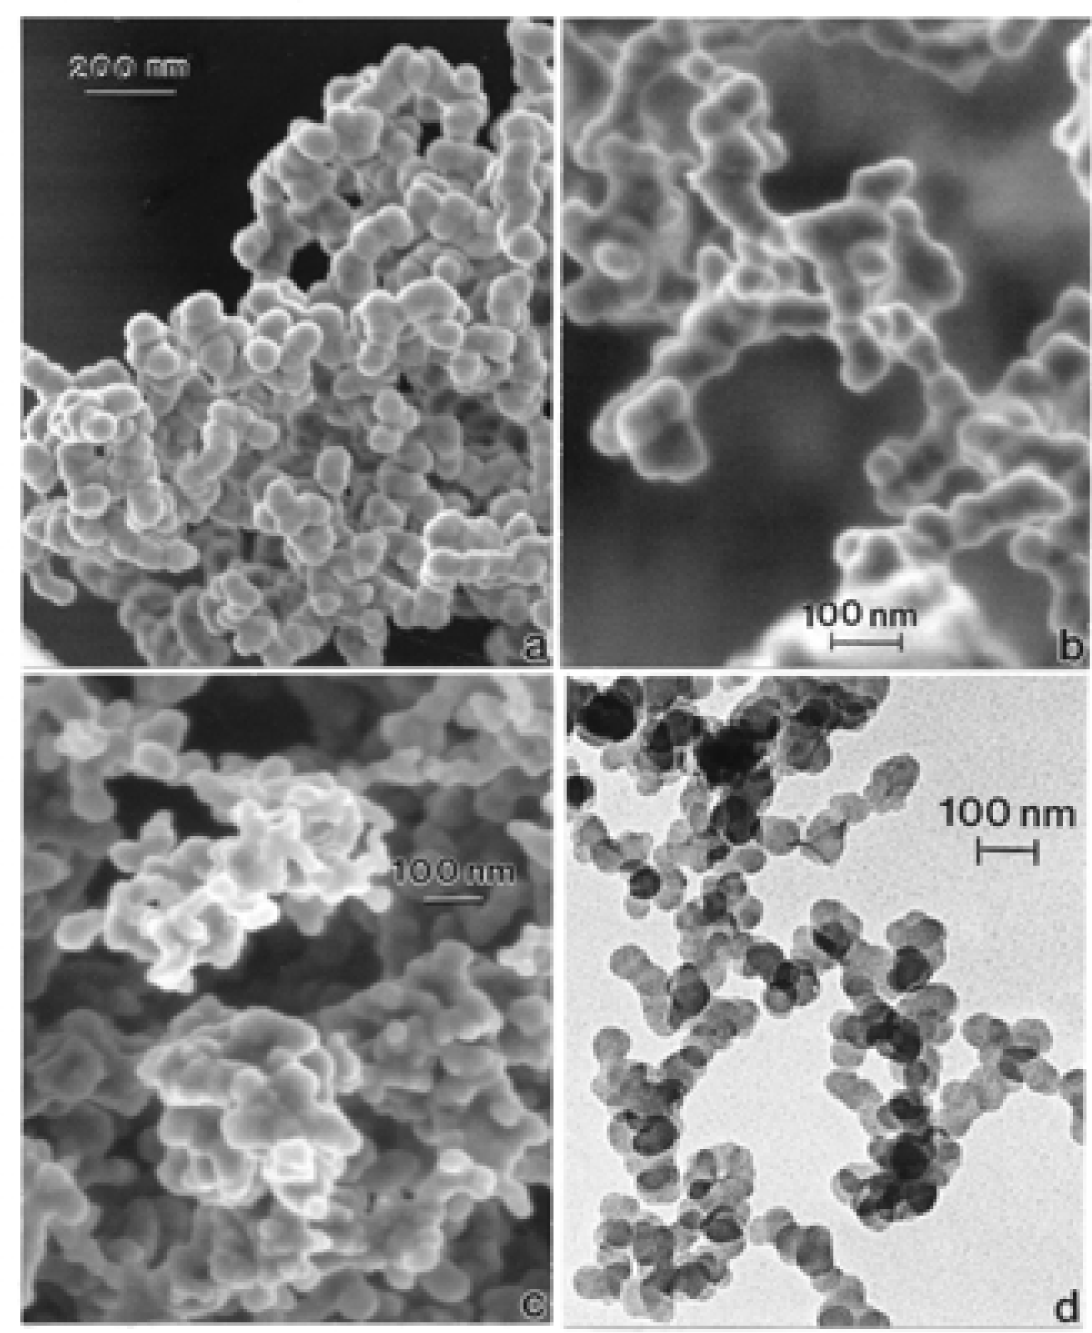
Figure 17:.
Soot formation (primary PM). (a) Clustering of curved graphene fragments (by the addition of at least 1, 5-member ring/pentagon) and intermixing of fullerenes such as C60, and intercalation of PAH isomers (such as naphthalene (C10H8)) to create carbonaceous, primary spherules as shown in the wire model in (b). (c) shows clustering of primary spherules as in (b) to form complex, branched aggregates of BC observed in the TEM. The SAED pattern in (c) shows prominent graphite reflections.
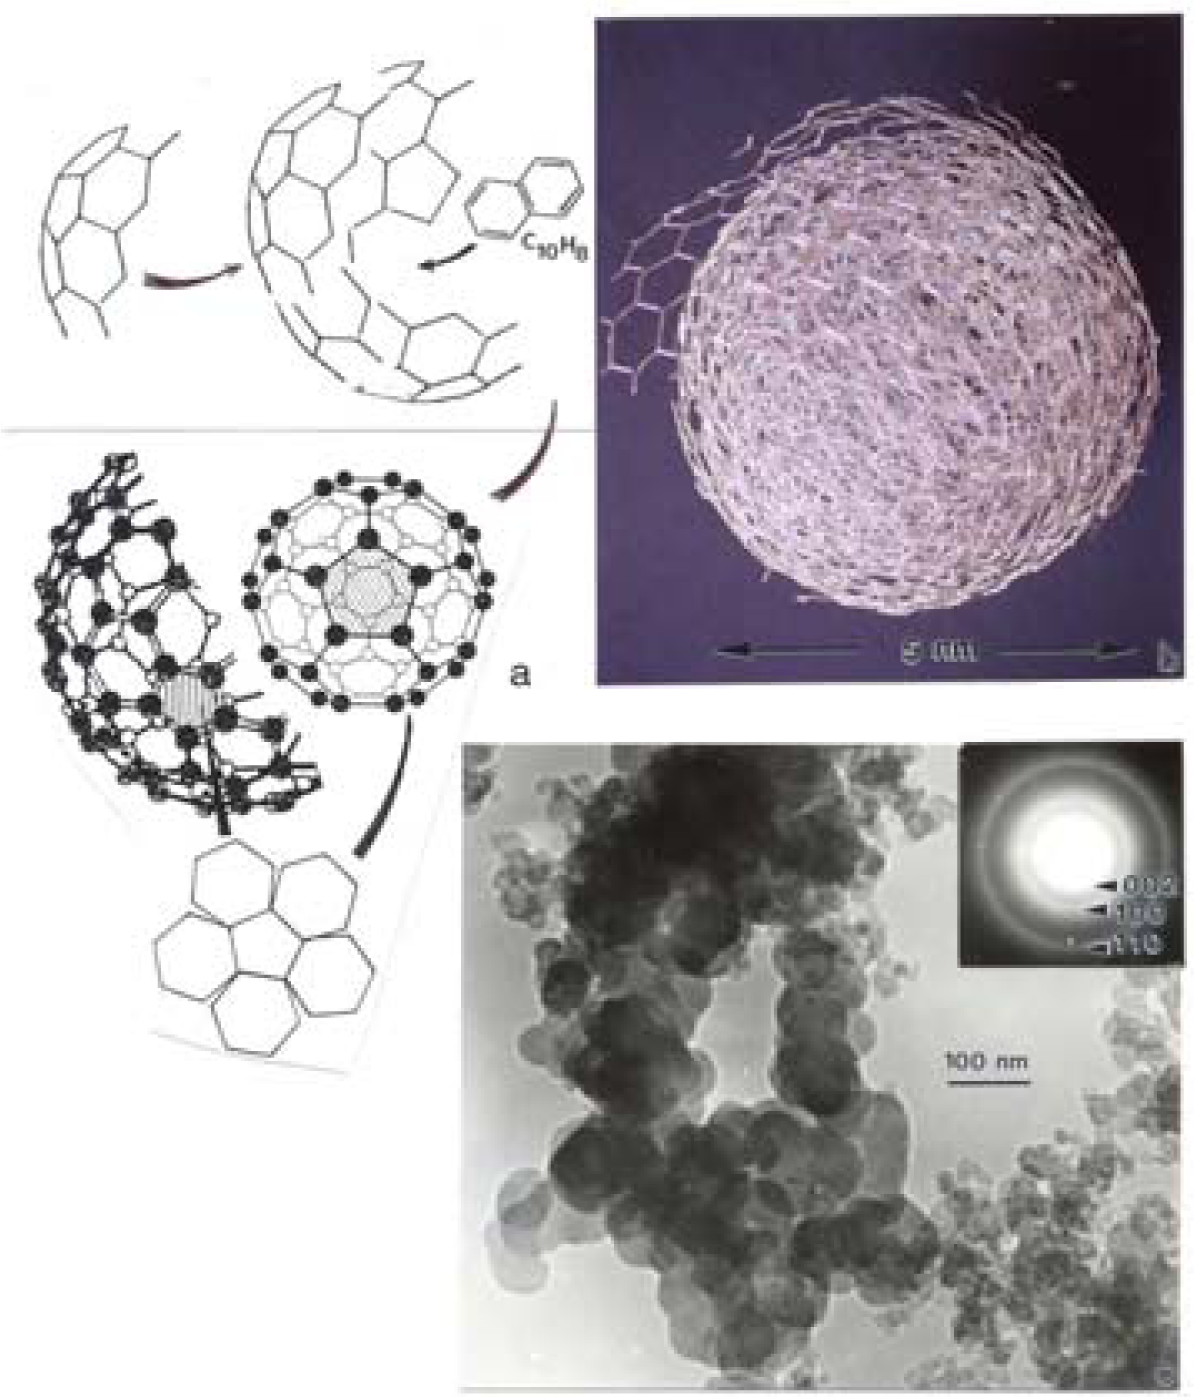
Figure 18:.
Large, fractal-like, branched aggregates of BC created by carbon arc evaporation and observed in the TEM. SAED pattern insert show diffuse graphite reflections.
Figure 18:.
Large, fractal-like, branched aggregates of BC created by carbon arc evaporation and observed in the TEM. SAED pattern insert show diffuse graphite reflections.
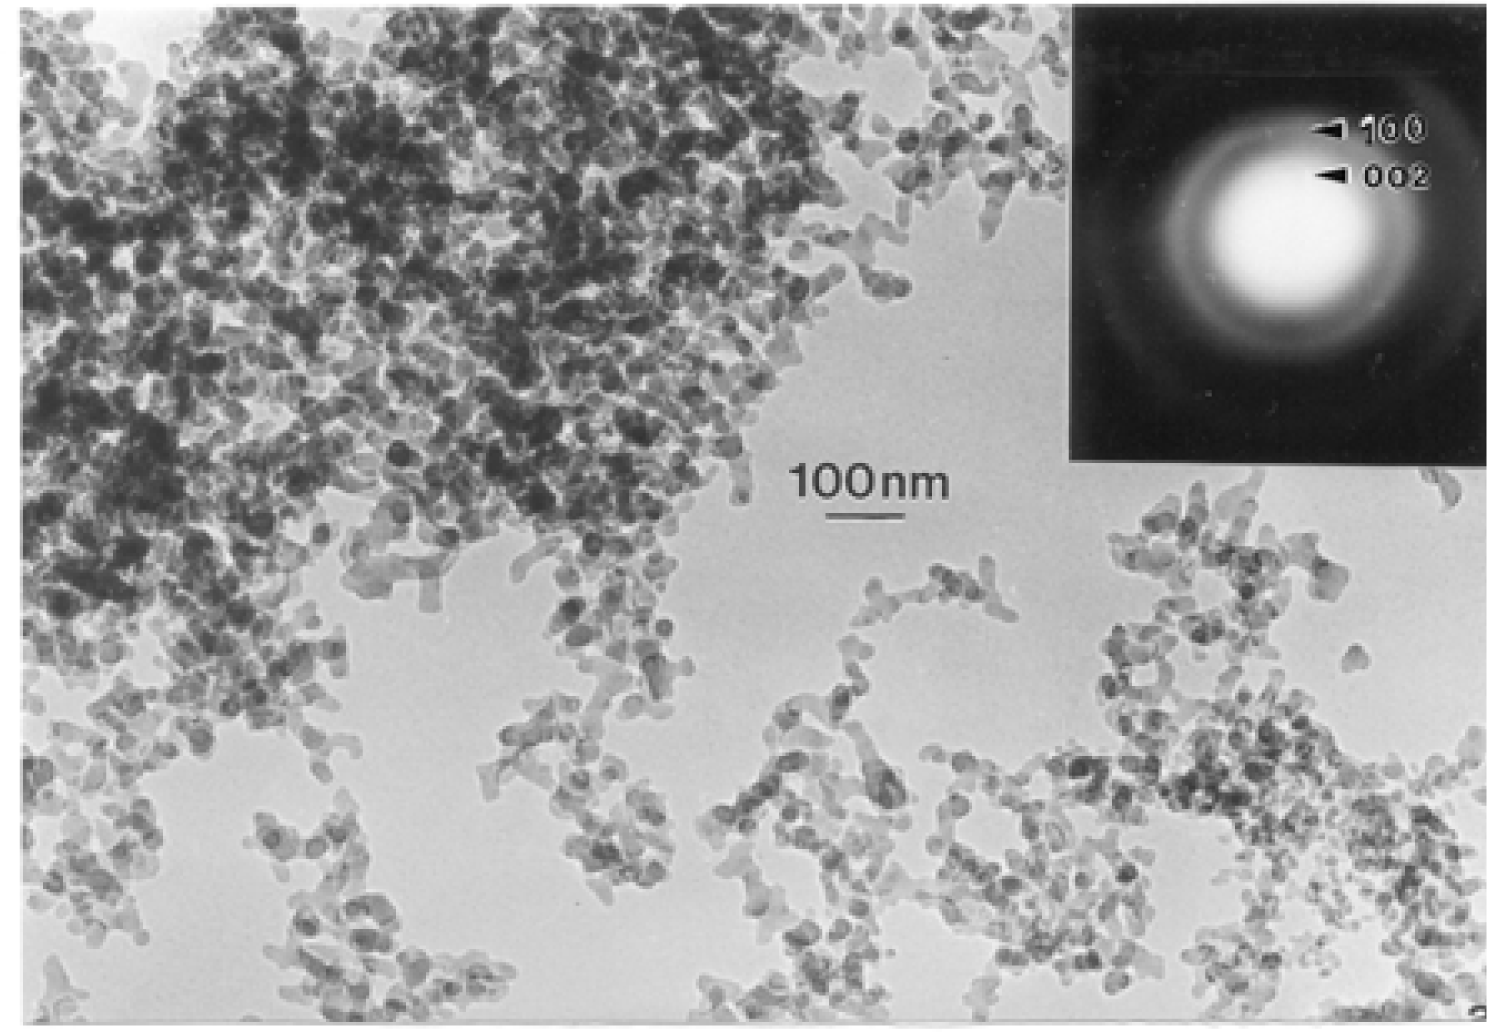
Figure 19:.
Examples of reaction sequences for ROS production. (a) Photolysis of benzene oxide, (b) toluene hydroxylation, (c) benzene oxidation producing quinone, (d) photooxidation of naphthalene to produce napththoquinone, (e) possible oxidation of graphene fragment.
Figure 19:.
Examples of reaction sequences for ROS production. (a) Photolysis of benzene oxide, (b) toluene hydroxylation, (c) benzene oxidation producing quinone, (d) photooxidation of naphthalene to produce napththoquinone, (e) possible oxidation of graphene fragment.
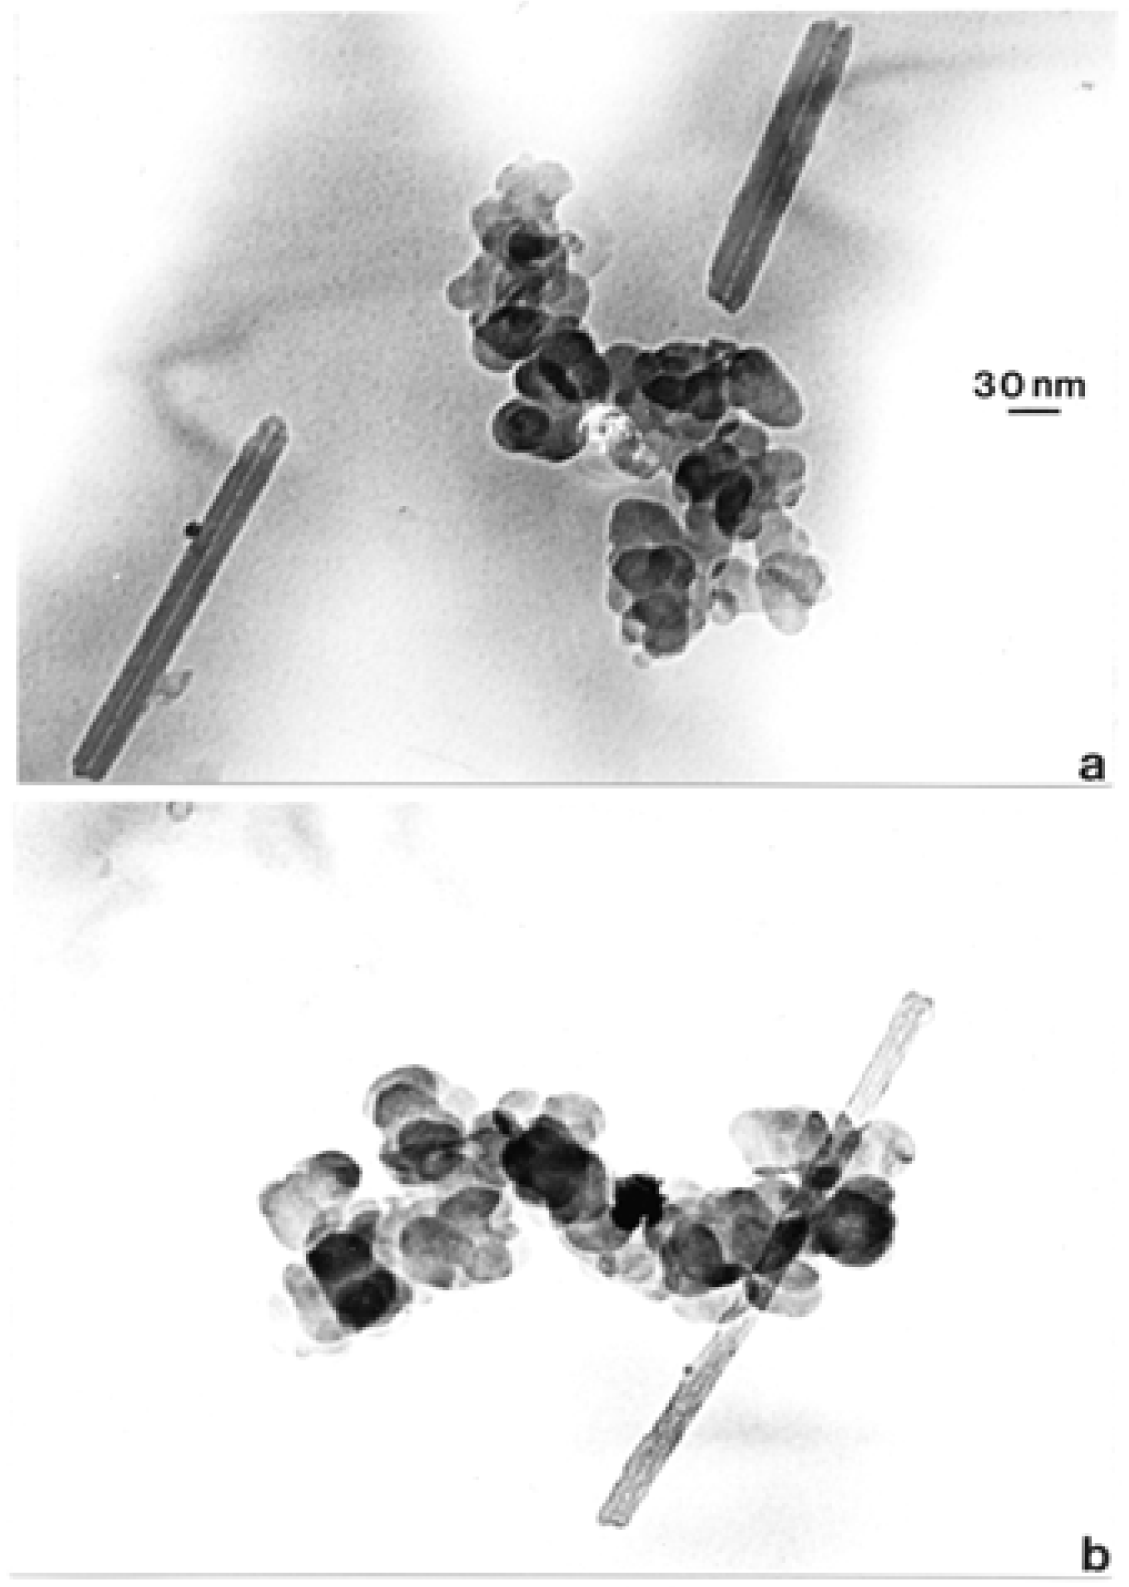
Figure 20:.
Examples of small soot PM aggregates and chrysotile asbestos nanofibers collected by thermal precipitation along an interstate highway in El Paso, TX, USA. (a) TEM image showing asbestos nanotubes and soot PM. (b) Apparent weathered asbestos fiber in contact with small soot PM aggregate observed in the TEM. The magnification for (a) and (b) is shown in (a).
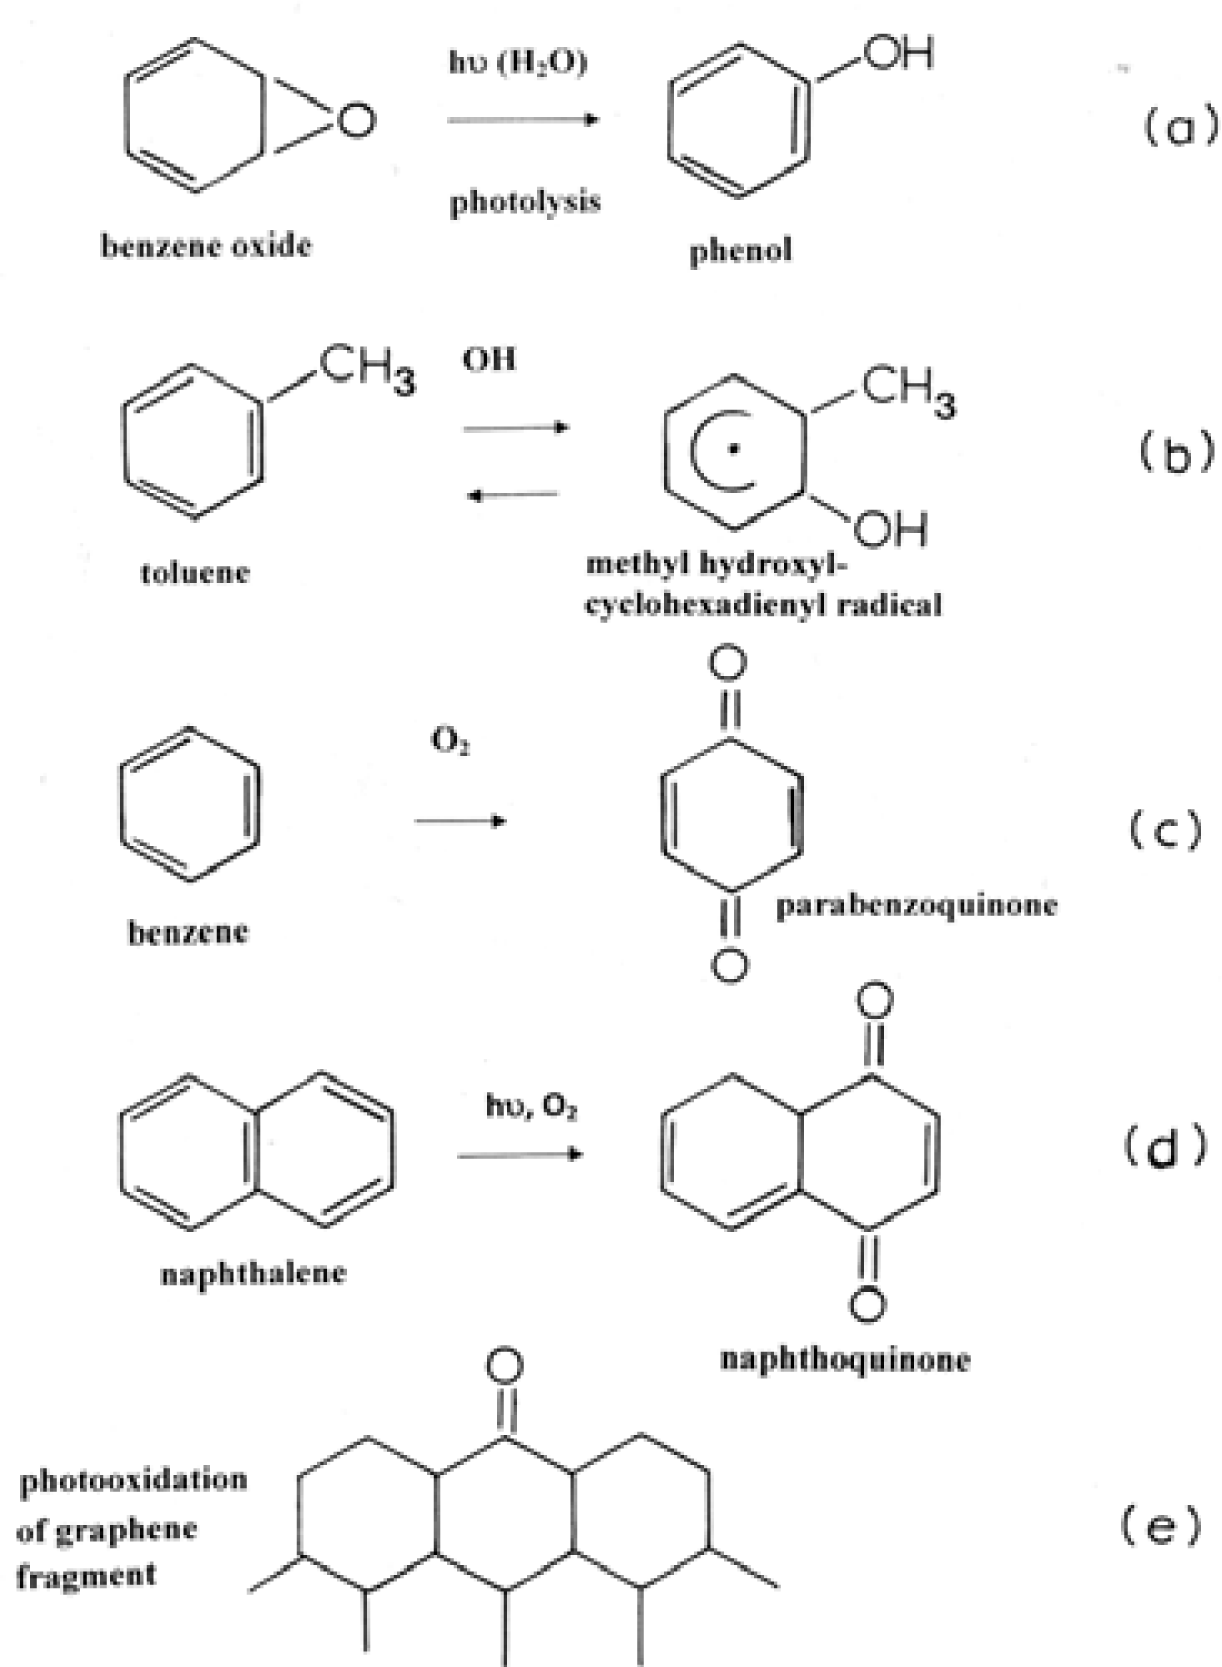
Figure 21:.
Comparison of cell (A549 human epithelial) death (percent) and relative ROS production for nano-PM aggregates. Arrow at left indicates media cell death reference at zero. From Garza, et al. [61].
Figure 21:.
Comparison of cell (A549 human epithelial) death (percent) and relative ROS production for nano-PM aggregates. Arrow at left indicates media cell death reference at zero. From Garza, et al. [61].

Table 1:.
PAH content of soot nano-PM and soot surrogate PM (ppm) (From Shi, et al. [37]).
| PAH | Structure | Formula | MW | TPM* | DPM | WPM | CPM | Blue Flame | Yellow Flame | BC | MW CNTR |
|---|---|---|---|---|---|---|---|---|---|---|---|
| Naphthalene |  | C10H8 | 128 | 4.6 | 1.6 | <0.1 | 6.3 | <0.3 | 2.9 | -- | 5.9 |
| Acenaphthylene |  | C12H10 | 152 | 13.0 | 4.7 | <0.1 | -- | <0.3 | <0.2 | -- | 4.0 |
| Acenaphthene |  | C12H10 | 154 | 0.7 | 5.3 | 0.1 | --- | <0.3 | <0.2 | -- | -- |
| Fluorene |  | C13H10 | 165 | 44.6 | 55.6 | 1.3 | --- | <0.3 | 0.4 | --- | 2.5 |
| Phenanthrene |  | C14H10 | 178 | 693.5 | 208.3 | 9.5 | --- | 3.8 | <0.1 | 1.5 | 1.4 |
| Anthracene |  | C14H10 | 178 | 195.5 | 245.9 | 11.5 | --- | --- | 3.2 | --- | 2.4 |
| Fluoranthene |  | C16H10 | 202 | 737.1 | 41.8 | 75.0 | --- | 10.4 | 1.7 | --- | <0.1 |
| Pyrene |  | C16H10 | 202 | 640.4 | 42.1 | 71.5 | --- | 74.7 | 113.6 | 2.4 | 1.0 |
| Benz(a)anthracene |  | C18H12 | 228 | 526.6 | 6.1 | 118.8 | --- | 11.7 | --- | --- | --- |
| Chrysene |  | C18H12 | 228 | 662.6 | 8.6 | 92.3 | --- | --- | --- | --- | --- |
| Benzo(b)fluoranthene |  | C20H12 | 252 | 297.7 | 6.8 | 50.5 | --- | --- | --- | --- | --- |
| Benzo(k)fluoranthene |  | C20H12 | 252 | 642.2 | 4.8 | 59.8 | --- | --- | --- | --- | --- |
| Benzo(a)pyrene |  | C20H12 | 252 | 218.8 | 1.9 | 60.2 | --- | --- | --- | --- | --- |
| Indeno(1,2,3-cd)pyrene |  | C22H12 | 276 | 117.8 | 9.9 | 16.9 | --- | --- | --- | --- | --- |
| Benzo(ghi)perylene |  | C22H12 | 276 | 111.5 | 11.8 | 15.3 | --- | --- | --- | --- | --- |
| Dibenz(ah)anthracene |  | C22H14 | 278 | --- | --- | 0.8 | --- | --- | --- | --- | --- |
*TPM, tire particulate matter; DPM, diesel particulate matter; WPM, wood particulate matter; CPM, candle particulate matter; Blue Flame, optimum natural gas combustion particulate matter; Yellow Flame, reduced oxygen combustion of natural gas-particulate matter; BC, commercial black carbon; MWCNT-R, arc evaporation produced (commercial) multiwall carbon nanotube aggregate material.
Table 2:.
PAH content in outdoor and indoor air PM2.5 in World cities and in El Paso, Texas (USA) soil.
| PAH | Formula | MW | PAH Content (% of Total) | |||||
|---|---|---|---|---|---|---|---|---|
| Seville[68] | Mumbai[69] | Chicago[70] | Chicago[70] | El Paso[71] | El Paso[72] | |||
| Outdoor | Outdoor | Outdoor | Indoor | Indoor | Soil | |||
| Naphthalene | C10H8 | 128 | 10 | 48 | 86 | 79 | 92 | 10 |
| Acenaphthylene | C12H10 | 152 | 9 | 21 | <1 | 1 | 1 | <1 |
| Acenaphthene | C12H10 | 154 | 5 | 10 | 2 | 7 | <1 | <1 |
| Fluorene | C13H10 | 165 | 6 | 3 | 4 | 6 | 1 | 1 |
| Phenanthrene | C14H10 | 178 | 31 | 7 | 3 | <6 | 3 | 6 |
| Anthracene | C14H10 | 178 | 4 | 2 | <1 | <1 | 3 | 2 |
| Fluoranthene | C16H10 | 202 | --- | --- | 1 | --- | --- | 22 |
| Pyrene | C16H10 | 202 | 34 | 9 | <1 | <1 | <1 | 18 |
| Benz(a)anthracene | C18H12 | 228 | --- | --- | <1 | --- | --- | 9 |
| Chrysene | C18H12 | 228 | --- | --- | <1 | --- | --- | 13 |
| Benzo(b)fluoranthene | C20H12 | 252 | --- | --- | <1 | --- | --- | 5 |
| Benzo(k)fluoranthene | C20H12 | 252 | --- | --- | <1 | --- | --- | 4 |
| Benzo(a)pyrene | C20H12 | 252 | --- | --- | <1 | --- | --- | 8 |
| Indeno(1,2,3-cd)pyrene | C22H12 | 276 | --- | --- | <1 | --- | --- | <1 |
Acknowledgments
This research was supported in part by Grant No. 5S11ES0113399-01/03 Al from the National Institute of Environmental Health Sciences (NIEHS) – NIH, the Southwest Consortium for Environmental Research and Policy (SCERP) and a Mr. & Mrs. MacIntosh Murchison Endowed Chair at The University of Texas at el Paso. The contents of this paper are solely the responsibility of the author and do not necessarily represent the official views of SCERP, NIEHS, or NIH. The contributions to this work by many colleagues and students, especially Drs. K. M. Garza and K. F. Soto, are gratefully appreciated and acknowledged; many names of colleagues and students are included in the references.
References
- Vidal, S. Critical review – Ambient particles and health: Lines that divide. J. Air Waste Manage. Assoc 1997, 47, 551–581. [Google Scholar]
- Pope, CA, III; Dockery, DW; Schwartz, J. Review of epidemiological evidence of health effects of particulate air pollution. Inhal. Toxicol 1995, 7, 1–18. [Google Scholar]
- Pope, CA, III; Dockery, DW. Health effects of fine particulate air pollution: Lines that connect. J. Air & Waste Manage. Assoc 2006, 56, 709–742. [Google Scholar]
- Burnett, RT; Smith-Doiron, M; Stieb, D; Cakmak, S; Brook, JR. Effects of particulate and gaseous air pollution on cardiorespiratory hospitalizations. Arch Environ. Health 1999, 54(2), 130–139. [Google Scholar]
- Peters, A; Liu, E; Verier, RL; Schwartz, J; Gold, DR; Mittleman, M; et al. Air pollution and incidence of cardiac arrhythmia. Epidemiology 2000, 11, 11–17. [Google Scholar]
- Pope, CA, III; Burnett, RT; Thurston, GD; Thun, MJ; Callo, EE; Krewski, D; et al. Cardiovascular mortality and long term exposure to particulate air pollution. Epidemiological evidence of general pathophysiological pathways of disease. Circulation 2004, 109, 71–77. [Google Scholar]
- Miller, KA; Siscovick, DS; Sheppard, L; Shepherd, K; Sullivan, JH; Anderson, GL; et al. Long-term exposure to air pollution and incidence of cardiovascular events in women. N. Engl. J. Med. 2007, 356(5), 447–458. [Google Scholar]
- Mossman, BT; Churg, A. Mechanisms in the pathogenesis of asbestosis and silicosis. Am. J. Respir. Crit. Care Med 1998, 157, 1666–1680. [Google Scholar]
- Trush, MA; Venster, TW. An overview of the relationship between oxidative stress and chemical carcinogenesis. Free Radical. Biol. Med 1991, 10, 201–210. [Google Scholar]
- Marnett, LJ. Oxyradicals and DNA damage. Carcinogenesis 2000, 21, 361–370. [Google Scholar]
- Lippman, M. Effects of fiber characteristics on lung deposition, retention and disease. Environ. Health Perspect 1990, 88, 311–317. [Google Scholar]
- Lippman, M. Biophysical factors affecting fiber toxicity. Warheit, DB, Ed.; In Fiber Toxicology; Academic press: San Diego, CA, 1993; pp. 259–303. [Google Scholar]
- Hill, IM; Beswick, PH; Donaldson, K. Differential release of superoxide onions by macrophages treated with long and short fibre amosite asbestos is a consequence of differential affinity for opsonin. Occup. Environ. Med 1995, 52, 92–95. [Google Scholar]
- Fubini, B. Use of physico-chemical and cell-free assay to evaluate the potential carcinogenesis of fibers. In Mechanisms of Fibre Carcinogenesis; Volume 140, IARC Scientific Publications: Lyon France, 1996; pp. 35–54. [Google Scholar]
- Everitt, JI. Mechanisms of fiber-induced diseases: implications for safety evaluation of synthetic vitreous fiber. Regul. Toxicol. Pharmacol. 1994, 20, 568–575. [Google Scholar]
- Brown, DM; Fisher, C; Donaldson, K. Free radical activity of synthetic vitreous fibers: iron chelation inhibits hydroxyl radical generation by refractory ceramic fiber. J. Toxicol. Environ. Health 1998, 53, 545–561. [Google Scholar]
- Liu, W; Ernst, JD; Broaddus, CVO. Phagocytosis of crocidolite asbestos induces oxidative stress, DNA damage, and apoptosis in mesothelial cells. Am. J. Respir. Cell. Mol. Biol 2000, 23, 371–378. [Google Scholar]
- Hansen, K; Mossman, BT. Generation of superoxide (O2–.) from alveolar macrophages exposed to asbestiform and nonfibrous particles. Cancer Res. 1987, 47(6), 1681–1686. [Google Scholar]
- Ziqiang, Q; Siegmann, HC; Keller, A; Matter, U; Scherrer, L; Siegmann, HC. Nanoparticle air pollution in major cities and its origin. Atmos. Environ 2000, 34, 443–451. [Google Scholar]
- Oberdörster, G. Pulmonary effects of inhaled ultrafine particles. Int. Arch. Occup. Environ. Health 2001, 74, 1–8. [Google Scholar]
- Donaldson, K; Stone, V; Clouter, A; Renwick, L; Mac Nee, W. Ultrafine particles. Occup. Environ. Med. 2001, 58, 211–216. [Google Scholar]
- Li, N; Sioutas, C; Cho, A; Schmitz, P; Misra, C; Sempf, J; Chag, M; Oberley, T; Froines, J; Nel, A. Ultrafine particulate pollutants induce oxidative stress and mitochondrial damage. Environ. Health Perspectives 2004, 111, 455–460. [Google Scholar]
- Oberdörster, G; Oberdörster, E; Oberdörster, J. Nanotoxicology: an emerging discipline evolving from studies of ultrafine particles. Environ. Health Perspectives 2005, 113, 823–839. [Google Scholar]
- Murr, LE; Soto, KF; Garza, KM; Guerrero, PA; Martinez, F; Esquivel, EV; Ramirez, DA; Shi, Y; Bang, JJ; Venzor, J, III. Combustion-generated nanoparticulates in the El Paso, TX, USA/Juarez, Mexico metroplex: Their comparative characterization and potential for adverse health effects. Int. J. Environ. Res. Public Health 2006, 3(1), 48–66. [Google Scholar]
- Gerhardt, P; Löffler, S; Homann, K-H. Polyhedral carbon ions in hydrocarbon flames. Chem. Phys. Lett 1987, 137, 306–309. [Google Scholar]
- Homann, K-H. Fullerenes and soot formation – New pathways to large particles in flames. Angew. Chem. Int. Ed. 1998, 37, 2434–2451. [Google Scholar]
- Murr, LE; Bang, JJ; Esquivel, EV; Guerrero, PA; Lopez, D. Carbon nanotubes, nanocrystal forms, and complex nanoparticle aggregates in common fuel-gas combustion sources and the ambient air. J. Nanoparticle Res. 2004, 6, 241–251. [Google Scholar]
- Murr, LE; Garza, KM; Soto, KF; Carrasco, A; Powell, TG; Ramirez, DA; Guerrero, PA; Lopez, DA; Venzor, J, III. Cytotoxicity assessment of some carbon nanotubes and related carbon nanoparticle aggregates and the implications for anthropogenic carbon nanotube aggregates in the environment. Int. J. Environ. Res. Public Health 2005, 2(1), 31–42. [Google Scholar]
- Soto, KF; Murr, LE; Garza, KM. Cytotoxic responses and potential respiratory health effects of carbon and carbonaceous nanoparticulates in the Paso del Norte airshed environment. Int. J. Environ Res. Public Health, 2008, 5(1). [Google Scholar]
- Arieta, DE; Ontiveras, CC; Li, W-W; Garcia, CH; Denison, MS. Aryl hydrocarbon receptor-mediated activity of particulate organic matter from the Paso del Norte airshed along the U.S.-Mexico border. Environ. Health Perspective 2003, 111(10), 1299–1305. [Google Scholar]
- Nikula, KJ; Snipes, MB; Barr, EB; Griffith, WC; Henderson, RF; Mauderly, JL. Comparative pulmonary toxicities and carcinogenicities of chronically inhaled diesel exhaust and black carbon in F344 rats. Fund. Appl. Toxicol. 1995, 25(1), 80–94. [Google Scholar]
- Jung, H; Guo, B; Anastasio, C; Kennedy, IM. Quantitative measurements of the generation of hydroxyl radicals by soot particles in a surrogate lung fluid. Atmos. Environ. 2006. [Google Scholar]
- Garza, KM; Soto, KF; Murr, LE. Cytotoxicity and reactive oxygen species generation from aggregated carbon and carbonaceous nanoparticulate materials. Int. J. Nanomedicine 2008, 3(1), 1–12. [Google Scholar]
- Manning, CB; Vallyathan, V; Mossman, BT. Diseases caused by asbestos: mechanisms of injury and disease development. Int. Immunopharmacol 2002, 2, 191–200. [Google Scholar]
- Murr, LE; Soto, KF. TEM comparison of chrysotile (asbestos) nanotubes and carbon nanotubes. J. Mater. Sci. Lett 2004, 39, 4941–4947. [Google Scholar]
- Hall, EJ. From chimney sweeps to oncogenes: the quest for the causes of cancer. Radiology 1991, 179, 297–306. [Google Scholar]
- Shi, Y; Murr, LE; Soto, KF; Lee, W-Y; Guerrero, PA; Ramirez, DA. Characterization and comparison of speciated atmospheric carbonaceous particulates and their polycyclic aromatic hydrocarbon contents in the context of the Paso del Norte airshed along the U.S.-Mexico border. Polycyclic Aromatic Compounds 2007, 27, 361–400. [Google Scholar]
- Bang, JJ; Trillo, EA; Murr, LE. Utilization of selected area electron diffraction (SAED) patterns for characterization of air submicron particulate matter collected by a thermophoretic precipitator. J. Air & Waste Managmt. Assoc. 2003, 53, 227–236. [Google Scholar]
- DeSouza Santos, P. Tecnologia de Argilas, vol. 1, Fundamentus; Editora Edgard Blücher Ltda: São Paulo, Brazil, 1975. [Google Scholar]
- Alleman, JE; Mossman, BT. Asbestos revisited. Sci. American 1997, 70–79. [Google Scholar]
- Soto, KF; Carrasco, A; Powell, TG; Garza, KM; Murr, LE. Comparative in-vitro cytotoxicity assessment of some manufactured nanoparticulate materials characterized by transmission electron microscopy. J. Nanoparticle Res. 2005, 7, 145–169. [Google Scholar]
- Lair, SL; Herndon, WC; Murr, LE; Quinones, SA. End cap nucleation of carbon nanotubes. Carbon 2006, 44, 447–455. [Google Scholar]
- Lair, SL; Herndon, WC; Murr, LE. Energetic trends of single-walled carbon nanotube ab initio calculations. J. Mater. Sci. 2007, 42, 1819–1827. [Google Scholar]
- Lair, SL; Herndon, WC; Murr, LE. Energetic comparison of double-walled carbon nanotube systems. Carbon 2008, in press.. [Google Scholar]
- Guo, T; Nikolaes, P; Rinzler, AG; Tomanek, D; Colbert, DT; Smalley, RE. Self-assembly of tubular fullerenes. J. Phys. Chem. 1995, 99, 10694–10697. [Google Scholar]
- Murr, LE; Soto, KF. A TEM study of soot, carbon nanotubes, and related fullerene nanopolyhedra in common fuel-gas combustion sources. Mater. Characterization 2005, 554, 50–61. [Google Scholar]
- Murr, LE; Soto, KF; Garza, KM. Health hazards of manufactured, natural environmental and anthropogenic atmospheric nanoparticulate materials: past, present and future, Chap. 1 in Biomaterials and Biomedical Engineering; Ahmed, W, Ali, N, Öchsner, Eds.; Trans Tech Publishers: Switzerland, 2008; pp. 1–54. [Google Scholar]
- Dresselhaus, MS; Dresselhaus, G; Eklund, PC. Science of Fullerenes and Carbon Nanotubes; Academic Press: New York, 1996. [Google Scholar]
- Murr, LE; Bang, JJ; Esquivel, EV; Guerrero, PA; Lopez, DA. Carbon nanotubes, nanocrystal forms, and complex nanoparticle aggregates in common fuel-gas combustion sources and ambient air. J. Nanoparticle Res 2004, 6, 241–251. [Google Scholar]
- Murr, LE; Guerrero, PA. Carbon nanotubes in wood soot. Atmos. Sci. Lett 2006, 7, 93–95. [Google Scholar]
- Esquivel, EV; Murr, LE. A TEM analysis of nanoparticulates in a Polar ice cave. Mater. Characterization 2004, 52, 15–25. [Google Scholar]
- Pratsinis, SE. Flame aerosol synthesis of ceramic powders. Prog. Energy Combust. Sci 1998, 24(1), 197–219. [Google Scholar]
- Woolridge, MS. Gas-phase combustion synthesis of particles. Prog. Energy Combust. Sci. 1998, 24(1), 63–87. [Google Scholar]
- Katrinak, KA; Rez, P; Perkes, PR; Buseck, PR. Fractal geometry of carbonaceous aggregates forms an urban aerosol. Environ. Sci. Technol 1993, 27, 539–547. [Google Scholar]
- Skillas, G; Konzel, S; Burtscher, H; Baltensperger, U; Siegman, K. High fractal-like dimension of diesel soot aggregates. J. Aerosol. Sci 1998, 29(4), 411–419. [Google Scholar]
- Grieco, WJ; Howard, JB; Rainey, LC; Vander Sande, JB. Fullerenic carbon in combustion-generated soot. Carbon 2000, 38, 597–614. [Google Scholar]
- Clague, ADH; Donnet, JB; Wang, TK; Peng, JCM. A comparison of diesel engine soot with carbon black. Carbon 1999, 37, 1553–1565. [Google Scholar]
- Vander Wal, RL; Tomasek, AJ. Soot nanostructure: dependence upon synthesis conditions. Combustion & Flame 2004, 136, 129–140. [Google Scholar]
- Li, Y-Y; Hsieh, C-C. synthesis of carbon nanotubes by combustion of a paraffin wax candle. Micro & Nano Lett 2007, 3, 63–66. [Google Scholar]
- Soto, KF; Garza, KM; Shi, Y; Murr, LE. Direct contact cytotoxicity assays for filter-collected, carbonaceous (soot) nanoparticulate material and observations of lung cell response. Atmos. Environ. 2008, 42, 1970–1982. [Google Scholar]
- Garza, KM; Soto, KF; Murr, LE. Cytotoxicity and reactive oxygen species generation from aggregated carbon and carbonaceous nanoparticulate materials. Int. J. Nanomedicine 2008, 3(1), 1–12. [Google Scholar]
- Herndon, WC. Quantum theory of aromatic hydrocarbon carcinogenesis. Int. J. Quantum Chem. Quantum Biology Supplement No. 1.. 1974, 123–134. [Google Scholar]
- Herndon, WC; Chen, H-T; Zhang, Y; Rum, G. QSAR study of PAH carcinogenicity activities: test of a general model for molecular similarity analysis in. In Molecular Modeling and Prediction of Bioactivity; Gunderfotte, Jorgensen, Eds.; Kluwer Academic Press: New York, 2000. [Google Scholar]
- Nel, A; Xia, T; Mädler, L; Ning, L. Toxic potential of materials at the nanolevel. Science 2006, 311, 622–627. [Google Scholar]
- Millette, JR; Boltin, R; Few, P; Turner, W, Jr. Microscopical studies of World Trade Center disaster dust particles. Microscopy Today 2003, 32–36. [Google Scholar]
- Dahl, A; Gharibi, A; Swietlicki, E; Gudmondsson, A; Bohgard, M; Ljungman, A; Blomquist, G; Gustafsson, M. Traffic-related emissions of ultrafine particles from pavement-tire interface. Atmos. Environ. 2006. [Google Scholar]
- Veranth, JM; Moss, TA; Chow, JC; Labban, R; Nichols, WK; Walton, JC; Watson, JG; Yost, GS. Correlation of in-vitro cytokine responses with the chemical composition of soil-derived particulate matter. Environ. Health Perspect. 2006, 114(3), 341–349. [Google Scholar]
- Gutierrez-Daban, A; Fernandez-Espinosa, AJ; Ternero-Rodriguez, M; Fernandez- Alveraz, I. Particle size distribution of polycyclic aromatic hydrocarbons in urban air in Southern Spain. Analyt. Bioanal. Chem 2005, 381, 721–736. [Google Scholar]
- Pandit, GG; Srivastava, PK; Mahan Rao, AM. Aromatic hydrocarbon arising from kerosene cooking fuel. Sci. Total Environ 2001, 279, 159–165. [Google Scholar]
- Van Winkle, MR; Scheff, PA. Volatile organic compounds, polycyclic aromatic hydrocarbons, and elements in the air of ten urban homes. Indoor Air 2001, 11, 49–64. [Google Scholar]
- Mora, J; Gamez, J; Astorga-Bustillo, F; et al. Speciation of indoor air pollutants and associated inhalation health hazards caused by cooking and heating in Hispanic households. Report to Southwest Consortium for Environmental Research and Policy (SCERP). June 2006. [Google Scholar]
- DeLa Torre-Roche, RJ; Lee, W-Y; Campos-diaz, SI. Soil-borne polycyclic aromatic hydrocarbons in El Paso, Texas: Analysis of a potential problem in the United States/Mexico border region. J of Hazardous Materials 2008, (in press).. [Google Scholar]
- Khalili, NR; Scheff, PA; Holsen, TM. PAH source fingerprints for cake ovens, diesel and gasoline engines, highway tunnels, and wood combustion emissions. Atmos. Environ. 1995, 29, 532–542. [Google Scholar]
- Levendis, YA; Atal, A; Carlson, J; Durayevskiy, Y; Vouros, P. Comparative study on combustion and emissions of waste tire crumb and pulverized coal. Environ. Sci. Technol. 1996, 30, 2742–2754. [Google Scholar]
- Poland, CA; Duffin, R; Kinloch, I; Maynard, A; Wallace, WA; Seaton, A; Stone, V; Brown, S; MacNee, W; Donaldson, K. Carbon nanotubes introduced into the abdominal cavity of mice show asbestos-like pathogenicity in a pilot study. Nature Nanotechnol 2008, 111, 1–6. [Google Scholar]
© 2008 MDPI All rights reserved.
Share and Cite
MDPI and ACS Style
Murr, L.E. Microstructures and Nanostructures for Environmental Carbon Nanotubes and Nanoparticulate Soots. Int. J. Environ. Res. Public Health 2008, 5, 321-336. https://doi.org/10.3390/ijerph5050321
AMA Style
Murr LE. Microstructures and Nanostructures for Environmental Carbon Nanotubes and Nanoparticulate Soots. International Journal of Environmental Research and Public Health. 2008; 5(5):321-336. https://doi.org/10.3390/ijerph5050321
Chicago/Turabian StyleMurr, L. E. 2008. "Microstructures and Nanostructures for Environmental Carbon Nanotubes and Nanoparticulate Soots" International Journal of Environmental Research and Public Health 5, no. 5: 321-336. https://doi.org/10.3390/ijerph5050321