Article

Bisphenol S Adsorption Behavior on Ferralsol and Biochar Modified Soil with Dissolved Organic Matter

1
College of Environmental Science and Engineering, Nankai University, 38 Tongyan Road, Tianjin 300350, China
2
Analytical and Testing Center, Southwest University of Science and Technology, Mianyang 621010, China
*
Authors to whom correspondence should be addressed.
Int. J. Environ. Res. Public Health 2019, 16(5), 764; https://doi.org/10.3390/ijerph16050764
Submission received: 9 January 2019 / Revised: 25 February 2019 / Accepted: 26 February 2019 / Published: 3 March 2019
(This article belongs to the Collection Soil Pollution and Remediation)

Abstract

:
Bisphenol S (BPs) has been found in a variety of common consumer products surrounding human living, despite the fact that it could damage the human digestive system and genital system. In China, straw-returning to the field is a common soil improvement technology used to increase the concentration of dissolved organic matter (DOM), which plays an important role in the natural environment as a microreactor of contaminants. Additionally, the biochar obtained by the straw is an effective soil conditioner. DOM is a key influencing factor when biochar is employed as the conditioner of BPs contaminated soil. However, the BPs adsorption behavior on the Ferralsol affected by DOM and biochar is also unclear. Hence, DOM was prepared and the effect of DOM on the BPs adsorption behavior on soil and biochar modified soil was investigated. DOM was characterized by Elemental analysis, Fourier transforming infrared spectra (FT-IR), and three-dimensional excitation-emission matrix spectra (3D-EEM). The results of the adsorption experiments indicated that both biochar and DOM could improve the BPs adsorption capacity in Ferralsol, while DOM suppressed the BPs adsorption capacity of biochar modified soil, indicating that DOM and BPs could not be applied at the same time for BPs adsorption.

1. Introduction

In recent years, as straw-returning to the field has become a popular strategy in China, the concentration of dissolved organic matter (DOM) has increased in the soil environment, and many chemical reactions will have occurred between contaminants and DOM, including complexation, redox reactions, and photodegradation [1,2]. DOM, a more mobile and bioavailable fraction of organic matter in the soil environment, is commonly defined as the organic matter remaining in-solution through 0.45-μm filtration [3]. Moreover, DOM plays an important role in the natural environment as a microreactor of contaminants which could enhance the reactivity of contaminants by bringing them into close association with a very reactive intermediate, and its important influences on the environmental behavior of contaminants have been widely reported [4,5]. However, the constituents of DOM are extremely complicated, caused by various sources and surrounding environments, including non-humus (such as saccharide, amino acid, protein, lignin, and organic acid) and humus (such as humic acid, fulvic acid, and humin) [6,7]. The molecular characterization is still elusive, and interaction between DOM and environmental matrices is also poorly understood.
Bisphenol A (BPa), an important chemical intermediate, is primarily used in the production of epoxy resins and polycarbonate plastics [8,9]. However, a number of countries have banned the usage of products suspected of containing BPa [10]. Many pieces of literature indicate that bisphenol S (4, 4′-sulfonyldiphenol, BPs, shown in Figure S1) is extensively applied in the replacement of BPa [11,12,13]. Additionally, BPs has already been documented as a contaminant in a variety of food products sold in the United States [14]. Similarly to BPA, BPs has been used in epoxy glues and polymerization reactions [15]. Driven by increasing awareness and demand, large amounts of BPs are exposed to humans, and it has been detected in urine samples [16,17]. Once BPs enters the human system, it not only has similar hormone-mimicking characteristics to BPa, but also appears to be more resistant to environmental degradation than BPa [18]. In addition, Patricia et al. reported that the BPs induces meiotic effects in both sexes that, in males, may persist for several generations [19]. Compared to BPa, BPs is more heat- and light-resistant, and it is more resistant to environmental degradation and may possess higher environmental resistance [20]. With the widespread usage of BPs, it may discharge into the soil environment through sewage irrigation [14,16]. The extent of BPs adsorption in soil will depend on the ionic strength or pH of the adsorption solution, as these parameters affect both the BPs solubility and available adsorption sites [21,22]. Red acid soil (RAS, Ferralsol) is one of the common soil types in southern China, mainly distributed in the low hilly areas south of the Yangtze River, including Jiangxi Province and Hunan Province. The red acid soil in the area belongs to the ferrasol soil. This area, as a critical part of the economy and agriculture, plays a significant role in the development of China, and the major crop in the region is rice paddy, with an annual output of 50 million tons [23,24]. Moreover, the use of biochar has attracted wide attention as an alternative method of soil remediation. Biochar is produced through the pyrolysis of biomass under limited oxygen supply, and the main raw materials of biochar are agricultural wastes (wood, straw, or shell), municipal solid wastes (refuse, sludge), and other organic materials [25]. Biochar has a high adsorption capacity due to its high surface area, aperture structure, high stability, higher cation exchange capacity, and high amounts of surface functional groups [26]. When biochar is employed as the conditioner of BPs contaminated soil, DOM is a key influencing factor. However, a lot of research focuses on the BPs adsorption capacities of biochar or soil [20,27], and studies on the interaction between the DOM and BPs adsorption of the soil and biochar modified soil are still lacking.
The object of this work is to explore the BPs adsorption behavior in Ferralsol and biochar modified Ferralsol (B-soil) with the impact of dissolved organic matter (DOM). The biochar sample was homemade using the rice paddy straw as the feedstock. The DOM sample was obtained from the decay of the paddy straw in the soil for a certain time and then extracted. The adsorption parameters included BPs and DOM adsorption on the samples, and the effect of DOM on the BPs adsorption behavior, adsorption kinetics, and adsorption thermodynamics. The evolution of DOM compositions was characterized by three-dimensional fluorescence spectroscopy (3D-EEM), FT-IR, and Element analysis.

2. Materials and Methods

2.1. Sample Preparation and Reagent

2.1.1. Soil

The study area is mainly located in southern China, including Jiangxi Province and Hunan Province. The red acid soil (RAS) in the area belongs to the Ferralsol. The major crop in the region is rice paddy, with an annual output of 50 million tons. The soil sample was collected in the area (centered around 28°07′53.3″ N, 116°52′45.2″ E), with a surface area of 50 km2. The annual average temperature is about 17.6 °C, the annual average rainfall is about 1780 mm, and the average elevation is about 220 m. The bedrock type is sandstone. The soil sample was mixed. The sample was freeze-dried (FreeZone 6 Liter, Kansas City, MO, USA) for four days, and the sample was then sealed and stored in a glass bottle.

2.1.2. Biochar

The preparation of biochar was as follows. The raw material used in the experiments was paddy straw. The sample was washed with deionized water and air-dried. Subsequently, the straw sample was turned into biochar via a slow anaerobic pyrolysis method at 500 °C for 2 h, with a heating rate of 4 K/min under a continuous N2 flow (50 mL·min−1). After pyrolysis, the biochar sample was passed through a 1-mm mesh size sieve and washed with deionized water to remove the DOM of biochar [28].

2.1.3. B-soil

The B-soil sample was the biochar modified soil sample. According to the literature, a common amount of biochar added to soil is 4% [29,30]. Hence, 10 g of soil sample and 0.4 g of biochar sample were thoroughly mixed by mechanical stirring.

2.1.4. DOM

As rice paddy was the main agricultural crop in the region, the rice paddy straw was the raw material employed for returning to the field. Firstly, the paddy straw was dried in the air and ground into fine particles through a 0.5-mm mesh size sieve. In order to obtain the DOM samples, 100 g of dried soil sample and 10 g of paddy straw were sufficiently mixed. The mixture was divided into 10 pieces, and each piece was added into the 250 mL conical flask with 4.8 mL deionized water. During the degradation, the temperature was controlled under 298 K and the water content was 40%, with regular water replenishment. Lastly, after the set time (0, 1, 5, 15, 30, 60, 90, 120 day), 100 mL deionized water was injected into the flask with vibrating for 2 h, and the filtrate was then filtered through the 0.45-μm membrane filter and freeze-dried until further use.

2.1.5. Reagents

The water used in all the experiments was deionized water (18.25 MΩ·cm). Bisphenol S (BPs, Heowns Chemical Factory, Tianjin, China) was used in this study.

2.2. Physicochemical Analyses

C/H/N/O/Ash: The elemental carbon, hydrogen, and nitrogen contents of the soil, biochar, and DOM samples were measured by the Euro EA3000 Elemental Analyzer (Leeman, Hudson, NH, USA). The ash contents of the samples were tested by high-temperature roasting at 1073 K for 3 h under continuous air flow. The elemental O content was estimated by the mass difference (100%-C, H, N and ash %) [31]. The contents of C/H/N and ash compositions were reported using the average data executed in duplicate.
SA: For the surface areas (SA) analysis, the samples were determined by the ChemiSorb 2720 Analyzer (Micromeritics Instrument, Norcross, GA, USA) with N2 adsorption at 77 K. In addition, before N2 adsorption, the samples were outgassed at 105 °C for 16 h. The multipoint BET method was used for the surface area analysis [32].
CEC: For the cation exchange capacity (CEC), the saturating exchange sites of 1.0 g samples were determined with 40 mL of 1 mol·L−1 CH3COONH4 solution at pH 7, before then replacing the adsorbed NH4+ twice with 2 mol·L−1 KCl [33]. In between this step, the sample was washed by dimethylcarbinol. The mixture was shaken overnight prior to analysis. The NH4+ in KCl solution was tested using an ion chromatograph (ICS-5000, Dionex, Sunnyvale, CA, USA).
FT-IR: The FT-IR spectra were collected by the Spectrum One FT-IR spectrometer in the range of 4000–400 cm−1, with an average of 32 scans at resolution of 2 cm−1 (PerkinElmer, Waltham, MA, USA). The biochar sample and the KBr were mixed with the mass fraction of 1/10.
3D-EEM: The parameters for the 3D-EEM spectra obtained by the fluorescence spectrophotometer (FLS 920P) were as follows: PMT voltage was 700 V, excitation light was a 150 W xenon arc lamp, signal to noise ratio > 110, excitation wavelength range (Ex) was 200–550 nm, emission wavelength range (Em) was 250–6000 nm, the wavelength increment was set at 5 nm, and the scan speed was 2400 nm·min−1. DOM was diluted with deionized water until the TOC concentration was adjusted to 5 mg·L−1, and the deionized water was set as the blank control. The intensity of each area represents the relative DOM content, analyzing the change of components combined with fluorescence regional integration (FRI) [3,34]. The method could reduce the calculation time using the raw matrix without advanced mathematical effort. Volumes of Fluorescence (F) were calculated by the corrected matrix, following the integration method within each region (i):
Φ i = M F ( i ) I ( λ e x λ e m ) d λ e x d λ e m
where MF(i) was the multiplication factor, d λ e x was the excitation wavelength interval, d λ e m was the emission wavelength interval, and I ( λ e x λ e m ) was the fluorescence intensity at each excitation-emission pair (Raman units).

2.3. Adsorption Experiments

The details of the batch experiments for the adsorption were as follows. All the adsorption experiments were executed using an air thermostatic shaker (HNYC-2102C, Honour Instrument, Tianjin), including the factors of DOM with different degrees of decay, contact times, initial BPs solution concentrations, and adsorption temperatures. (i) For the DOM and BPs adsorption, the appropriate solid DOM (120 days)/BPs, adsorbent (Soil/B-soil: 0.5000 g, Biochar: 0.0600 g), and 30.00 mL water were added into the 100 mL conical flask for 1440 min with a pH about 5.0–6.0. (ii) For the effect of DOM with different decay times, 30.00 mL 40.00 mg·L−1 BPs solution and adsorbent (Soil/B-soil: 0.5000 g, Biochar: 0.0600 g) were injected into the 100 mL conical flask for 1440 min with a pH of about 5.0–6.0. (iii) The adsorption kinetics was determined by analyzing the adsorption capacity at different time intervals (5–1440 min) with the same adsorbent dosage and initial BPs concentration in a 100 mL conical flask in which the pH was about 5.0–6.0. For adsorption isotherms, the different concentrations of BPs solution (20.00–80.00 mg·L−1, 20.00 mg·L−1 interval, 30.00 mL) were shook till the equilibrium achieved the same sorbent dosage in a 100 mL conical flask in which the pH was about 5.0–6.0. The temperature factor was investigated by determining the adsorption capacity at 298 K, 303 K, and 308 K. After injecting the DOM (120 days), the experiment repeated the above steps. Moreover, the DOM injected into the solution ensured that the DOC concentration was adjusted to 50.00 mg·L−1. In all the adsorption experiments, the mixtures were separated by a 0.45 μm filter membrane, and the BPs concentrations were measured at 258 nm with high-performance liquid chromatography (HPLC) equipped with a diode array detector (DAD).

2.4. Adsorption Kinetics Analysis

Two kinetic models were employed to investigate the mechanism of BPs adsorption on the biochar samples [35,36,37], including the pseudo-first-order kinetic model and the pseudo-second-order kinetic model.
The pseudo-first-order kinetic equation was as follows:
log ( q e q t ) = log q e k 1 t 2.303
where, k1 was the equilibrium rate constant of the pseudo-first-order kinetic model (min−1) representing a quicker adsorption, and qe and qt were the BPs adsorption amount (mg·g−1) at equilibrium t and any time t (min) per unit weight of the adsorbent, respectively.
The pseudo-second-order kinetic equation was as follows.
t q t = 1 k 2 q e 2 + t q e
where, k2 was the equilibrium rate constant of the pseudo-second-order kinetic model (g·mg−1·min−1), and qe and qt were the BPs adsorption amount (mg·g−1) at equilibrium t and any time t (min), respectively. k2 could be determined by plotting t/qt versus t according to the equation.
Meanwhile, the initial adsorption rate (h) equation was as follows:
h = k 2 q e 2

2.5. Adsorption Thermodynamics Analysis

Langmuir and Freundlich models were used to describe the adsorption process [35,36,37].
The Langmuir adsorption isotherm equation was as follows:
C e q e = 1 b q m + C e q m
where, Ce was the equilibrium concentration (mg·L−1), qe was the BPs equilibrium adsorption capacity of the adsorbent (mg·L−1), qm was the monolayer adsorption capacity of the adsorbent (mg·L−1), b was the Langmuir constant related to the affinity of the bending sites and energy of adsorption (L·mg−1), and qm and b were obtained from the slope and intercepts of the linear plots of Ce/qe versus Ce.
The Freundlich adsorption isotherm equation was as follows:
log q e = log K f + 1 n log C e
where, Kf and n were the Freundlich adsorption constants which indicated the adsorption capacity and intensity, respectively, and qe was the BPs equilibrium capacity of the adsorbent. The model was an empirical equation describing the adsorption onto a heterogeneous surface.

3. Results and Discussion

3.1. Characterization of the Sample

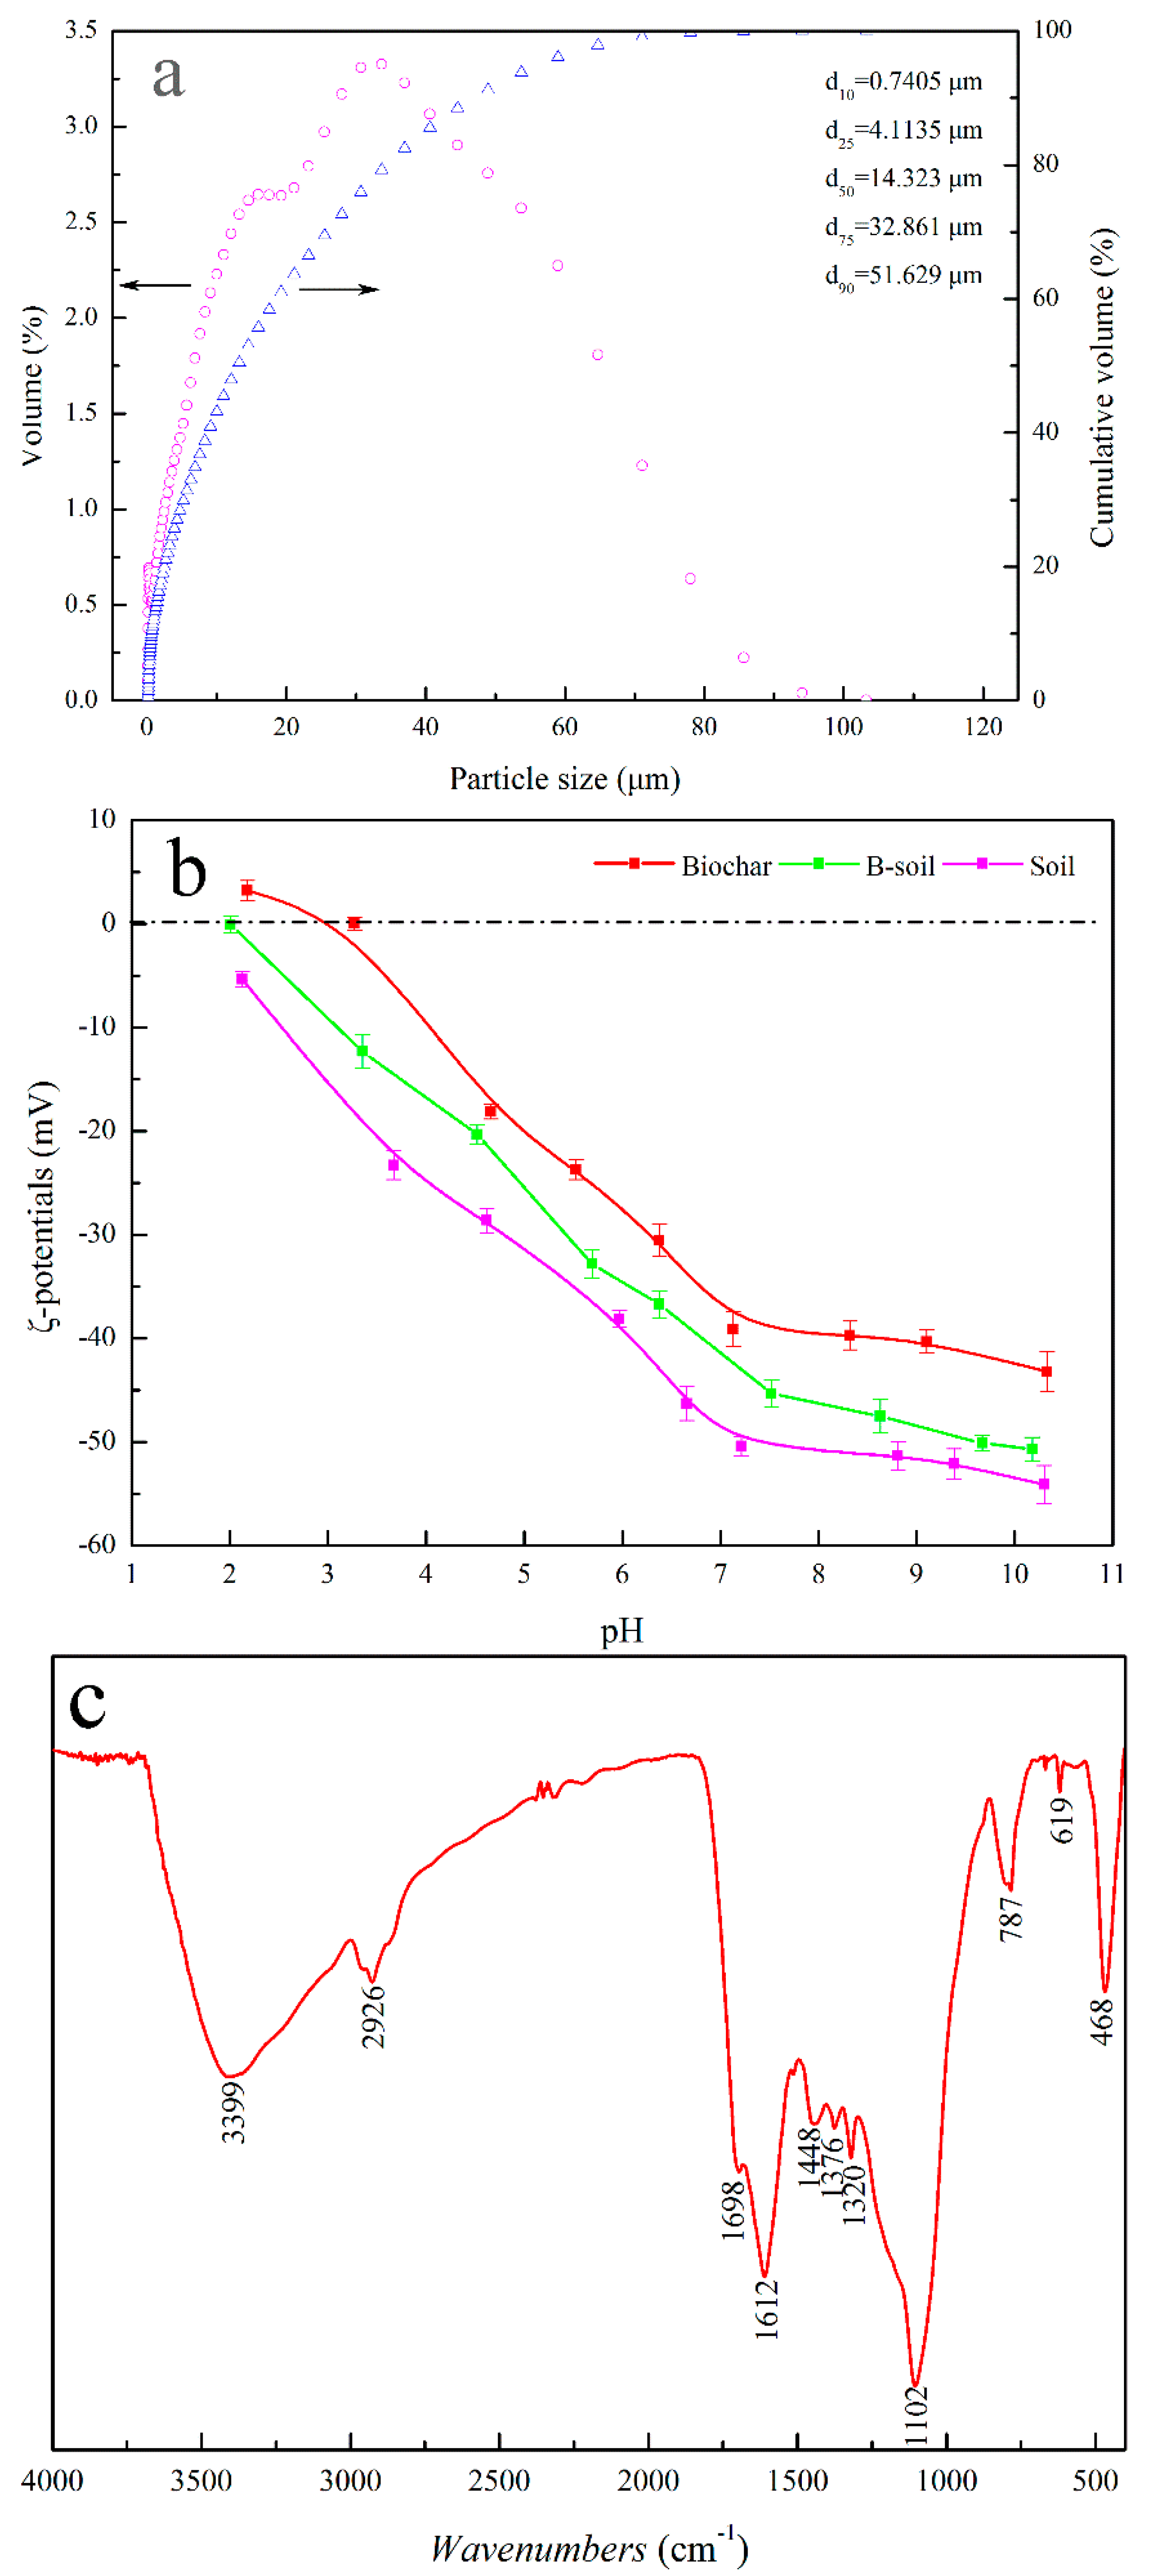
3.1.1. Characterizations of Biochar and Soil

The physicochemical properties of the biochar and soil are listed in Table S1. The biochar sample shows a relatively high elemental C concentration and low O/C ratio. The H and N contents are relatively low, and the pH value of the biochar sample is alkaline. The specific surface area of the biochar is 204 m2∙g−1, while the value of the soil sample is only 75 m2∙g−1. CEC is a measurement of the negative charge of the material surface, which could be neutralized by exchangeable cations [33,38]. The absolute CEC values of biochar, soil, and B-soil are 29.3, 35.7, and 30.2 cmol/kg, respectively. As shown in Figure 1a, the particle size distribution of the soil sample reflects that the soil sample has a broad size distribution, and the d50 is about 14.323 μm. Figure 1b shows the zeta-potentials of biochar, soil, and B-soil as a function of the pH value, indicating that the points of zero charges (PZCs) of biochar, soil, and B-soil are located at around pH 3.3, <2.0, and 2.0, respectively [25]. The surface functional groups of the biochar are investigated by FT-IR spectra and shown in Figure 1c. The adsorption band near 3400 cm−1 is attributed to the stretching vibration of -OH. The bands near 2925 and 2870 cm−1 could be attributed to the C-H stretching vibrations of the CH2 and -CH3 groups, respectively [25], and the bands near 1440 and 1370 cm−1 are a result of -CH2- scissoring vibrations [39]. The unresolved shoulder peaks at 1700 cm−1 and the peak at 1610 cm−1 represent the stretching vibration of ester carbonyl groups and the C=O stretching vibrations of amides, respectively [40,41]. The minor peak near 870 cm−1 can be attributed to the γ-CH of furan, and the peak near 780 cm−1 is related to the β-rings of pyridines [40,42]. The band near 1260 cm−1 is probably a result of the stretching vibrations of CO- in aromatic and -OH in phenolic compounds [21], and the bands indicative of C-O-C in aliphatic ethers and -OH in alcohols (1150–1060 cm−1) are consistent with the oxygenated functional groups [21,43].

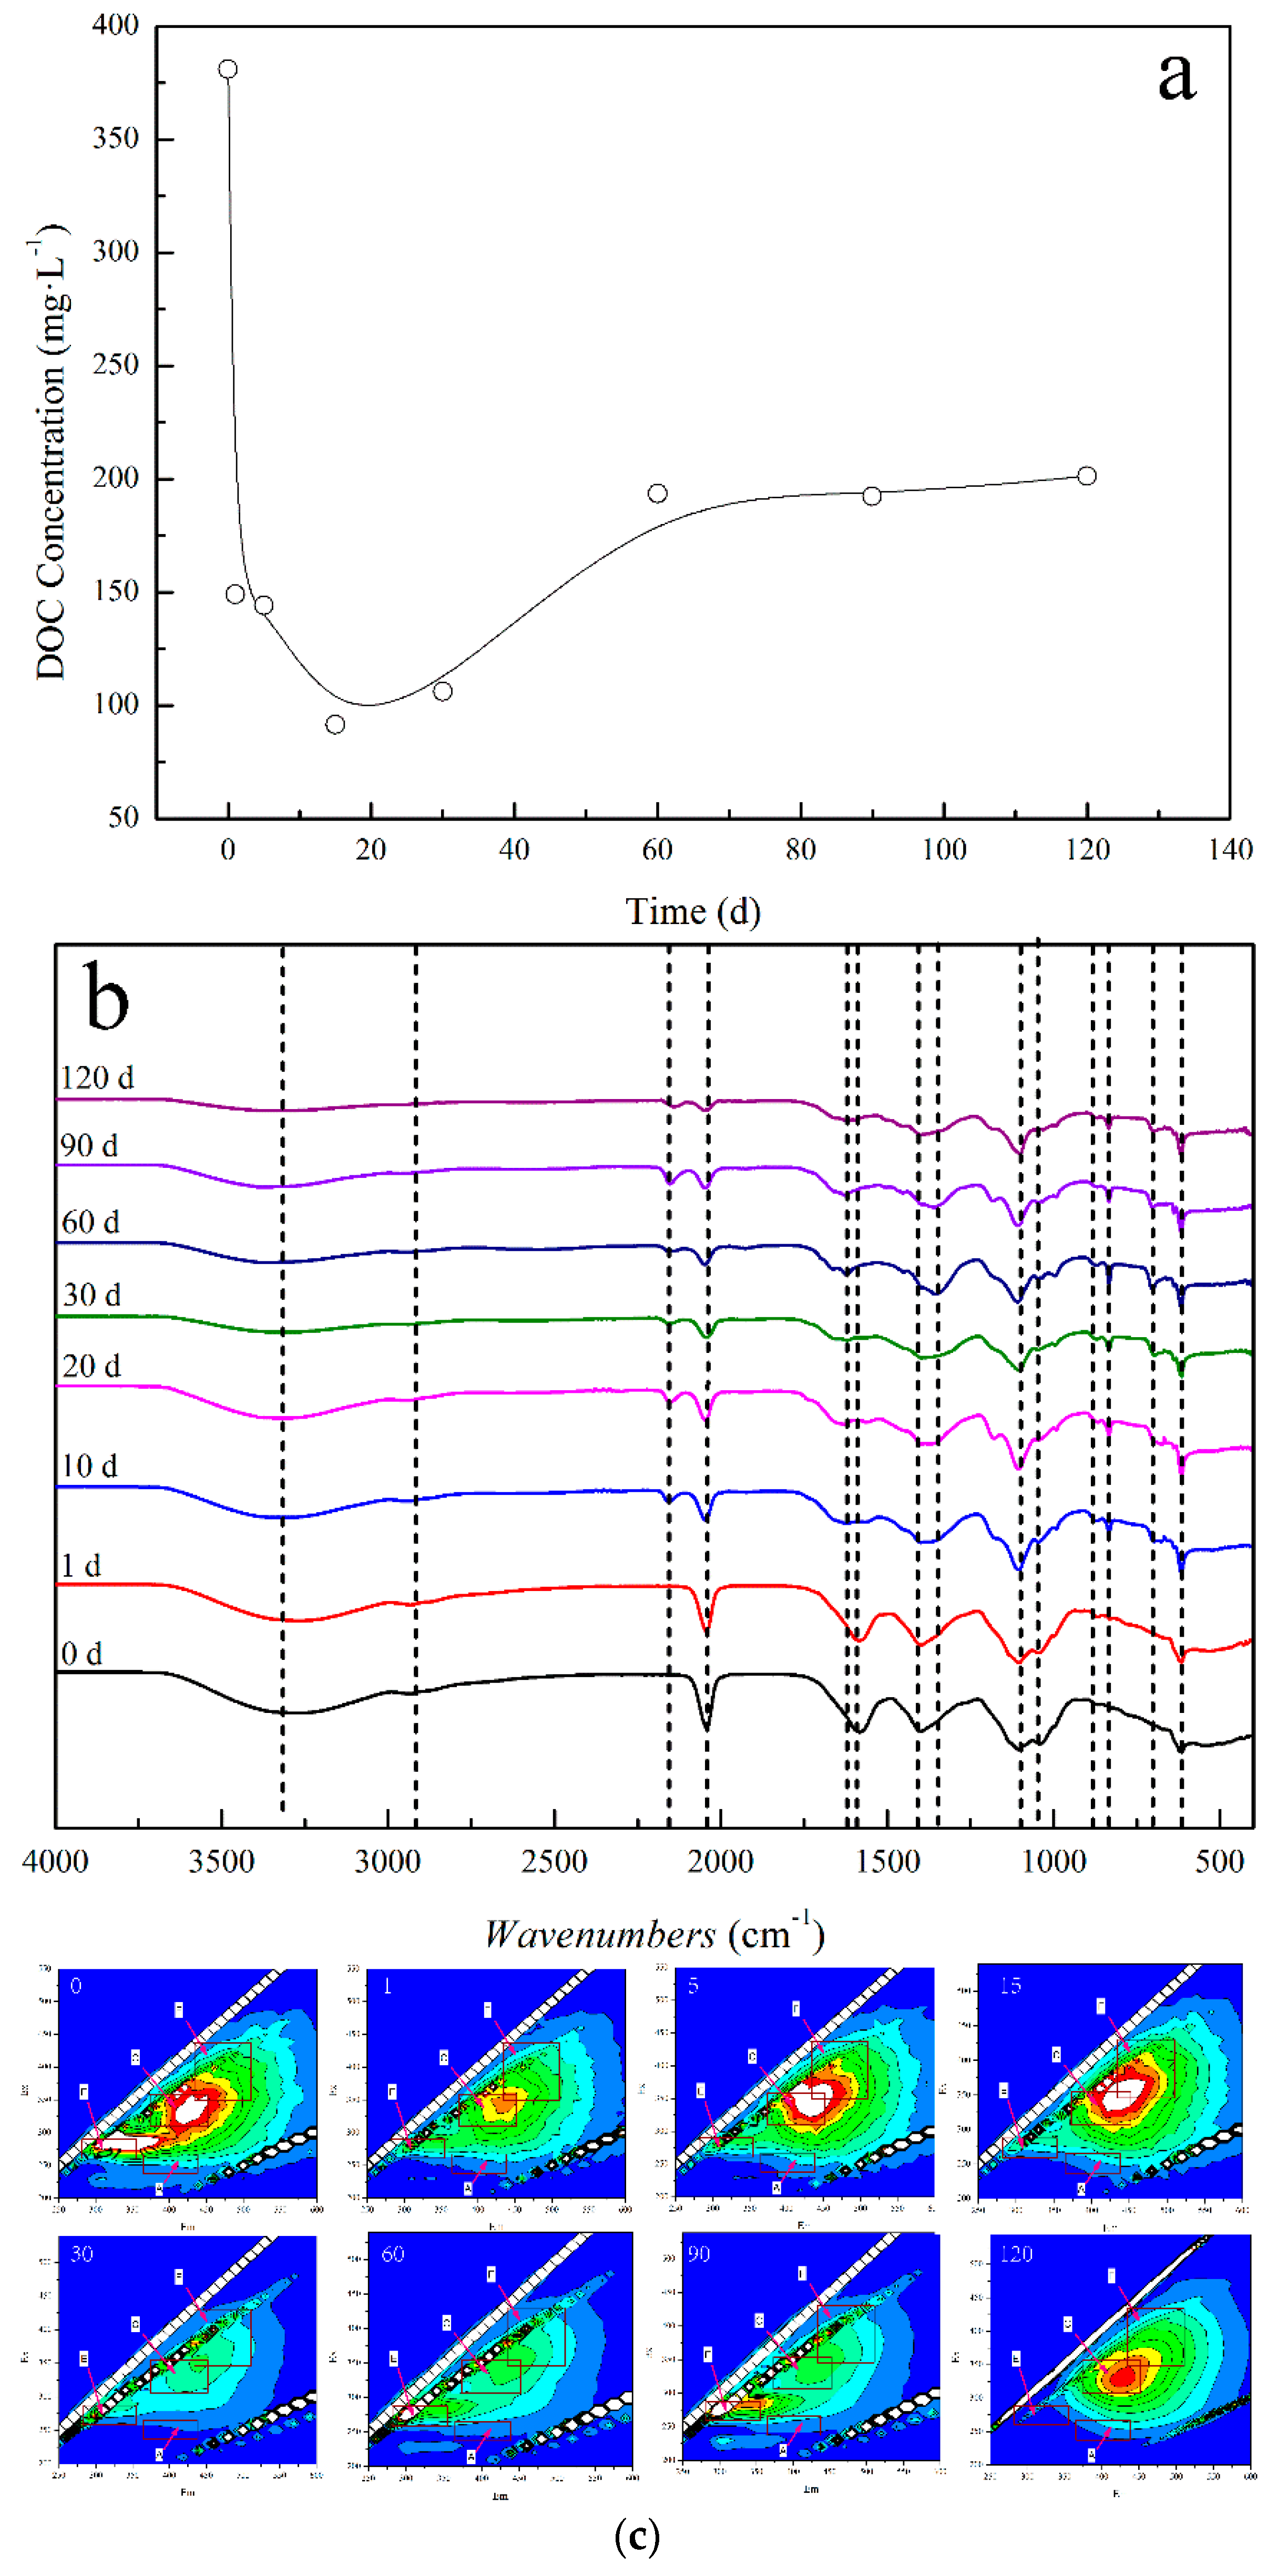
3.1.2. Characterization of DOM

The characterizations of the DOM sample are summarized in Figure 2. In order to investigate the change of the DOM concentration during the decay process, the dissolved organic carbon (DOC) is the common measurement index. As shown in Figure 2a, the concentration of DOM decreased before the first 20 days, then increased, and finally remained stable after 60 days. Moreover, the decrease in the DOM concentration was mainly caused by the utilization of small molecule compounds by microorganisms, while the increase in the concentration may be a result of the conversion of insoluble organic matter to DOM further decomposed by microorganisms. Finally, the utilization of the straw by the microorganisms led to saturation. Hence, the active components of the organic matter in DOM change dramatically during the straw decay process. To investigate the functional groups of DOM, the FT-IR results are shown in Figure 2b. The peak at 3320 cm−1 is attributed to the stretching vibration of -OH or -NH in amides. With the extension of the decay, the reduced intensity of this peak illuminates the decreased contents in the COOH, -OH, or -NH. The reduced peak intensities indicate that the aliphatic or cycloaliphatic organic acid are biodegradable, where appear near 2930 and 2870 cm−1, attributed to the C–H stretching vibrations of the CH2 and -CH3 group. Furthermore, the new band near 2150 cm−1 demonstrates new chemical bond formation after 10 days. The peak near 2040 cm−1 is a result of C≡C asymmetric stretching vibration, which could also be decomposed by the microorganisms. The peak at 1580 cm−1 shows the bending vibration of N-H and the stretching vibrations of C=C, C=O, and –COO- in lignin, while the peak shifts to 1640 cm−1 and the intensity reduces after 60 days, demonstrating the rapid decomposition of the carboxylic acid lipids or amino acids, or the low decomposition of the lignin. The protein peak near 1400 cm−1 shifts to 1350 cm−1, indicating the formation of amide compounds. The decreased intensity of the peak near 1035 cm−1 is probably a result of the decomposition of sugars. The peak near 615 cm−1 can be attributed to the C-H bending vibration of C≡C, and there is no obvious change [22,44]. The fluorescence spectroscopy is an effective method for revealing the change of organic components in DOM. Previous research [45] has shown that the classifications of fluorescent materials and fluorescence peaks in DOM are as follows: The Peak-A at Ex/Em = 240–270/370–440 nm, labeled the fulvic-like compound in the ultraviolet region, is characterized as the components derived from lignin and other degraded plant materials; the Peak-C at Ex/Em = 310–360/370–450 nm is attributed to the fulvic-like compound in the visible region; the Peak-E at Ex/Em = 350–440/430–510 nm is derived from the fluorescence of protein-like substances; and the Peak-F at Ex/Em = 260–290/300–350 nm is ascribed as fluorescence of humic acid-like substances. The 3D-EEM fluorescence spectra of DOM are illustrated in Figure 2c. Peak-A and Peak-F appeared in the initial DOM (0 day), and the other peaks were not outstanding, while Peak-A could be derived from the microorganism parasitized on straw or a trace amount of decomposed substances on the straw surface. With the extension of degradation, Peak-F gradually decreased and finally disappeared, and only Peak-C was left, indicating that the protein in the straw was decomposed by microorganisms and converted into the fulvic-like compounds. Moreover, the ratios of the DOM fluorescence intensity to the total in each area are listed in Table S2. As seen in Table S2, the ratios of Φpeak-A and Φpeak-C decreased and then increased with the extension of degradation, and the ratio of Φpeak-E fluctuated and the overall trend became smaller. The ratio of Φpeak-F increased firstly, then decreased quickly, and finally slowly increased. The change of DOM components was mainly caused by the decomposition of microorganisms, which eventually formed deeply decomposed organic matter [46].

3.2. Adsorption Results

3.2.1. DOM and BPs Adsorption

The BPs adsorption amounts on biochar, soil, and B-soil are shown in Figure 3a, which indicated that the BPs equilibrium adsorption amounts were about 11.36, 2.02, and 2.72 mg·g−1, respectively. The biochar had a large BPs adsorption amount and could improve the BPs adsorption capacity of the soil. The difference in the equilibrium adsorption amount was mainly due to the specific surface area, pore structure, or functional groups. In order to explore the DOM adsorption behavior on the samples, the results were presented as shown in Figure 3b. DOM adsorption amounts on biochar, soil, and B-soil exhibited a positive correlation with the initial DOM concentration and the amounts then eventually stabilized (about 4.51, 1.11, and 1.34 mg·g−1, respectively). Briefly, the BPs adsorption amounts of B-soil increased by 30% compared to soil, indicating that the biochar could improve the adsorption capacity of the soil. For DOM adsorption (Figure 3b), biochar also exhibited a better adsorption capacity than the soil. Both DOM and BPs could be adsorbed on the soil and biochar surface.

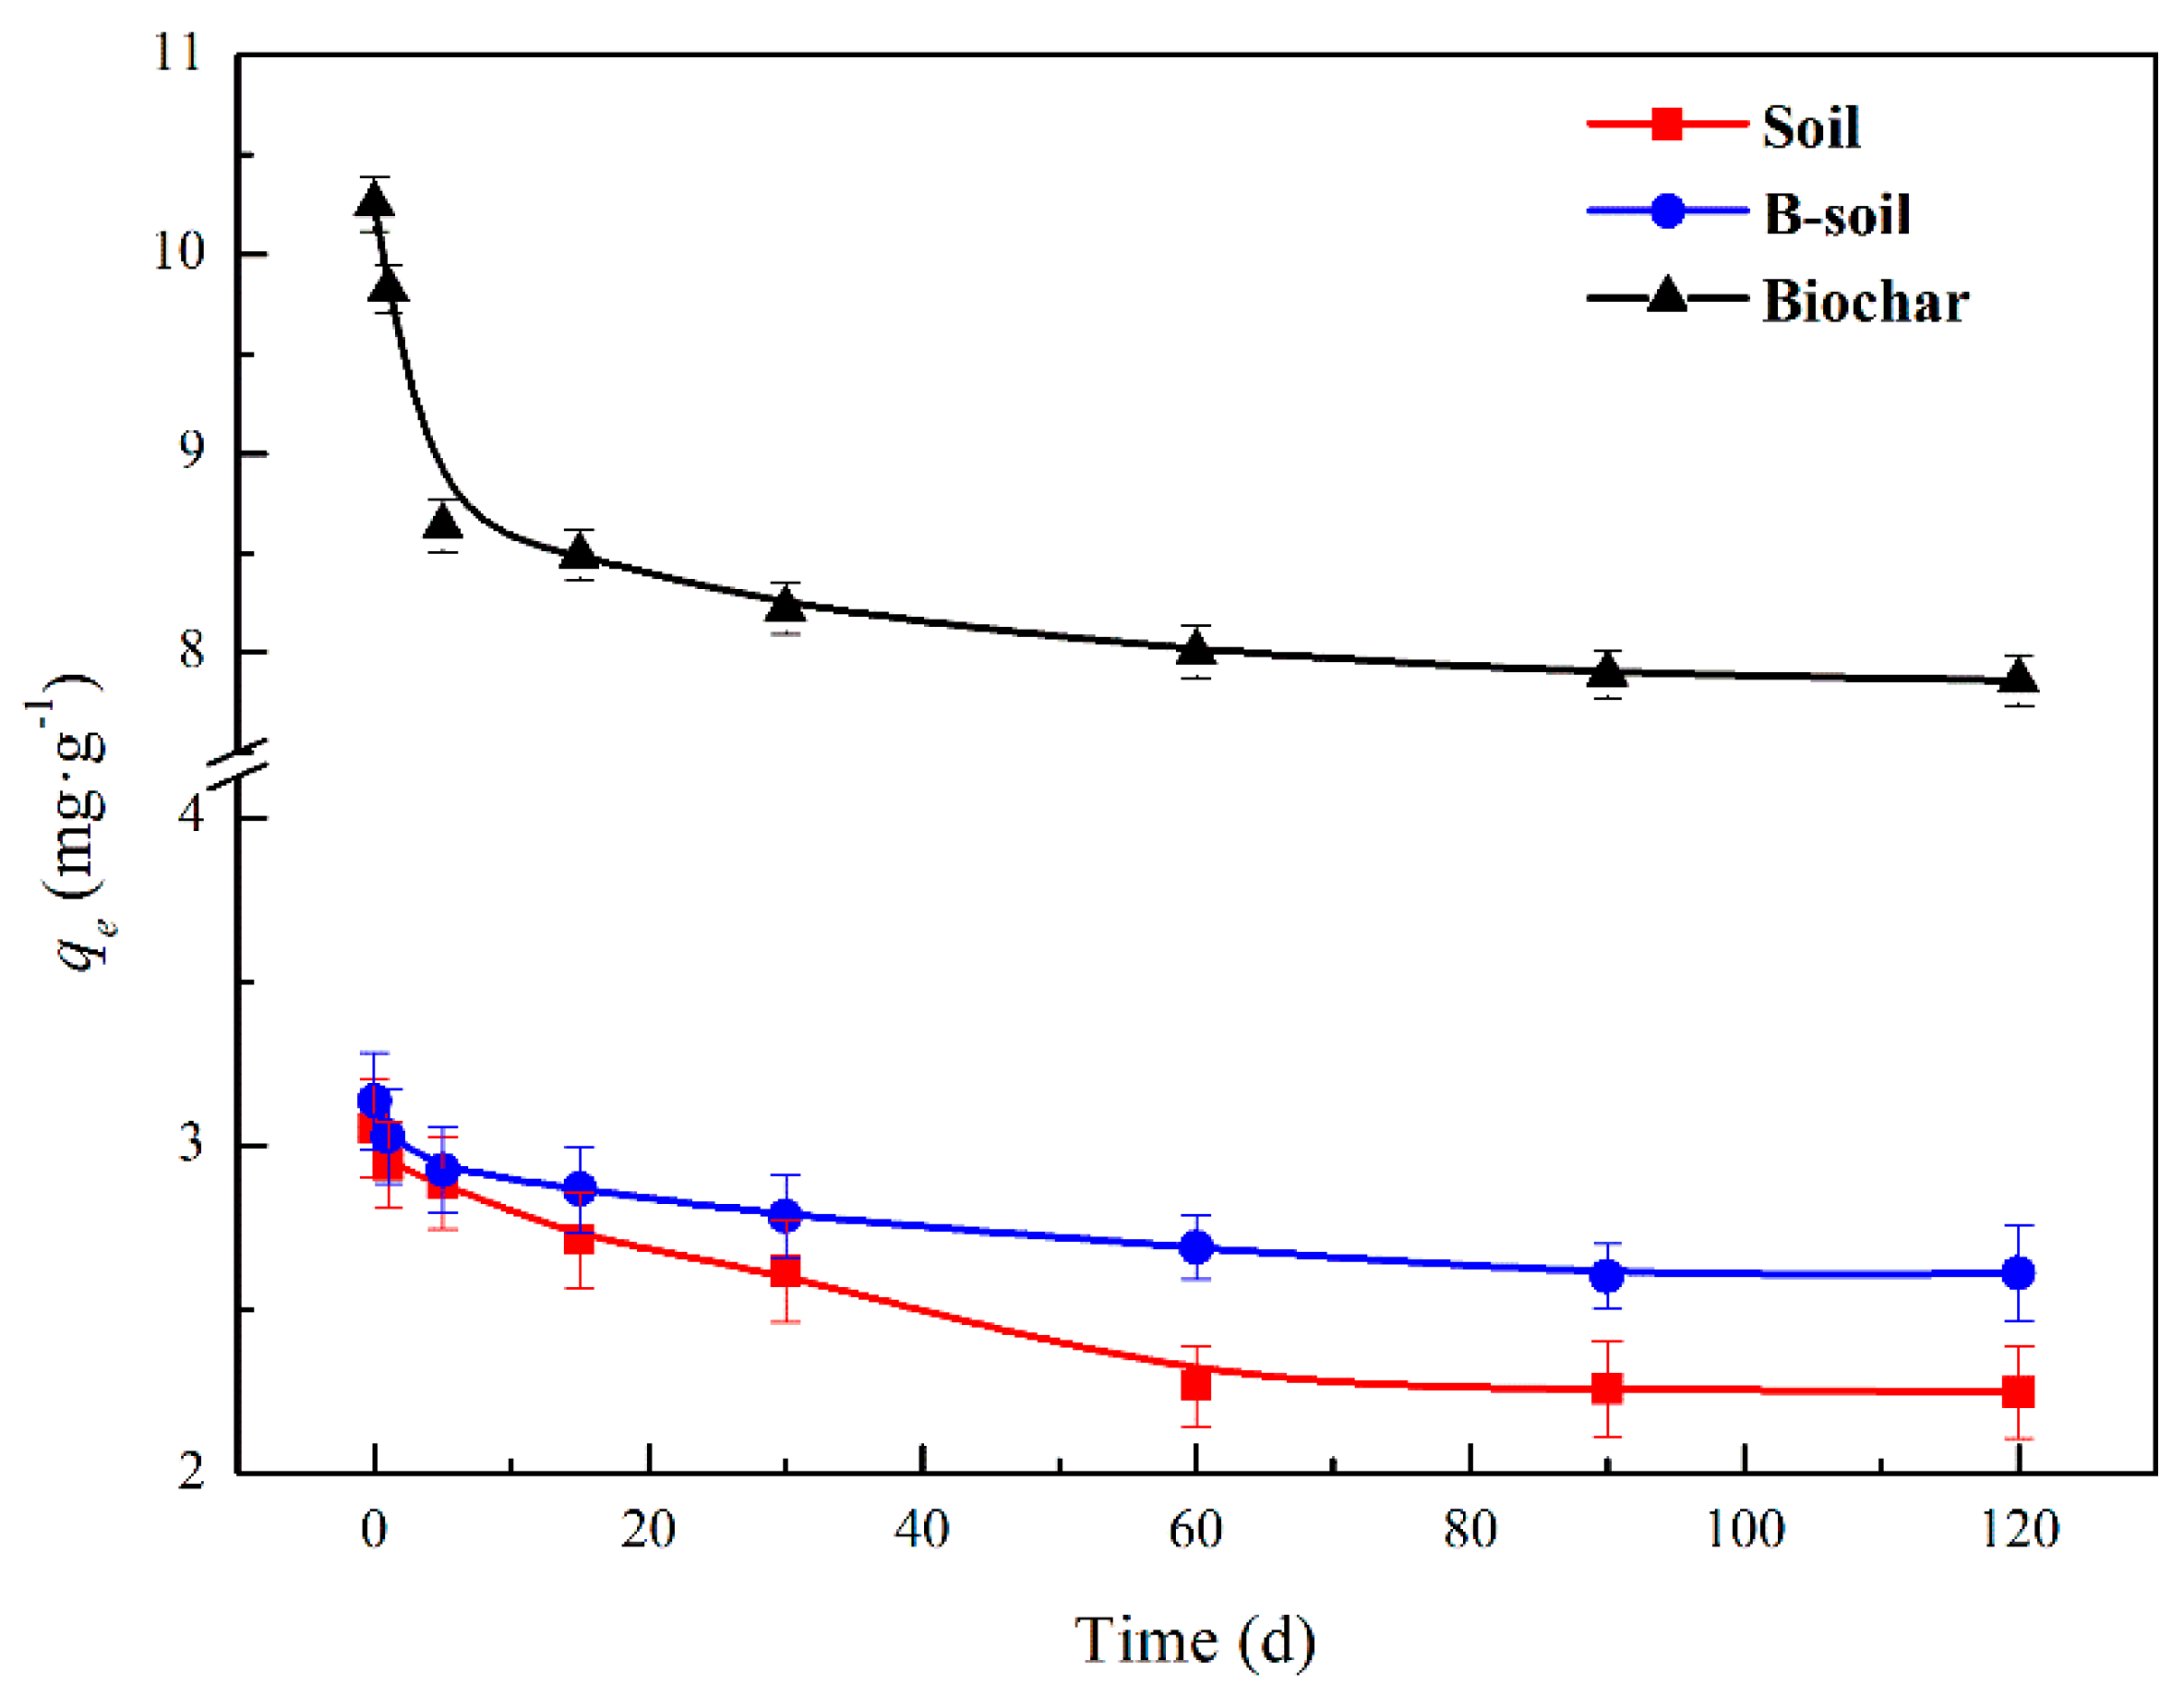
3.2.2. Effect of DOM with Different Decomposition Times

The components and functional groups of DOM with different degrees of decomposition were significantly different, which is shown in Section 3.1.2. The effect of DOM with different degrees of decomposition on the BPs adsorption on the samples is shown in Figure 4. Compared to the results of Figure 3a, DOM displayed an improvement in the BPs adsorption on the soil and an inhibition to that on B-soil and biochar, and the trends of the three adsorbents were similar. With the extension of straw decomposition, the effect of DOM on the BPs adsorption became weak, and it tended to be stable after 60 days. The reason for the increase in the BPs adsorption on soil could be due to the co-adsorption between DOM and BPs on the soil surface, while the decrease in the adsorption on B-soil and biochar may be due to the competitive adsorption between them. The phenomenon may be caused by the differences in surface properties of soil and biochar [47,48]. Considering the tendency, it may be related to the change of the components and functional groups of DOM. In the initial stage, the main substances in DOM were hydrophilia, as carbohydrates, amides, and aliphatics. As degradation progressed, DOM was degraded into a mass of small molecular acids or intermediates by microorganisms. In the later period, the hydrophobicity of DOM was enhanced, which was related to the aromaticity of DOM increasing and consistent with the results of DOM characterizations [22,45,46]. During the process, the hydrophobicity of DOM gradually increased, and BPs was more soluble in DOM, resulting in a decrease in the amount of BPs adsorbed.

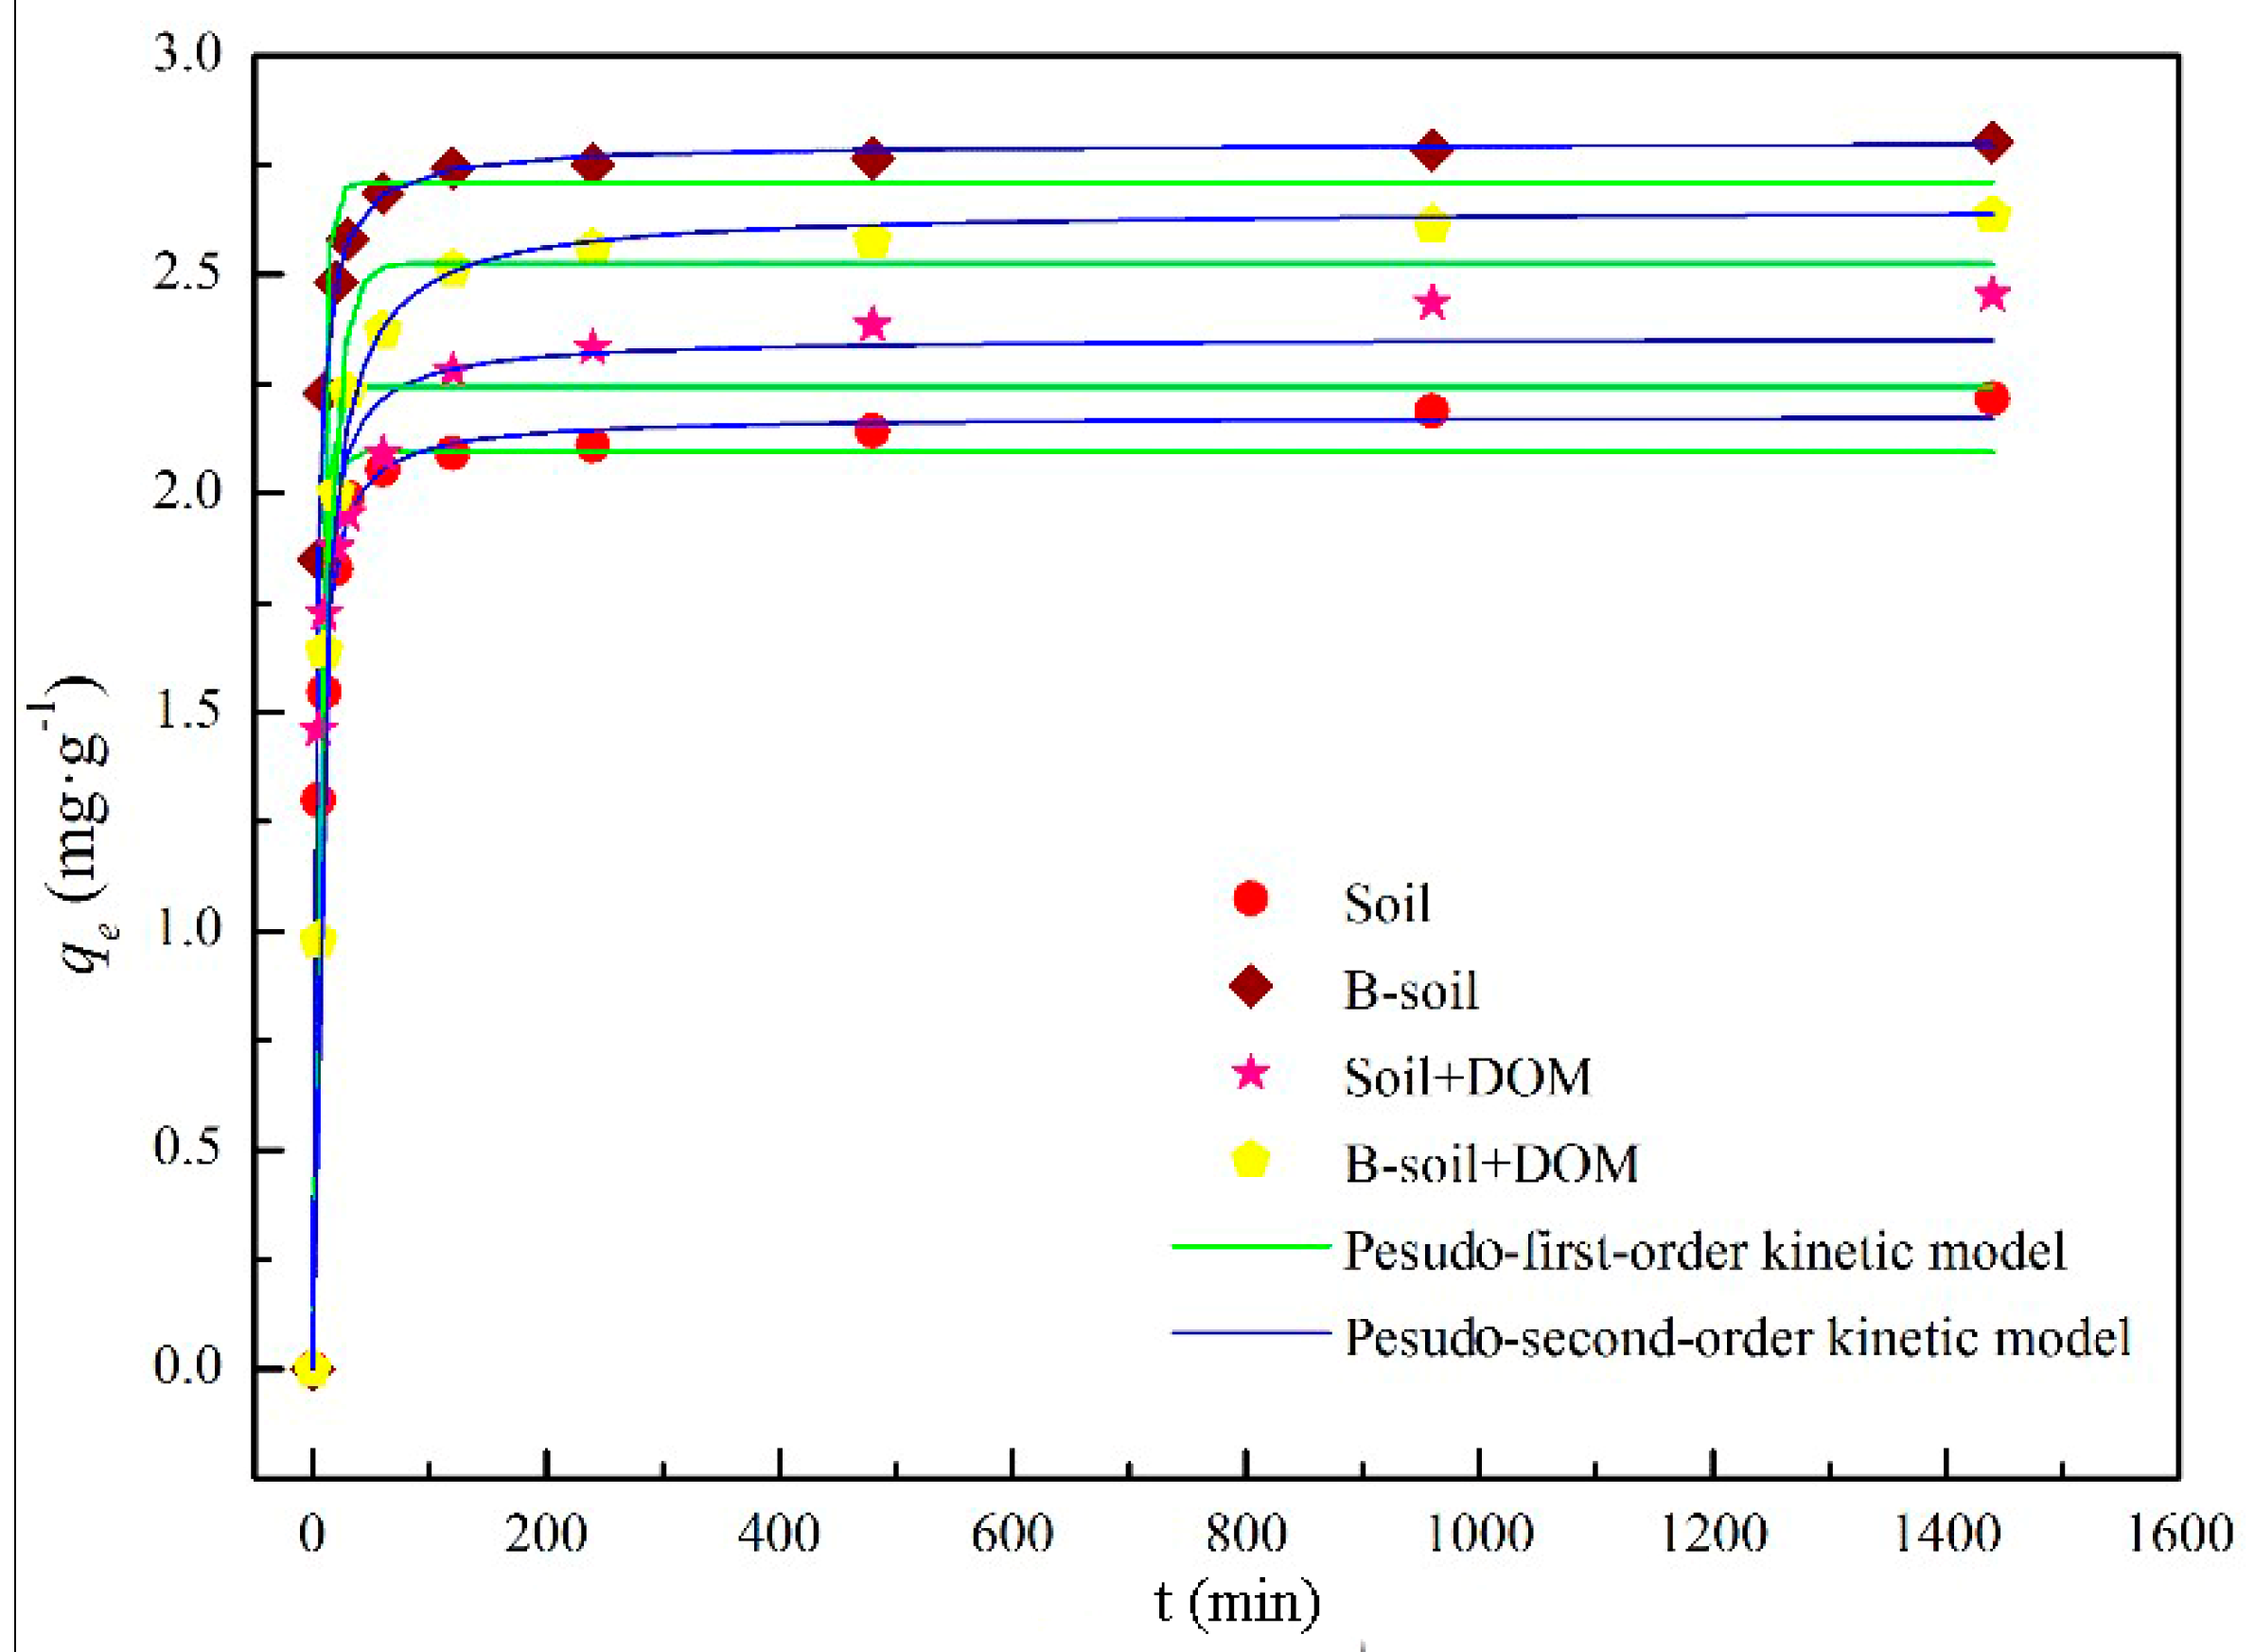
3.2.3. Adsorption Kinetics

Figure 5 and Figure S2 show that all adsorption kinetic data from the soil and B-soil samples with or without DOM could be described very well by the pseudo-second-order kinetic model with higher correlation coefficients (R2), indicating that BPs adsorption of soil and B-soil samples is always a chemical process, irrespective of DOM [25,49]. In addition, the equilibrium adsorption times were 90 and 120 min for soil and B-soil without DOM, while the equilibrium times were 120 and 240 min with DOM, respectively. The extended time could be caused by the interaction between DOM and BPs. Meanwhile, the adsorption process was divided into two portions, as rapid adsorption and slow adsorption. The rapid adsorption process could be accomplished quickly, while the slow adsorption process was the saturated adsorption and slow. The fitting parameters of the pseudo-second-order kinetic model are listed in Table 1. As listed in the table, the calculated qe values were approximately consistent with the experimental data. In terms of the h values, the rate for the B-soil sample was greater than that of the soil sample. In terms of adsorption constants (k2), the larger the k2 value, the slower the adsorption rate [50], and the variation tendency was contrary to the changes in the h values, irrespective of DOM.

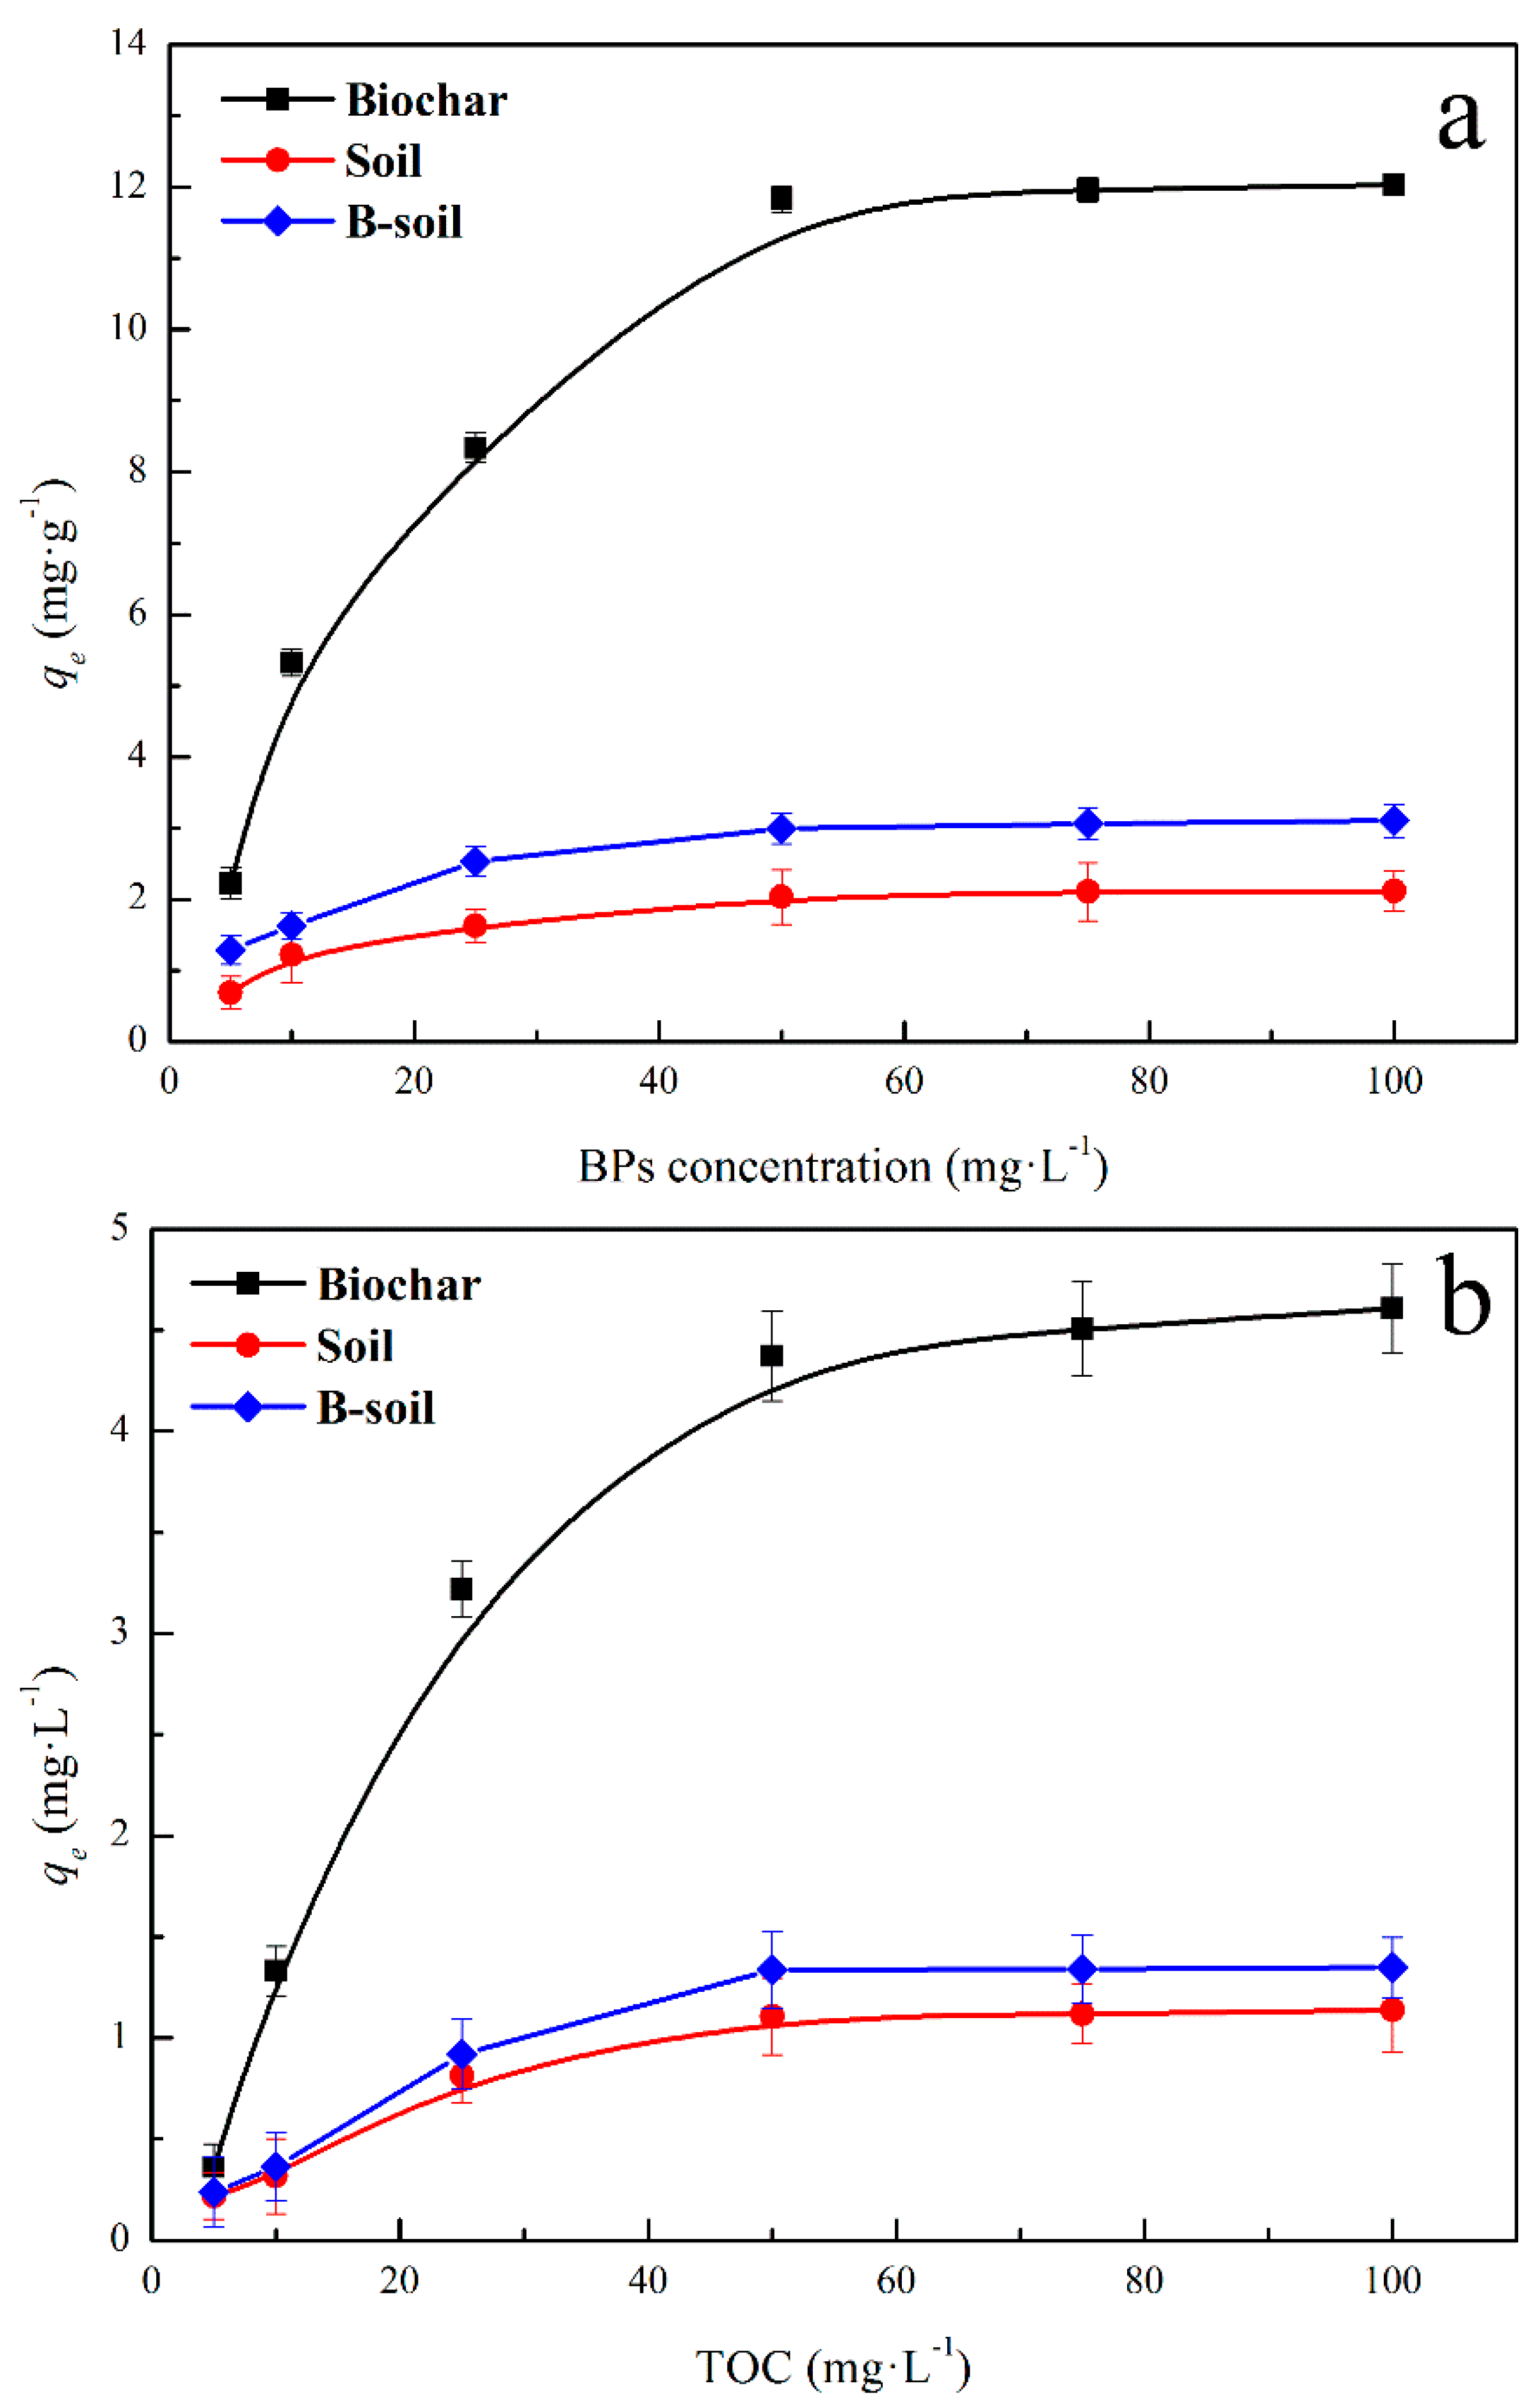
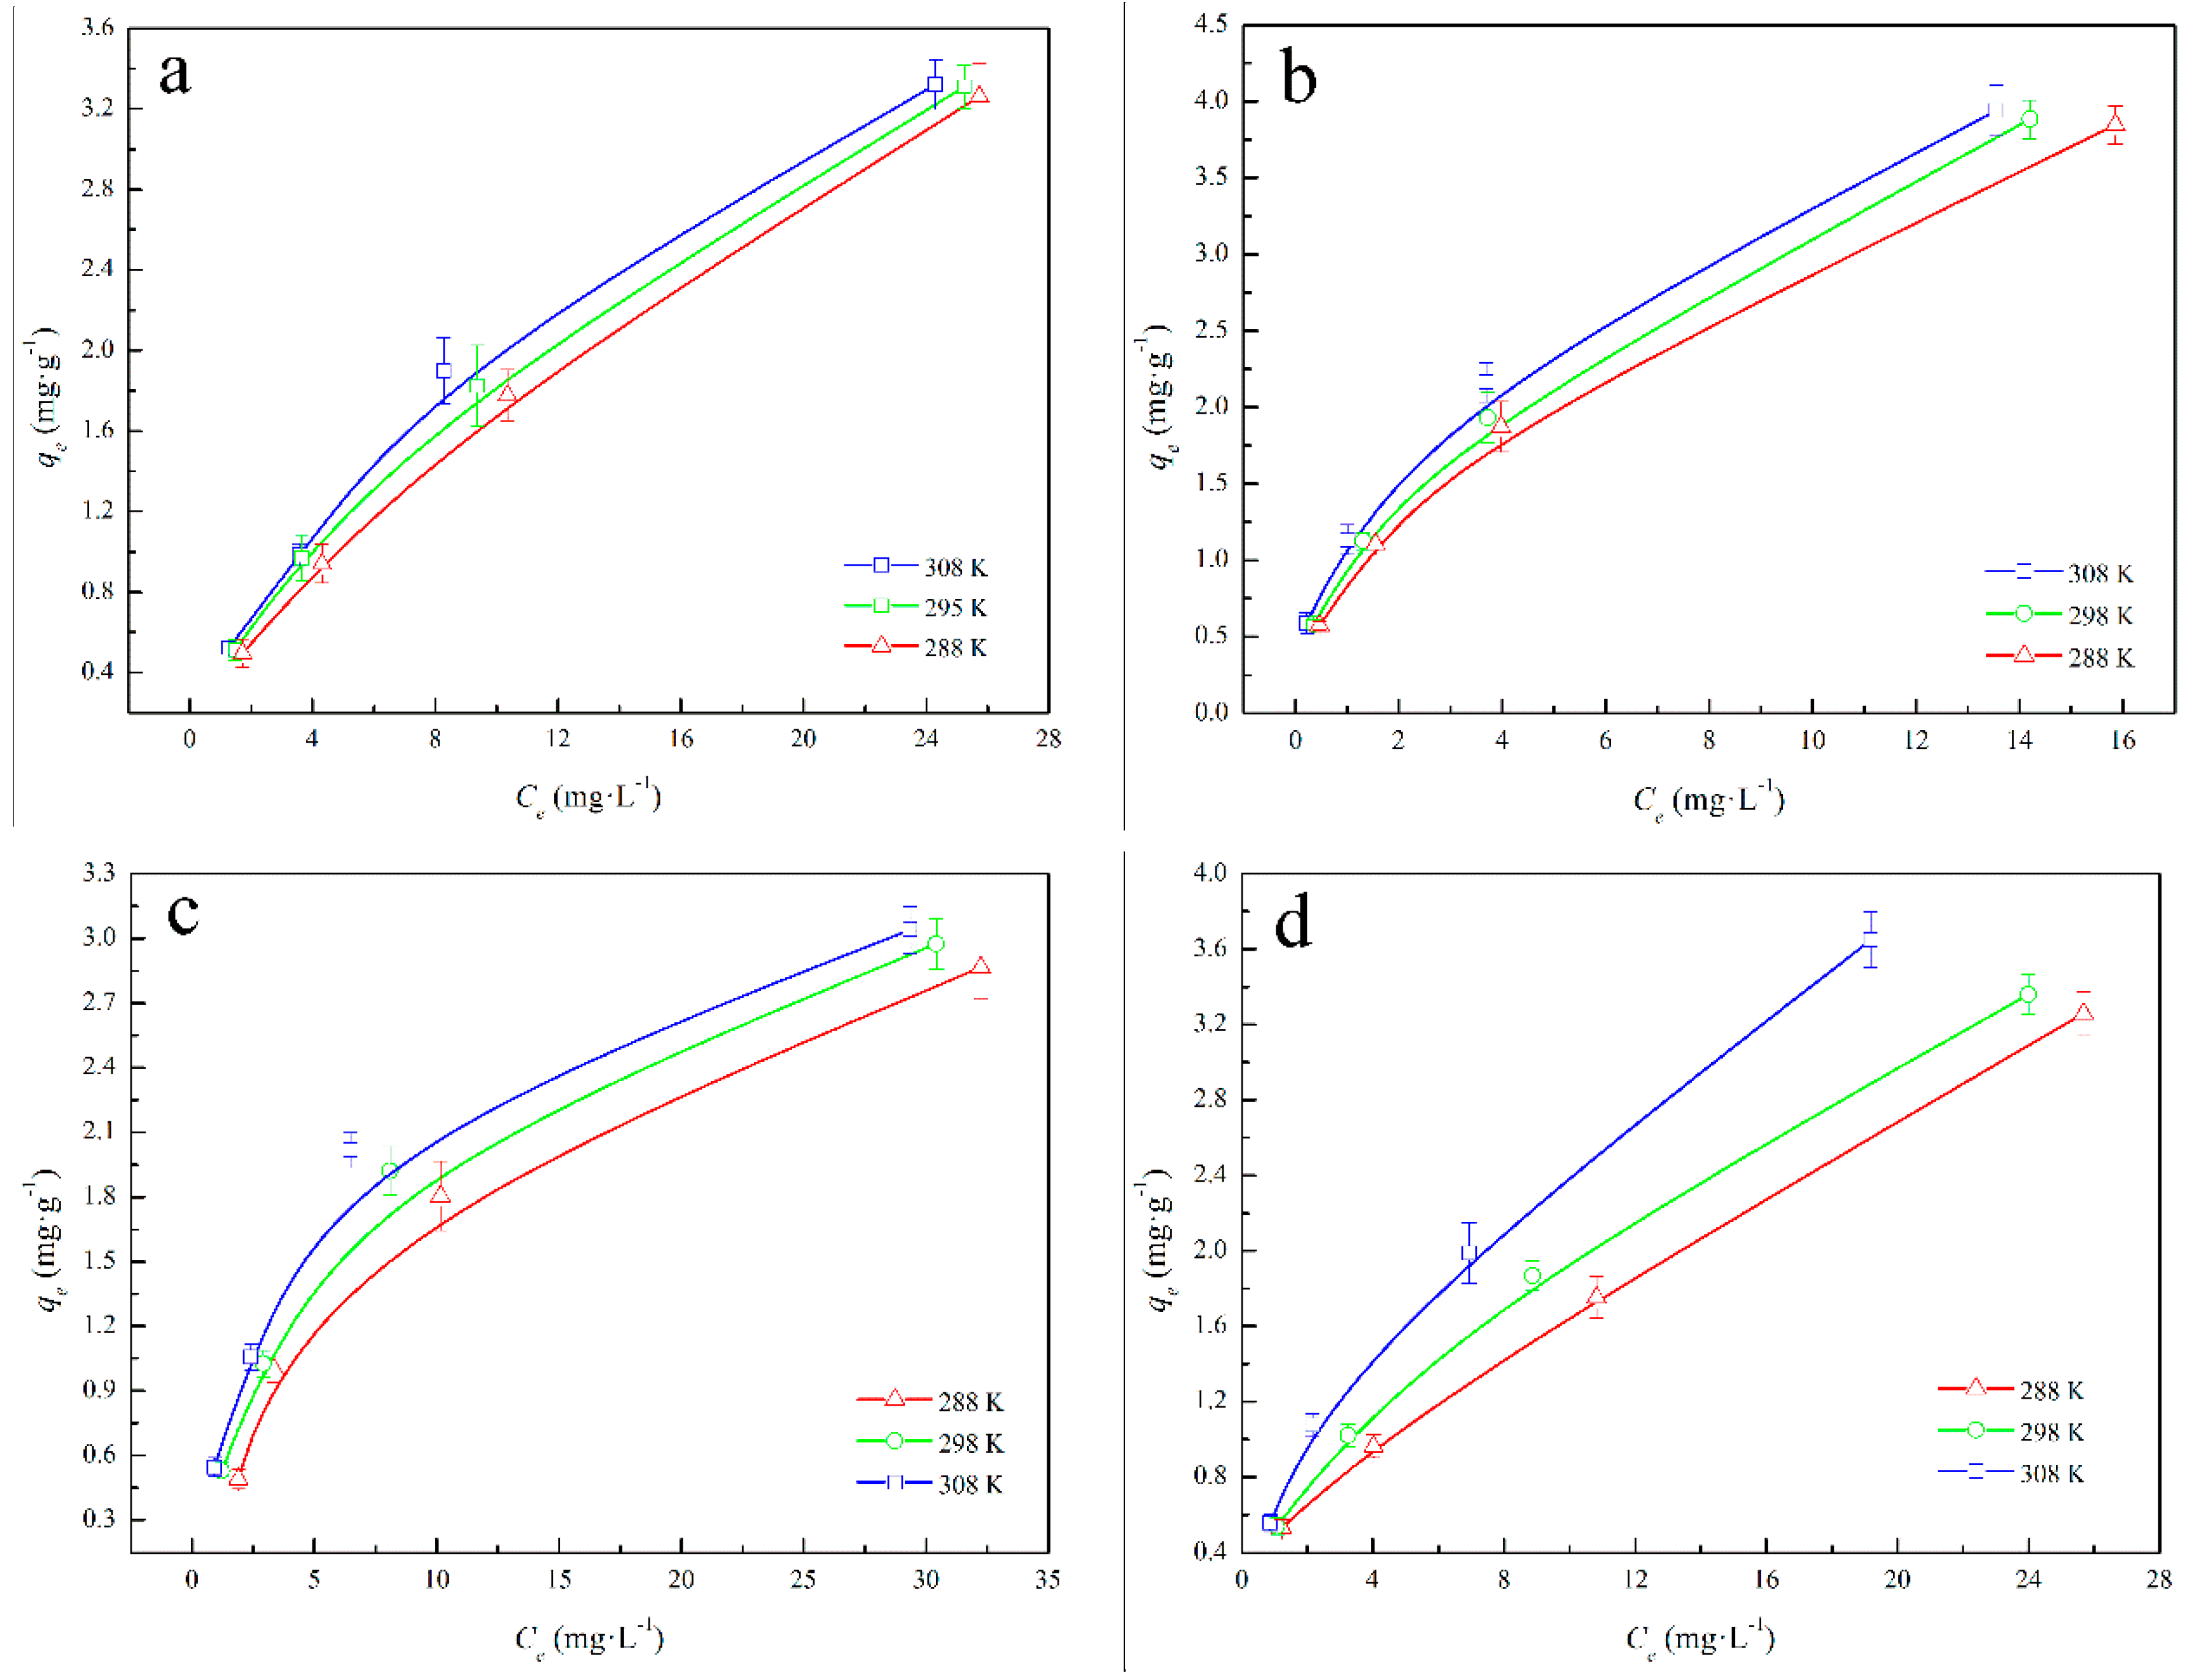
3.2.4. Adsorption Isotherms

The equilibrium adsorption isotherm is fundamental to describing the interactive behavior between solutes and sorbents and important for the design of an adsorption system. Figure 6a,b show the BPs adsorption capacities of soil and B-soil at different initial BPs concentrations and adsorption temperatures, and Figure 6c,d show the adsorption isotherms of soil and B-soil with DOM. It is evident that the initial BPs concentrations and adsorption temperatures affect the adsorption capacity of BPs for all samples: adsorption capacities increase as the initial concentrations increase, and favorable adsorption occurs at a higher temperature, irrespective of the DOM. The fitting results of the Langmuir model and the Freundlich model are listed in Table 2. The isotherm constants and the correlation coefficients (R2) were obtained by linear regression and indicate that the adsorption processes could be well-described by the Freundlich model ( R F r e u n d l i c h 2 > R L a n g m u i r 2 ) for soil and B-soil samples, which reveals that the BPs is adsorbed in multiple layers on the sample surfaces [51,52,53]. Meanwhile, the Freundlich model was also fitted to the BPs adsorption with DOM. In the fitting results of the Freundlich model, the 1/n values were all below 0.5, indicating that the BPs could easily be adsorbed on the soil and B-soil sample surfaces [33,50]. The Kf values represent the adsorption capacity of the adsorbent [25], and the B-soil samples showed higher Kf values than the other samples, irrespective of the temperature. The thermodynamic parameters for the BPs adsorption are listed in Table 3. ΔS0 and ΔH0 were calculated from the slope and intercept of Van’t Hoff plots of lnKd versus 1/T. In Table 3, negative ΔG0 and positive ΔH0 indicate that the BPs adsorption process is spontaneous and endothermic, and the greater the absolute ΔG0 value, the more spontaneous the adsorption. The positive ΔS0 reflects an increase in randomness at the solid/solution interface during BPs adsorption of the samples. On the other hand, the ΔH0 values of soil samples at different initial BPs concentrations are less than those of B-soil samples. However, after injecting DOM, the ΔH0 values of soil samples at different initial BPs concentrations are greater than those of soil samples without DOM, while the ΔH0 values of B-soil samples are less than the values of B-soil samples without DOM. The absolute ΔG0 values of all the experiments increased with the temperature increase, indicating that the adsorption behavior was easily more spontaneous at a high temperature. Additionally, the absolute ΔG0 values of the soil sample with DOM were greater than the absolute values of the soil without DOM, and the absolute values of the B-sample with DOM were less than those of the B-sample without DOM.

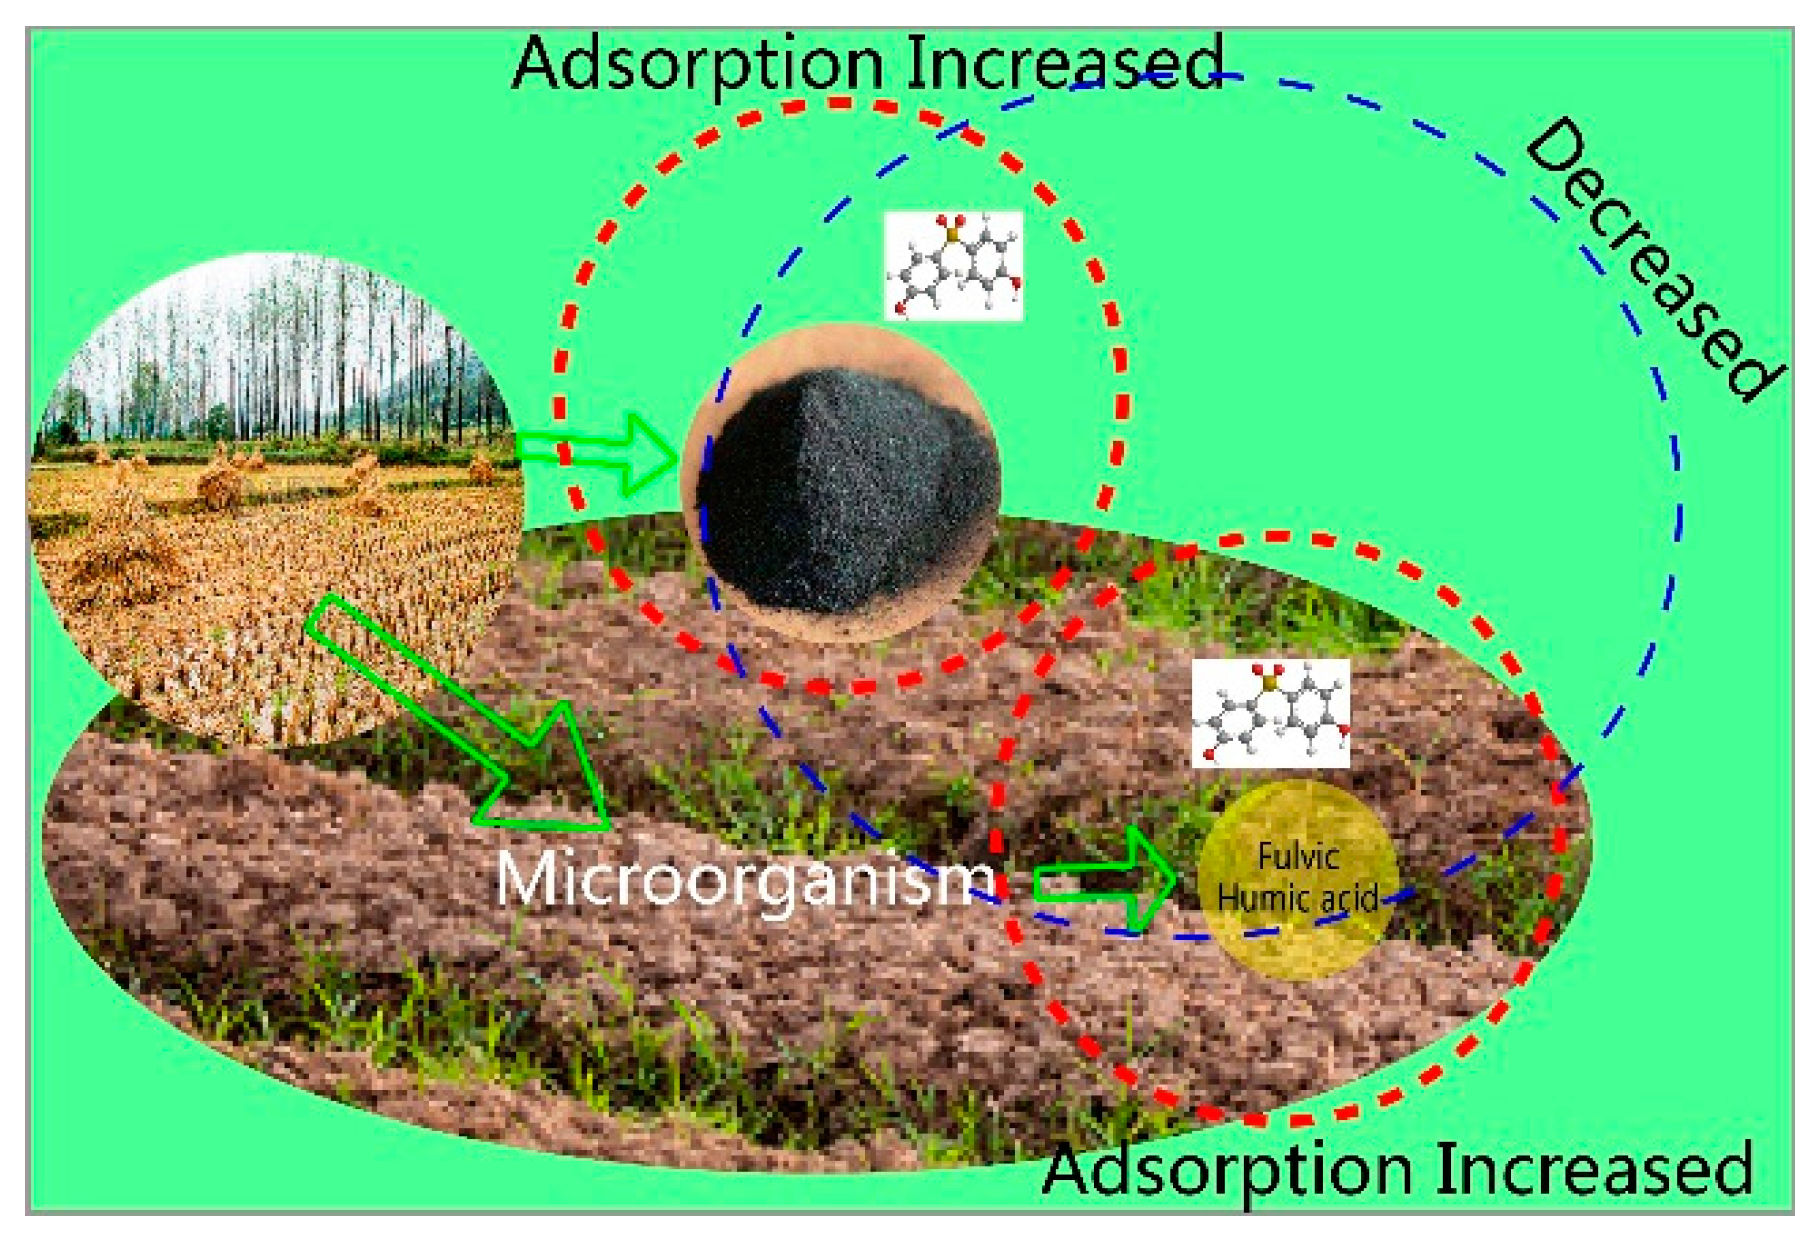
3.3. Instructional Application

In recent years, straw-returning to the field has been widely promoted as one of the most important methods for reducing the pollution caused by straw burning, and it could also increase the organic matter of soil. The proposed adsorption model was shown in Figure 7. The straw could be degenerated into DOM released into the soil, and DOM plays an important role in the natural environment as a microreactor of contaminants. Furthermore, biochar has developed into an important soil amendment. However, there is an inconsistent discussion about the interaction between biochar and DOM on the contaminants. The results of the experiments show that both DOM and biochar could improve the BPs adsorption capacity of soil, while there is a decrease in the BPs adsorption on biochar modified soil samples with DOM.
It could be seen that straw-returning to the field would enhance the BPs adsorption capacity of the soil sample, while it would reduce the adsorption capacity of biochar modified soil. The conclusions may contribute to the comprehensive utilization of straw and farm land protection, and for BPs, it has been shown that only the addition of biochar or straw can promote the BPs adsorption capacity of soil, but they cannot be applied at the same time. This is important for the migration of contaminants in the soil.

4. Conclusions

This paper investigated the BPs adsorption behavior of red acid soil and biochar modified soil (B-soil) with DOM. The soil sample was collected in the south of China, and DOM was decayed and extracted from the soil sample for a certain time using the paddy straw as the feedstock. With the extension of decay, the aromaticity of DOM increased. The adsorption tests indicated that both DOM and biochar could improve the BPs adsorption capacity of soil, while DOM could decrease the BPs adsorption on biochar. Furthermore, the BPs adsorption capacities increased with the initial BPs concentrations increase, and the capacities also increased with the adsorption temperature increase. The conclusion may contribute to the migration of contaminants in the soil, and for BPs, only the addition of biochar or straw can promote the BPs adsorption capacity of soil, but they cannot be applied at the same time.

Supplementary Materials

The following are available online at https://www.mdpi.com/1660-4601/16/5/764/s1, Figure S1: Molecular structures of BPa and BPs, Figure S2: The pseudo-second-order kinetic fitting line, Table S1: Physicochemical properties of the soil sample and biochar sample, Table S2: The ratio of fluorescence intensity in each region to total fluorescence intensity of DOM.

Author Contributions

S.Z. and L.L. conceived and designed the experiments; S.Z., J.L., and X.Y. performed the experiments; S.Z., J.L., and M.J. analyzed the data; J.L. and K.Z. contributed reagents/materials/analysis tools; S.Z. wrote the paper.

Funding

This study was supported by the National Natural Science Foundation of China (51708301); Natural Science Foundation of Tianjin, China (17JCZDJC39500); 2017 Science and Technology Demonstration Project of Industrial Integration and Development, Tianjin, China (17ZXYENC00 100); 2017 Jinnan District Science and Technology Project of Tianjin, China (20171505); Tianjin key research and development plan (17YFNZNC00040); Tianjin Natural Science Foundation (17JCTPJC50800); and the Fundamental Research Funds for the Central Universities.

Acknowledgments

The authors appreciate the financial support and thank the editor and reviewers for their very useful suggestions and comments.

Conflicts of Interest

The authors declare no conflict of interest.

References

  1. Huang, W.L.; Ping, P.A.; Yu, Z.Q.; Fu, J.M. Effects of organic matter heterogeneity on sorption and desorption of organic contaminants by soils and sediments. Appl. Geochem. 2003, 18, 955–972. [Google Scholar] [CrossRef]
  2. Maurer, F.; Christl, I.; Kretzschmar, R. Reduction and reoxidation of humic acid: Influence on spectroscopic properties and proton binding. Environ. Sci. Technol. 2010, 44, 5787–5792. [Google Scholar] [CrossRef] [PubMed]
  3. Kowalczuk, P.; Stoń-Egiert, J.; Cooper, W.J.; Whitehead, R.F.; Durako, M.J. Characterization of chromophoric dissolved organic matter (CDOM) in the Baltic Sea by excitation emission matrix fluorescence spectroscopy. Mar. Chem. 2005, 96, 273–292. [Google Scholar] [CrossRef]
  4. Hassett, J.P. Chemistry-Dissolved natural organic matter as a microreactor. Science 2006, 311, 1723–1724. [Google Scholar] [CrossRef] [PubMed]
  5. Wang, J.P.; Chen, J.W.; Qiao, X.L.; Wang, Y.; Cai, X.Y.; Zhou, C.Z.; Zhang, Y.L.; Ding, G.H. DOM from mariculture ponds exhibits higher reactivity on photodegradation of sulfonamide antibiotics than from offshore seawaters. Water Res. 2018, 144, 365–372. [Google Scholar] [CrossRef] [PubMed]
  6. Hood, E.; Williams, M.W.; McKnight, D.M. Sources of dissolved organic matter (DOM) in a Rocky Mountain stream using chemical fractionation and stable isotopes. Biogeochemistry 2005, 74, 231–255. [Google Scholar] [CrossRef]
  7. Yamamoto, M.; Nishida, A.; Otsuk, K.; Komai, T.; Fukushima, M. Evaluation of the binding of iron(II) to humic substances derived from a compost sample by a colorimetric method using ferrozine. Bioresour. Technol. 2010, 101, 4456–4460. [Google Scholar] [CrossRef] [PubMed]
  8. Arnich, N.; Canivenc, L.M.; Kolf, C.M.; Coffigny, H.; Cravedi, J.P.; Grob, K.; Macherey, A.C.; Masset, D.; Maximilien, R.; Narbonne, J.F.; et al. Conclusions of the french food safety agency on the toxicity of bisphenol A. Int. J. Hyg. Environ. Health 2011, 214, 271–275. [Google Scholar] [CrossRef] [PubMed]
  9. Sun, C.; Leong, L.P.; Barlow, P.J.; Chan, S.H.; Bloodworth, B.C. Single laboratory validation of a method for the determination of Bisphenol A, Bisphenol A diglycidyl ether and its derivatives in canned foods by reversed-phase liquid chromatography. J. Chromatogr. A 2006, 1129, 145–148. [Google Scholar] [CrossRef] [PubMed]
  10. Migeot, V.; Dupuis, A.; Cariot, A.; Albouy, L.M.; Pierre, F.; Rabouan, S. Bisphenol A and its chlorinated derivatives in human colostrums. Environ. Sci. Technol. 2013, 47, 13791–13797. [Google Scholar] [CrossRef] [PubMed]
  11. Mathew, M.; Sreedhanya, S.; Manoj, P.; Aravindakumar, C.T.; Aravind, U.K. Exploring the interaction of bisphenol-S with serum albumins: A better or worse alternative for bisphenol A? J. Phys. Chem. B 2014, 118, 3832–3843. [Google Scholar] [CrossRef] [PubMed]
  12. Liao, C.; Liu, F.; Kannan, K. Bisphenol S, a new bisphenol analogue, in paper products and currency bills and its association with bisphenol a residues. Environ. Sci. Technol. 2012, 46, 6515–6522. [Google Scholar] [CrossRef] [PubMed]
  13. Liao, C.; Liu, F.; Guo, Y.; Moon, H.B.; Nakata, H.; Wu, Q.; Kannan, K. Occurrence of eight bisphenol analogues in indoor dust from the United States and several Asian countries: Implications for human exposure. Environ. Sci. Technol. 2012, 46, 9138–9145. [Google Scholar] [CrossRef] [PubMed]
  14. Liao, C.; Kannan, K. Concentrations and profiles of bisphenol A and other bisphenol analogues in foodstuffs from the United States and their implications for human exposure. J. Agric. Food Chem. 2013, 61, 4655–4662. [Google Scholar] [CrossRef] [PubMed]
  15. Fromme, H.; Küchler, T.; Otto, T.; Pilz, K.; Müller, J.; Wenzel, A. Occurrence of phthalates and bisphenol A and F in the environment. Water Res. 2002, 36, 1429–1438. [Google Scholar] [CrossRef]
  16. Viñas, P.; Campillo, N.; Martínez-Castillo, N.; Hernández, C. Comparison of two derivatization-based methods for solidphase microextraction-gas chromatography-mass spectrometric determination of bisphenol A, bisphenol S and biphenol migrated from food cans. Anal. Bioanal. Chem. 2010, 397, 115–125. [Google Scholar] [CrossRef] [PubMed]
  17. Liao, C.; Liu, F.; Alomirah, H.; Loi, V.D.; Mohd, M.A.; Moon, H.B.; Nakata, H.; Kannan, K. Bisphenol S in Urine from the United States and Seven Asian Countries: Occurrence and Human Exposures. Environ. Sci. Technol. 2012, 46, 6860–6866. [Google Scholar] [CrossRef] [PubMed] [Green Version]
  18. Ike, M.; Chen, M.Y.; Danzl, E.; Sei, K.; Fujita, M. Biodegradation of a variety of bisphenols under aerobic and anaerobic conditions. Water Sci. Technol. 2006, 53, 153–159. [Google Scholar] [CrossRef] [PubMed]
  19. Tegan, S.H.; Hannah, P.; Crystal, L.; Roy, G.; Spencer, M.; Mary, C.G.; Caroline, V.S.; Patricia, A.H. Replacement Bisphenols Adversely Affect Mouse Gametogenesis with Consequences for Subsequent Generations. Curr. Biol. 2018, 28, 2948–2954. [Google Scholar]
  20. Guo, H.Y.; Li, H.; Liang, N.; Chen, F.Y.; Liao, S.H.; Zhang, D.; Wu, M.; Pan, B. Structural benefits of bisphenol S and its analogs resulting in their high sorption on carbon nanotubes and graphite. Environ. Sci. Pollut. Res. 2016, 23, 8976–8984. [Google Scholar] [CrossRef] [PubMed]
  21. Chun, Y.; Sheng, G.Y.; Chou, C.T.; Xing, B. Compositions and sorptive properties of crop residue-derived chars. Environ. Sci. Technol. 2004, 38, 4649–4655. [Google Scholar] [CrossRef] [PubMed]
  22. Li, Y.L.; He, W.; Liu, W.X.; Kong, X.Z.; Yang, B.; Yang, C.; Xu, F.L. Influences of binding to dissolved organic matter on hydrophobic organic compounds in a multi-contaminant system: Coefficients, mechanisms and ecological risks. Environ. Pollut. 2015, 206, 461–468. [Google Scholar] [CrossRef] [PubMed]
  23. Zheng, H.; Ouyang, Z.; Xu, W.; Wang, X.K.; Mao, H.; Li, X.Q.; Tian, Y.X. Variation of carbon storage by different reforestation types in the hilly red soil region of southern China. For. Ecol. Manag. 2008, 255, 1113–1121. [Google Scholar] [CrossRef] [Green Version]
  24. Zhang, H.M.; Wang, B.R.; Xu, M.G. Crop yield and soil responses to long-term fertilization on a red soil in southern China. Pedosphere 2009, 19, 199–207. [Google Scholar] [CrossRef]
  25. Zhang, S.Q.; Yang, X.; Liu, L.; Ju, M.T.; Zheng, K. Adsorption behavior of selective recognition functionalized biochar to Cd(II) in wastewater. Materials 2018, 11, 299. [Google Scholar] [CrossRef] [PubMed]
  26. Zhang, S.; Yang, X.; Ju, M.T.; Liu, L.; Zheng, K. Mercury Adsorption to Aged Biochar and its Management in China. Environ. Sci. Pollut. Res. 2019, 26, 4867–4877. [Google Scholar] [CrossRef] [PubMed]
  27. Li, L.; Xu, D.; Pei, Z. Kinetics and thermodynamics studies for bisphenol S adsorption on reduced graphene oxide. RSC Adv. 2016, 6, 60145–60151. [Google Scholar] [CrossRef] [Green Version]
  28. Andreas, S.; Vanja, A.; Rolf, D.V.; Tone, C.G.; Jan, M.; Gerard, C.; Sarah, E.H. Biochar amendment to soil changes dissolved organic matter content and composition. Chemosphere 2016, 142, 100–105. [Google Scholar]
  29. Lim, T.J.; Spokas, K.A.; Feyereisen, G.; Novak, J.M. Predicting the impact of biochar additions on soil hydraulic properties. Chemosphere 2016, 142, 136–144. [Google Scholar] [CrossRef] [PubMed]
  30. Liang, F.; Li, G.T.; Lin, Q.M.; Zhao, X.R. Crop yield and soil properties in the first 3 years after biochar application to a calcareous soil. J. Integr. Agr. 2014, 13, 525–532. [Google Scholar] [CrossRef]
  31. Zhao, R.; Coles, N.; Kong, Z.; Wu, J.P. Effects of aged and fresh biochars on soil acidity under different incubation conditions. Soil Tillage Res. 2015, 146, 133–138. [Google Scholar] [CrossRef]
  32. Hou, Q.D.; Zhen, M.N.; Liu, L.; Chen, Y.; Huang, F.; Zhang, S.Q.; Li, W.Z.; Ju, M.T. Tin phosphate as a heterogeneous catalyst for efficient dehydration of glucose into 5-hydroxymethylfurfural in ionic liquid. Appl. Catal. B Environ. 2017, 224, 183–193. [Google Scholar] [CrossRef]
  33. Hale, S.; Hanley, K.; Lehmann, J.; Zimmerman, A.; Cornelissen, G. Effects of chemical, biological, and physical aging as well as soil addition on the sorption of pyrene to activated carbon and biochar. Environ. Sci. Technol. 2011, 45, 10445–10453. [Google Scholar] [CrossRef] [PubMed]
  34. Parlanti, E.; Wörz, K.; Geoffroy, L.; Lamotte, M. Dissolved organic matter fluorescence spectroscopy as a tool to estimate biological activity in a coastal zone submitted to anthropogenic inputs. Org. Geochem. 2000, 31, 1765–1781. [Google Scholar] [CrossRef]
  35. Gao, B.J.; Wang, J.; An, F.Q.; Liu, Q. Molecular imprinted material prepared by novel surface imprinting technique for selective adsorption of pirimicarb. Polymer 2008, 49, 1230–1238. [Google Scholar] [CrossRef]
  36. Chen, X.C.; Chen, G.G.; Chen, L.G.; Chen, Y.X.; Lehmann, J.; McBride, M.B. Adsorption of copper and zinc by biochars produced from pyrolysis of hardwood and corn straw in aqueous solution. Bioresour. Technol. 2011, 102, 8877–8884. [Google Scholar] [CrossRef] [PubMed]
  37. Ren, Y.; Zhang, M.; Zhao, D. Synthesis and properties of magnetic Cu(II) ion imprinted composite adsorbent for selective removal of copper. Desalination 2008, 228, 135–149. [Google Scholar] [CrossRef]
  38. Cheng, C.H.; Lehmann, J. Ageing of black carbon along a temperature gradient. Chemosphere 2009, 75, 1021–1027. [Google Scholar] [CrossRef] [PubMed]
  39. Liu, Z.; Demisie, W.; Zhang, M. Simulated degradation of biochar and its potential environmental implications. Environ. Pollut. 2013, 179, 146. [Google Scholar] [CrossRef] [PubMed]
  40. Lammers, K.; Arbuckle-Keil, G.; Dighton, J. FT-IR study of the changes in carbohydrate chemistry of three New Jersey pine barrens leaf litters during simulated control burning. Soil Biol. Biochem. 2009, 41, 340–347. [Google Scholar] [CrossRef]
  41. Fu, P.; Hu, S.; Xiang, J.; Sun, L.S.; Li, P.S.; Zhang, J.Y.; Zheng, C.G. Pyrolysis of maize stalk on the characterization of chars formed under different devolatilization conditions. Energy Fuels 2009, 23, 4605–4611. [Google Scholar] [CrossRef]
  42. Das, D.D.; Schnitzer, M.I.; Monreal, C.M.; Mayer, P. Chemical composition of acid-base fractions separated from bio-oil derived by fast pyrolysis of chicken manure. Bioresour. Technol. 2009, 100, 6524–6532. [Google Scholar] [CrossRef] [PubMed]
  43. Bustin, R.M.; Guo, Y. Abrupt changes (jumps) in reflectance values and chemical compositions of artificial charcoals and inertinite in coals. Int. J. Coal Geol. 1999, 38, 237–260. [Google Scholar] [CrossRef]
  44. Wen, W.; Xia, X.H.; Chen, X.; Wang, H.T.; Zhu, B.T.; Li, H.S.; Li, Y. Bioconcentration of perfluoroalkyl substances by Chironomus plumosus larvae in water with different types of dissolved organic matters. Environ. Pollut. 2016, 213, 299–307. [Google Scholar] [CrossRef] [PubMed]
  45. Jacquin, C.; Lesage, G.; Traber, J.; Pronk, W.; Heran, M. Three-dimensional excitation and emission matrix fluorescence (3DEEM) for quick and pseudo-quantitative determination of proteinand humic-like substances in full-scale membrane bioreactor (MBR). Water Res. 2017, 118, 82–89. [Google Scholar] [CrossRef] [PubMed]
  46. Strobel, B.W.; Hansen, H.C.B.; Borggaard, O.K.; Andersen, M.K.; Raulund-Rasmussen, K. Composition and reactivity of DOC in forest floor soil solutions in relation to tree species and soil type. Biogeochemistry 2001, 56, 1–26. [Google Scholar] [CrossRef]
  47. Armanious, A.; Münch, M.; Kohn, T.; Sander, M. Competitive Co-adsorption Dynamics of Viruses and Dissolved Organic Matter to Positively Charged Sorbent Surfaces. Environ. Sci. Technol. 2016, 50, 3597–3606. [Google Scholar] [CrossRef] [PubMed]
  48. Hermosín, M.C.; Roldán, I.; Cornejo, J. Maleic hydrazide interaction with soil clay surfaces. Chemosphere 1991, 23, 473–483. [Google Scholar] [CrossRef] [Green Version]
  49. Namasivayam, C.; Kadirvelu, K. Uptake of mercury (II) from wastewater by activated carbon from an unwanted agricultural solid byproduct: Coirpith. Carbon 1999, 37, 79–84. [Google Scholar] [CrossRef]
  50. Fan, X.; Parker, D.J.; Smith, M.D. Adsorption kinetics of fluoride on low cost materials. Water Res. 2003, 37, 4929–4937. [Google Scholar] [CrossRef] [PubMed]
  51. Wilcox, J.; Rupp, E.; Ying, S.C.; Lim, D.H.; Negreira, A.S.; Kirchofer, A.; Feng, F.; Lee, K. Mercury adsorption and oxidation in coal combustion and gasification processes. Int. J. Coal Geol. 2012, 90, 4–20. [Google Scholar] [CrossRef]
  52. Yenisoy, K.S.; Aygun, A.; Gunes, M.; Tahtasakal, E. Physical and chemical characteristics of polymer-based spherical activated carbon and its ability to adsorb organics. Carbon 2004, 42, 477–484. [Google Scholar] [CrossRef]
  53. Xiong, Z.; He, F.; Zhao, D.; Barnett, M.O. Immobilization of mercury in sediment using stabilized iron sulfide nanoparticles. Water Res. 2009, 43, 5171. [Google Scholar] [CrossRef] [PubMed]
Figure 1. Particle size distribution of the soil sample (a), Zeta-potentials of the biochar and soil B-soil samples (b), and FT-IR spectra of the biochar sample (c).
Ijerph 16 00764 g001
Figure 2. DOC concentration in DOM (a), FT-IR spectra of the DOM (b), and 3D-EEM spectra of DOM (c).
Ijerph 16 00764 g002
Figure 3. BPs (a) and DOM (b) equilibrium adsorption amount on the samples.
Ijerph 16 00764 g003
Figure 4. Effect of DOM with different degrees of decomposition on BPs adsorption on the samples.
Ijerph 16 00764 g004
Figure 5. Relation between BPs adsorption amount and the contact time.
Ijerph 16 00764 g005
Figure 6. Adsorption isotherms of soil (a), B-soil (b), soil+DOM (c), and B-soil+DOM (d).
Ijerph 16 00764 g006
Figure 7. The interaction between soil and DOM.
Ijerph 16 00764 g007
Table 1. Fitting parameters of the pseudo-second-order kinetic model.
Samplek2 (g·mg−1·min−1)h (mg·g−1·min−1)qe (mg·g−1)R2
Soil0.02460.13002.29990.9969
B-soil0.01700.14302.90110.9995
Soil + DOM0.05130.31042.45940.9999
B-soil + DOM0.05110.35712.64270.9999
Table 2. Fitting results of the Freundlich model.
SampleT (K)R2Kf1/nSampleT (K)R2Kf1/n
Soil2880.99960.53830.3411Soil + DOM2880.99550.58370.3293
2980.99800.55800.40612980.99290.60810.4036
3080.99190.59920.45123080.99640.61740.4397
B-soil2880.99960.64120.3037B-soil + DOM2880.99010.60320.3181
2980.99940.65560.35622980.99990.62980.3346
3080.99900.69590.38153080.99460.67120.4040
Table 3. Thermodynamic parameters for adsorption of BPs on the samples.
SampleC0 (mg·L−1)ΔH0 (kJ·mol−1)ΔS0 (J·mol−1·K−1)ΔG0 (kJ·mol−1)
308 K298 K288 K
Soil1020.5152114.4782−24.80672−23.46912−22.13144
2012.0577107.5530−24.21392−23.11512−22.01632
4010.704980.7331−21.56264−20.58496−19.60728
807.971186.6679−20.58432−19.70936−18.83448
B-soil1028.8197184.6734−48.591202−45.396238−35.510153
2017.0630139.3851−44.787105−42.375831−32.576592
4013.2305105.3929−41.946099−40.122852−30.384682
8010.885297.8035−40.227517−38.535577−29.123512
Soil + DOM1023.8728133.7623−27.84576−26.01408−24.1824
2015.6082109.8818−26.45488−24.73392−23.01312
4011.085797.7659−28.49872−26.884−25.26928
808.836187.4938−26.99296−25.6064−24.21968
B-soil+DOM1025.1692166.2061−39.32236−36.73684−28.73654
20116.2261125.4466−36.2439−34.29258−26.36256
4012.3845100.1233−33.94482−32.46936−24.58876
809.506988.0232−32.55406−31.18486−23.56816

