All Insecure, All Good? Job Insecurity Profiles in Relation to Career Correlates


Abstract
:1. Introduction
1.1. Profiles of Felt Job Insecurity
1.2. Career Correlates
2. Methods
2.1. Participants and Procedure
2.1.1. Sample 1
2.1.2. Sample 2
2.2. Measures
2.3. Preliminary Analysis
2.4. Latent Profile Analysis
2.5. Outcomes of Profile Membership
3. Results
3.1. Profiles of Felt Quantitative and Qualitative Job Insecurity
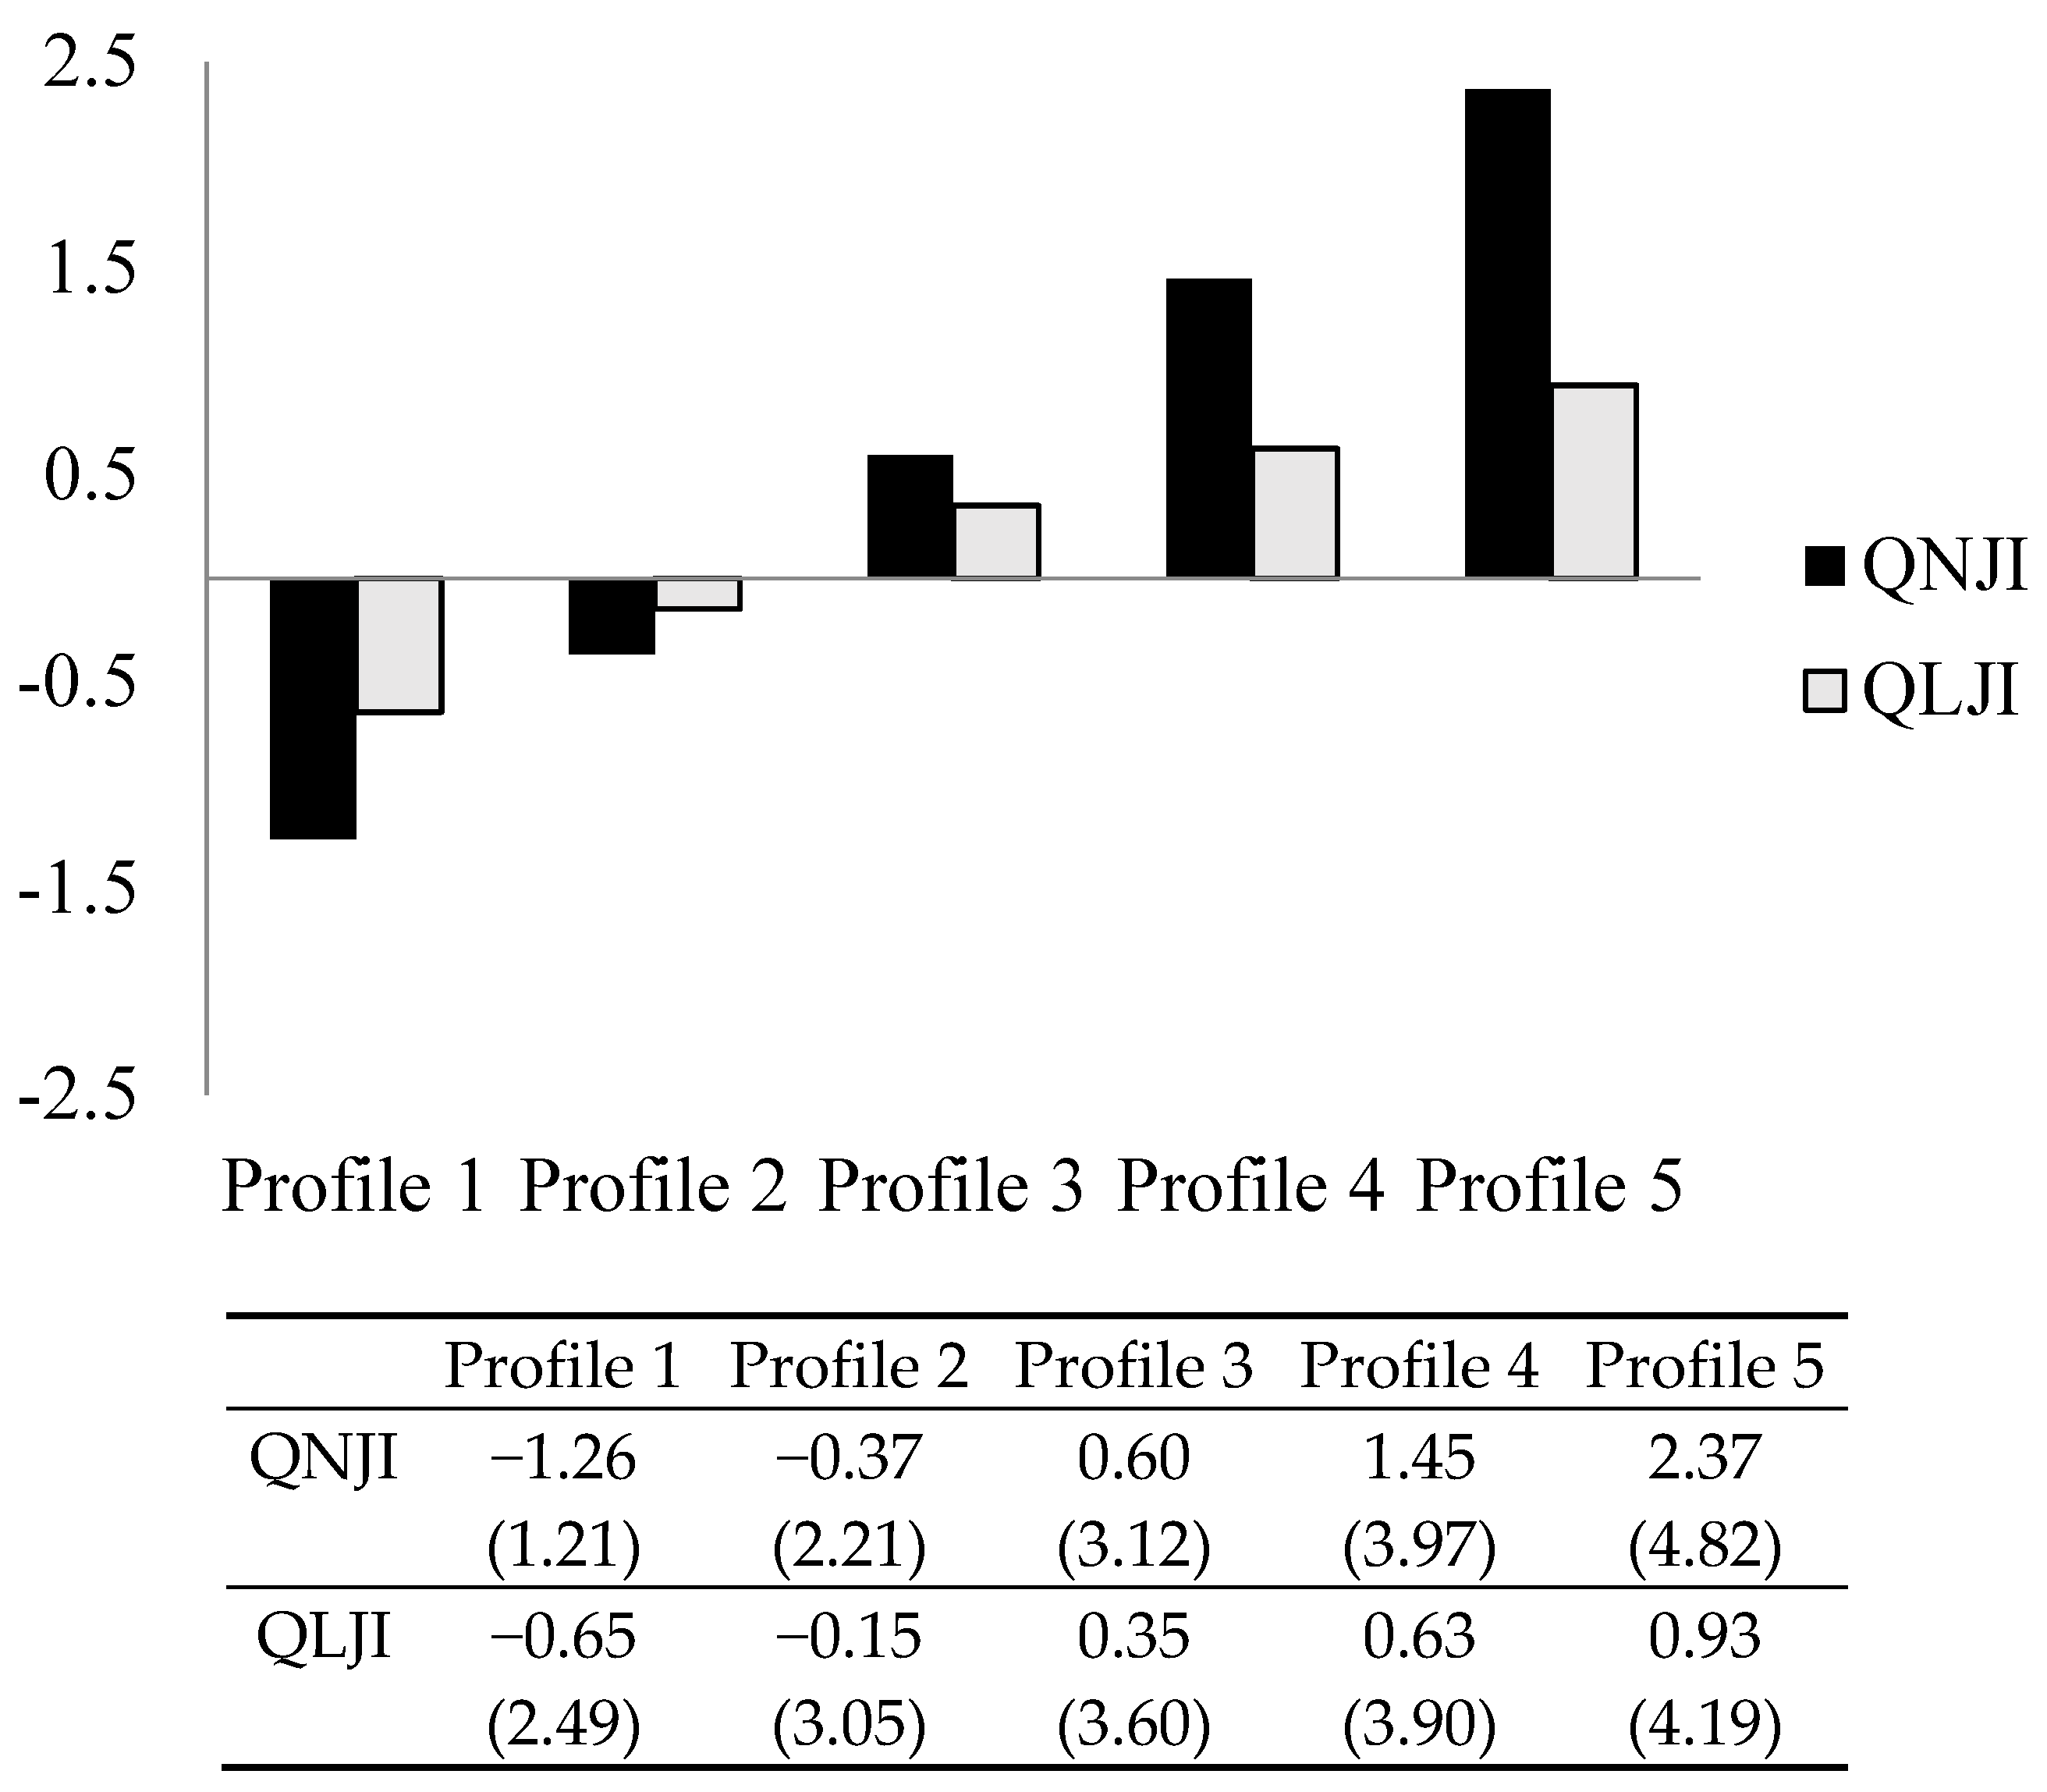
3.1.1. Sample 1
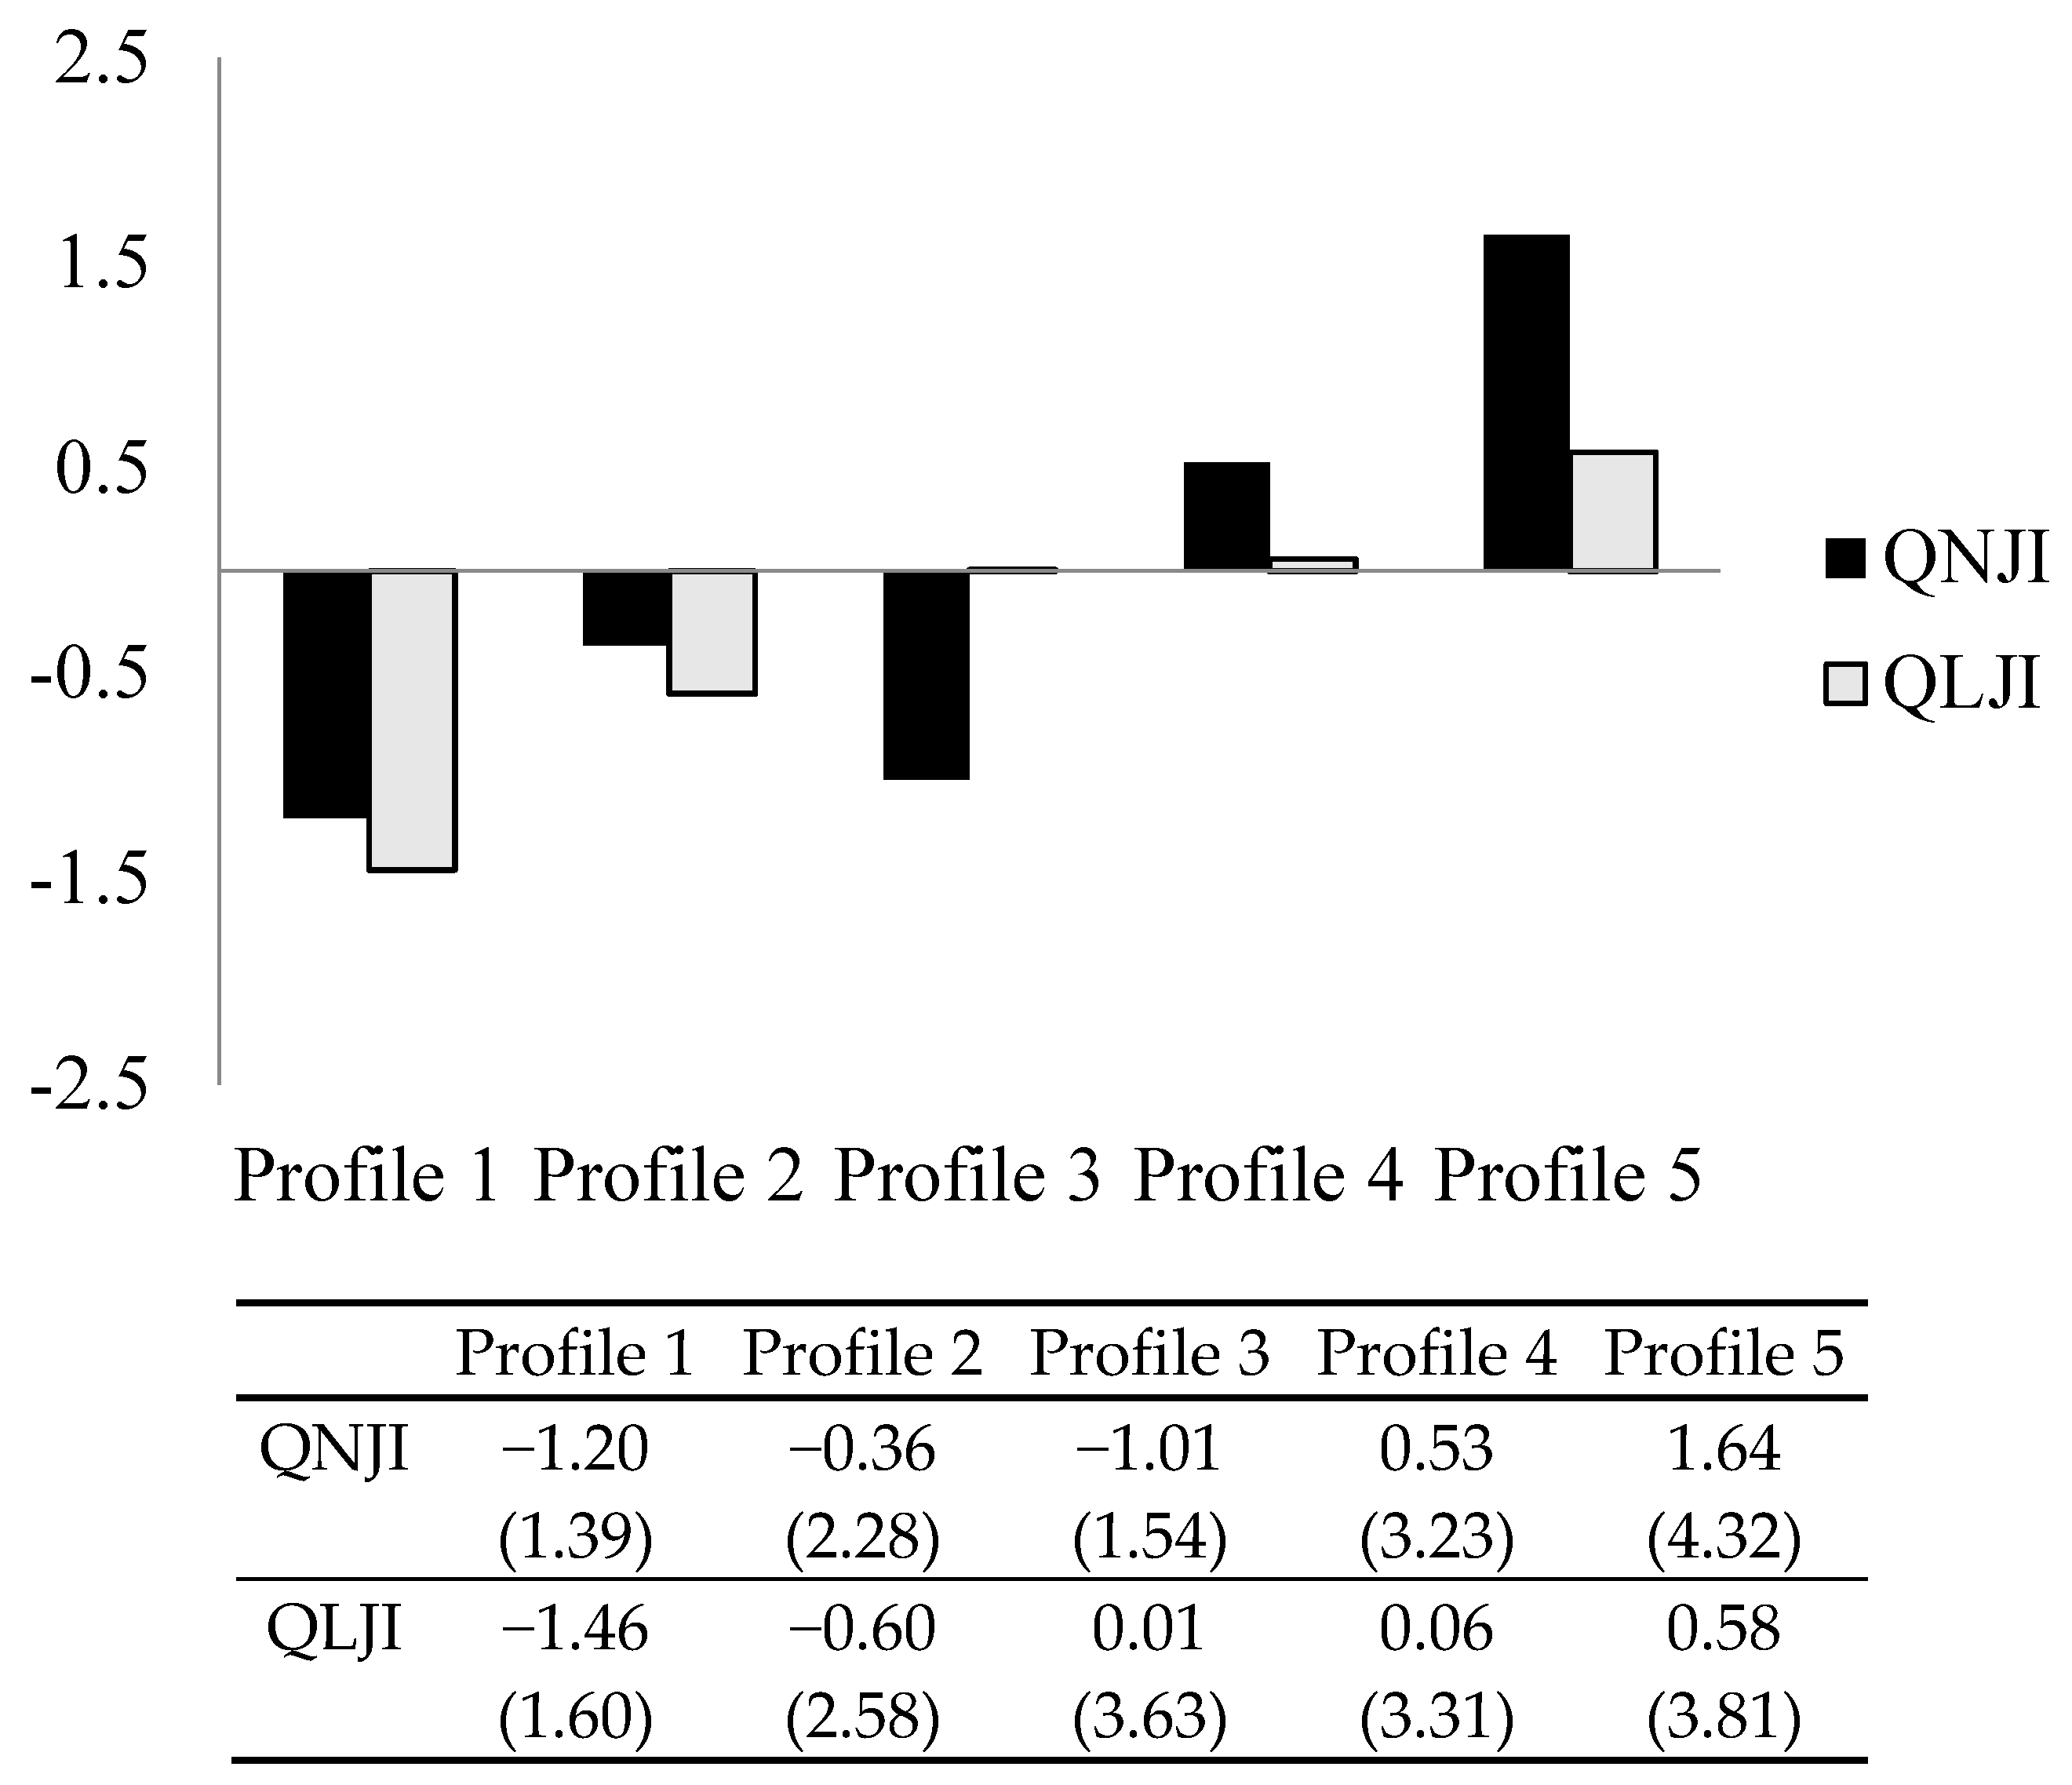
3.1.2. Sample 2
3.2. Differences between Profiles in Terms of Career Correlates
3.2.1. Sample 1
3.2.2. Sample 2
4. Discussion
Strengths and Limitations
5. Conclusions
Author Contributions
Funding
Acknowledgments
Conflicts of Interest
Appendix A

| Sample/Classes | AIC | BIC | aBIC | Entropy | VLMR (p) | LMR (p) | BLRT (p) | Min. N | Max. N | Min. Prob. | Max. Prob. |
|---|---|---|---|---|---|---|---|---|---|---|---|
| Sample 1 | |||||||||||
| 1 | 12,422.65 | 12,445.7 1 | 12,433.00 | NA | NA | NA | NA | 2355 | 2355 | 1 | 1 |
| 2 | 11,539.81 | 11,580.16 | 11,557.92 | 0.72 | 0.00 | 0.00 | 0.00 | 872 | 1483 | 0.89 | 0.94 |
| 3 | 11,183.40 | 11,241.05 | 11,209.27 | 0.68 | 0.00 | 0.00 | 0.00 | 527 | 1124 | 0.83 | 0.86 |
| 4 | 11,051.83 | 11,126.77 | 11,085.47 | 0.76 | 0.00 | 0.00 | 0.00 | 246 | 1071 | 0.77 | 0.90 |
| 5 | 10,571.67 | 10,663.90 | 10,613.07 | 0.94 | 0.00 | 0.00 | 0.00 | 116 | 882 | 0.92 | 0.98 |
| 6 | 10,429.62 | 10,539.14 | 10,478.78 | 0.91 | 0.00 | 0.00 | 0.00 | 116 | 877 | 0.74 | 0.98 |
| Sample 2 | |||||||||||
| 1 | 18,240.29 | 18,265.16 | 18,252.45 | NA | NA | NA | NA | 3703 | 3703 | 1 | 1 |
| 2 | 16,710.64 | 16,754.16 | 16,731.92 | 0.75 | 0.00 | 0.00 | 0.00 | 1002 | 2701 | 0.86 | 0.96 |
| 3 | 16,153.69 | 16,215.86 | 16,184.08 | 0.70 | 0.00 | 0.00 | 0.00 | 401 | 1663 | 0.82 | 0.87 |
| 4 | 15,544.36 | 15,625.18 | 15,583.87 | 0.89 | 0.00 | 0.00 | 0.00 | 184 | 1472 | 0.93 | 0.95 |
| 5 | 15,228.84 | 15,328.31 | 15,277.47 | 0.92 | 0.00 | 0.00 | 0.00 | 65 | 1422 | 0.93 | 0.97 |
| 6 | 14,996.90 | 15,115.02 | 15,054.65 | 0.89 | 0.00 | 0.00 | 0.00 | 65 | 1393 | 0.65 | 0.95 |
References
- De Witte, H. Job Insecurity and Psychological Well-being: Review of the Literature and Exploration of Some Unresolved Issues. Eur. J. Work Organ. Psychol. 1999, 8, 155–177. [Google Scholar] [CrossRef]
- De Witte, H.; Pienaar, J.; De Cuyper, N. Review of 30 Years of Longitudinal Studies on the Association between Job Insecurity and Health and Well-Being: Is There Causal Evidence? Aust. Psychol. 2016, 51, 18–31. [Google Scholar] [CrossRef]
- De Cuyper, N.; De Witte, H. The Impact of Job Insecurity and Contract Type on Attitudes, Well-being and Behavioral Reports. J. Occup. Organ. Psychol. 2006, 79, 395–409. [Google Scholar] [CrossRef]
- Hall, D.T. The Protean Career: A Quarter-Century Journey. J. Vocat. Behav. 2004, 65, 1–13. [Google Scholar] [CrossRef]
- Arthur, M.B. The Boundaryless Career: A New Perspective for Organizational Inquiry. J. Organ. Behav. 1994, 15, 295–306. [Google Scholar] [CrossRef]
- Bennett, N.; Lemoine, J. What VUCA Really Means for You. Harvard Bus. Rev. 2014, 92, 27. [Google Scholar]
- Shoss, M.K. Job insecurity: An Integrative Review and Agenda for Future Research. J. Manag. 2017, 43, 1911–1939. [Google Scholar] [CrossRef]
- Briscoe, J.P.; Henagan, S.C.; Burton, J.P.; Murphy, W.M. Coping with an Insecure Employment Environment: The Differing Roles of Protean and Boundaryless Career Orientations. J. Vocat. Behav. 2012, 80, 308–316. [Google Scholar] [CrossRef]
- Otto, K.; Mohr, G.; Kottwitz, M.U.; Korek, S. The Joint Impact of Microeconomic Parameters and Job Insecurity Perceptions on Commitment towards one’s Job, Occupation and Career: A Multilevel Approach. Econ. Ind. Democr. 2016, 37, 43–71. [Google Scholar] [CrossRef]
- Greenhalgh, L.; Rosenblatt, Z. Job Insecurity: Towards Conceptual Clarity. Acad. Manag. Rev. 1984, 9, 438–448. [Google Scholar] [CrossRef]
- Hellgren, J.; Sverke, M.; Isaksson, K. A Two-dimensional Approach to Job Insecurity: Consequences for Employee Attitudes and Well-being. Eur. J. Work Org. Psychol. 1999, 8, 179–195. [Google Scholar] [CrossRef]
- Vander Elst, T.; Richter, A.; Sverke, M.; Naswall, K.; De Cuyper, N.; De Witte, H. Threat of Losing Valued Job Features: The Role of Perceived Control in Mediating the Effect of Qualitative Job Insecurity on Job Strain and Psychological Withdrawal. Work Stress 2014, 28, 143–164. [Google Scholar] [CrossRef]
- Callea, A.; Lo Presti, A.; Mauno, S.; Urbini, F. The Associations between Quantitative/Qualitative Job Insecurity and Well-Being: The Role of Self-Esteem. Int. J. Stress Manag. 2019, 26, 46–56. [Google Scholar] [CrossRef]
- Chirumbolo, A.; Urbini, F.; Callea, A.; Lo Presti, A.; Talamo, A. Occupations at Risk and Organizational Well-Being: An Empirical Test of a Job Insecurity Integrated Model. Front. Psychol. 2017, 8, 1–13. [Google Scholar] [CrossRef] [PubMed]
- Kinnunen, U.; Mäkikangas, A.; Mauno, S.; De Cuyper, N.; De Witte, H. Development of Perceived Job Insecurity across Two Years: Associations with Antecedents and Employee Outcomes. J. Occup. Health Psychol. 2014, 19, 243–258. [Google Scholar] [CrossRef] [PubMed]
- Staufenbiel, T.; König, C.J. A Model for the Effects of Job Insecurity on Performance, Turnover Intention, and absenteeism. J. Occup. Organ. Psychol. 2010, 83, 101–117. [Google Scholar] [CrossRef]
- De Cuyper, N.; Mauno, S.; Mäkikangas, A.; Kinnunen, U.; De Witte, H. Cross-lagged Associations between Perceived Employability, Job Insecurity and Exhaustion: Testing Gain and Loss Spirals according to COR Theory. J. Organ. Behav. 2012, 33, 770–788. [Google Scholar] [CrossRef]
- Arnold, J. Nineteen Propositions concerning the Nature of Effective Thinking for Career Management in a Turbulent World. Br. J. Guid. Couns. 1997, 25, 447–462. [Google Scholar] [CrossRef]
- Sturges, J.; Guest, D.; Conway, N.; Davey, K.M. A Longitudinal Study of the Relationship between Career Management and Organizational Commitment among Graduates in the First Ten Years at Work. J. Organ. Behav. 2002, 23, 731–748. [Google Scholar] [CrossRef]
- De Vos, A.; Cambre, B. Career Management in High-Performing Organizations: A Set-Theoretic Approach. Hum. Resour. Manag. 2017, 56, 501–518. [Google Scholar] [CrossRef]
- Jung, Y.; Takeuchi, N. A Lifespan Perspective for Understanding Career Self-Management and Satisfaction: The Role of Developmental Human Resource Practices and Organizational Support. Hum. Relat. 2018, 1, 73–102. [Google Scholar] [CrossRef]
- Guan, Y.J.; Zhou, W.X.; Ye, L.H.; Jiang, P.; Zhou, Y.X. Perceived Organizational Career Management and Career Adaptability as Predictors of Success and Turnover Intention. J. Vocat. Behav. 2015, 88, 230–238. [Google Scholar] [CrossRef]
- Valero, D.; Hirschi, A. Latent Profiles of Work Motivation in Adolescents in Relation to Work Expectations, Goal Engagement, and Changes in Work Experiences. J. Vocat. Behav. 2016, 93, 67–80. [Google Scholar] [CrossRef]
- Bernhard-Oettel, C.; De Cuyper, N.; Murphy, M.; Connelly, C. How do we feel and behave when we’re not permanent full-time employees? The case of the diverse forms of non-standard work. In An Introduction to Work and Organizational Psychology: An International Perspective, 3rd ed.; Chmiel, N., Fraccaroli, F., Magnus, S., Eds.; John Wiley & Sons Limited: West Sussex, UK, 2017; pp. 258–275. ISBN 978-1-119-16802-7. [Google Scholar]
- Callanan, G.A.; Perri, D.F.; Tomkowicz, S.M. Career Management in Uncertain Times: Challenges and Opportunities. Career Dev. Q. 2017, 65, 353–365. [Google Scholar] [CrossRef]
- Hobfoll, S.E.; Halbesleben, J.; Neveu, J.-P.; Westman, M. Conservation of Resources in the Organizational Context: The Reality of Resources and Their Consequences. Annu. Rev. Organ. Psychol. Organ. Behav. 2018, 5, 103–128. [Google Scholar] [CrossRef] [Green Version]
- Drobnic, S.; Beham, B.; Prag, P. Good job, Good Life? Working Conditions and Quality of Life in Europe. Soc. Indic. Res. 2010, 99, 205–225. [Google Scholar] [CrossRef]
- Reisel, W.D.; Probst, T.M. Preface: Twenty-five Years of Studies of Job Insecurity. Int. Stud. Manag. Organ. 2010, 40, 3–5. [Google Scholar] [CrossRef]
- Baraldi, S.; Kalyal, H.J.; Berntson, E.; Naswall, K.; Sverke, M. The Importance of Commitment to Change in Public Reform: An Example from Pakistan. J. Chang. Manag. 2010, 10, 347–368. [Google Scholar] [CrossRef]
- Kang, D.S.; Gold, J.; Kim, D. Responses to Job Insecurity: The Impact on Discretionary Extra-Role and Impression Management Behaviors and the Moderating Role of Employability. Career Dev. Int. 2012, 17, 314–332. [Google Scholar] [CrossRef]
- Iliescu, D.; Macsinga, I.; Sulea, C.; Fischmann, G.; Vander Elst, T.; De Witte, H. The Five-Factor Traits as Moderators between Job Insecurity and Health: A Vulnerability-Stress Perspective. Career Dev. Int. 2017, 22, 399–418. [Google Scholar] [CrossRef]
- Lastad, L.; Berntson, E.; Naswall, K.; Lindfors, P.; Sverke, M. Measuring Quantitative and Qualitative Aspects of the Job Insecurity Climate Scale Validation. Career Dev. Int. 2015, 20, 202–217. [Google Scholar] [CrossRef]
- Kovalenko, M.; Mortelmans, D. Contextualizing employability: Do Boundaries of Self-Directedness Vary in Different Labor Market Groups? Career Dev. Int. 2016, 21, 498–517. [Google Scholar] [CrossRef]
- Verbruggen, M.; De Vos, A. When People don’t Realize Their Career Desires: Towards a Theory of Career Inaction. Acad. Manag. Rev. 2019. [Google Scholar] [CrossRef]
- Forrier, A.; De Cuyper, N.; Akkermans, J. The Winner Takes it all, the Loser has to Fall: Provoking the Agency Perspective in Employability Research. Hum. Resour. Man. J. 2018, 28, 511–523. [Google Scholar] [CrossRef]
- Spurk, D.; Kauffeld, S.; Meinecke, A.L.; Ebner, K. Why Do Adaptable People Feel Less Insecure? Indirect Effects of Career Adaptability on Job and Career Insecurity Via Two Types of Perceived Marketability. J. Career Assess. 2016, 24, 289–306. [Google Scholar] [CrossRef]
- Kirves, K.; De Cuyper, N.; Kinnunen, U.; Nätti, J. Perceived Job Insecurity and Perceived Employability in Relation to Temporary and Permanent Workers’ Psychological Symptoms: A Two Samples Study. Int. Arch. Occup. Environ. Health. 2011, 84, 899–909. [Google Scholar] [CrossRef]
- De Cuyper, N.; Bernhard-Oettel, C.; Berntson, E.; De Witte, H.; Alarco, B. Employability and Employees’s Well-being: Mediation by Job Insecurity. App. Psychol. Int. Rev. 2008, 57, 488–509. [Google Scholar] [CrossRef]
- Wang, X.M.; Zheng, Q.Q.; Huang, Z.J.; Chen, H.J. Effect of Construal Level and Job Insecurity on Responses to Perceived External Employability. Soc. Behav. Personal. 2018, 46, 1352–1372. [Google Scholar] [CrossRef]
- Sora, B.; Caballer, A.; Peiro, J.M. The Consequences of Job Insecurity for Employees. The Moderator Role of Job Dependence. Int. Labour Rev. 2010, 149, 59–72. [Google Scholar] [CrossRef]
- Fontinha, R.; De Cuyper, N.; Williams, S.; Scott, P. The Impact of HRM, Perceived Employability and Job Insecurity on Self-initiated Expatriates’ Adjustment to the Host Country. Thunderbird Int. Bus. Rev. 2018, 60, 861–871. [Google Scholar] [CrossRef]
- De Cuyper, N.; Piccoli, B.; Fontinha, R.; De Witte, H. Job Insecurity, Employability and Satisfaction among Temporary and Permanent Employees in Post-Crisis Europe. Econ. Ind. Democr. 2019, 40, 173–192. [Google Scholar] [CrossRef]
- De Witte, H. Arbeidsethos en jobonzekerheid: Meting en gevolgen voor welzijn, tevredenheid en inzet op het werk [Work ethic and job insecurity: Assessment and consequences for well-being, satisfaction and performance at work]. In Van Groep naar Gemeenschap [From Group to Community]. Liber Amicorum Prof. Dr. Leo Lagrou; Bouwen, R., De Witte, K., De Witte, H., Taillieu, T., Eds.; Garant: Leuven, Belgium, 2000; pp. 325–350. [Google Scholar]
- Vander Elst, T.; De Witte, H.; De Cuyper, N. The Job Insecurity Scale: A Psychometric Evaluation across Five European Countries. Eur. J. Work Organ. Psychol. 2014, 23, 364–380. [Google Scholar] [CrossRef]
- De Witte, H.; De Cuyper, N.; Handaja, Y.; Sverke, M.; Näswall, K.; Hellgren, J. Associations between Quantitative and Qualitative Job Insecurity and Well-Being. Int. Stud. Manag. Organ. 2010, 40, 40–56. [Google Scholar] [CrossRef]
- De Cuyper, N.; Sulea, C.; Philippaers, K.; Fischmann, G.; Iliescu, D.; De Witte, H. Perceived Employability and Performance: Moderation by Felt Job Insecurity. Pers. Rev. 2014, 43, 536–552. [Google Scholar] [CrossRef]
- Van Hootegem, A.; De Witte, H.; De Cuyper, N.; Elst, T.V. Job Insecurity and the Willingness to Undertake Training: The Moderating Role of Perceived Employability. J. Career Dev. 2018. [Google Scholar] [CrossRef]
- De Cuyper, N.; De Witte, H. The Management Paradox: Self-rated Employability and Organisational Commitment and Performance. Pers. Rev. 2011, 40, 152–172. [Google Scholar] [CrossRef]
- Meyer, J.P.; Morin, A.J.S. A Person-Centered Approach to Commitment Research: Theory, Research, and Methodology. J. Organ. Behav. 2016, 37, 584–612. [Google Scholar] [CrossRef]
- Morin, A.J.S.; Meyer, J.P.; Creusier, J.; Biétry, F. Multiple-Group Analysis of Similarity in Latent Profile Solutions. Organ. Res. Methods 2016, 19, 231–254. [Google Scholar] [CrossRef]
- Fouquereau, E.; Morin, A.J.S.; Lapointe, É.; Mokounkolo, R.; Gillet, N. Emotional Labor Profiles: Associations with Key Predictors and Outcomes. Work Stress 2018, 33, 1–27. [Google Scholar] [CrossRef]
- Lubke, G.H.; Muthén, B. Investigating Population Heterogeneity with Factor Mixture Models. Psychol. Methods 2005, 10, 21–39. [Google Scholar] [CrossRef]
- Nylund, K.L.; Asparouhov, T.; Muthén, B.O. Deciding on the Number of Classes in Latent Class Analysis and Growth Mixture Modeling: A Monte Carlo Simulation Study. Struct. Equ. Model. 2007, 14, 535–569. [Google Scholar] [CrossRef]
- Morgan, G.B. Mixed Mode Latent Class Analysis: An Examination of Fit Index Performance for Classification. Struct. Equ. Model. 2015, 22, 76–86. [Google Scholar] [CrossRef]
- Vermunt, J.K.; Magidson, J. Latent Class Cluster Analysis. In Applied Latent Class Analysis; Hagenaars, J., McCutcheon, A., Eds.; Cambridge University Press: Cambridge, UK, 2002; pp. 89–106. [Google Scholar] [CrossRef] [Green Version]
- Wickrama, K.A.S.; Lee, T.K.; O’Neal, C.W.; Lorenz, F.O. Higher-Order Growth Curves and Mixture Modeling with Mplus: A Practical Guide; Routledge: Abingdon-on-Thames, UK, 2016. [Google Scholar]
- Clark, S.L.; Muthén, B.; Muthen, B. Relating Latent Class Analysis Results to Variables Not Included in the Analysis; University of California: Los Angeles, CA, USA, 2009. [Google Scholar]
- Berlin, K.S.; Williams, N.A.; Parra, G.R. An Introduction to Latent Variable Mixture Modeling (Part 1): Overview and Cross-Cectional Latent Class and Latent Profile Analyses. J. Pediatr. Psychol. 2014, 39, 174–187. [Google Scholar] [CrossRef]
- Asparouhov, T.; Muthén, B. Auxiliary variables in mixture modeling: Using the BCH method in Mplus to estimate a distal outcome model and an arbitrary secondary model. Mplus Web Notes 2014, 21, 1–22. [Google Scholar]
- Vermunt, J.K. Latent class modeling with covariates: Two improved three-step approaches. Polit. Anal. 2010, 18, 450–469. [Google Scholar] [CrossRef]
- Bakk, Z.; Vermunt, J.K. Robustness of stepwise latent class modeling with continuous distal outcomes. Struct. Equ. Model. A Multidiscip. J. 2016, 23, 20–31. [Google Scholar] [CrossRef]
- Becker, T.E.; Atinc, G.; Breaugh, J.A.; Carlson, K.D.; Edwards, J.R.; Spector, P.E. Statistical Control in Correlational Studies: 10 Essential Recommendations for Organizational Researchers. J. Organ. Behav. 2016, 37, 157–167. [Google Scholar] [CrossRef]
- Biemann, T.; Fasang, A.E.; Grunow, D. Do Economic Globalization and industry growth destabilize careers? An analysis of career complexity and career patterns over time. Organ. Stud. 2011, 32, 1639–1663. [Google Scholar] [CrossRef]
- Hollister, M. Employment Stability in the US Labor Market: Rhetoric versus Reality. Annu. Rev. Sociol. 2011, 37, 305–324. [Google Scholar] [CrossRef]
- Probst, T. Development and Validation of the Job Security Index and Job Security Satisfaction Scale: A Classic Test Theory and IRT Approach. J. Occup. Organ. Psychol. 2003, 76, 451–467. [Google Scholar] [CrossRef]


| Variables | Means | SD | 1 | 2 | 3 |
|---|---|---|---|---|---|
| 1. Felt quantitative job insecurity | 2.50 | 1.04 | (0.93) | ||
| 2. Felt qualitative job insecurity | 3.21 | 0.97 | 0.52 ** | (0.90) | |
| 3. Perceived employability | 3.35 | 1.07 | −0.27 ** | −0.29 ** | (0.97) |
| Variables | Means | SD | 1 | 2 | 3 | 4 | 5 | 6 | 7 |
|---|---|---|---|---|---|---|---|---|---|
| 1. Felt quantitative job insecurity | 2.22 | 0.87 | (0.85) | ||||||
| 2. Felt qualitative job insecurity | 2.52 | 1.03 | 0.54 ** | (0.91) | |||||
| 3. Perceived internal employability | 2.54 | 0.88 | −0.11 ** | −0.16 ** | (0.91) | ||||
| 4. Perceived external employability | 3.12 | 0.98 | −0.05 ** | −0.05 ** | 0.28 ** | (0.94) | |||
| 5. Formal CM practices | 3.14 | 0.80 | −0.14 ** | −0.29 ** | 0.27 ** | 0.04 * | (0.85) | ||
| 6. Informal CM practices | 2.36 | 0.94 | −0.09 ** | −0.26 ** | 0.30 ** | 0.06 ** | 0.66 ** | (0.88) | |
| 7. Networking | 2.81 | 0.78 | −0.07 ** | −0.11 ** | 0.23 ** | 0.23 ** | 0.31 ** | 0.36 ** | - |
| Study/Outcome | Profile 1 (A) | Profile 2 (B) | Profile 3 (C) | Profile 4 (D) | Profile 5 (E) | Chi-Square Overall Test (df = 4) |
|---|---|---|---|---|---|---|
| Sample 1 | ||||||
| Perceived employability | 0.42 (0.05) BCDE | 0.08 (0.04) ACDE | −0.23 (0.12) ABD | −0.44 (0.07) ABC | −0.44 (0.05) AB | 176.11 ** |
| Sample 2 | ||||||
| Perceived internal employability | 0.14 (0.03) BCDE | 0.03 (0.02) ACDE | −0.36 (0.09) ABD | −0.09 (0.03) ABCE | −0.31 (0.07) ABD | 61.51 ** |
| Perceived external employability | 0.06 (0.03) CD | 0.05 (0.03) CD | −0.29 (0.10) ABD | −0.08 (0.04) ABC | −0.07 (0.08) | 17.74 ** |
| OCM Formal | 0.21 (0.03) BCDE | 0.03 (0.02) ACDE | −0.53 (0.09) ABD | −0.12 (0.03) ABCE | −0.38 (0.07) ABD | 124.65 ** |
| OCM Informal | 0.14 (0.03) BCDE | 0.03 (0.02) ACDE | −0.47 (0.07) ABDE | −0.08 (0.03) ABCE | −0.25 (0.06) ABCD | 92.69 ** |
| ICM Networking | 0.11 (0.03) BCDE | 0.00 (0.02) AC | −0.27 (0.07) ABD | −0.07 (0.03) AC | −0.09 (0.07) A | 34.72 ** |
© 2019 by the authors. Licensee MDPI, Basel, Switzerland. This article is an open access article distributed under the terms and conditions of the Creative Commons Attribution (CC BY) license (http://creativecommons.org/licenses/by/4.0/).
Share and Cite
De Cuyper, N.; Van Hootegem, A.; Smet, K.; Houben, E.; De Witte, H. All Insecure, All Good? Job Insecurity Profiles in Relation to Career Correlates. Int. J. Environ. Res. Public Health 2019, 16, 2640. https://doi.org/10.3390/ijerph16152640
De Cuyper N, Van Hootegem A, Smet K, Houben E, De Witte H. All Insecure, All Good? Job Insecurity Profiles in Relation to Career Correlates. International Journal of Environmental Research and Public Health. 2019; 16(15):2640. https://doi.org/10.3390/ijerph16152640
Chicago/Turabian StyleDe Cuyper, Nele, Anahí Van Hootegem, Kelly Smet, Ellen Houben, and Hans De Witte. 2019. "All Insecure, All Good? Job Insecurity Profiles in Relation to Career Correlates" International Journal of Environmental Research and Public Health 16, no. 15: 2640. https://doi.org/10.3390/ijerph16152640