Implementation Efficiency of Corporate Social Responsibility in the Construction Industry: A China Study


Abstract
:1. Introduction
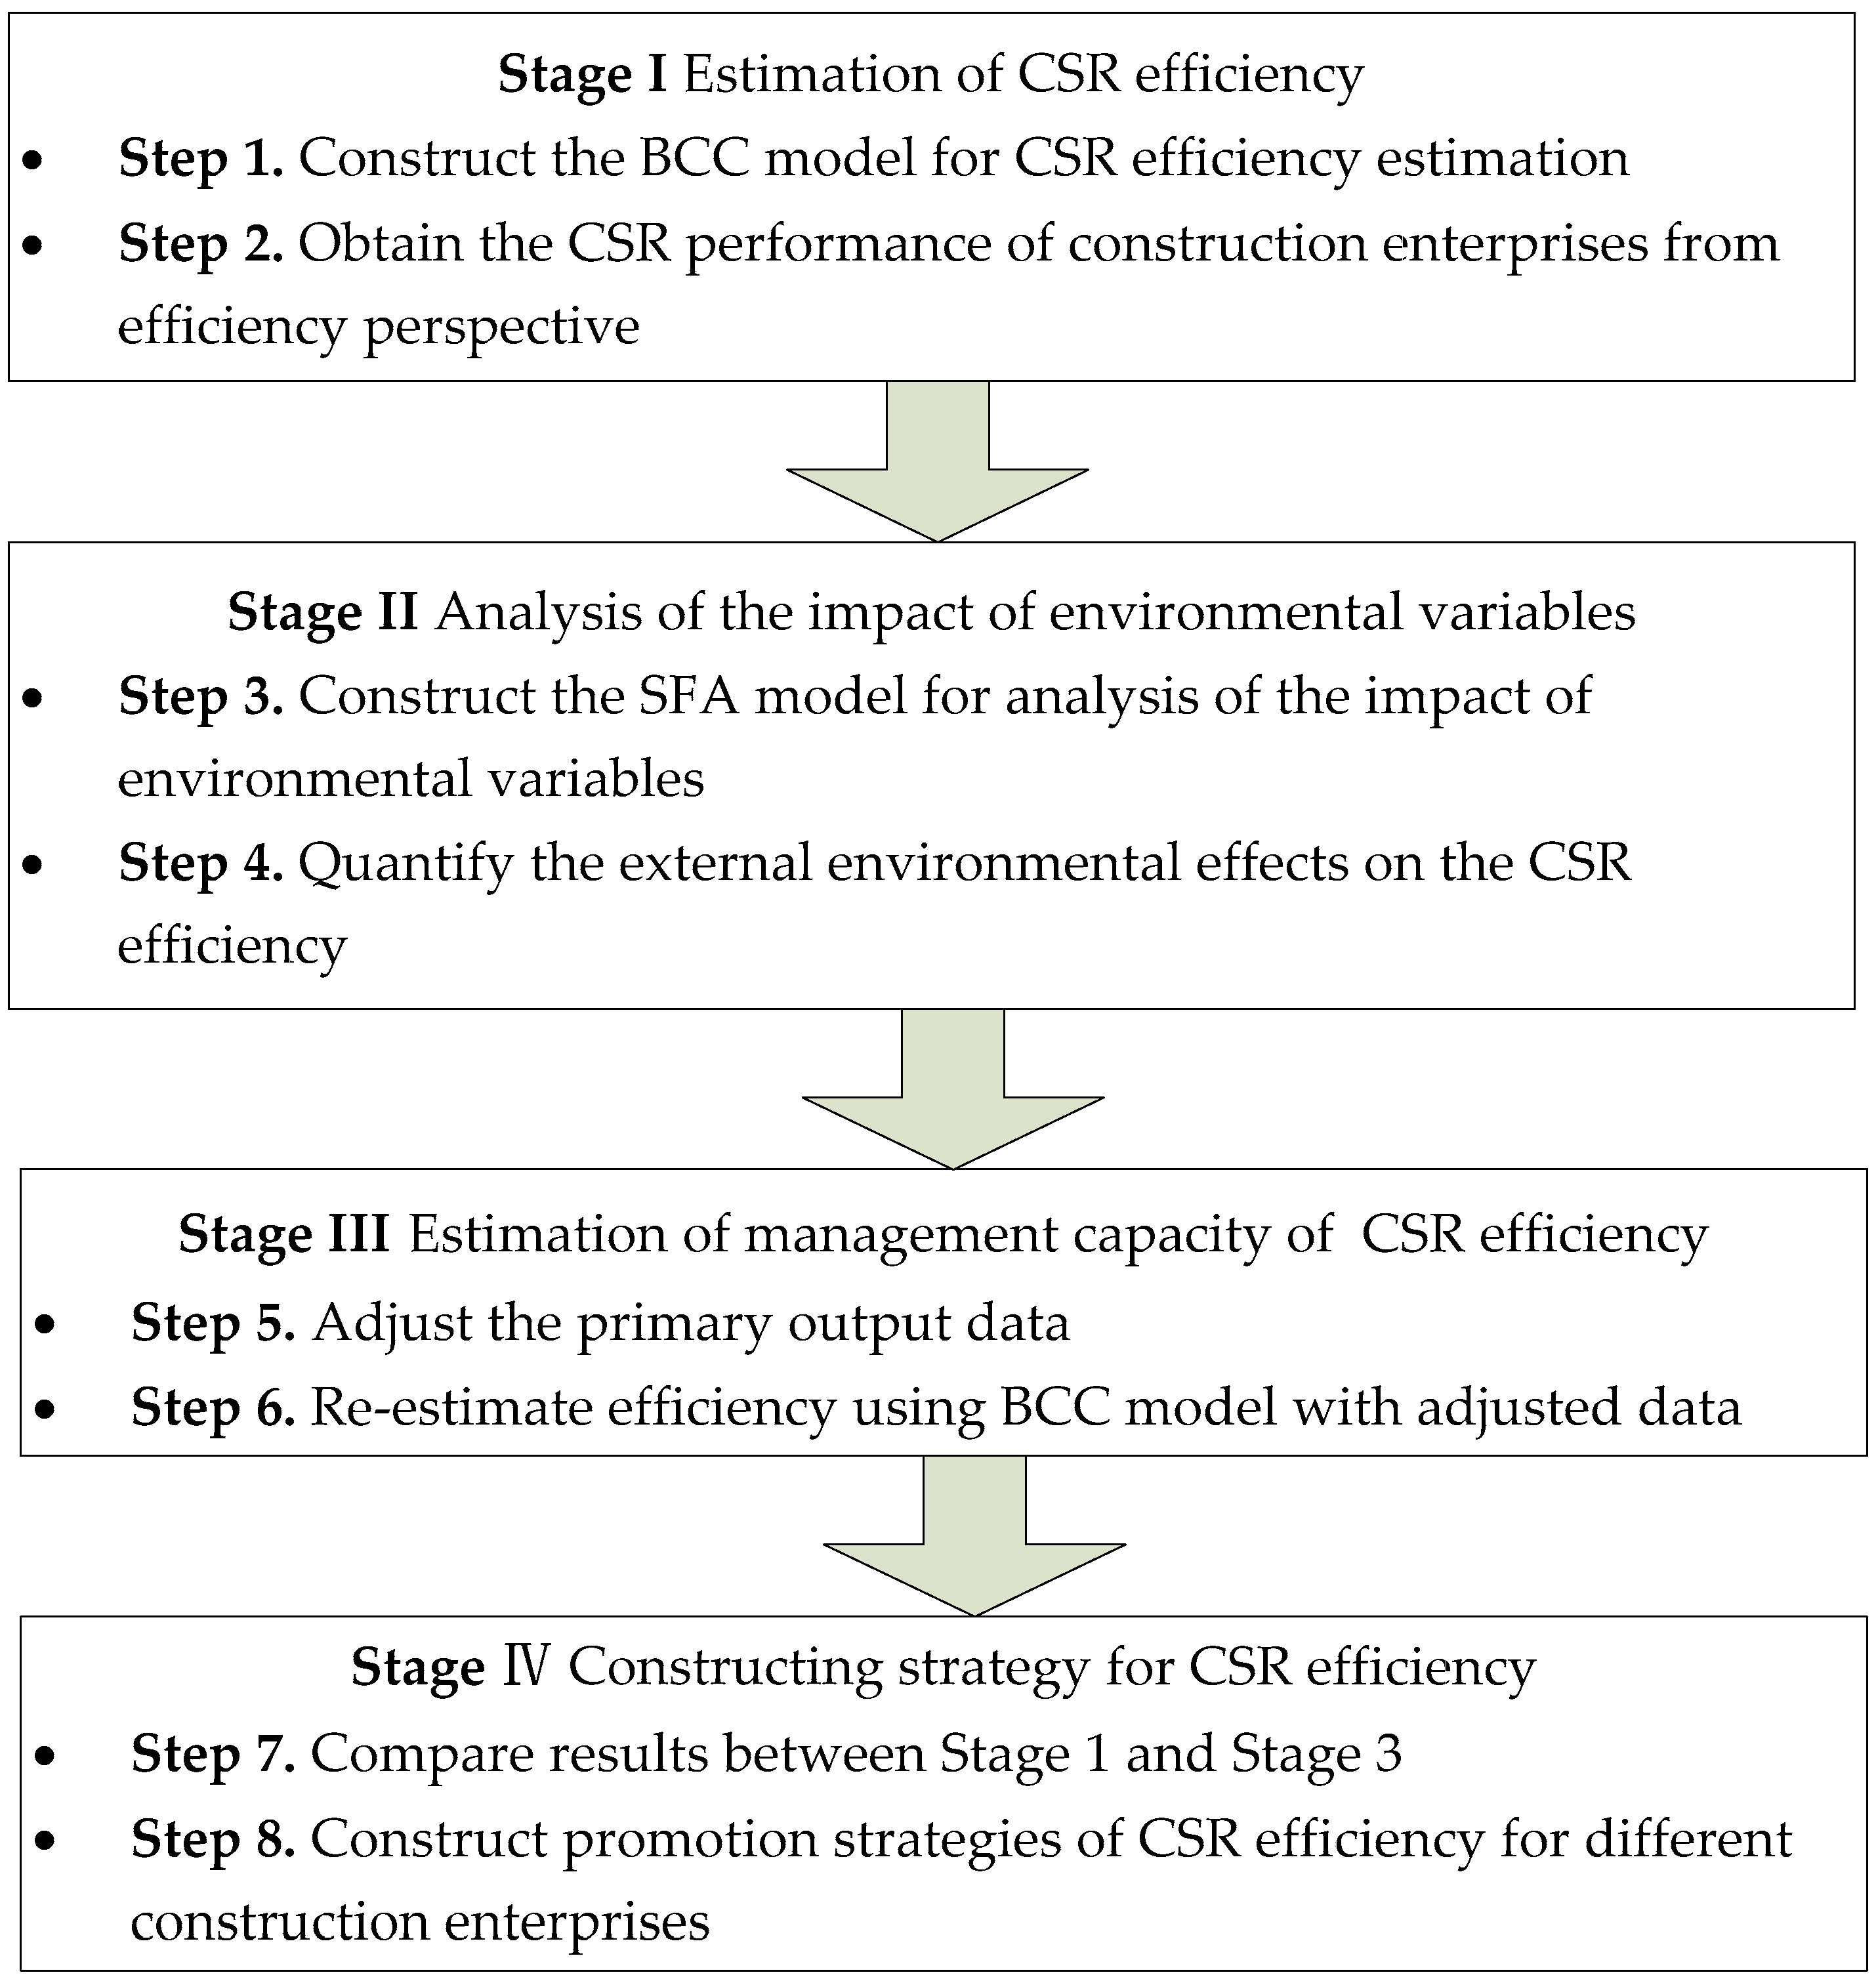
2. Methodology
2.1. Stage I: Output-Oriented BCC Model
2.2. Stage II: SFA Model
2.3. Stage III: The Adjusted BCC Model
3. Empirical Study
3.1. Sample Collection
3.2. Input Variable and Output Variable
3.3. External Institutional Environmental Factors
4. Results and Discussion
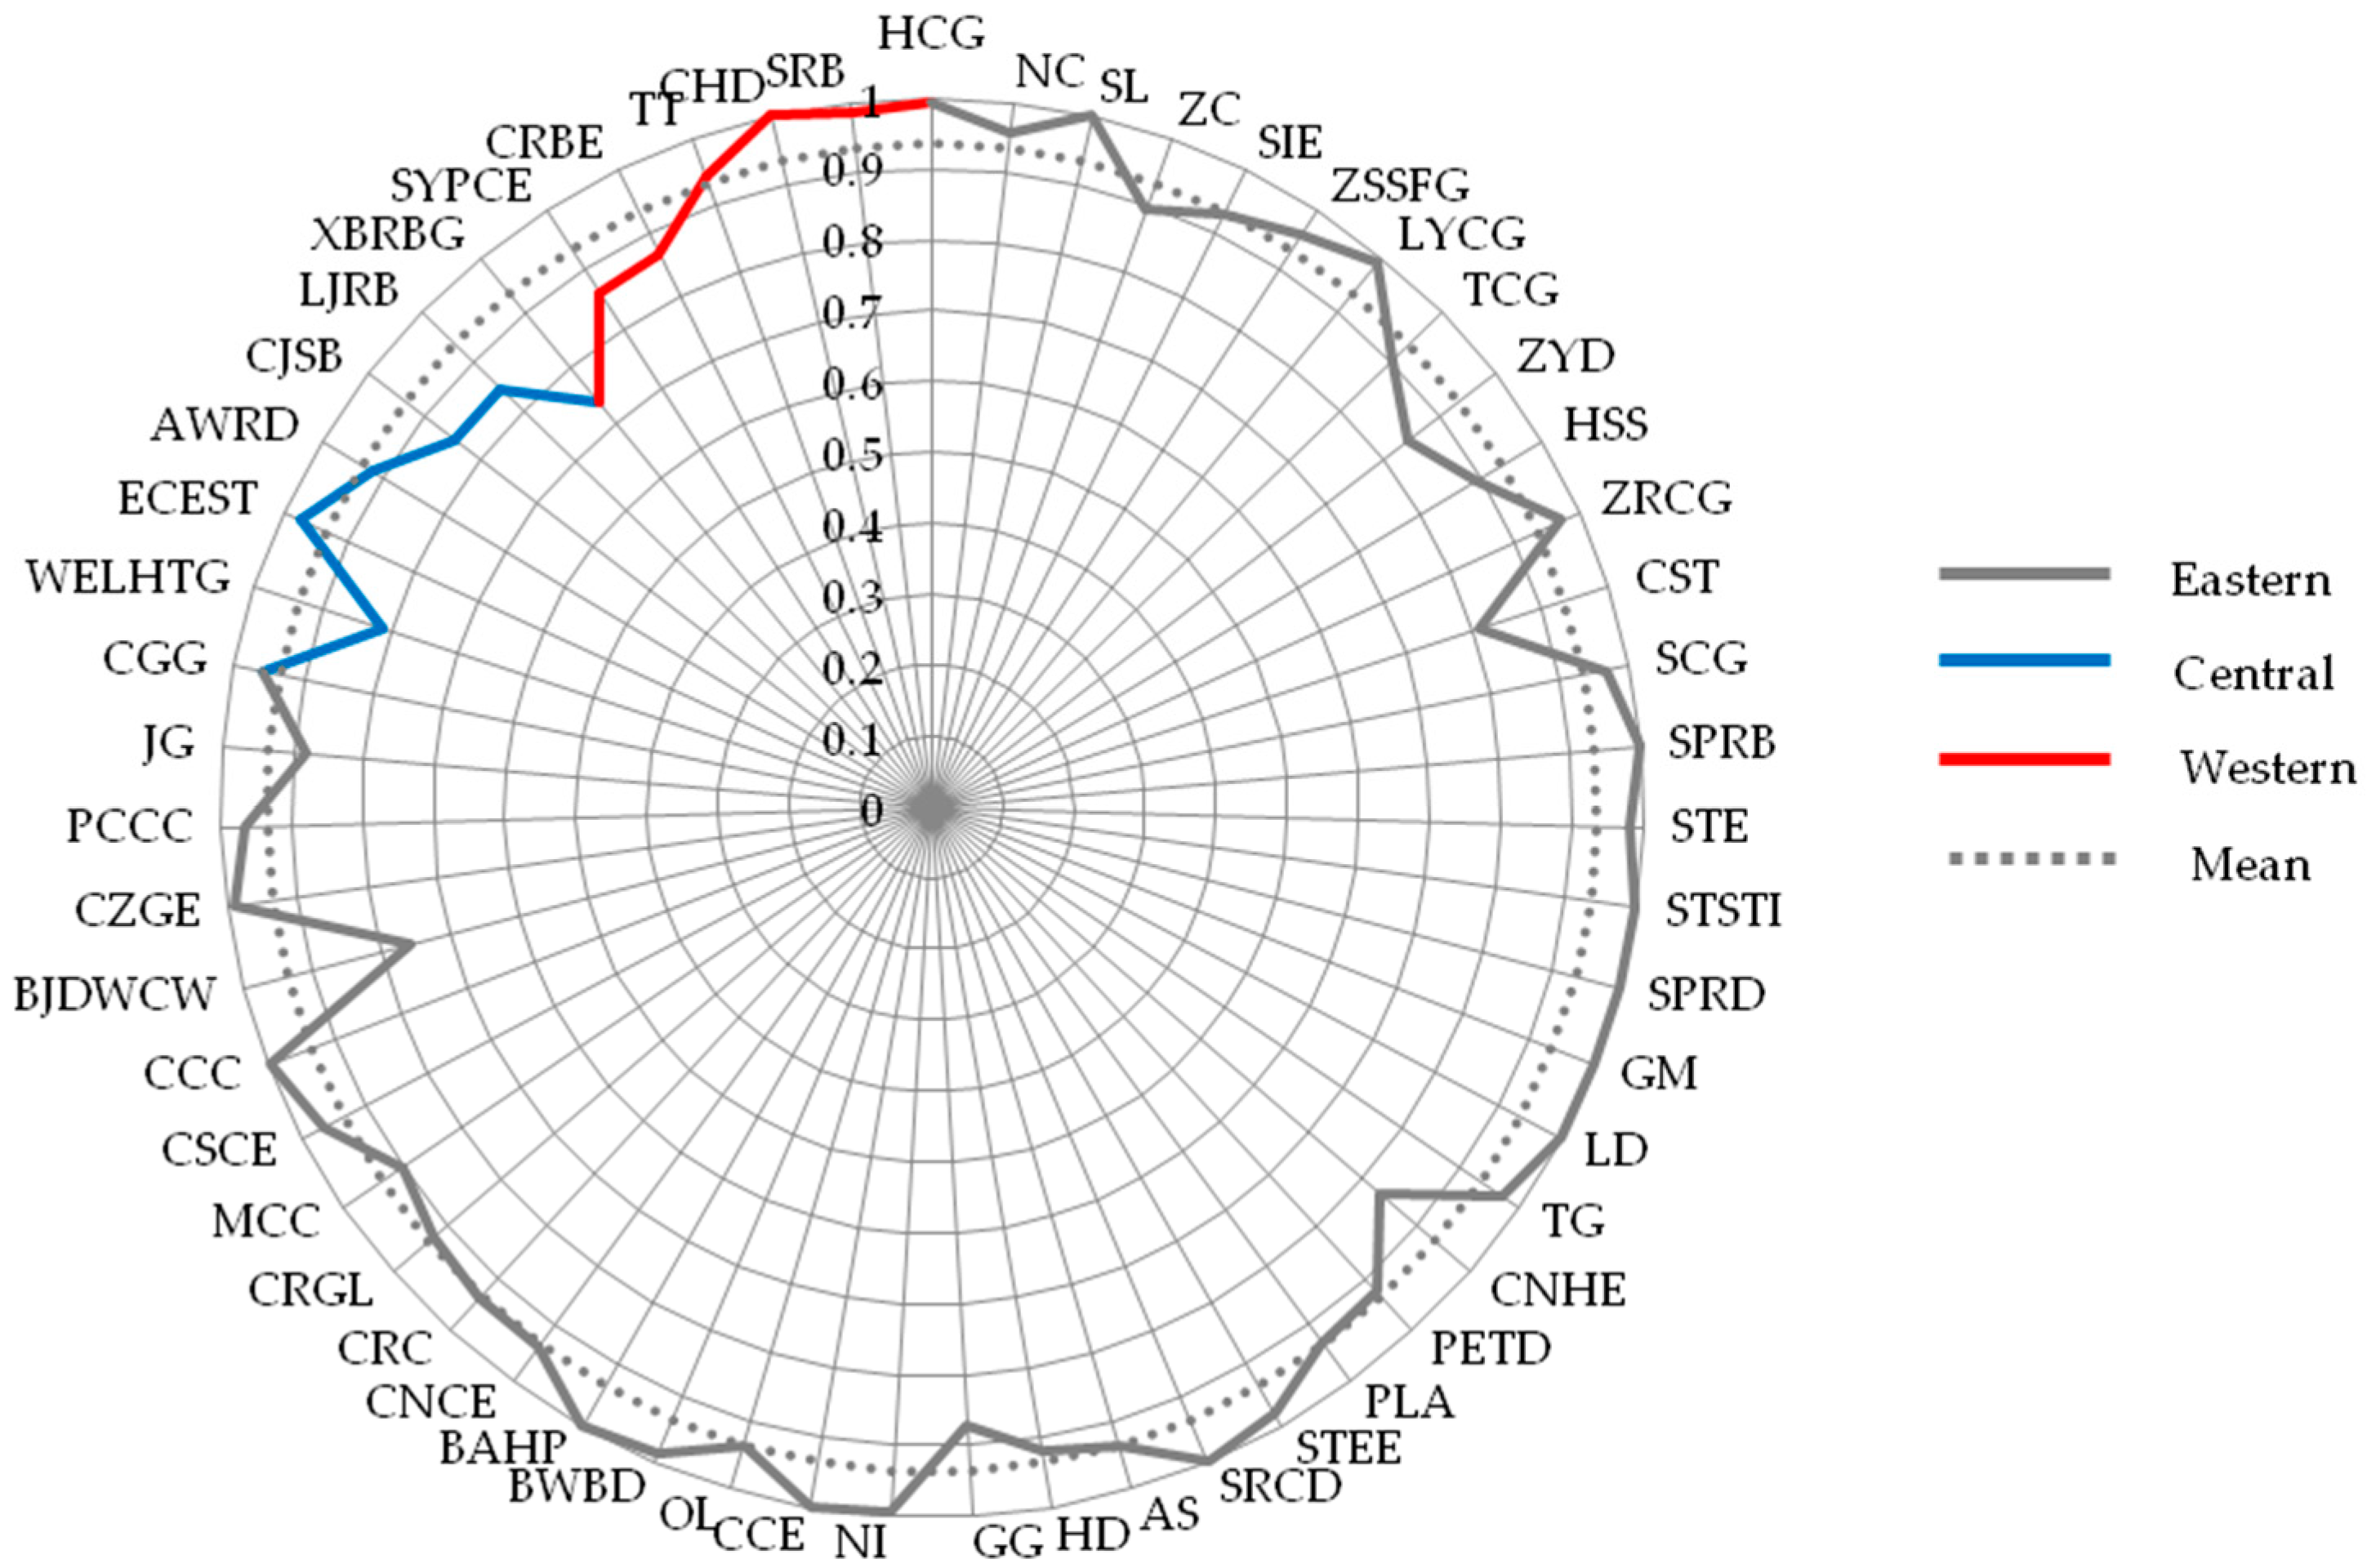
4.1. Stage I: Efficiency Based on BCC Model
4.2. Stage II: Using SFA to Quantify Environmental Effects
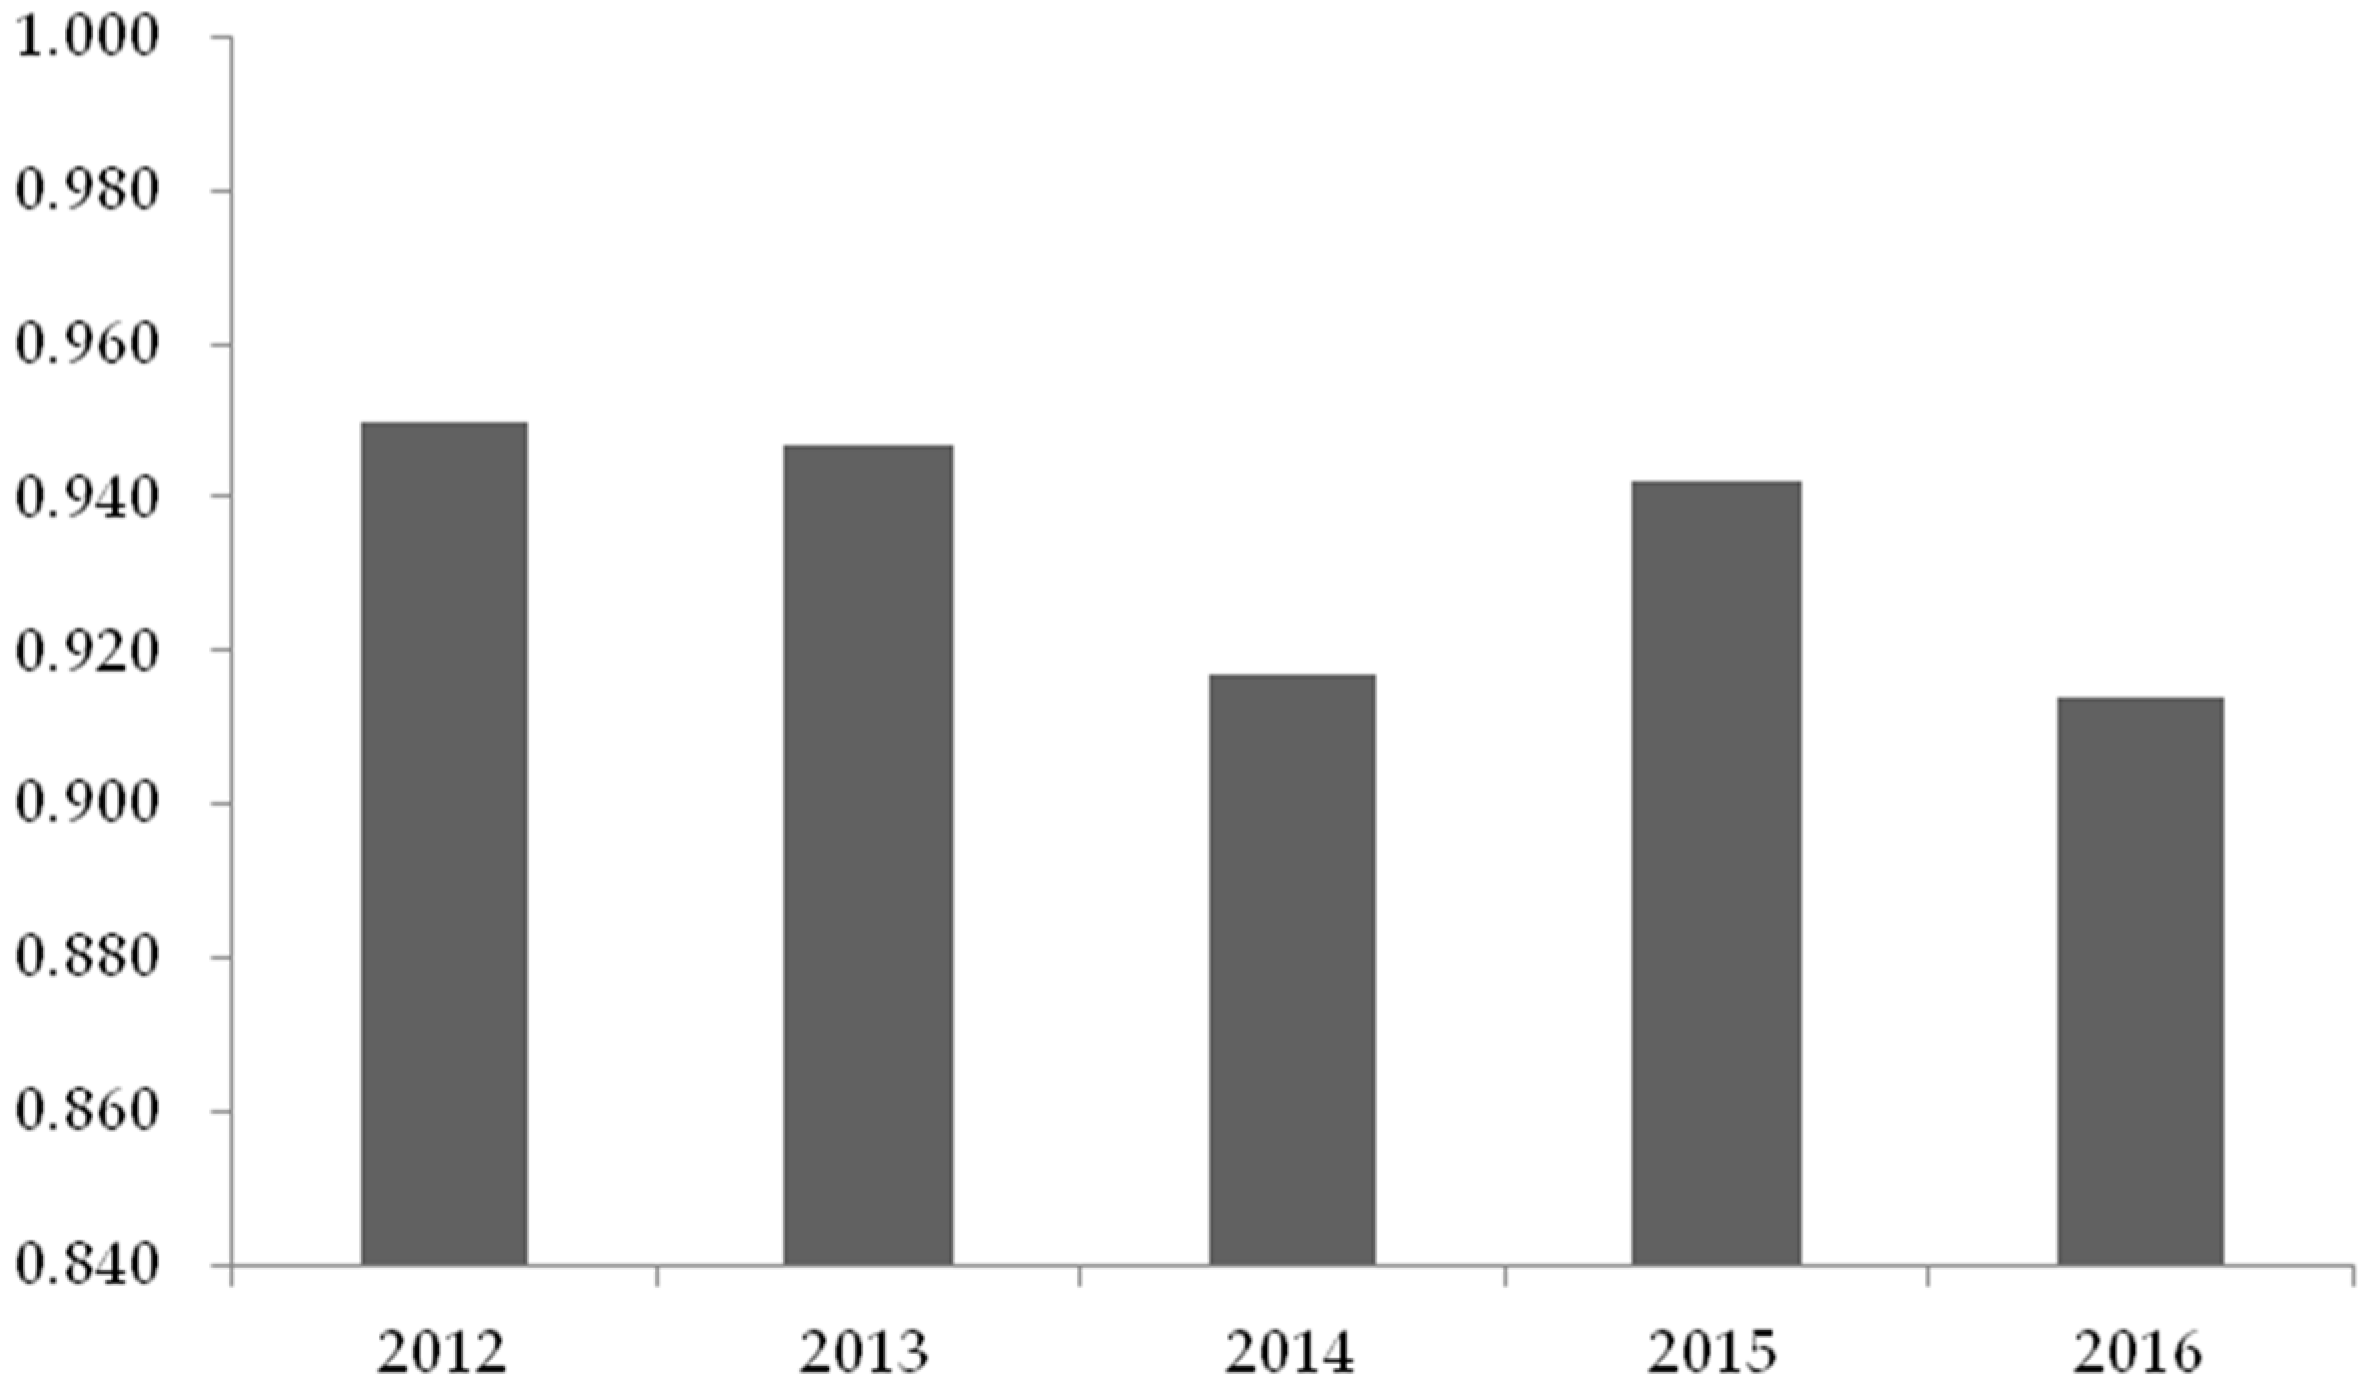
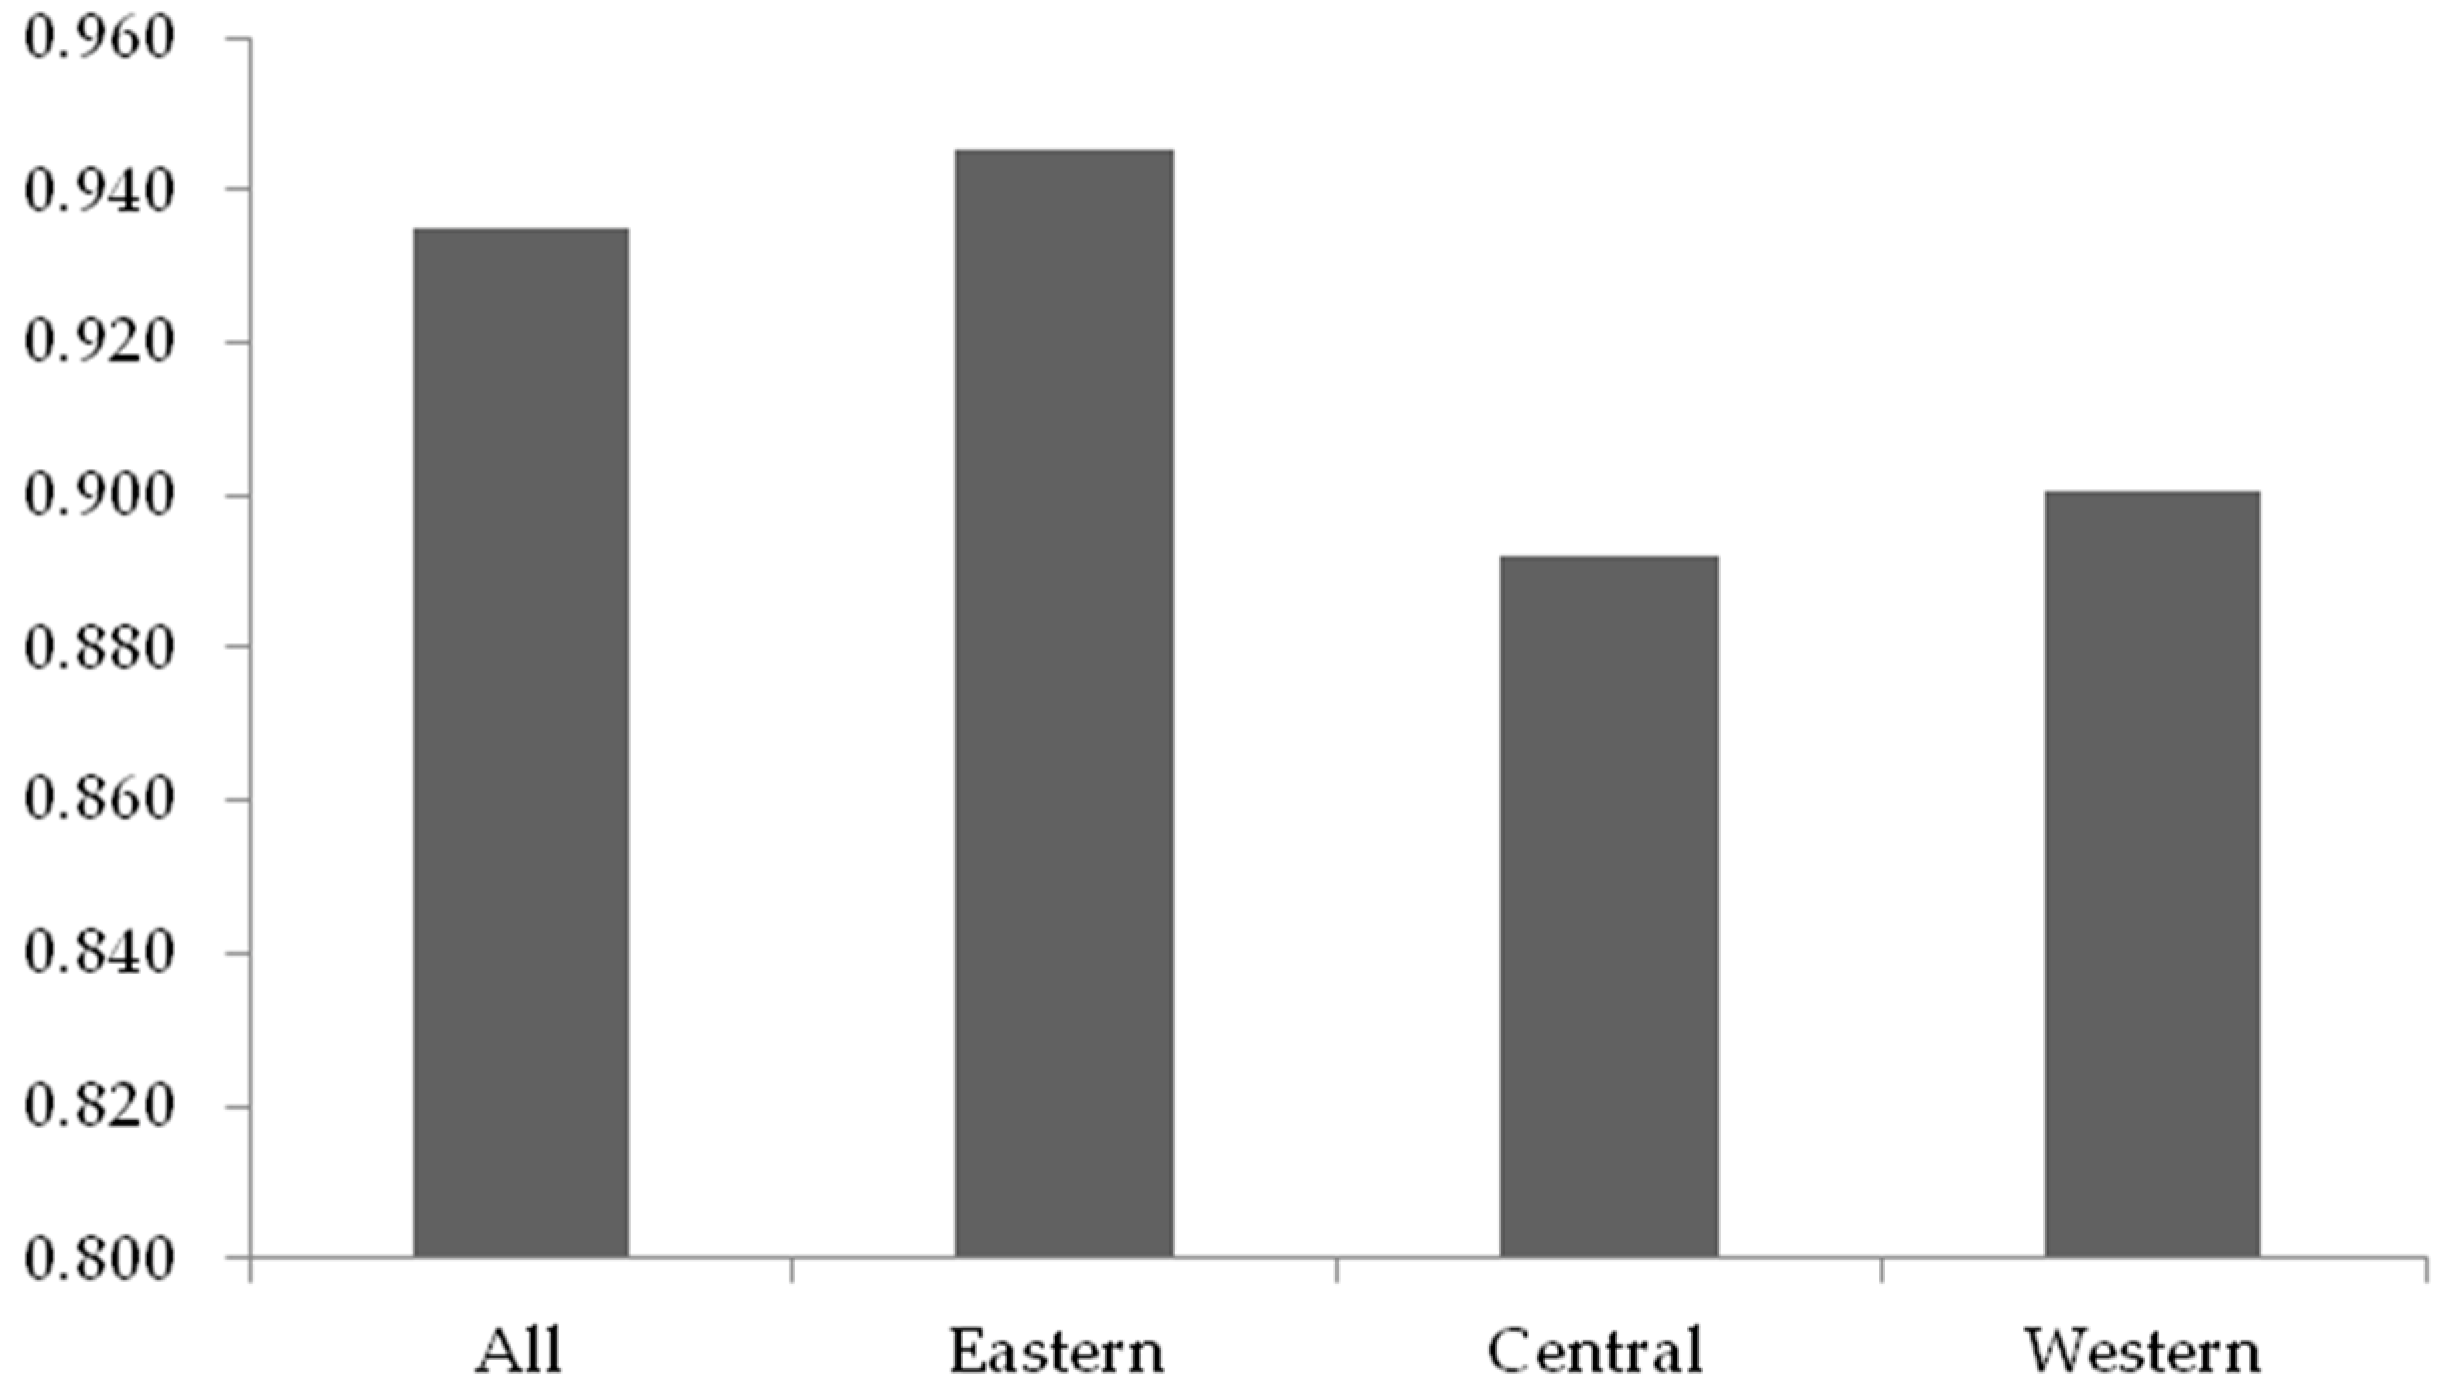
4.3. Stage III: Re-Estimate Efficiency Using Adjusted Data
4.4. Comparison of Results between Stage I and Stage III
5. Conclusions
Author Contributions
Funding
Conflicts of Interest
Appendix A

| No. | Name | No. | Name |
|---|---|---|---|
| 1 | Tagen Group (TG) | 29 | Long Jian Road and Bridge (LJRB) |
| 2 | ChengDu Hi-Tech Development (CHD) | 30 | Sinoma International Engineering (SIE) |
| 3 | Zhongnan Construction (ZC) | 31 | China National Chemical Engineering (CNCE) |
| 4 | China Camc Engineering (CCE) | 32 | China Railway Construction (CRC) |
| 5 | Norinco International (NI) | 33 | China Railway Group Limited (CRGL) |
| 6 | Guangdong No.2 Hydropower Engineering (CNHE) | 34 | Metallurgical Corporation of China (MCC) |
| 7 | Hongrun Construction Group (HCG) | 35 | China State Construction Engineering (CSCE) |
| 8 | Zhejiang Southeast Space Frame Group (ZSSFG) | 36 | China Communications Construction (CCC) |
| 9 | East China Engineering Science and Technology (ECEST) | 37 | Gold Mantis(GM) |
| 10 | Xinjiang Beixin Road and Bridge Group(XBRBG) | 38 | Avic Sanxin (AS) |
| 11 | Orient Landscape (OL) | 39 | Hongtao Decoration (HD) |
| 12 | Shandong Lipeng (SL) | 40 | Zhejiang Yasha Decoration (ZYD) |
| 13 | Palm Eco-Town Development (PETD) | 41 | Grandland Group (GG) |
| 14 | Beijing Water Business Doctor (BWBD) | 42 | Beijing Jiayu Door Window and Curtain Wall (BJDWCW) |
| 15 | Sichuan Road and Bridge(SRB) | 43 | Shanghai Prosolar Resources Development (SPRD) |
| 16 | China Gezhouba Group (CGG) | 44 | Lowton Development (LD) |
| 17 | CSSC Science and Technology (CST) | 45 | Hanggang Steel Structure (HSS) |
| 18 | Wuhan East Lake High Technology Group(WELHTG) | 46 | Changjiang and Jinggong Steel Building (CJSB) |
| 19 | Shanghai Construction Group (SCG) | 47 | China Zhonghua Geotechnical Engineering (CZGE) |
| 20 | Shaanxi Yanchang Petroleum Chemical Engineering (SYPCE) | 48 | Zhejiang Reclaim Construction Group (ZRCG) |
| 21 | Shanghai Pudong Road and Bridge(SPRB) | 49 | Chengdu Road and Bridge Engineering (CRBE) |
| 22 | Tibet Tianlu (TT) | 50 | Pubang Landscape Architecture (PLA) |
| 23 | Beijing Airport High-tech Park (BAHP) | 51 | Shenzhen Techand Ecology and Environment (STEE) |
| 24 | Long Yuan Construction Group (LYCG) | 52 | Power Construction Corporation of China (PCCC) |
| 25 | Anhui Water Resources Development (AWRD) | 53 | Ningbo Construction (NC) |
| 26 | Tengda Construction Group (TCG) | 54 | Shenzhen Ruihe Construction Decoration (SRCD) |
| 27 | Shanghai Tunnel Engineering (STE) | 55 | Jangho Group (JG) |
| 28 | Shanghai Tongji Science and Technology Industrial (STSTI) | ||
Appendix B
| Name | Stage I | Stage III | ||||||||
|---|---|---|---|---|---|---|---|---|---|---|
| 2012 | 2013 | 2014 | 2015 | 2016 | 2012 | 2013 | 2014 | 2015 | 2016 | |
| TG | 0.851 | 1.000 | 1.000 | 1.000 | 1.000 | 0.899 | 0.952 | 1.000 | 1.000 | 0.791 |
| CHD | 1.000 | 1.000 | 1.000 | 1.000 | 1.000 | 1.000 | 0.819 | 1.000 | 1.000 | 1.000 |
| ZC | 0.883 | 1.000 | 0.888 | 1.000 | 0.700 | 0.810 | 0.829 | 0.732 | 0.945 | 0.681 |
| CCE | 1.000 | 1.000 | 1.000 | 1.000 | 1.000 | 0.884 | 0.896 | 0.819 | 0.998 | 0.964 |
| NI | 1.000 | 1.000 | 1.000 | 1.000 | 0.965 | 1.000 | 1.000 | 1.000 | 1.000 | 0.606 |
| CNHE | 0.721 | 0.866 | 0.705 | 0.862 | 1.000 | 0.795 | 0.982 | 0.874 | 0.997 | 0.941 |
| HCG | 1.000 | 0.958 | 1.000 | 1.000 | 1.000 | 0.942 | 0.980 | 0.881 | 0.995 | 0.913 |
| ZSSFG | 1.000 | 0.964 | 1.000 | 1.000 | 0.837 | 1.000 | 0.962 | 1.000 | 1.000 | 0.863 |
| ECEST | 0.963 | 1.000 | 0.902 | 1.000 | 1.000 | 0.965 | 0.732 | 0.720 | 1.000 | 1.000 |
| XBRBG | 0.746 | 0.750 | 0.618 | 0.769 | 0.810 | 0.831 | 0.610 | 0.699 | 0.909 | 0.698 |
| OL | 1.000 | 1.000 | 1.000 | 0.832 | 0.860 | 0.764 | 1.000 | 1.000 | 1.000 | 0.826 |
| SL | 1.000 | 1.000 | 1.000 | 1.000 | 1.000 | 1.000 | 0.978 | 1.000 | 1.000 | 1.000 |
| PETD | 1.000 | 1.000 | 0.923 | 0.703 | 1.000 | 0.709 | 1.000 | 0.826 | 1.000 | 1.000 |
| BWBD | 1.000 | 1.000 | 1.000 | 0.931 | 1.000 | 0.900 | 1.000 | 0.970 | 1.000 | 1.000 |
| SRB | 1.000 | 0.936 | 1.000 | 1.000 | 1.000 | 0.801 | 0.831 | 1.000 | 1.000 | 0.931 |
| CGG | 0.968 | 0.974 | 0.964 | 0.950 | 0.935 | 0.811 | 0.933 | 0.763 | 0.982 | 0.774 |
| CST | 1.000 | 0.843 | 0.830 | 0.883 | 0.494 | 1.000 | 0.867 | 0.942 | 1.000 | 0.738 |
| WELHTG | 1.000 | 0.305 | 0.755 | 1.000 | 1.000 | 0.878 | 0.710 | 0.669 | 1.000 | 0.873 |
| SCG | 1.000 | 1.000 | 0.931 | 1.000 | 0.905 | 0.812 | 0.914 | 0.609 | 1.000 | 0.740 |
| SYPCE | 0.768 | 0.781 | 0.964 | 1.000 | 0.800 | 0.652 | 0.749 | 0.655 | 1.000 | 0.713 |
| SPRB | 1.000 | 1.000 | 1.000 | 1.000 | 1.000 | 1.000 | 1.000 | 1.000 | 1.000 | 1.000 |
| TT | 0.911 | 1.000 | 1.000 | 0.903 | 0.912 | 1.000 | 1.000 | 1.000 | 0.377 | 0.901 |
| BAHP | 1.000 | 1.000 | 1.000 | 1.000 | 1.000 | 1.000 | 1.000 | 1.000 | 0.777 | 0.891 |
| LYCG | 1.000 | 1.000 | 0.954 | 1.000 | 1.000 | 1.000 | 1.000 | 0.967 | 1.000 | 1.000 |
| AWRD | 1.000 | 1.000 | 0.803 | 1.000 | 0.775 | 1.000 | 1.000 | 0.925 | 0.709 | 0.486 |
| TCG | 0.793 | 1.000 | 0.760 | 0.958 | 1.000 | 0.504 | 0.675 | 0.708 | 1.000 | 1.000 |
| STE | 1.000 | 1.000 | 0.928 | 0.982 | 1.000 | 1.000 | 0.603 | 0.840 | 1.000 | 1.000 |
| STSTI | 1.000 | 1.000 | 1.000 | 1.000 | 1.000 | 0.999 | 0.998 | 0.968 | 1.000 | 0.934 |
| LJRB | 0.836 | 1.000 | 0.656 | 0.950 | 0.789 | 0.731 | 1.000 | 0.873 | 0.963 | 0.746 |
| SIE | 1.000 | 1.000 | 0.661 | 1.000 | 1.000 | 0.811 | 0.744 | 0.868 | 0.836 | 0.812 |
| CNCE | 0.862 | 0.998 | 0.913 | 0.925 | 1.000 | 0.860 | 0.699 | 0.753 | 0.921 | 0.988 |
| CRC | 1.000 | 1.000 | 0.889 | 0.897 | 0.914 | 0.867 | 0.610 | 0.645 | 0.642 | 0.909 |
| CRGL | 0.998 | 0.982 | 0.826 | 0.894 | 0.922 | 0.916 | 0.794 | 0.700 | 0.860 | 0.812 |
| MCC | 1.000 | 1.000 | 0.857 | 0.907 | 0.726 | 0.891 | 0.820 | 0.705 | 0.819 | 0.856 |
| CSCE | 1.000 | 0.942 | 0.999 | 0.946 | 0.933 | 0.849 | 0.660 | 0.743 | 0.753 | 0.818 |
| CCC | 1.000 | 1.000 | 0.982 | 1.000 | 1.000 | 0.758 | 1.000 | 1.000 | 1.000 | 1.000 |
| GM | 1.000 | 1.000 | 1.000 | 1.000 | 1.000 | 1.000 | 1.000 | 0.905 | 1.000 | 1.000 |
| AS | 0.730 | 0.955 | 1.000 | 1.000 | 1.000 | 0.690 | 1.000 | 1.000 | 1.000 | 1.000 |
| HD | 1.000 | 1.000 | 1.000 | 0.881 | 0.718 | 0.800 | 1.000 | 1.000 | 1.000 | 0.768 |
| ZYD | 0.860 | 0.654 | 0.975 | 1.000 | 0.741 | 0.590 | 0.841 | 0.924 | 1.000 | 0.791 |
| GG | 0.910 | 0.891 | 0.950 | 0.806 | 0.798 | 0.912 | 0.706 | 0.951 | 0.791 | 0.741 |
| BJDWCW | 0.872 | 0.771 | 0.667 | 0.748 | 0.726 | 0.876 | 0.716 | 0.921 | 0.706 | 0.822 |
| SPRD | 1.000 | 1.000 | 1.000 | 1.000 | 1.000 | 1.000 | 1.000 | 1.000 | 1.000 | 1.000 |
| LD | 1.000 | 1.000 | 1.000 | 1.000 | 1.000 | 1.000 | 1.000 | 1.000 | 1.000 | 1.000 |
| HSS | 0.834 | 0.881 | 0.799 | 0.999 | 0.949 | 0.681 | 0.733 | 0.938 | 0.999 | 0.745 |
| CJSB | 0.927 | 0.947 | 0.767 | 0.720 | 0.886 | 0.687 | 0.969 | 0.982 | 0.828 | 1.000 |
| CZGE | 1.000 | 1.000 | 1.000 | 0.990 | 0.955 | 1.000 | 1.000 | 1.000 | 0.897 | 0.895 |
| ZRCG | 0.984 | 0.935 | 0.946 | 1.000 | 1.000 | 0.665 | 0.876 | 0.945 | 0.678 | 1.000 |
| CRBE | 1.000 | 1.000 | 1.000 | 0.855 | 0.484 | 1.000 | 1.000 | 1.000 | 0.935 | 0.723 |
| PLA | 1.000 | 1.000 | 1.000 | 0.865 | 0.807 | 1.000 | 1.000 | 1.000 | 0.634 | 0.757 |
| STEE | 1.000 | 1.000 | 0.999 | 0.895 | 1.000 | 1.000 | 0.734 | 1.000 | 0.739 | 0.943 |
| PCCC | 1.000 | 1.000 | 0.928 | 0.908 | 1.000 | 0.914 | 0.710 | 0.937 | 0.489 | 0.861 |
| NC | 0.957 | 0.989 | 0.926 | 1.000 | 0.917 | 0.859 | 0.795 | 0.857 | 0.837 | 0.840 |
| SRCD | 1.000 | 1.000 | 1.000 | 1.000 | 1.000 | 1.000 | 1.000 | 1.000 | 1.000 | 1.000 |
| JG | 0.882 | 0.776 | 0.761 | 1.000 | 1.000 | 0.837 | 0.788 | 0.824 | 0.653 | 0.931 |
References
- Xue, H.; Zhang, S.J. Relationships between engineering construction standards and economic growth in the construction industry: The case of China’s construction industry. KSCE J. Civ. Eng. 2017, 22, 1606–1613. [Google Scholar] [CrossRef]
- Chang, R.D.; Zuo, J.; Soebarto, V.; Zhao, Z.Y.; Zillante, G.; Gan, X.L. Discovering the Transition Pathways toward Sustainability for Construction Enterprises: Importance-Performance Analysis. J. Constr. Eng. Manag. 2017, 143, 04017013. [Google Scholar] [CrossRef]
- Lu, W.; Ye, M.; Flanagan, R.; Ye, K. Corporate Social Responsibility Disclosures in International Construction Business: Trends and Prospects. J. Constr. Eng. Manag. 2016, 142, 04015053. [Google Scholar] [CrossRef] [Green Version]
- Shen, L.Y.; Tam, V.W.Y.; Tam, L.; Ji, Y.B. Project feasibility study: The key to successful implementation of sustainable and socially responsible construction management practice. J. Clean. Prod. 2010, 18, 254–259. [Google Scholar] [CrossRef]
- Wu, Y.; Chau, K.W.; Lu, W.; Shen, L.; Shuai, C.; Chen, J. Decoupling relationship between economic output and carbon emission in the Chinese construction industry. Environ. Impact Assess. Rev. 2018, 71, 60–69. [Google Scholar] [CrossRef]
- Sunindijo, R.Y.; Zou, P.X.W. Political Skill for Developing Construction Safety Climate. J. Constr. Eng. Manag. 2012, 138, 605–612. [Google Scholar] [CrossRef]
- National Bureau of Statistics of China. Statistical Communiqué of the People’s Republic of China on the 2017 National Economic and Social Development. 2018. Available online: http://www.stats.gov.cn /english/PressRelease/201802/t20180228_1585666.html (accessed on 10 July 2018).
- China Association of Building Energy Efficiency. Research Report on Building Energy Consumption in China (2017). 2017. Available online: https://www.sohu.com/a/208615242_99960447 (accessed on 23 August 2018). (In Chinese).
- Chang, R.D.; Soebarto, V.; Zhao, Z.Y.; Zillante, G. Facilitating the transition to sustainable construction: China’s policies. J. Clean. Prod. 2016, 131, 534–544. [Google Scholar] [CrossRef]
- Chang, R.D.; Zuo, J.; Zhao, Z.Y.; Soebarto, V.; Lu, Y.; Zillante, G.; Gan, X.L. Sustainability attitude and performance of construction enterprises: A China study. J. Clean. Prod. 2018, 172, 1440–1451. [Google Scholar] [CrossRef]
- Gan, X.; Zuo, J.; Ye, K.; Skitmore, M.; Xiong, B. Why sustainable construction? Why not? An owner’s perspective. Habitat Int. 2015, 47, 61–68. [Google Scholar] [CrossRef]
- Tan, Y.; Shen, L.; Yao, H. Sustainable construction practice and contractors’ competitiveness: A preliminary study. Habitat Int. 2011, 35, 225–230. [Google Scholar] [CrossRef]
- O’Connor, M.; Spangenberg, J.H. A methodology for CSR reporting: Assuring a representative diversity of indicators across stakeholders, scales, sites and performance issues. J. Clean. Prod. 2008, 16, 1399–1415. [Google Scholar] [CrossRef]
- Lin, X.; Ho, C.M.; Shen, G.Q. Research on corporate social responsibility in the construction context: A critical review and future directions. Int. J. Constr. Manag. 2017, 1–11. [Google Scholar] [CrossRef]
- International Organization for Standardization. ISO 26000: Guidance on Social Responsibility. 2010. Available online: https://www.iso.org/obp/ui/#iso:std:iso:26000:ed-1:v1:en (accessed on 13 July 2018).
- Schultz, F.; Castelló, I.; Morsing, M. The Construction of Corporate Social Responsibility in Network; Societies: A Communication View. J. Bus. Ethics 2013, 115, 681–692. [Google Scholar] [CrossRef]
- Zhao, Z.Y.; Zhao, X.J.; Zuo, J.; Zillante, G. Corporate social responsibility for construction contractors: A China study. J. Eng. Des. Technol. 2016, 14, 614–640. [Google Scholar] [CrossRef]
- Jiang, W.; Wong, J.K. Key activity areas of corporate social responsibility (CSR) in the construction industry: A study of China. J. Clean. Prod. 2016, 113, 850–860. [Google Scholar] [CrossRef]
- Aupperle, K.E.; Carroll, A.B.; Hatfield, J.D. An Empirical Examination of the Relationship between Corporate Social Responsibility and Profitability. Acad. Manag. J. 1985, 28, 446–463. [Google Scholar]
- Preston, L.E.; O’Bannon, D.P. The Corporate Social-Financial Performance Relationship: A Typology and Analysis. Bus. Soc. 1997, 36, 419–429. [Google Scholar] [CrossRef]
- Lu, W.; Ye, M.; Chau, K.; Flanagan, R. The paradoxical nexus between corporate social responsibility and sustainable financial performance: Evidence from the international construction business. Corp. Soc. Responsib. Environ. Manag. 2018, 1–9. [Google Scholar] [CrossRef]
- Snell, R.S. Studying moral ethos using an adapted Kohlbergian model. Organ. Stud. 2000, 21, 267–295. [Google Scholar] [CrossRef]
- Chambers, R.G.; Serra, T. The social dimension of firm performance: A data envelopment approach. Empir. Econ. 2018, 54, 189–206. [Google Scholar] [CrossRef]
- Belu, C. Ranking corporations based on sustainable and socially responsible practices. A data envelopment analysis (DEA) approach. Sustain. Dev. 2009, 17, 257–268. [Google Scholar] [CrossRef]
- Aldamak, A.M.; Zolfaghari, S. Review of efficiency ranking methods in data envelopment analysis. Measure 2017, 106, 161–172. [Google Scholar] [CrossRef]
- Mardani, A.; Zavadskas, E.K.; Streimikiene, D.; Jusoh, A.; Khoshnoudi, M. A comprehensive review of data envelopment analysis (DEA) approach in energy efficiency. Renew. Sustain. Energy Rev. 2016, 70, 1298–1322. [Google Scholar] [CrossRef]
- Moon, H.; Min, D. Assessing energy efficiency and the related policy implications for energy-intensive firms in Korea: DEA approach. Energy 2017, 133, 23–34. [Google Scholar] [CrossRef]
- Witte, K.D.; López-Torres, L. Efficiency in education: A review of literature and a way forward. J. Oper. Res. Soc. 2017, 68, 339–363. [Google Scholar] [CrossRef]
- Cheng, H.T.; Chang, H.S. A Spatial DEA-Based Framework for Analyzing the Effectiveness of Disaster Risk Reduction Policy Implementation: A Case Study of Earthquake-Oriented Urban Renewal Policy in Yongkang, Taiwan. Sustainability 2018, 10, 1751. [Google Scholar] [CrossRef]
- Hu, J.L.; Li, Y.; Tung, H.J. Operational efficiency of ASEAN airlines: Based on DEA and bootstrapping approaches. Manag. Decis. 2017, 55, 957–986. [Google Scholar] [CrossRef]
- Liu, Q.; Wang, S.; Zhang, W.; Li, J.; Zhao, Y.; Li, W. China’s municipal public infrastructure: Estimating construction levels and investment efficiency using the entropy method and a DEA model. Habitat Int. 2017, 64, 59–70. [Google Scholar] [CrossRef]
- Deilmann, C.; Hennersdorf, J.; Lehmann, I.; Reißmann, D. Data envelopment analysis of urban efficiency—Interpretative methods to make DEA a heuristic tool. Ecol. Indic. 2018, 84, 607–618. [Google Scholar] [CrossRef]
- Chen, C.M.; Delmas, M. Measuring corporate social performance: An efficiency perspective. Prod. Oper. Manag. 2011, 20, 789–804. [Google Scholar] [CrossRef]
- Zhou, H.; Yang, Y.; Chen, Y.; Zhu, J. Data envelopment analysis application in sustainability: The origins, development and future directions. Eur. J. Oper. Res. 2018, 264, 1–16. [Google Scholar] [CrossRef]
- Cai, W.; Liu, F.; Xie, J.; Liu, P.; Tuo, J. A tool for assessing the energy demand and efficiency of machining systems: Energy benchmarking. Energy 2017, 138, 332–347. [Google Scholar] [CrossRef]
- Yang, F.C. Integrating corporate social responsibility and profitability into best practice selection: The case of large Taiwanese firms. Qual. Quant. 2017, 51, 1493–1512. [Google Scholar] [CrossRef]
- Liu, X.; Liu, J. Measurement of Low Carbon Economy Efficiency with a Three-Stage Data Envelopment Analysis: A Comparison of the Largest Twenty CO2, Emitting Countries. Int. J. Environ. Res. Public Health 2016, 13, 1116. [Google Scholar] [CrossRef] [PubMed]
- Fried, H.O.; Lovell, C.A.K.; Schmidt, S.S.; Yaisawarng, S. Accounting for Environmental Effects and Statistical Noise in Data Envelopment Analysis. J. Prod. Anal. 2002, 17, 157–174. [Google Scholar] [CrossRef]
- Banker, R.D.; Charnes, A.; Cooper, W.W. Some Models for Estimating Technical and Scale Inefficiencies in Data Envelopment Analysis. Manag. Sci. 1984, 30, 1078–1092. [Google Scholar] [CrossRef]
- Timmer, C.P. Using a Probabilistic Frontier Production Function to Measure Technical Efficiency. J. Polit. Econ. 1971, 79, 776–794. [Google Scholar] [CrossRef]
- Fried, H.O.; Schmidt, S.S.; Yaisawarng, S. Incorporating the Operating Environment into a Nonparametric Measure of Technical Efficiency. J. Prod. Anal. 1999, 12, 249–267. [Google Scholar] [CrossRef]
- Cui, Q.; Li, Y. The evaluation of transportation energy efficiency: An application of three-stage virtual frontier DEA. Transp. Res. D 2014, 29, 1–11. [Google Scholar] [CrossRef]
- Shyu, J.; Chiang, T. Measuring the true managerial efficiency of bank branches in Taiwan: A three-stage DEA analysis. Expert Syst. Appl. 2012, 39, 11494–11502. [Google Scholar] [CrossRef]
- Hsu, F.M.; Hsueh, C.C. Measuring relative efficiency of government-sponsored R&D projects: A three-stage approach. Eval. Prog. Plan. 2009, 32, 178–186. [Google Scholar]
- Li, K.; Lin, B. Impact of energy conservation policies on the green productivity in China’s manufacturing sector: Evidence from a three-stage DEA model. Appl. Energy 2016, 168, 351–363. [Google Scholar] [CrossRef]
- Chen, Y.; Liu, B.; Shen, Y.; Wang, X. The energy efficiency of China’s regional construction industry based on the three-stage DEA model and the DEA-DA model. KSCE J. Civ. Eng. 2016, 20, 34–47. [Google Scholar] [CrossRef]
- Seiford, L.M.; Zhu, J. Modeling undesirable factors in efficiency evaluation. Eur. J. Oper. Res. 2002, 142, 16–20. [Google Scholar] [CrossRef]
- Aigner, D.; Lovell, C.K.; Schmidt, P. Formulation and estimation of stochastic frontier production function models. J. Econom. 1977, 6, 21–37. [Google Scholar] [CrossRef]
- Meeusen, W.; van Den Broeck, J. Efficiency estimation from Cobb-Douglas production functions with composed error. Int. Econ. Rev. 1977, 18, 435–444. [Google Scholar] [CrossRef]
- Kumbhakar, S.C.; Lovell, C.K. Stochastic Frontier Analysis; Cambridge University Press: Cambridge, UK, 2000; pp. 136–142. [Google Scholar]
- China Securities Regulatory Commission. Industry Classification Results of Listed Companies in the 4 Quarter of 2017. 2018. Available online: http://www.csrc.gov.cn/pub/newsite/scb/ssgshyfljg/201801 /t20180119_332958.html (accessed on 20 July 2018). (In Chinese)
- Construction Times; Engineering News-Record. “China’s Top 80 Contractors” List. 2017. Available online: http://www.jzsbs.com/index.php/Home/Index/detail?id=7266 (accessed on 23 August 2018). (In Chinese).
- Buchholtz, A.K.; Amason, A.C.; Rutherford, M.A. Beyond resources: The mediating effect of top management discretion and values on corporate philanthropy. Bus. Soc. 1999, 38, 167–187. [Google Scholar] [CrossRef]
- China International Contractors Association. Guide on Social Responsibility for Chinese International Contractors. 2012. Available online: http://images.mofcom.gov.cn/hzs/accessory/201209/1348819602840 pdf (accessed on 20 July 2018). (In Chinese)
- Carroll, A.B. A Three-Dimensional Conceptual Model of Corporate Performance. Acad. Manag. Rev. 1979, 4, 497–505. [Google Scholar] [CrossRef]
- Carroll, A.B. The pyramid of corporate social responsibility: Toward the moral management of organizational stakeholders. Bus. Horiz. 1991, 34, 39–48. [Google Scholar] [CrossRef]
- Achua, J.K. Corporate social responsibility in Nigerian banking system. Soc. Bus. Rev. 2008, 3, 57–71. [Google Scholar] [CrossRef]
- Friedman, M. The Social Responsibility of Business Is to Increase Its Profits. N. Y. Times Mag. 1970, 13, 173–178. [Google Scholar]
- Wan, W.J. Defining corporate social responsibility. J. Public Aff. 2010, 6, 176–184. [Google Scholar] [CrossRef]
- The Enterprise Observer. Report of 2017 Top 500 Chinese Charity Enterprise. 2017. Available online: http://www.cneo.com.cn/article-48517-1.html (accessed on 24 July 2018). (In Chinese).
- Liu, B.; Wang, X.; Chen, C.; Ma, Z. Research into the dynamic development trend of the competitiveness of China’s regional construction industry. KSCE J. Civ. Eng. 2014, 18, 1–10. [Google Scholar] [CrossRef]
- Li, J.; Chiang, Y.H.; Choi, T.N.; Man, K.F. Determinants of efficiency of contractors in Hong Kong and China: Panel data model analysis. J. Constr. Eng. Manag. 2013, 139, 1211–1223. [Google Scholar] [CrossRef]
- EdumFotwe, F.; Price, A.; Thorpe, A. A review of financial ratio tools for predicting contractor insolvency. Constr. Manag. Econ. 2010, 14, 189–198. [Google Scholar] [CrossRef]
- Pilateris, P.; Mccabe, B. Contractor financial evaluation model (CFEM). Rev. Can. Genie Civ. 2003, 30, 487–499. [Google Scholar] [CrossRef]
- Chen, H.L. Model for Predicting Financial Performance of Development and Construction Corporations. J. Constr. Eng. Manag. 2010, 135, 1190–1200. [Google Scholar] [CrossRef]
- Elyamany, A.; Basha, I.; Zayed, T. Performance Evaluating Model for Construction Companies: Egyptian Case Study. J. Constr. Eng. Manag. 2007, 133, 574–581. [Google Scholar] [CrossRef]
- Balatbat, M.C.A.; Lin, C.I.; Carmichael, D.G. Comparative performance of publicly listed construction companies: Australian evidence. Constr. Manag. Econ. 2010, 28, 919–932. [Google Scholar] [CrossRef]
- Severson, G.D.; Russell, J.S.; Jaselskis, E.J. Predicting Contract Surety Bond Claims Using Contractor Financial Data. J. Constr. Eng. Manag. 1994, 120, 405–420. [Google Scholar] [CrossRef]
- Barney, J. Firm Resources and Sustained Competitive Advantage. J. Manag. 1991, 17, 3–10. [Google Scholar]
- Dyer, L.; Reeves, T. Human resource strategies and firm performance: What do we know and where do we need to go? Int. J. Hum. Resour. Manag. 1995, 6, 656–670. [Google Scholar] [CrossRef]
- Lopez-Cabrales, A.; Valle, R.; Herrero, I. The contribution of core employees to organizational capabilities and efficiency. Hum. Resour. Manag. 2010, 45, 81–109. [Google Scholar] [CrossRef]
- Goodrum, P.M.; Haas, C.T. Long-Term Impact of Equipment Technology on Labor Productivity in the U.S. Construction Industry at the Activity Level. J. Constr. Eng. Manag. 2004, 130, 124–133. [Google Scholar] [CrossRef]
- Wu, C.L.; Fang, D.P.; Liao, P.C.; Xue, J.W.; Li, Y.; Wang, T. Perception of corporate social responsibility: The case of Chinese international contractors. J. Clean. Prod. 2015, 107, 185–194. [Google Scholar] [CrossRef]
- Xiong, B.; Lu, W.; Skitmore, M.; Chau, K.; Ye, M. Virtuous nexus between corporate social performance and financial performance: A study of construction enterprises in China. J. Clean. Prod. 2016, 129, 223–233. [Google Scholar] [CrossRef]
- Zhao, Z.Y.; Zhao, X.J.; Davidson, K.; Zuo, J. A corporate social responsibility indicator system for construction enterprises. J. Clean. Prod. 2012, 29, 277–289. [Google Scholar] [CrossRef]
- Hexun. The Introduction of Hexun. Available online: http://corp.hexun.com/default/index.html (accessed on 24 July 2018).
- Li, D.; Xin, L.; Chen, X.; Ren, S. Corporate social responsibility, media attention and firm value: Empirical research on Chinese manufacturing firms. Qual. Quant. 2017, 51, 1563–1577. [Google Scholar] [CrossRef]
- Pan, X.; Sha, J.; Zhang, H.; Ke, W. Relationship between corporate social responsibility and financial performance in the mineral Industry: Evidence from Chinese mineral firms. Sustainability 2014, 6, 4077–4101. [Google Scholar] [CrossRef]
- Matten, D.; Moon, J. “Implicit” and “explicit” CSR: A conceptual framework for a comparative understanding of corporate social responsibility. Acad. Manag. Rev. 2008, 33, 404–424. [Google Scholar] [CrossRef]
- Wu, J. The antecedents of corporate social and environmental irresponsibility. Corp. Soc. Responsib. Environ. Manag. 2014, 21, 286–300. [Google Scholar] [CrossRef]
- Wang, X.; Fan, G.; Yu, J. Markefizafion Index of China’s Provinces: NERI Report 2016; Social Science Academic Press: Beijing, China, 2017; pp. 43–52. ISBN 978-7-5201-0022-9. (In Chinese) [Google Scholar]
- Fan, G.; Wang, X.; Zhu, H. NERI Index of Marketization of China’s Provinces; Economics Science Press: Beijing, China, 2001; pp. 1–5. ISBN 7505826018. (In Chinese) [Google Scholar]
- Muratova, Y.; Arnoldi, J.; Chen, X.; Scholderer, J. Political rotations and cross-province firm acquisitions in China. Asian Bus. Manag. 2018, 17, 37–58. [Google Scholar] [CrossRef]
- Li, J.; Li, Z. Understanding the role of economic transition in enlarging energy price elasticity. Econ. Transit. 2018, 26, 253–281. [Google Scholar] [CrossRef]
- Huang, D.; Liu, L. Micro-determinants of vertical integration: Evidence from China. Asia Pac. J. Manag. 2014, 31, 377–396. [Google Scholar] [CrossRef]
- Wang, L.H.; Dong, Z.Q.; Huang, W.T.; Li, F.Q. An Empirical Study of the Economic Institution Transition and the Efficiency of Chinese Economic Growth. In Proceedings of the International Conference on Management Science and Engineering, Chengdu, China, 14–21 July 2007. [Google Scholar]
- Liu, B.; Chen, Y.; Wang, R.; Shen, Y.; Shen, Q. Different interaction mechanisms of market structure in the construction industry TFP from the spatial perspective: A case study in China. KSCE J. Civ. Eng. 2016, 20, 23–33. [Google Scholar] [CrossRef]
- Kyriacou, A.P.; Muinelo-Gallo, L.; Roca-Sagalés, O. Construction corrupts: Empirical evidence from a panel of 42 countries. Public Choice 2015, 165, 123–145. [Google Scholar] [CrossRef]
- Liu, W.; Wei, Q.; Huang, S.-Q.; Tsai, S.-B. doing Good Again? A Multilevel Institutional Perspective on Corporate Environmental Responsibility and Philanthropic Strategy. Int. J. Environ. Res. Public Health 2017, 14, 1283. [Google Scholar] [CrossRef] [PubMed]
- Li, S.; Song, X.; Wu, H. Political Connection, Ownership Structure, and Corporate Philanthropy in China: A Strategic-Political Perspective. J. Bus. Ethics 2015, 129, 399–411. [Google Scholar] [CrossRef]
- Tian, Z.; Wang, R.; Yang, W. Consumer responses to corporate social responsibility (CSR) in China. J. Bus. Ethics 2011, 101, 197–212. [Google Scholar] [CrossRef]
- Campbell, J.L. Why Would Corporations Behave in Socially Responsible Ways? An Institutional Theory of Corporate Social Responsibility. Acad. Manag. J. 2007, 32, 946–967. [Google Scholar] [CrossRef]
- Ma, H.; Zeng, S.; Shen, G.Q.; Lin, H.; Chen, H. International diversification and corporate social responsibility. Manag. Decis. 2016, 54, 1–27. [Google Scholar] [CrossRef]
- Shen, L.; Shuai, C.; Jiao, L.; Tan, Y.; Song, X. Dynamic sustainability performance during urbanization process between BRICS countries. Habitat Int. 2017, 60, 19–33. [Google Scholar] [CrossRef]


| Proxies | Variables Selection | Literature |
|---|---|---|
| Capital resources | Current ratio | [63,64,65] |
| Debt to equity ratio | [64,66,67] | |
| Growth ratio in the cost of goods sold | [65,68] | |
| Labor resources | Growth ratio of salaries expense | [69,70,71] |
| Equipment resource | Value of machinery and equipment/revenue | [62,72] |
| Variables | 2012 | 2013 | 2014 | 2015 | 2016 |
|---|---|---|---|---|---|
| Current ratio | 1.518 | 1.460 | 1.341 | 1.438 | 1.427 |
| (1.011) | (0.848) | (0.496) | (0.544) | (0.422) | |
| Debt to equity ratio | 2.867 | 3.082 | 3.261 | 2.720 | 2.678 |
| (2.203) | (2.512) | (3.319) | (1.841) | (1.973) | |
| Growth ratio in the cost of goods sold | 0.150 | 0.240 | 0.116 | 0.051 | 0.117 |
| (0.240) | (0.476) | (0.260) | (0.279) | (0.336) | |
| Growth ratio of salaries expense | 0.521 | 0.585 | 0.179 | 0.138 | 0.009 |
| (1.788) | (1.725) | (0.309) | (0.422) | (1.197) | |
| Value of machinery and equipment/revenue | 0.064 | 0.061 | 0.640 | 0.046 | 0.040 |
| (0.104) | (0.115) | (0.120) | (0.072) | (0.067) | |
| shareholders | 15.082 | 15.158 | 14.119 | 14.040 | 13.029 |
| (5.751) | (6.288) | (4.514) | (4.609) | (5.250) | |
| Employees | 5.755 | 5.507 | 2.902 | 4.060 | 4.556 |
| (5.188) | (5.012) | (2.797) | (4.605) | (4.862) | |
| Suppliers, clients and consumers | 3.636 | 4.655 | 0.691 | 2.309 | 3.018 |
| (5.107) | (6.263) | (2.538) | (5.059) | (5.579) | |
| Environment | 6.073 | 6.306 | 0.818 | 3.427 | 3.864 |
| (8.529) | (8.570) | (3.339) | (7.481) | (7.378) | |
| Community | 4.556 | 4.406 | 3.986 | 3.866 | 4.281 |
| (3.717) | (3.942) | (4.974) | (3.496) | (4.474) |
| Variables | 2012 | 2013 | 2014 | 2015 | 2016 |
|---|---|---|---|---|---|
| Relationship of intervention between government and market | 6.675 | 6.629 | 6.949 | 6.443 | 6.233 |
| (2.032) | (2.171) | (2.20) | (2.477) | (2.661) | |
| Development of the non-state economy | 7.766 | 8.097 | 8.384 | 8.530 | 8.751 |
| (1.717) | (1.773) | (1.643) | (1.676) | (1.689) | |
| Development of the product market | 7.661 | 7.661 | 7.462 | 7.539 | 7.519 |
| (1.366) | (1.366) | (1.807) | (4.605) | (1.658) | |
| Development of the factor market | 7.092 | 7.578 | 8.388 | 8.714 | 9.224 |
| (2.807) | (2.966) | (3.032) | (3.384) | (3.651) | |
| Development of the legal-system environment | 10.198 | 10.663 | 11.872 | 12.637 | 13.531 |
| (4.028) | (4.105) | (4.121) | (4.774) | (5.289) |
| Variables | SSR | SESR | SSCCR | SER | SCR |
|---|---|---|---|---|---|
| Constant term | −0.029 | 0.118 | 0.277 ** | 0.159 * | −0.016 |
| Relationship of intervention between government and market | 0.014 | −0.311 ** | −0.508 *** | −0.328 ** | −0.012 |
| Development of the non-state economy | −0.105 * | −0.126 | −0.156 | −0.046 | −0.076 |
| Development of the product market | 0.088 ** | 0.230 *** | 0.318 *** | 0.165 ** | 0.072 ** |
| Development of the legal-system environment | 0.072 * | 0.227 *** | 0.250 *** | 0.158 ** | 0.059 ** |
| σ2 | 0.012 | 0.065 | 0.101 | 0.035 | 0.010 |
| γ | 0.354 | 0.536 | 0.511 | 0.327 | 0.5433 |
| LR test of the one-sided error | 26.720 | 22.946 | 16.694 | 8.969 | 28.097 |
| Factor | Time Level | Region Level | ||||||
|---|---|---|---|---|---|---|---|---|
| 2012 | 2013 | 2014 | 2015 | 2016 | Eastern | Central | Western | |
| Stage I | 0.950 | 0.947 | 0.917 | 0.945 | 0.914 | 0.945 | 0.902 | 0.900 |
| Stage III | 0.875 | 0.877 | 0.892 | 0.903 | 0.873 | 0.891 | 0.856 | 0.861 |
© 2018 by the authors. Licensee MDPI, Basel, Switzerland. This article is an open access article distributed under the terms and conditions of the Creative Commons Attribution (CC BY) license (http://creativecommons.org/licenses/by/4.0/).
Share and Cite
Wang, X.; Lai, W.; Song, X.; Lu, C. Implementation Efficiency of Corporate Social Responsibility in the Construction Industry: A China Study. Int. J. Environ. Res. Public Health 2018, 15, 2008. https://doi.org/10.3390/ijerph15092008
Wang X, Lai W, Song X, Lu C. Implementation Efficiency of Corporate Social Responsibility in the Construction Industry: A China Study. International Journal of Environmental Research and Public Health. 2018; 15(9):2008. https://doi.org/10.3390/ijerph15092008
Chicago/Turabian StyleWang, Xuetong, Wenyong Lai, Xiangnan Song, and Chen Lu. 2018. "Implementation Efficiency of Corporate Social Responsibility in the Construction Industry: A China Study" International Journal of Environmental Research and Public Health 15, no. 9: 2008. https://doi.org/10.3390/ijerph15092008