Determinants and Temporal Trends of Perfluoroalkyl Substances in Pregnant Women: The Hokkaido Study on Environment and Children’s Health

 ,
,
Abstract
:1. Introduction
2. Materials and Methods
2.1. Study Populat
2.2. Measurement of PFAS and Cotinine Concentrations in Maternal Blood
2.3. Statistical Analysis
3. Results
4. Discussion
4.1. Maternal Delivery Age
4.2. Pre-Pregnancy BMI
4.3. Parity
4.4. Mother Education Level and Annual Household Income
4.5. Smoking
4.6. Drinking
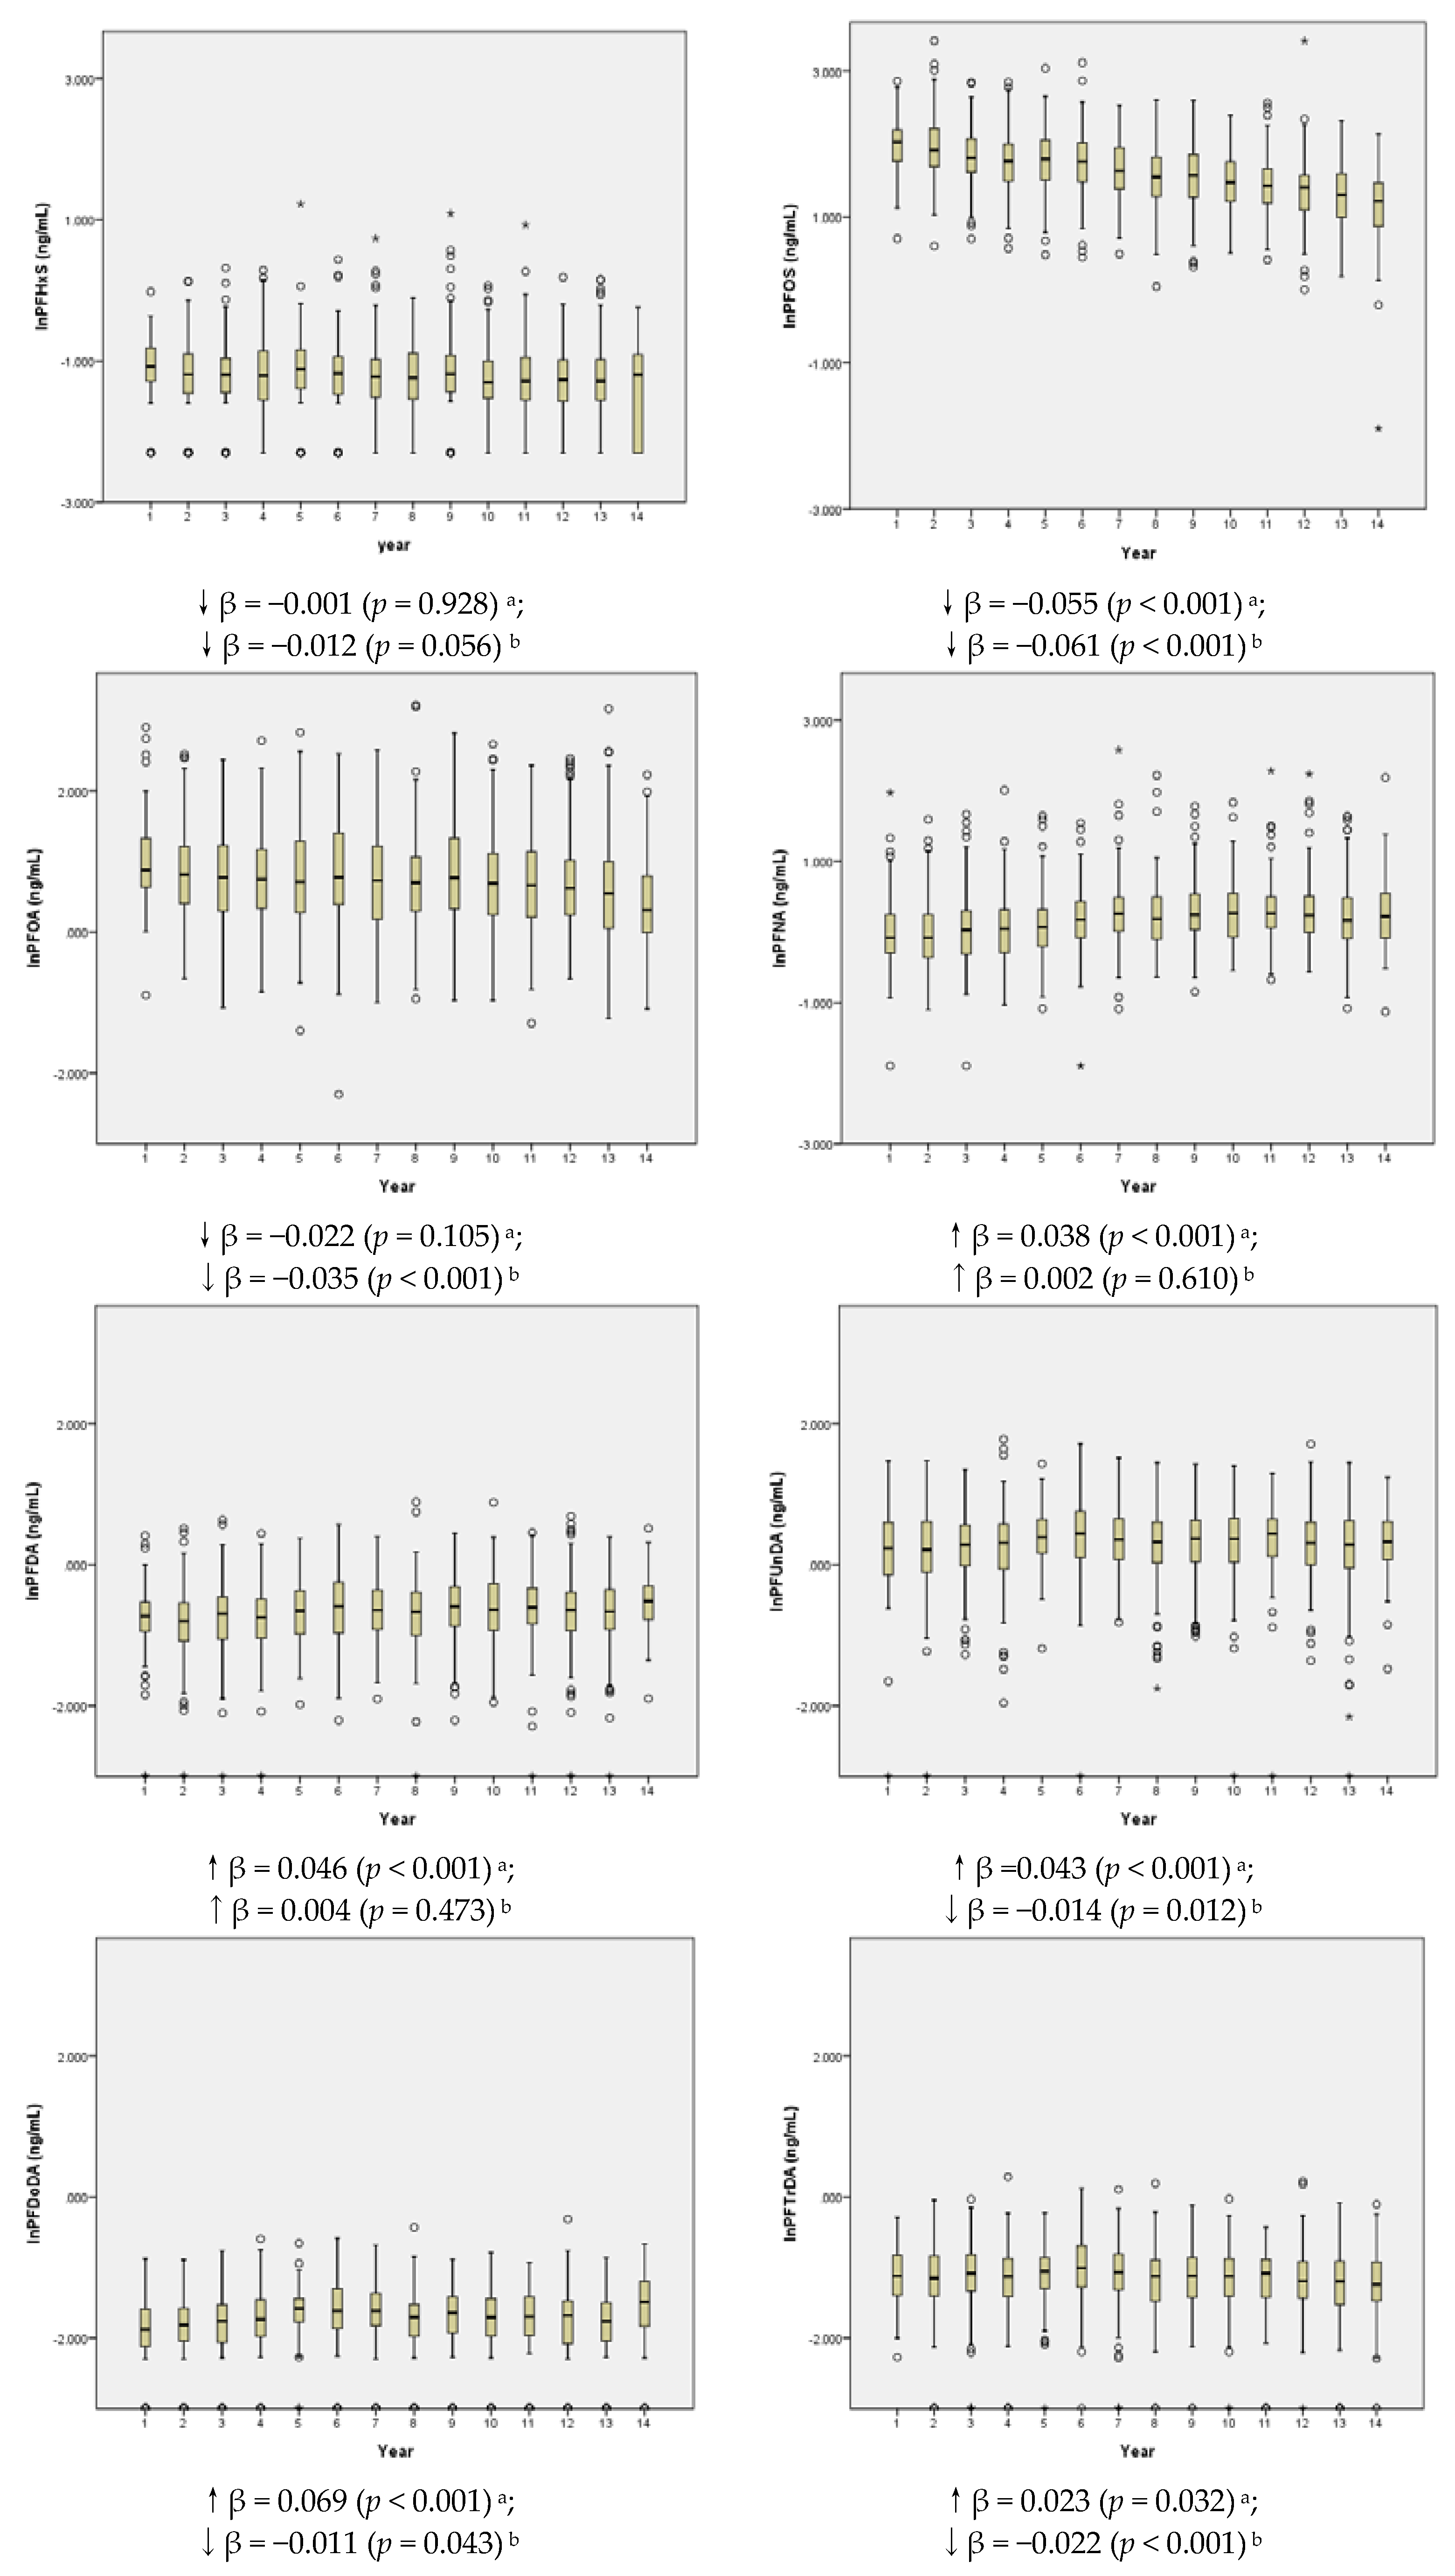
4.7. Temporal Trend
5. Conclusions
Supplementary Materials
Author Contributions
Acknowledgments
Conflicts of Interest
References
- Lau, C.; Butenhoff, J.L.; Rogers, J.M. The developmental toxicity of perfluoroalkyl acids and their derivatives. Toxicol. Appl. Pharmacol. 2004, 198, 231–241. [Google Scholar] [CrossRef] [PubMed]
- Prevedouros, K.; Cousins, I.T.; Buck, R.C.; Korzeniowski, S.H. Sources, fate and transport of perfluorocarboxylates. Environ. Sci. Technol. 2006, 40, 32–44. [Google Scholar] [CrossRef] [PubMed]
- United States Environmental Protection Agency, (U.S. EPA). 2010/2015: PFOA Stewardship Program; United States Environmental Protection Agency: Washington, DC, USA, 2006.
- REACH. Available online: http://ec.europa.eu/environment/chemicals/international_conventions/index_en.htm (accessed on 24 November 2017).
- Land, M.; de Wit, C.A.; Cousins, I.T.; Herzke, D.; Johansson, J.; Martin, J.W. What is the effect of phasing out long-chain per- and polyfluoroalkyl substances on the concentrations of perfluoroalkyl acids and their precursors in the environment? A systematic review protocol. Environ. Evid. 2015, 4, 3. [Google Scholar] [CrossRef] [Green Version]
- Berg, V.; Nost, T.H.; Huber, S.; Rylander, C.; Hansen, S.; Veyhe, A.S.; Fuskevåg, O.M.; Odland, J.Ø.; Sandanger, T.M. Maternal serum concentrations of per-and polyfluoroalkyl substances and their predictors in years with reduced production and use. Environ. Int. 2014, 69, 58–66. [Google Scholar] [CrossRef] [PubMed] [Green Version]
- Wang, M.; Park, J.S.; Petreas, M. Temporal changes in the levels of perfluorinated compounds in California women’s serum over the past 50 years. Environ. Sci. Technol. 2011, 45, 7510–7516. [Google Scholar] [CrossRef] [PubMed]
- Bjerregaard-Olesen, C.; Bach, C.C.; Long, M.; Ghisari, M.; Bossi, R.; Bech, B.H.; Nohr, E.A.; Henriksen, T.B.; Olsen, J.; Bonefeld-Jørgensen, E.C. Time trends of perfluorinated alkyl acids in serum from Danish pregnant women 2008–2013. Environ. Int. 2016, 91, 14–21. [Google Scholar] [CrossRef] [PubMed]
- Kristensen, S.L.; Ramlau-Hansen, C.H.; Ernst, E.; Olsen, S.F.; Bonde, J.P.; Vested, A.; Halldorsson, T.I.; Becher, G.; Haug, L.S.; Toft, G. Long-term effects of prenatal exposure to perfluoroalkyl substances on female reproduction. Hum. Reprod. 2013, 28, 3337–3348. [Google Scholar] [CrossRef] [PubMed]
- Saito, N.; Harada, K.; Inoue, K.; Sasaki, K.; Yoshinaga, T.; Koizumi, A. Perfluorooctanoate and perfluorooctane sulfonate concentrations in surface water in japan. J. Occup. Health 2004, 46, 49–59. [Google Scholar] [CrossRef] [PubMed]
- Lien, N.P.H.; Fujii, S.; Tanaka, S.; Nozoe, M.; Wirojanagud, W.; Anton, A.; Lindstrom, G. Perfluorinated substances in tap water of japan and several countries and their relationship to surface water contamination. Environ. Eng. Res. 2006, 43, 611–618. [Google Scholar]
- Goudarzi, H.; Nakajima, S.; Ikeno, T.; Sasaki, S.; Kobayashi, S.; Miyashita, C.; Ito, S.; Araki, A.; Nakazawa, H.; Kishi, R. Prenatal exposure to perfluorinated chemicals and neurodevelopment in early infancy: The Hokkaido study. Sci. Total Environ. 2016, 541, 1002–1010. [Google Scholar] [CrossRef] [PubMed]
- Kato, S.; Itoh, S.; Yuasa, M.; Baba, T.; Miyashita, C.; Sasaki, S.; Nakajima, S.; Uno, A.; Nakazawa, H.; Iwasaki, Y.; et al. Association of perfluorinated chemical exposure in utero with maternal and infant thyroid hormone levels in the Sapporo cohort of Hokkaido study on the environment and children’s health. Environ. Health Prev. Med. 2016, 21, 334–344. [Google Scholar] [CrossRef] [PubMed]
- Itoh, S.; Araki, A.; Mitsui, T.; Miyashita, C.; Goudarzi, H.; Sasaki, S.; Cho, K.; Nakazawa, H.; Iwasaki, Y.; Shinohara, N.; et al. Association of perfluoroalkyl substances exposure in utero with reproductive hormone levels in cord blood in the Hokkaido study on environment and children’s health. Environ. Int. 2016, 94, 51–59. [Google Scholar] [CrossRef] [PubMed]
- Goudarzi, H.; Araki, A.; Itoh, S.; Sasaki, S.; Miyashita, C.; Mitsui, T.; Nakazawa, H.; Nonomura, K.; Kishi, R. The association of prenatal exposure to perfluorinated chemicals with glucocorticoid and androgenic hormones in cord blood samples: The Hokkaido study. Environ. Health Perspect. 2017, 125, 111–118. [Google Scholar] [CrossRef] [PubMed]
- Minatoya, M.; Itoh, S.; Miyashita, C.; Araki, A.; Sasaki, S.; Miura, R.; Goudarzi, H.; Iwasaki, Y.; Kishi, R. Association of prenatal exposure to perfluoroalkyl substances with cord blood adipokines and birth size: The Hokkaido study on environment and children’s health. Environ. Res. 2017, 156, 175–182. [Google Scholar] [CrossRef] [PubMed]
- Okada, E.; Sasaki, S.; Kashino, I.; Matsuura, H.; Miyashita, C.; Kobayashi, S.; Itoh, K.; Ikeno, T.; Tamakoshi, A.; Kishi, R. Prenatal exposure to perfluoroalkyl acids and allergic diseases in early childhood. Environ. Int. 2014, 65, 127–134. [Google Scholar] [CrossRef] [PubMed]
- Goudarzi, H.; Miyashita, C.; Okada, E.; Kashino, I.; Kobayashi, S.; Chen, C.J.; Ito, S.; Araki, A.; Matsuura, H.; Ito, Y.M.; et al. Effects of prenatal exposure to perfluoroalkyl acids on prevalence ofallergic diseases among 4-year-old children. Environ. Int. 2016, 94, 124–132. [Google Scholar] [CrossRef] [PubMed]
- Kishi, R.; Nakajima, T.; Goudarzi, H.; Kobayashi, S.; Sasaki, S.; Okada, E.; Miyashita, C.; Itoh, S.; Araki, A.; Ikeno, T.; et al. The association of prenatal exposure to perfluorinated chemicals with maternal essential and long-chain polyunsaturated fatty acids during pregnancy and the birth weight of their offspring: The Hokkaido study. Environ. Health Perspect. 2015, 123, 1038–1045. [Google Scholar] [CrossRef] [PubMed]
- Bjorklund, J.A.; Thuresson, K.; De Wit, C.A. Perfluoroalkyl compounds (pfcs) in indoor dust: Concentrations, human exposure estimates, and sources. Environ. Sci. Technol. 2009, 43, 2276–2281. [Google Scholar] [CrossRef] [PubMed]
- Trier, X.; Granby, K.; Christensen, J.H. Polyfluorinated surfactants (pfs) in paper and board coatings for food packaging. Environ. Sci. Pollut. Res. Int. 2011, 18, 1108–1120. [Google Scholar] [CrossRef] [PubMed]
- Washino, N.; Saijo, Y.; Sasaki, S.; Kato, S.; Ban, S.; Konishi, K.; Ito, R.; Nakata, A.; Iwasaki, Y.; Saito, K.; et al. Correlations between prenatal exposure to perfluorinated chemicals and reduced fetal growth. Environ. Health Perspect. 2009, 117, 660–667. [Google Scholar] [CrossRef] [PubMed]
- Fei, C.; McLaughlin, J.K.; Tarone, R.E.; Olsen, J. Perfluorinated chemicals and fetal growth: A study within the danish national birth cohort. Environ. Health Perspect. 2007, 115, 1677–1682. [Google Scholar] [CrossRef] [PubMed]
- Bjerregaard-Olesen, C.; Bach, C.C.; Long, M.; Ghisari, M.; Bech, B.H.; Nohr, E.A.; Henriksen, T.B.; Olsen, J.; Bonefeld-Jørgensen, E.C. Determinants of serum levels of perfluorinated alkyl acids in Danish pregnant women. Int. J. Hyg. Environ. Health 2016, 219, 867–875. [Google Scholar] [CrossRef] [PubMed]
- Brantsaeter, A.L.; Whitworth, K.W.; Ydersbond, T.A.; Haug, L.S.; Haugen, M.; Knutsen, H.K.; Thomsen, C.; Meltzer, H.M.; Becher, G.; Sabaredzovic, A.; et al. Determinants of plasma concentrations of perfluoroalkyl substances in pregnant Norwegian women. Environ. Int. 2013, 54, 74–84. [Google Scholar] [CrossRef] [PubMed]
- Lewin, A.; Arbuckle, T.E.; Fisher, M.; Liang, C.L.; Marro, L.; Davis, K.; Abdelouahab, N.; Fraser, W.D. Univariate predictors of maternal concentrations of environmental chemicals: The MIREC study. Int. J. Hyg. Environ. Health 2017, 220, 77–85. [Google Scholar] [CrossRef] [PubMed]
- Eriksson, U.; Mueller, J.F.; Toms, L.L.; Hobson, P.; Karrman, A. Temporal trends of PFSAs, PFCAs and selected precursors in Australian serum from 2002 to 2013. Environ. Pollut. 2017, 220, 168–177. [Google Scholar] [CrossRef] [PubMed]
- Wilhelm, M.; Wittsiepe, J.; Volkel, W.; Fromme, H.; Kasper-Sonnenberg, M. Perfluoroalkyl acids in children and their mothers: Association with drinking water and time trends of inner exposures--results of the Duisburg birth cohort and Bochum cohort studies. Int. J. Hyg. Environ. Health 2015, 218, 645–655. [Google Scholar] [CrossRef] [PubMed]
- Okada, E.; Kashino, I.; Matsuura, H.; Sasaki, S.; Miyashita, C.; Yamamoto, J.; Ikeno, T.; Ito, Y.M.; Matsumura, T.; Tamakoshi, A.; et al. Temporal trends of perfluoroalkyl acids in plasma samples of pregnant women in Hokkaido, Japan, 2003–2011. Environ. Int. 2013, 60, 89–96. [Google Scholar] [CrossRef] [PubMed]
- Kishi, R.; Sasaki, S.; Yoshioka, E.; Yuasa, M.; Sata, F.; Saijo, Y.; Kurahashi, N.; Tamaki, J.; Endo, T.; Sengoku, K.; et al. Cohort profile: The Hokkaido study on environment and children’s health in japan. Int. J. Epidemiol. 2011, 40, 611–618. [Google Scholar] [CrossRef] [PubMed]
- Kishi, R.; Kobayashi, S.; Ikeno, T.; Araki, A.; Miyashita, C.; Itoh, S.; Sasaki, S.; Okada, E.; Kobayashi, S.; Kashino, I.; et al. Ten years of progress in the hokkaido birth cohort study on environment and children’s health: Cohort profile—Updated 2013. Environ. Health Prev. Med. 2013, 18, 429–450. [Google Scholar] [CrossRef] [PubMed]
- Kishi, R.; Araki, A.; Minatoya, M.; Hanaoka, T.; Miyashita, C.; Itoh, S.; Kobayashi, S.; Bamai, Y.A.; Yamazaki, K.; Miura, R.; et al. The Hokkaido birth cohort study on environment and children’s health: Cohort profile-updated 2017. Environ. Health Prev. Med. 2017, 22, 46. [Google Scholar] [CrossRef] [PubMed]
- Sasaki, S.; Braimoh, T.S.; Yila, T.A.; Yoshioka, E.; Kishi, R. Self-reported tobacco smoke exposure and plasma cotinine levels during pregnancy—A validation study in Northern Japan. Sci. Total Environ. 2011, 412–413, 114–118. [Google Scholar] [CrossRef] [PubMed]
- Lee, S.; Kim, S.; Park, J.; Kim, H.J.; Choi, G.; Choi, S.; Kim, S.; Kim, S.Y.; Kim, S.; Choi, K.; et al. Perfluoroalkyl substances (PFASs) in breast milk from Korea: Time-course trends, influencing factors, and infant exposure. Sci. Total Environ. 2017, 612, 286–292. [Google Scholar] [CrossRef] [PubMed]
- Lien, G.W.; Huang, C.C.; Wu, K.Y.; Chen, M.H.; Lin, C.Y.; Chen, C.Y.; Hsieh, W.S.; Chen, P.C. Neonatal-maternal factors and perfluoroalkyl substances in cord blood. Chemosphere 2013, 92, 843–850. [Google Scholar] [CrossRef] [PubMed]
- Ode, A.; Rylander, L.; Lindh, C.H.; Kallen, K.; Jonsson, B.A.; Gustafsson, P.; Olofsson, P.; Ivarsson, S.A.; Rignell-Hydbom, A. Determinants of maternal and fetal exposure and temporal trends of perfluorinated compounds. Environ. Sci. Pollut. Res. Int. 2013, 20, 7970–7978. [Google Scholar] [CrossRef] [PubMed]
- Lauritzen, H.B.; Larose, T.L.; Oien, T.; Odland, J.O.; van de Bor, M.; Jacobsen, G.W.; Sandanger, T.M. Factors associated with maternal serum levels of perfluoroalkyl substances and organochlorines: A descriptive study of parous women in Norway and Sweden. PLoS ONE 2016, 11, e0166127. [Google Scholar] [CrossRef] [PubMed]
- Jensen, T.K.; Andersen, L.B.; Kyhl, H.B.; Nielsen, F.; Christesen, H.T.; Grandjean, P. Association between perfluorinated compound exposure and miscarriage in danish pregnant women. PLoS ONE 2015, 10, e0123496. [Google Scholar] [CrossRef] [PubMed]
- Maestri, L.; Negri, S.; Ferrari, M.; Ghittori, S.; Fabris, F.; Danesino, P.; Imbriani, M. Determination of perfluorooctanoic acid and perfluorooctanesulfonate in human tissues by liquid chromatography/single quadrupole mass spectrometry. Rapid Commun. Mass Spectrom. 2006, 20, 2728–2734. [Google Scholar] [CrossRef] [PubMed]
- Seacat, A.M.; Thomford, P.J.; Hansen, K.J.; Olsen, G.W.; Case, M.T.; Butenhoff, J.L. Subchronic toxicity studies on perfluorooctanesulfonate potassium salt in cynomolgus monkeys. Toxicol. Sci. 2002, 68, 249–264. [Google Scholar] [CrossRef] [PubMed]
- Morck, T.A.; Nielsen, F.; Nielsen, J.K.; Siersma, V.D.; Grandjean, P.; Knudsen, L.E. PFAS concentrations in plasma samples from Danish school children and their mothers. Chemosphere 2015, 129, 203–209. [Google Scholar] [CrossRef] [PubMed]
- Lorber, M.; Eaglesham, G.E.; Hobson, P.; Toms, L.M.; Mueller, J.F.; Thompson, J.S. The effect of ongoing blood loss on human serum concentrations of perfluorinated acids. Chemosphere 2015, 118, 170–177. [Google Scholar] [CrossRef] [PubMed]
- Bjermo, H.; Darnerud, P.O.; Pearson, M.; Barbieri, H.E.; Lindroos, A.K.; Nalsen, C.; Lindh, C.H.; Jönsson, B.A.; Glynn, A. Serum concentrations of perfluorinated alkyl acids and their associations with diet and personal characteristics among Swedish adults. Mol. Nutr. Food Res. 2013, 57, 2206–2215. [Google Scholar] [CrossRef] [PubMed]
- Jian, J.M.; Guo, Y.; Zeng, L.; Liang-Ying, L.; Lu, X.; Wang, F.; Zeng, E.Y. Global distribution of perfluorochemicals (PFCs) in potential human exposure source—A review. Environ. Int. 2017, 108, 51–62. [Google Scholar] [CrossRef] [PubMed]
- Trudel, D.; Horowitz, L.; Wormuth, M.; Scheringer, M.; Cousins, I.T.; Hungerbuhler, K. Estimating consumer exposure to PFOS and PFOA. Risk Anal. 2008, 28, 251–269. [Google Scholar] [CrossRef] [PubMed]
- Benowitz, N.L.; Jacob, P., 3rd. Metabolism of nicotine to cotinine studied by a dual stable isotope method. Clin. Pharmacol. Ther. 1994, 56, 483–493. [Google Scholar] [CrossRef] [PubMed]
- Sjogren, P.; Montse, R.; Lampa, E.; Salihovic, S.; van Bavel, B.; Lind, L.; Lind, P.M. Circulating levels of perfluoroalkyl substances are associated with dietary patterns—A cross sectional study in elderly Swedish men and women. Environ. Res. 2016, 150, 59–65. [Google Scholar] [CrossRef] [PubMed]
- Glynn, A.; Berger, U.; Bignert, A.; Ullah, S.; Aune, M.; Lignell, S. Perfluorinated alkyl acids in blood serum from primiparous women in Sweden: Serial sampling during pregnancy and nursing, and temporal trends 1996–2010. Environ. Sci. Technol. 2012, 46, 9071–9079. [Google Scholar] [CrossRef] [PubMed]
- Kishi, R.; Araki, A.; Minatoya, M.; Itoh, S.; Goudarzi, H.; Miyashita, C. Birth cohorts in Asia: The importance, advantages, and disadvantages of different-sized cohorts. Sci. Total Environ. 2018, 615, 1143–1154. [Google Scholar] [CrossRef] [PubMed]
- Tahara, R.; Yamaguchi, T. Deposition of perfluorinated chemicals during winter in Hokkaido. J. Environ. Chem. 2014, 24, 7. [Google Scholar] [CrossRef]


| n | % | |
|---|---|---|
| Age at delivery (years) | ||
| <25 | 183 | 8.62 |
| 25~29 | 607 | 28.58 |
| 30~34 | 882 | 41.53 |
| ≥35 | 451 | 21.28 |
| Prepregnancy BMI | ||
| <18.5 | 385 | 18.13 |
| 18.5~24.9 | 1554 | 73.21 |
| ≥25 | 184 | 8.66 |
| Parity | ||
| 0 | 962 | 45.29 |
| 1 | 818 | 38.56 |
| ≥2 | 343 | 16.15 |
| Education level (years) | ||
| ≤9 | 64 | 3.01 |
| 10~12 | 879 | 41.38 |
| 13~16 | 933 | 43.97 |
| >16 | 247 | 11.63 |
| Cotinine Level in 3rd trimester | ||
| Non-smoker (<0.22 ng/mL) | 929 | 43.74 |
| Passive smoker (0.22–11.49 ng/mL) | 1017 | 47.88 |
| Active smoker (>11.49 ng/mL) | 177 | 8.38 |
| Alcohol consumption history | ||
| No | 912 | 42.94 |
| Yes | 1211 | 57.06 |
| Annual housed income (million yen) | ||
| <3 | 422 | 19.87 |
| 3~5 | 960 | 45.20 |
| >5 | 741 | 34.93 |
| MDL a | n | % | GM | Mean | Min | 25th | 50th | 75th | Max | |
|---|---|---|---|---|---|---|---|---|---|---|
| PFHxS (C6) | 0.2 | 1732 | 81.54 | 0.34 | 0.37 | <0.2 | 0.26 | 0.33 | 0.42 | 3.39 |
| PFHxA (C6) | 0.1 | 976 | 45.95 | 0.16 | 0.16 | <0.1 | <0.1 | <0.1 | 0.18 | 0.69 |
| PFHpA (C7) | 0.1 | 740 | 34.84 | 0.16 | 0.18 | <0.1 | <0.1 | <0.1 | 0.20 | 1.02 |
| PFOS (C8) | 0.3 | 2123 | 99.95 | 4.96 | 5.74 | 0.81 | 3.66 | 4.96 | 6.79 | 30.28 |
| PFOA (C8) | 0.2 | 2123 | 99.95 | 2.06 | 2.64 | 0.25 | 1.29 | 2.00 | 3.24 | 24.88 |
| PFNA (C9) | 0.3 | 2121 | 99.86 | 1.19 | 1.35 | 0.32 | 0.87 | 1.15 | 1.57 | 13.19 |
| PFDA (C10) | 0.1 | 2110 | 99.34 | 0.51 | 0.57 | <0.1 | 0.39 | 0.52 | 0.69 | 2.43 |
| PFUnDA (C11) | 0.1 | 2117 | 99.67 | 1.35 | 1.50 | 0.11 | 1.02 | 1.40 | 1.87 | 5.89 |
| PFDoDA (C12) | 0.1 | 1915 | 90.16 | 0.19 | 0.21 | <0.1 | 0.15 | 0.19 | 0.24 | 0.73 |
| PFTrDA (C13) | 0.1 | 2073 | 97.60 | 0.32 | 0.35 | <0.1 | 0.25 | 0.33 | 0.42 | 1.33 |
| PFTeDA (C14) | 0.1 | 308 | 14.50 | 0.12 | 0.12 | <0.1 | <0.1 | <0.1 | <0.1 | 0.30 |
| PFHxS | PFOS | PFOA | PFNA | PFDA | PFUnDA | PFDoDA | PFTrDA | |
|---|---|---|---|---|---|---|---|---|
| Age at delivery (years) | ||||||||
| <25 | 0.298 (0.276, 0.320) | 5.211 (4.857, 5.565) | 2.797 (2.515, 3.080) | 1.264 (1.184, 1.345) | 0.539 (0.503, 0.576) | 1.326 (1.221, 1.431) | 0.176 (0.164, 0.189) | 0.318 (0.297, 0.339) |
| 25~29 | 0.334 (0.317, 0.350) | 6.080 (5.821, 6.339) | 2.779 (2.596, 2.962) | 1.346 (1.284, 1.408) | 0.569 (0.547, 0.592) | 1.476 (1.422, 1.530) | 0.187 (0.181, 0.194) | 0.338 (0.326, 0.349) |
| 30~34 | 0.320 (0.305, 0.335) | 5.295 (5.136, 5.455) | 2.588 (2.448, 2.728) | 1.368 (1.304, 1.431) | 0.560 (0.543, 0.578) | 1.522 (1.475, 1.568) | 0.193 (0.187, 0.198) | 0.350 (0.340, 0.361) |
| ≥35 | 0.322 (0.304, 0.341) | 5.391 (5.138, 5.651) | 2.497 (2.263, 2.914) | 1.365 (1.277, 1.389) | 0.573 (0.546, 0.600) | 1.559 (1.486, 1.630) | 0.193 (0.185, 0.201) | 0.356 (0.342, 0.352) |
| Prepregnancy BMI | ||||||||
| <18.5 | 0.327 (0.304, 0.351) | 5.800 (5.512, 6.088) | 2.665 (2.470, 2.859) | 1.436 (1.335, 1.534) | 0.589 (0.559, 0.617) | 1.559 (1.472, 1.640) | 0.200 (0.191, 0.209) | 0.360 (0.343, 0.378) |
| 18.5~24.9 | 0.322 (0.312, 0.332) | 5.532 (5.382, 5.654) | 2.668 (2.545, 2.774) | 1.344 (1.298, 1.383) | 0.564 (0.548, 0.576) | 1.507 (1.466, 1.535) | 0.191 (0.187, 0.195) | 0.347 (0.339, 0.354) |
| ≥25 | 0.317 (0.284, 0.348) | 5.109 (4.689, 5.518) | 2.402 (2.099, 2.733) | 1.268 (1.154, 1.389) | 0.529 (0.497, 0.563) | 1.373 (1.284, 1.461) | 0.161 (0.151, 0.171) | 0.306 (0.285, 0.327) |
| Parity | ||||||||
| 0 | 0.361 (0.346, 0.375) | 6.209 (5.993, 6.371) | 3.347 (3.189, 3.514) | 1.517 (1.466, 1.586) | 0.603 (0.587, 0.626) | 1.494 (1.450, 1.542) | 0.189 (0.185, 0.195) | 0.343 (0.333, 0.352) |
| 1 | 0.295 (0.280, 0.309) | 5.193 (4.992, 5.347) | 2.173 (2.039, 2.289) | 1.245 (1.183, 1.301) | 0.533 (0.516, 0.550) | 1.506 (1.449, 1.548) | 0.191 (0.185, 0.196) | 0.349 (0.336, 0.357) |
| ≥2 | 0.280 (0.266, 0.299) | 4.604 (4.364, 4.804) | 1.768 (1.641, 1.913) | 1.119 (1.065, 1.182) | 0.517 (0.494, 0.542) | 1.515 (1.439, 1.585) | 0.187 (0.178, 0.195) | 0.349 (0.333, 0.365) |
| Education level (years) | ||||||||
| ≤9 | 0.330 (0.287, 0.372) | 4.901 (4.220, 5.582) | 2.893 (2.322, 3.464) | 1.142 (1.007, 1.276) | 0.481 (0.408, 0.554) | 1.230 (1.029, 1.431) | 0.171 (0.147, 0.196) | 0.315 (0.271, 0.359) |
| 10~12 | 0.301 (0.289, 0.312) | 5.332 (5.164, 5.501) | 2.502 (2.360, 2.644) | 1.268 (1.220, 1.316) | 0.542 (0.524, 0.560) | 1.437 (1.391, 1.484) | 0.184 (0.179, 0.189) | 0.336 (0.326, 0.346) |
| 13~16 | 0.327 (0.313, 0.341) | 5.549 (5.366, 5.736) | 2.590 (2.453, 2.718) | 1.377 (1.314, 1.437) | 0.578 (0.560, 0.596) | 1.544 (1.497, 1.590) | 0.194 (0.188, 0199) | 0.354 (0.344, 0.363) |
| >16 | 0.381 (0.346, 0.415) | 6.349 (5.971, 6.726) | 3.263 (2.897, 3.629) | 1.613 (1.482, 1.744) | 0.612 (0.577, 0.647) | 1.626 (1.535, 1.716) | 0.200 (0.190, 0.210) | 0.355 (0.336, 0.374) |
| Cotinine Level in 3rd trimester | ||||||||
| Non-smoker (<0.22 ng/mL) | 0.333 (0.317,.349) | 5.383 (5.207, 5.560) | 2.568 (2.428, 2.707) | 1.377 (1.321, 1.433) | 0.568 (0.551, 0.586) | 1.520 (1.475, 1.566) | 0.193 (0.188, 0.199) | 0.344 (0.334, 0.353) |
| Passive smoker (0.22–11.49 ng/mL) | 0.313 (0.302, 0.324) | 5.701 (5.533, 5.869) | 2.709 (2.567, 2.851) | 1.356 (1.299, 1.412) | 0.567 (0.550, 0.584) | 1.509 (1.464,.553) | 0.189 (0.183, 0.194) | 0.347 (0.338, 0.357) |
| Active smoker (>11.49 ng/mL) | 0.323 (0.293, 0.351) | 5.352 (4.893, 5.825) | 2.636 (2.312, 2.919) | 1.203 (1.107, 1.282) | 0.524 (0.482, 0.562) | 1.341 (1.231, 1.442) | 0.178 (0.165, 0.190) | 0.343 (0.318, 0.368) |
| Alcohol consumption history | ||||||||
| No | 0.320 (0.305, 0.334) | 5.487 (5.319, 5.655) | 2.573 (2.436, 2.711) | 1.372 (1.310, 1.433) | 0.575 (0.558, 0.593) | 1.524 (1.474, 1.573) | 0.191 (0.186, 0.197) | 0.345 (0.334, 0.355) |
| Yes | 0.325 (0.313, 0.336) | 5.567 (5.405, 5.733) | 2.692 (2.559, 2.819) | 1.338 (1.290, 1.383) | 0.555 (0.540, 0.571) | 1.482 (1.443, 1.520) | 0.189 (0.184, 0.193) | 0.346 (0.337, 0.354) |
| Annual housed income (million yen) | ||||||||
| <3 | 0.307 (0.290, 0.324) | 5.140 (4.969, 5.447) | 2.526 (2.325, 2.712) | 1.265 (1.193, 1.348) | 0.532 (0.508, 0.559) | 1.440 (1.371, 1514) | 0.186 (0.177, 0.194) | 0.342 (0.326, 0.356) |
| 3~5 | 0.310 (0.301, 0.325) | 5.387 (5.275, 5.625) | 2.564 (2.437, 2.714) | 1.323 (1.262, 1.363) | 0.564 (0.46, 0.581) | 1.500 (1.445, 1.535) | 0.189 (0.183, 0.194) | 0.341 (0.330, 0.349) |
| >5 | 0.346 (0.325, 0.361) | 5.821 (5.617, 5.652) | 2.850 (2.620, 2.963) | 1.475 (1.376, 1.520) | 0.585 (0.561, 0.601) | 1.552 (1.493, 1.596) | 0.194 (0.188, 0.200) | 0.356 (0.344, 0.367) |
| PFHxS | PFOS | PFOA | PFNA | PFDA | PFUnDA | PFDoDA | PFTrDA | |
|---|---|---|---|---|---|---|---|---|
| Age at delivery (years) | ||||||||
| <25 | ref | ref | ref | ref | ref | ref | ref | ref |
| 25~29 | 0.071 (−0.026, 0.169) | 0.114 (0.036, 0.191) | −0.028 (−0.136, 0.081) | 0.006 (−0.072, 0.085) | 0.014 (−0.07, 0.098) | 0.103 (0.015, 0.191) | 0.046 (−0.04, 0.132) | 0.02 (−0.063, 0.104) |
| 30~34 | 0.028 (−0.068, 0.124) | 0.026 (−0.05, 0.103) | −0.049 (−0.156, 0.058) | 0.019 (−0.058, 0.097) | 0.012 (−0.07, 0.095) | 0.118 (0.031, 0.205) | 0.088 (0.003, 0.173) | 0.063 (−0.02, 0.145) |
| ≥35 | 0.054 (−0.051, 0.159) | 0.064 (−0.02, 0.148) | −0.038 (−0.156, 0.079) | 0.041 (−0.044, 0.126) | 0.046 (−0.044, 0.136) | 0.131 (0.036, 0.227) | 0.071 (−0.022, 0.164) | 0.078 (−0.012, 0.168) |
| p for trend | 0.895 | 0.574 | 0.498 | 0.224 | 0.272 | 0.025 | 0.094 | 0.026 |
| Preprgnancy BMI | ||||||||
| <18.5 | −0.032 (−0.096, 0.032) | 0.034 (−0.018, 0.085) | 0.001 (−0.071, 0.072) | 0.058 (0.006, 0.11) | 0.033 (−0.022, 0.089) | 0.035 (−0.023, 0.094) | 0.056 (−0.001, 0.113) | 0.037 (−0.018, 0.092) |
| 18.5~24.9 | ref | ref | ref | ref | ref | ref | ref | ref |
| ≥25 | 0.021 (−0.067, 0.109) | −0.036 (−0.107, 0.034) | −0.034 (−0.133, 0.064) | −0.012 (−0.083, 0.06) | −0.015 (−0.091, 0.061) | −0.07 (−0.15, 0.009) | −0.166 (−0.244, −0.088) | −0.162 (−0.238, −0.087) |
| Parity | ||||||||
| 0 | ref | ref | ref | ref | ref | ref | ref | ref |
| 1 | −0.225 (−0.28, −0.17) | −0.172 (−0.216, −0.127) | −0.447 (−0.508, −0.386) | −0.201 (−0.245, −0.156) | −0.106 (−0.153, −0.059) | 0.015 (−0.035, 0.065) | 0.006 (−0.043, 0.054) | 0.005 (−0.042, 0.052) |
| ≥2 | −0.233 (−0.305, −0.16) | −0.286 (−0.344, −0.227) | −0.621 (−0.702, −0.54) | −0.271 (−0.33, −0.212) | −0.135 (−0.197, −0.072) | 0.025 (−0.042, 0.091) | −0.007 (−0.071, 0.058) | 0.021 (−0.042, 0.083) |
| p for trend | <0.001 | <0.001 | <0.001 | <0.001 | <0.001 | 0.382 | 0.922 | 0.582 |
| Education level (years) | ||||||||
| ≤9 | ref | ref | ref | ref | ref | ref | ref | ref |
| 10~12 | −0.145 (−0.291, 0.002) | 0.106 (−0.011, 0.224) | −0.173 (−0.337, −0.01) | 0.058 (−0.061, 0.176) | 0.159 (0.033, 0.285) | 0.212 (0.079, 0.345) | 0.077 (−0.052, 0.207) | 0.067 (−0.059, 0.192) |
| 13~16 | −0.087 (−0.234, 0.061) | 0.122 (0.003, 0.24) | −0.133 (−0.297, 0.031) | 0.099 (−0.021, 0.218) | 0.208 (0.081, 0.335) | 0.265 (0.131, 0.399) | 0.122 (−0.008, 0.253) | 0.117 (−0.01, 0.243) |
| >16 | 0.016 (−0.145, 0.177) | 0.229 (0.1, 0.358) | −0.007 (−0.187, 0.172) | 0.218 (0.088, 0.349) | 0.267 (0.128, 0.406) | 0.322 (0.176, 0.468) | 0.155 (0.013, 0.298) | 0.106 (−0.032, 0.244) |
| p for trend | 0.004 | <0.001 | 0.022 | <0.001 | <0.001 | <0.001 | 0.005 | 0.032 |
| Cotinine Level in 3rd trimester | ||||||||
| Non-smoker (<0.22 ng/mL) | ref | ref | ref | ref | ref | ref | ref | ref |
| Passive smoker (0.22–11.49 ng/mL) | −0.007 (−0.059, 0.046) | 0.069 (0.027, 0.111) | 0.060 (0.002, 0.119) | −0.004 (−0.047, 0.038) | −0.002 (−0.047, 0.043) | 0.015 (−0.033, 0.062) | −0.01 (−0.057, 0.036) | 0.026 (−0.019, 0.071) |
| Active smoker (>11.49 ng/mL) | 0.068 (−0.028, 0.163) | 0.034 (−0.042, 0.11) | 0.104 (−0.003, 0.210) | −0.043 (−0.121, 0.034) | −0.049 (−0.132, 0.033) | −0.111 (−0.198, −0.025) | −0.059 (−0.143, 0.026) | 0.015 (−0.066, 0.097) |
| p for trend | 0.43 | 0.019 | 0.021 | 0.398 | 0.404 | 0.176 | 0.248 | 0.381 |
| Alcohol consumption history | ||||||||
| No | ref | ref | ref | ref | ref | ref | ref | ref |
| Yes | 0.012 (−0.013, 0.037) | 0.002 (−0.018, 0.022) | 0.012 (−0.015, 0.04) | −0.008 (−0.028, 0.012) | −0.027 (−0.048, −0.006) | −0.019 (−0.041, 0.004) | −0.011 (−0.033, 0.011) | 0.001 (−0.021, 0.022) |
| Annual housed income (million yen) | ||||||||
| <3 | ref | ref | ref | ref | ref | ref | ref | ref |
| 3~5 | −0.007 (−0.074, 0.059) | 0.039 (−0.015, 0.092) | 0.015 (−0.059, 0.089) | 0.027 (−0.026, 0.081) | 0.045 (−0.012, 0.102) | 0.019 (−0.041, 0.08) | 0.014 (−0.045, 0.072) | −0.016 (−0.073, 0.041) |
| >5 | 0.064 (−0.008, 0.136) | 0.094 (0.036, 0.152) | 0.111 (0.031, 0.191) | 0.08 (0.022, 0.139) | 0.052 (−0.01, 0.114) | 0.034 (−0.031, 0.1) | 0.025 (−0.039, 0.089) | 0.012 (−0.049, 0.074) |
| p for trend | 0.041 | 0.001 | 0.003 | 0.004 | 0.127 | 0.304 | 0.438 | 0.565 |
© 2018 by the authors. Licensee MDPI, Basel, Switzerland. This article is an open access article distributed under the terms and conditions of the Creative Commons Attribution (CC BY) license (http://creativecommons.org/licenses/by/4.0/).
Share and Cite
Tsai, M.-S.; Miyashita, C.; Araki, A.; Itoh, S.; Bamai, Y.A.; Goudarzi, H.; Okada, E.; Kashino, I.; Matsuura, H.; Kishi, R. Determinants and Temporal Trends of Perfluoroalkyl Substances in Pregnant Women: The Hokkaido Study on Environment and Children’s Health. Int. J. Environ. Res. Public Health 2018, 15, 989. https://doi.org/10.3390/ijerph15050989
Tsai M-S, Miyashita C, Araki A, Itoh S, Bamai YA, Goudarzi H, Okada E, Kashino I, Matsuura H, Kishi R. Determinants and Temporal Trends of Perfluoroalkyl Substances in Pregnant Women: The Hokkaido Study on Environment and Children’s Health. International Journal of Environmental Research and Public Health. 2018; 15(5):989. https://doi.org/10.3390/ijerph15050989
Chicago/Turabian StyleTsai, Meng-Shan, Chihiro Miyashita, Atsuko Araki, Sachiko Itoh, Yu Ait Bamai, Houman Goudarzi, Emiko Okada, Ikuko Kashino, Hideyuki Matsuura, and Reiko Kishi. 2018. "Determinants and Temporal Trends of Perfluoroalkyl Substances in Pregnant Women: The Hokkaido Study on Environment and Children’s Health" International Journal of Environmental Research and Public Health 15, no. 5: 989. https://doi.org/10.3390/ijerph15050989