Different Risk Factors for Very Low Birth Weight, Term-Small-for-Gestational-Age, or Preterm Birth in Japan

 , , , ,
Abstract
:1. Introduction
2. Materials and Methods
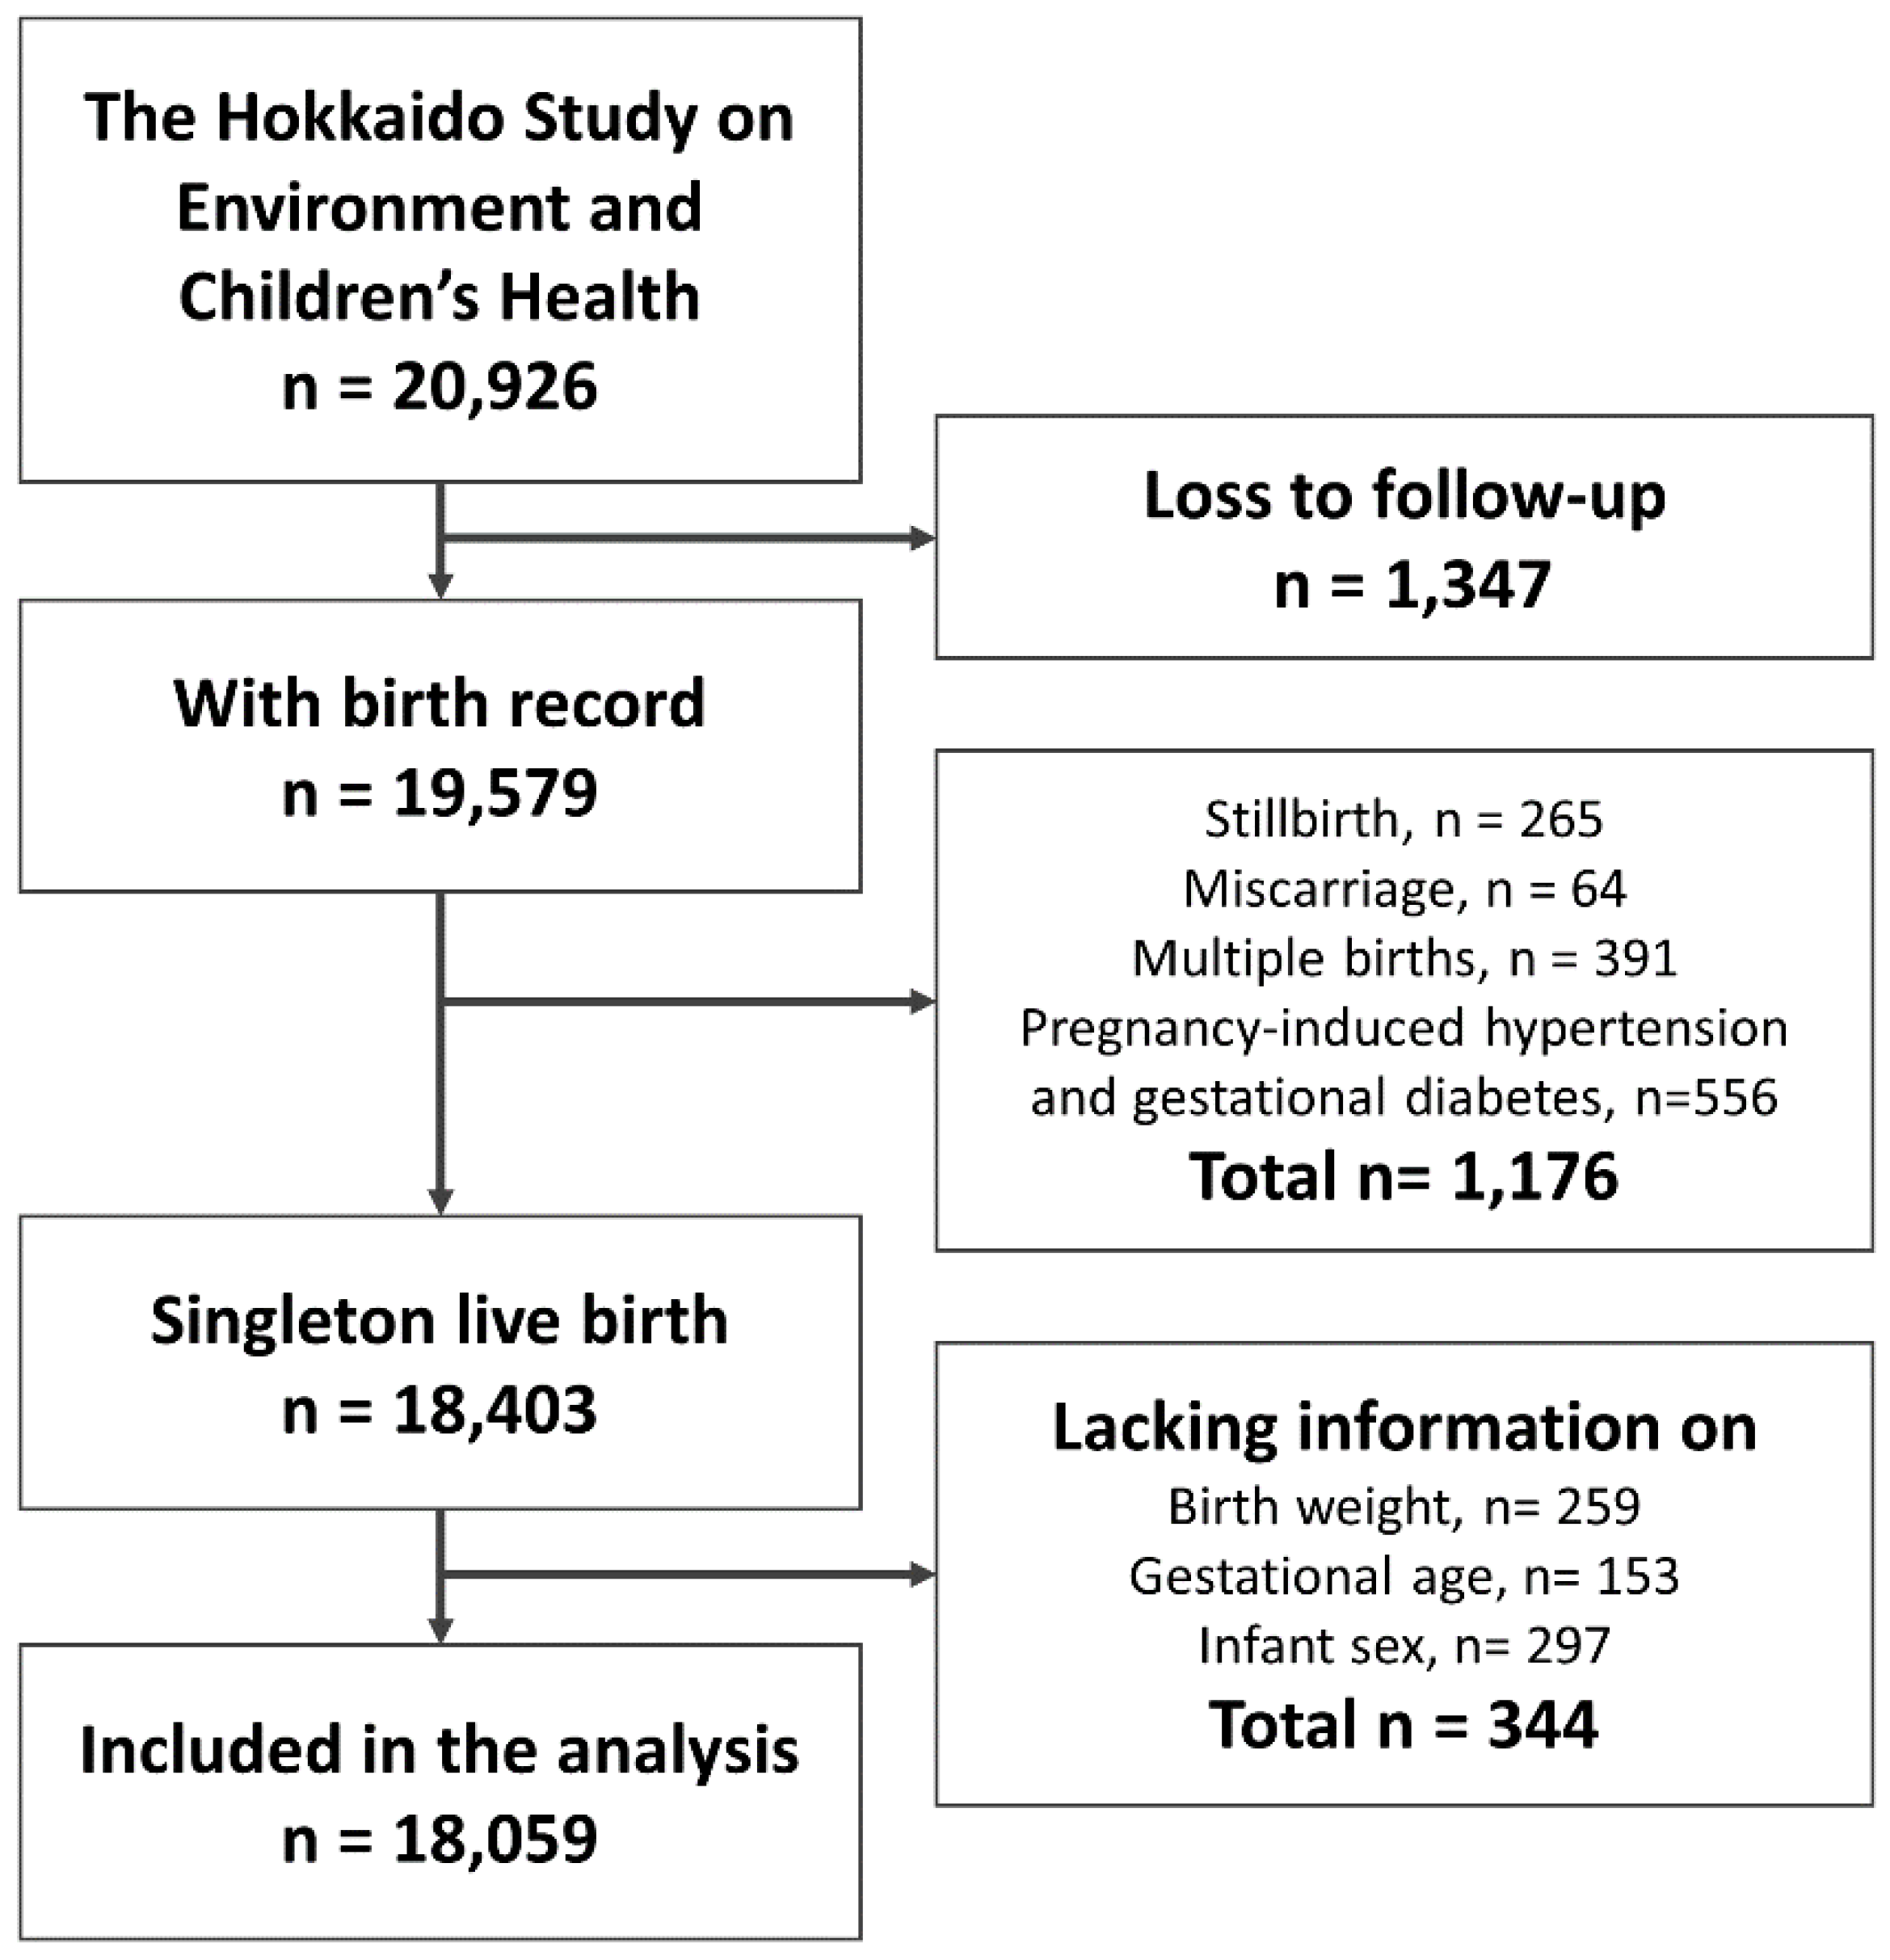
2.1. Participants
2.2. Baseline Questionnaire
2.3. Outcomes of Poor Fetal Growth and Preterm Birt
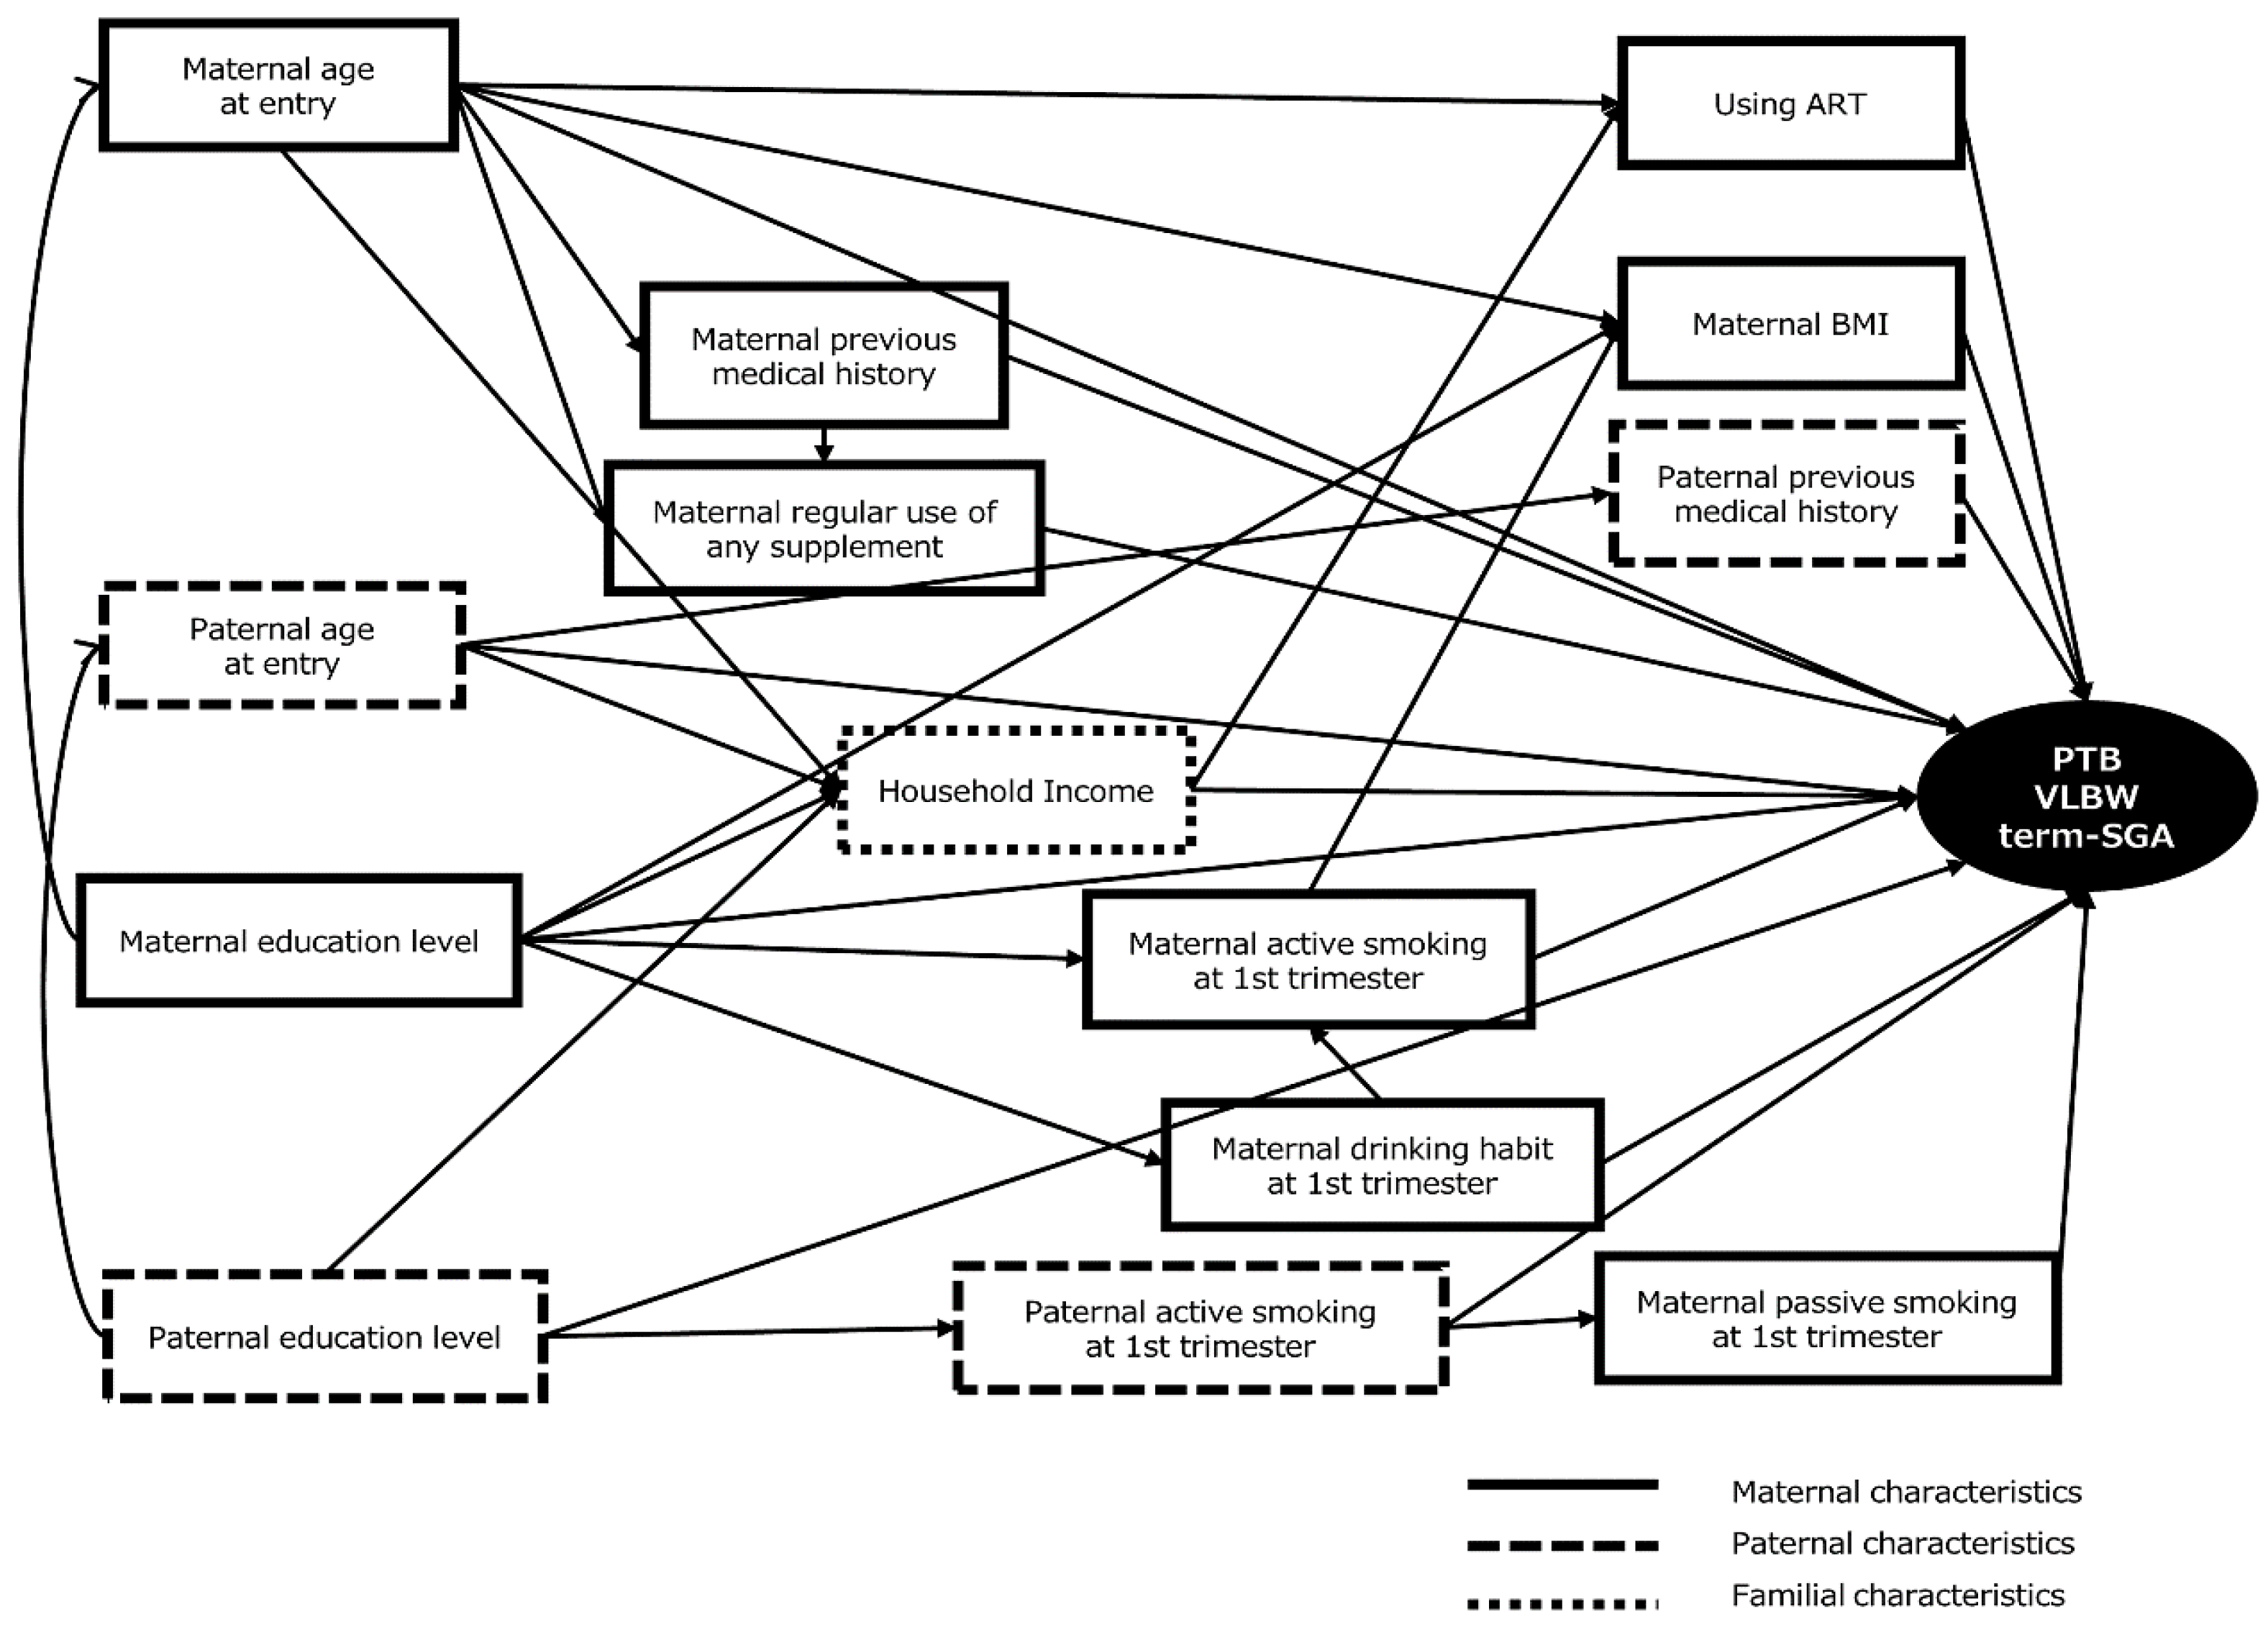
2.4. Data Analysis
2.5. Ethical Approval
3. Results
4. Discussion
5. Conclusions
Supplementary Materials
Acknowledgments
Author Contributions
Conflicts of Interest
References
- Miyake, Y.; Tanaka, K.; Arakawa, M. Active and passive maternal smoking during pregnancy and birth outcomes: The Kyushu Okinawa maternal and child health study. BMC Pregnancy Childbirth 2013, 13, 1471–2393. [Google Scholar] [CrossRef] [PubMed]
- Jaddoe, V.W.; Troe, E.J.; Hofman, A.; Mackenbach, J.P.; Moll, H.A.; Steegers, E.A.; Witteman, J.C. Active and passive maternal smoking during pregnancy and the risks of low birthweight and preterm birth: The generation r study. Paediatr. Perinat. Epidemiol. 2008, 22, 162–171. [Google Scholar] [CrossRef] [PubMed]
- Ohmi, H.; Hirooka, K.; Mochizuki, Y. Fetal growth and the timing of exposure to maternal smoking. Pediatr. Int. 2002, 44, 55–59. [Google Scholar] [CrossRef] [PubMed]
- McCormick, M.C. The contribution of low birth weight to infant mortality and childhood morbidity. N. Engl. J. Med. 1985, 312, 82–90. [Google Scholar] [CrossRef] [PubMed]
- Organisation for Economic Co-operation and Development. OECD Family Database; Directorate of Employment, Labour and Social Affairs: Paris, France, 2016; pp. 1–2. [Google Scholar]
- Mother’s & Children’s Health Organization. Maternal and Child Health Statistics of Japan; Mother’s & Children’s Health Organization: Tokyo, Japan, 2016. [Google Scholar]
- Goldenberg, R.L.; Culhane, J.F.; Iams, J.D.; Romero, R. Epidemiology and causes of preterm birth. Lancet 2008, 371, 75–84. [Google Scholar] [CrossRef]
- McCowan, L.; Horgan, R.P. Risk factors for small for gestational age infants. Best Pract. Res. Clin. Obstet. Gynaecol. 2009, 23, 779–793. [Google Scholar] [CrossRef] [PubMed]
- Jason Gardosi, A.F. Early pregnancy predictors of preterm birth: The role of a prolonged menstruation-conception interval. Int. J. Gynaecol. Obstet. 2000, 107, 228–237. [Google Scholar] [CrossRef]
- Pfinder, M.; Kunst, A.E.; Feldmann, R.; van Eijsden, M.; Vrijkotte, T.G. Preterm birth and small for gestational age in relation to alcohol consumption during pregnancy: Stronger associations among vulnerable women? Results from two large Western-European studies. BMC Pregnancy Childbirth 2013, 13, 49. [Google Scholar] [CrossRef] [PubMed]
- Mortensen, L.H. Socioeconomic inequality in birth weight and gestational age in Denmark 1996–2007: Using a family-based approach to explore alternative explanations. Soc. Sci. Med. 2013, 76, 1–7. [Google Scholar] [CrossRef] [PubMed]
- Blumenshine, P.; Egerter, S.; Barclay, C.J.; Cubbin, C.; Braveman, P.A. Socioeconomic disparities in adverse birth outcomes: A systematic review. Am. J. Prev. Med. 2010, 39, 263–272. [Google Scholar] [CrossRef] [PubMed]
- Ohmi, H.; Hirooka, K.; Hata, A.; Mochizuki, Y. Recent trend of increase in proportion of low birthweight infants in Japan. Int. J. Epidemiol. 2001, 30, 1269–1271. [Google Scholar] [CrossRef] [PubMed]
- Takimoto, H.; Yoshiike, N.; Kaneda, F.; Yoshita, K. Thinness among young Japanese women. Am. J. Pub. Health 2004, 94, 1592–1595. [Google Scholar] [CrossRef]
- Fujiwara, T.; Ito, J.; Kawachi, I. Income inequality, parental socioeconomic status, and birth outcomes in Japan. Am. J. Epidemiol. 2013, 177, 1042–1052. [Google Scholar] [CrossRef] [PubMed]
- Organisation for Economic Co-operation and Development. OECD Factbook 2013: Economic, Environmental and Social Statistics; OECD: Paris, France, 2013. [Google Scholar]
- Shah, P.S. Knowledge Synthesis Group on Determinants of preterm/ low birth weight births. Parity and low birth weight and preterm birth: A systematic review and meta-analyses. Acta. Obstet. Gynecol. Scand. 2010, 89, 862–875. [Google Scholar] [CrossRef] [PubMed]
- Zhu, J.L.; Madsen, K.M.; Vestergaard, M.; Basso, O.; Olsen, J.R. Paternal age and preterm birth. Epidemiology 2005, 16, 259–262. [Google Scholar] [CrossRef] [PubMed]
- Reichman, N.E.; Teitler, J.O. Paternal age as a risk factor for low birthweight. Am. J. Pub. Health 2006, 96, 862–866. [Google Scholar] [CrossRef] [PubMed]
- Parker, J.D.; Schoendorf, K.C. Influence of paternal characteristics on the risk of low birth weight. Am. J. Epidemiol. 1992, 136, 399–407. [Google Scholar] [CrossRef] [PubMed]
- Kishi, R.; Sasaki, S.; Yoshioka, E.; Yuasa, M.; Sata, F.; Saijo, Y.; Kurahashi, N.; Tamaki, J.; Endo, T.; Sengoku, K.; et al. Cohort profile: The Hokkaido study on environment and children’s health in Japan. Int. J. Epidemiol. 2011, 40, 611–618. [Google Scholar] [CrossRef] [PubMed]
- Kishi, R.; Kobayashi, S.; Ikeno, T.; Araki, A.; Miyashita, C.; Itoh, S.; Sasaki, S.; Okada, E.; Kobayashi, S.; Kashino, I.; et al. Ten years of progress in the Hokkaido birth cohort study on environment and children’s health: Cohort profile—updated 2013. Environ. Health Prev. Med. 2013, 18, 429–450. [Google Scholar] [CrossRef] [PubMed]
- Kishi, R.; Araki, A.; Minatoya, M.; Hanaoka, T.; Miyashita, C.; Itoh, S.; Kobayashi, S.; Ait Bamai, Y.; Yamazaki, K.; Miura, R.; et al. The Hokkaido birth cohort study on environment and children’s health: Cohort profile—updated 2017. Environ. Health Prev. Med. 2017, 22, 46. [Google Scholar] [CrossRef] [PubMed]
- Galobardes, B.; Shaw, M.; Lawlor, D.A.; Lynch, J.W.; Davey Smith, G. Indicators of socioeconomic position (part 1). J. Epidemiol. Community Health 2006, 60, 7–12. [Google Scholar] [CrossRef] [PubMed]
- Galobardes, B.; Shaw, M.; Lawlor, D.A.; Lynch, J.W.; Davey Smith, G. Indicators of socioeconomic position (part 2). J. Epidemiol. Community Health 2006, 60, 95–101. [Google Scholar] [CrossRef] [PubMed]
- Wilcox, A.J. On the importance—and the unimportance—of birthweight. Int. Epidemiol. Ass. 2001, 30, 1233–1241. [Google Scholar] [CrossRef]
- Itabashi, K.; Miura, F.; Uehara, R.; Nakamura, Y. New Japanese neonatal anthropometric charts for gestational age at birth. Pediatr. Int. 2014, 56, 702–708. [Google Scholar] [CrossRef] [PubMed]
- Pearl, J.; Glymour, M.; Jewel, N.P. Causal Inference in Statistics: A Primer; John Wiley & Sons: Sussex, U.K., 2016. [Google Scholar]
- Shrier, I.; Platt, R.W. Reducing bias through directed acyclic graphs. BMC Med. Res. Methodol. 2008, 8, 70. [Google Scholar] [CrossRef] [PubMed]
- Adams-Chapman, M.; Shankaran, S.; Boghossian, N.S.; Laptook, A.R.; Waldemar, A.; Carlo, I.; Van Meurs, K.; Newman, N.S.; Higgins, R.D.; Hansen, N.I.; Murray, J.C.; et al. Ten-year review of major birth defects in VLBW infants. Pediatrics 2013, 132, 13. [Google Scholar] [CrossRef] [PubMed]
- Lutsiv, O.; Mah, J.; Beyene, J.; McDonald, S.D. The effects of morbid obesity on maternal and neonatal health outcomes: A systematic review and meta-analyses. Obes. Rev. 2015, 16, 531–546. [Google Scholar] [CrossRef] [PubMed]
- Marchi, J.; Berg, M.; Dencker, A.; Olander, E.K.; Begley, C. Risks associated with obesity in pregnancy, for the mother and baby: A systematic review of reviews. Obes. Rev. 2015, 16, 621–638. [Google Scholar] [CrossRef] [PubMed]
- Deurenberg-Yap, M.S.G.; van Staveren, W.A.; Deurenberg, P. The paradox of low body mass index and high body fat percentage among Chinese, Malays and Indians in Singapore. Int. J. Obes. 2000, 24, 1011–1017. [Google Scholar] [CrossRef]
- Mandil, A.; Chaaya, M.; Saab, D. Health status, epidemiological profile and prospects: Eastern Mediterranean region. Int. J. Epidemiol. 2013, 42, 616–626. [Google Scholar] [CrossRef] [PubMed]
- Han, Z.; Mulla, S.; Beyene, J.; Liao, G.; McDonald, S.D.; Knowledge Synthesis, G. Maternal underweight and the risk of preterm birth and low birth weight: A systematic review and meta-analyses. Int. J. Epidemiol. 2011, 40, 65–101. [Google Scholar] [CrossRef] [PubMed]
- Ministry of Health, Labour and Welfare. The Result of National Health and Nutrition Survey 2007–2011; Ministry of Health, Labour and Welfare: Tokyo, Japan, 2011.
- Rodriguez-Thompson, D. Cigarette Smoking: Impact on Pregnancy and the Neonate. Available online: http://www.uptodate.com/contents/cigarette-smoking-impact-on-pregnancy-and-the-neonate (accessed on 31 May 2017).
- Kobayashi, S.; Sata, F.; Sasaki, S.; Braimoh, T.S.; Araki, A.; Miyashita, C.; Goudarzi, H.; Kobayashi, S.; Kishi, R. Modification of adverse health effects of maternal active and passive smoking by genetic susceptibility: Dose-dependent association of plasma cotinine with infant birth size among Japanese women—the hokkaido study. Repr. Toxic. 2017, in press. [Google Scholar] [CrossRef] [PubMed]
- Tairaku, S.; Yamasaki, M.; Makihara, N.; Tanimura, K.; Hazama, R.; Morita, H.; Yamada, H. A study of maternal progress during pregnancy complicated by chronic hypertension resulting in poor perinatal outcome. Adv. Obstet. Gynecol. 2012, 64, 17–22. [Google Scholar]
- Bertozzi, S.; Londero, A.P.; Salvador, S.; Grassi, T.; Fruscalzo, A.; Driul, L.; Marchesoni, D. Influence of the couple on hypertensive disorders during pregnancy: A retrospective cohort study. Pregnancy Hypertens. 2011, 1, 156–163. [Google Scholar] [CrossRef] [PubMed]
- Bao, W.; Michels, K.B.; Tobias, D.K.; Li, S.; Chavarro, J.E.; Gaskins, A.J.; Vaag, A.A.; Hu, F.B.; Zhang, C. Parental smoking during pregnancy and the risk of gestational diabetes in the daughter. Int. J. Epidemiol. 2016, 45, 160–169. [Google Scholar] [CrossRef] [PubMed]
- Michikawa, T.; Nitta, H.; Nakayama, S.F.; Ono, M.; Yonemoto, J.; Tamura, K.; Suda, E.; Ito, H.; Takeuchi, A.; Kawamoto, T.; et al. The Japan environment and children’s study (JECS): A preliminary report on selected characteristics of approximately 10,000 pregnant women recruited during the first year of the study. J. Epidemiol. 2015, 25, 452–458. [Google Scholar] [CrossRef] [PubMed]
- Hanaoka, T.; Tamura, N.; Ito, K.; Sasaki, S.; Araki, A.; Ikeno, T.; Miyashita, C.; Ito, S.; Minakami, H.; Cho, K.; et al. Prevalence and risk of birth defects observed in a prospective cohort study: The Hokkaido study on environment and children’s health. J. Epidemiol. 2018, in press. [Google Scholar] [CrossRef] [PubMed]


| N (%) | N (%) | ||||
|---|---|---|---|---|---|
| Maternal Characteristics | Paternal Characteristics | ||||
| Age at entry (years old) | Age at entry (years old) | ||||
| ≤24 | 2634 | (14.6) | ≤24 | 1313 | (7.3) |
| 25–34 | 12,284 | (68.0) | 25–34 | 10,393 | (57.6) |
| ≥35 | 3132 | (17.3) | ≥35 | 5340 | (29.6) |
| Missing | 9 | (0.0) | Missing | 1013 | (5.6) |
| Prepregnancy BMI 1 (kg/m2) | Smoking habit during 1st trimester | ||||
| <18.5 | 2996 | (16.6) | No | 5021 | (27.8) |
| 18.5–24.9 | 12,309 | (68.2) | Yes | 10,071 | (55.8) |
| 25.0–29.9 | 1342 | (7.4) | Missing | 2967 | (16.4) |
| ≥30.0 | 362 | (2.0) | Previous medical history | ||
| Missing | 1050 | (5.8) | No | 11,348 | (62.8) |
| Active smoking during 1st trimester | Yes | 6705 | (37.1) | ||
| No | 14,425 | (79.9) | Missing | 6 | (0.0) |
| Yes | 1975 | (10.9) | Paternal educational level (years) | ||
| Missing | 1659 | (9.2) | ≤9 | 1329 | (7.4) |
| Passive smoking during 1st trimester | 10–12 | 7149 | (39.6) | ||
| No | 4857 | (26.9) | 13–15 | 4011 | (22.2) |
| Yes | 11,327 | (62.7) | ≥16 | 4518 | (25.0) |
| Missing | 1875 | (10.4) | Missing | 1052 | (5.8) |
| Drinking habit during 1st trimester | Familial characteristics | ||||
| Never | 6688 | (37.0) | Household income (million yen) | ||
| Ex-drinker | 8446 | (46.8) | <3.0 | 3391 | (18.8) |
| Current drinker | 2009 | (11.1) | 3.0–4.9 | 6605 | (36.6) |
| Missing | 916 | (5.1) | 5.0–7.9 | 3736 | (20.7) |
| Previous medical history | ≥8 | 1086 | (6.0) | ||
| No | 9780 | (54.2) | Missing | 3241 | (17.9) |
| Yes | 8260 | (45.7) | |||
| Missing | 19 | (0.1) | |||
| Regular use of any supplement | |||||
| No | 12,549 | (69.5) | |||
| Yes | 5492 | (30.4) | |||
| Missing | 18 | (0.1) | |||
| Using ART 2 | |||||
| No | 16,565 | (91.7) | |||
| Yes | 712 | (3.9) | |||
| Missing | 782 | (4.3) | |||
| Maternal educational level (years) | |||||
| ≤9 | 934 | (5.2) | |||
| 10–12 | 7512 | (41.6) | |||
| 13–15 | 6968 | (38.6) | |||
| ≥16 | 1852 | (10.3) | |||
| Missing | 793 | (4.4) | |||
| VLBW | Non VLBW | Crude 2 | Adjustment Model 2,3 | Based on DAG Model 2,4 | ||||||||||||||
|---|---|---|---|---|---|---|---|---|---|---|---|---|---|---|---|---|---|---|
| 95%CI | 95%CI | 95%CI | ||||||||||||||||
| N | % | N | % | p-Value 1 | RRs | Lower | Upper | p-Value | RRs | Lower | Upper | p-Value | RRs | Lower | Upper | p-Value | ||
| Maternal characteristics | ||||||||||||||||||
| Age at entry (years old) | ||||||||||||||||||
| <24 | 9 | 0.3 | 2625 | 99.7 | 0.03 | 1.00 | 0.49 | 2.05 | 1.00 | 1.05 | 0.50 | 2.22 | 0.90 | 1.05 | 0.50 | 2.22 | 0.90 | |
| 25–34 | 42 | 0.3 | 12,242 | 99.7 | Reference | Reference | Reference | |||||||||||
| ≥35 | 21 | 0.7 | 3111 | 99.3 | 1.96 | 1.16 | 3.31 | 0.02 | 1.90 | 1.10 | 3.30 | 0.03 | 1.90 | 1.10 | 3.29 | 0.03 | ||
| Prepregnancy BMI (kg/m2) | ||||||||||||||||||
| <18.5 | 11 | 0.4 | 2980 | 99.6 | 0.14 | 1.01 | 0.52 | 1.94 | 0.99 | 1.05 | 0.54 | 2.03 | 0.89 | 1.13 | 0.58 | 2.21 | 0.72 | |
| 18.5–24.9 | 45 | 0.4 | 12,255 | 99.6 | Reference | Reference | Reference | |||||||||||
| 25.0–29.9 | 7 | 0.5 | 1334 | 99.5 | 1.43 | 0.64 | 3.16 | 0.40 | 1.39 | 0.62 | 3.08 | 0.44 | 1.51 | 0.68 | 3.36 | 0.34 | ||
| ≥30.0 | 4 | 1.1 | 358 | 98.9 | 3.02 | 1.09 | 8.35 | 0.07 | 2.85 | 1.02 | 7.93 | 0.08 | 2.46 | 0.76 | 7.92 | 0.18 | ||
| Active smoking during 1st trimester | ||||||||||||||||||
| No | 55 | 0.4 | 14,370 | 99.6 | 0.41 | Reference | Reference | Reference | ||||||||||
| Yes | 10 | 0.5 | 1965 | 99.5 | 1.33 | 0.68 | 2.60 | 0.42 | 1.41 | 0.71 | 2.76 | 0.34 | 1.41 | 0.72 | 2.77 | 0.34 | ||
| Passive smoking during 1st trimester | ||||||||||||||||||
| No | 14 | 0.3 | 4843 | 99.7 | 0.18 | Reference | Reference | Reference | ||||||||||
| Yes | 49 | 0.4 | 11,278 | 99.6 | 1.50 | 0.83 | 2.72 | 0.16 | 1.84 | 0.97 | 3.47 | 0.05 | 1.40 | 0.44 | 4.43 | 0.57 | ||
| Drinking habit during 1st trimester | ||||||||||||||||||
| Never | 19 | 0.3 | 6669 | 99.7 | 0.17 | Reference | Reference | Reference | ||||||||||
| Ex-drinker | 39 | 0.5 | 8407 | 99.5 | 1.63 | 0.94 | 2.81 | 0.07 | 1.60 | 0.92 | 2.78 | 0.09 | 1.58 | 0.91 | 2.73 | 0.10 | ||
| Current drinker | 10 | 0.5 | 1999 | 99.5 | 1.75 | 0.82 | 3.76 | 0.16 | 1.70 | 0.79 | 3.67 | 0.19 | 1.73 | 0.81 | 3.72 | 0.17 | ||
| Previous medical history | ||||||||||||||||||
| No | 38 | 0.4 | 9742 | 99.6 | 0.81 | Reference | Reference | Reference | ||||||||||
| Yes | 34 | 0.4 | 8226 | 99.6 | 1.06 | 0.67 | 1.68 | 0.81 | 0.81 | 0.35 | 1.88 | 0.61 | 1.04 | 0.64 | 1.69 | 0.87 | ||
| Regular use of any supplement | ||||||||||||||||||
| No | 50 | 0.4 | 12,499 | 99.6 | 0.98 | Reference | Reference | Reference | ||||||||||
| Yes | 22 | 0.4 | 5470 | 99.6 | 1.01 | 0.61 | 1.66 | 0.98 | 0.95 | 0.56 | 1.61 | 0.84 | 1.16 | 1.03 | 1.30 | 0.02 | ||
| Using ART | ||||||||||||||||||
| No | 61 | 0.4 | 16,504 | 99.6 | 0.01 | Reference | Reference | Reference | ||||||||||
| Yes | 7 | 1.0 | 705 | 99.0 | 2.67 | 1.23 | 5.82 | 0.03 | 2.36 | 1.06 | 5.25 | 0.06 | 2.17 | 0.92 | 5.13 | 0.11 | ||
| Maternal educational level (years) | ||||||||||||||||||
| ≤ 9 | 4 | 0.4 | 930 | 99.6 | 0.62 | 1.07 | 0.38 | 3.04 | 0.90 | 1.12 | 0.39 | 3.22 | 0.84 | 1.07 | 0.38 | 3.04 | 0.90 | |
| 10–12 | 30 | 0.4 | 7482 | 99.6 | Reference | Reference | Reference | |||||||||||
| 13–15 | 23 | 0.3 | 6945 | 99.7 | 0.83 | 0.48 | 1.42 | 0.49 | 0.81 | 0.47 | 1.40 | 0.44 | 0.83 | 0.48 | 1.42 | 0.49 | ||
| ≥16 | 10 | 0.5 | 1842 | 99.5 | 1.35 | 0.66 | 2.76 | 0.42 | 1.29 | 0.62 | 2.65 | 0.50 | 1.35 | 0.66 | 2.76 | 0.42 | ||
| Paternal characteristics | ||||||||||||||||||
| Age at entry (years old) | ||||||||||||||||||
| <24 | 5 | 0.4 | 1308 | 99.6 | 0.02 | 1.18 | 0.38 | 3.64 | 0.77 | 1.28 | 0.49 | 3.33 | 0.63 | 1.18 | 0.38 | 3.64 | 0.77 | |
| 25–34 | 30 | 0.3 | 10,363 | 99.7 | Reference | Reference | Reference | |||||||||||
| ≥35 | 31 | 0.6 | 5309 | 99.4 | 2.01 | 1.22 | 3.32 | <0.01 | 1.73 | 0.97 | 3.09 | 0.07 | 2.02 | 1.22 | 3.35 | <0.01 | ||
| Smoking habit during 1st trimester | ||||||||||||||||||
| No | 16 | 0.3 | 5005 | 99.7 | 0.21 | Reference | Reference | Reference | ||||||||||
| Yes | 46 | 0.5 | 10,025 | 99.5 | 1.43 | 0.81 | 2.53 | 0.20 | 1.60 | 0.89 | 2.88 | 0.11 | 1.45 | 0.80 | 2.62 | 0.20 | ||
| Previous medical history | ||||||||||||||||||
| No | 46 | 0.4 | 11,302 | 99.6 | 0.86 | Reference | Reference | Reference | ||||||||||
| Yes | 26 | 0.4 | 6679 | 99.6 | 0.96 | 0.59 | 1.55 | 0.86 | 0.90 | 0.54 | 1.49 | 0.67 | 0.98 | 0.59 | 1.63 | 0.93 | ||
| Paternal educational level (years) | ||||||||||||||||||
| ≤9 | 6 | 0.5 | 1323 | 99.5 | 0.98 | 1.15 | 0.48 | 2.78 | 0.76 | 1.18 | 0.48 | 2.89 | 0.73 | 1.15 | 0.48 | 2.78 | 0.76 | |
| 10–12 | 28 | 0.4 | 7121 | 99.6 | Reference | Reference | Reference | |||||||||||
| 13–15 | 15 | 0.4 | 3996 | 99.6 | 0.95 | 0.51 | 1.79 | 0.88 | 0.98 | 0.52 | 1.86 | 0.96 | 0.95 | 0.51 | 1.79 | 0.88 | ||
| ≥16 | 18 | 0.4 | 4500 | 99.6 | 1.02 | 0.56 | 1.84 | 0.95 | 0.88 | 0.46 | 1.70 | 0.70 | 1.02 | 0.56 | 1.84 | 0.95 | ||
| Familial characteristics | ||||||||||||||||||
| Household income (million yen) | ||||||||||||||||||
| <3.0 | 8 | 0.2 | 3383 | 99.8 | 0.32 | 0.58 | 0.26 | 1.27 | 0.15 | 0.58 | 0.26 | 1.29 | 0.16 | 0.57 | 0.25 | 1.29 | 0.16 | |
| 3.0–4.9 | 27 | 0.4 | 6579 | 99.6 | Reference | Reference | Reference | |||||||||||
| 5.0–7.9 | 19 | 0.5 | 3717 | 99.5 | 1.24 | 0.69 | 2.23 | 0.47 | 1.18 | 0.64 | 2.15 | 0.60 | 1.14 | 0.62 | 2.10 | 0.68 | ||
| ≥8 | 4 | 0.4 | 1082 | 99.6 | 0.90 | 0.32 | 2.57 | 0.84 | 0.81 | 0.28 | 2.38 | 0.69 | 0.76 | 0.26 | 2.28 | 0.62 | ||
| Term-SGA | Non Term-SGA | Crude 2 | Adjustment Model 2,3 | Based on DAG Model 2,4 | ||||||||||||||
|---|---|---|---|---|---|---|---|---|---|---|---|---|---|---|---|---|---|---|
| 95%CI | 95%CI | 95%CI | ||||||||||||||||
| N | % | N | % | p-Value 1 | RRs | Lower | Upper | p-Value | RRs | Lower | Upper | p-Value | RRs | Lower | Upper | p-Value | ||
| Maternal characteristics | ||||||||||||||||||
| Age at entry (years old) | ||||||||||||||||||
| <24 | 158 | 6.2 | 2375 | 93.8 | 0.34 | 0.89 | 0.75 | 1.05 | 0.15 | 0.85 | 0.72 | 1.02 | 0.07 | 0.85 | 0.72 | 1.02 | 0.07 | |
| 25–34 | 825 | 7.0 | 10,919 | 93.0 | Reference | Reference | Reference | |||||||||||
| ≥35 | 208 | 7.1 | 2726 | 92.9 | 1.01 | 0.87 | 1.17 | 0.90 | 0.99 | 0.85 | 1.15 | 0.86 | 0.99 | 0.85 | 1.15 | 0.86 | ||
| Prepregnancy BMI (kg/m2) | ||||||||||||||||||
| <18.5 | 305 | 10.8 | 2522 | 89.2 | <0.01 | 1.75 | 1.54 | 1.99 | <0.01 | 1.79 | 1.58 | 2.04 | <0.01 | 1.77 | 1.55 | 2.03 | <0.01 | |
| 18.5–24.9 | 726 | 6.2 | 11,056 | 93.8 | Reference | Reference | Reference | |||||||||||
| 25.0–29.9 | 55 | 4.3 | 1220 | 95.7 | 0.70 | 0.54 | 0.92 | <0.01 | 0.69 | 0.53 | 0.90 | <0.01 | 0.70 | 0.53 | 0.93 | <0.01 | ||
| ≥30.0 | 16 | 4.6 | 329 | 95.4 | 0.75 | 0.46 | 1.22 | 0.23 | 0.75 | 0.46 | 1.22 | 0.22 | 0.76 | 0.46 | 1.25 | 0.26 | ||
| Active smoking during 1st trimester | ||||||||||||||||||
| No | 958 | 7.0 | 12,801 | 93.0 | 0.95 | Reference | Reference | Reference | ||||||||||
| Yes | 130 | 6.9 | 1748 | 93.1 | 0.99 | 0.83 | 1.19 | 0.95 | 0.98 | 0.81 | 1.17 | 0.79 | 0.96 | 0.80 | 1.16 | 0.70 | ||
| Passive smoking during 1st trimester | ||||||||||||||||||
| No | 289 | 6.2 | 4358 | 93.8 | 0.03 | Reference | Reference | Reference | ||||||||||
| Yes | 775 | 7.2 | 10,026 | 92.8 | 1.15 | 1.01 | 1.31 | 0.03 | 1.12 | 0.98 | 1.29 | 0.09 | 1.18 | 0.92 | 1.52 | 0.20 | ||
| Drinking habit during 1st trimester | ||||||||||||||||||
| Never | 392 | 6.2 | 5970 | 93.8 | <0.01 | Reference | Reference | Reference | ||||||||||
| Ex-drinker | 536 | 6.6 | 7538 | 93.4 | 1.08 | 0.95 | 1.22 | 0.25 | 1.09 | 0.96 | 1.24 | 0.16 | 1.09 | 0.96 | 1.23 | 0.20 | ||
| Current drinker | 186 | 9.7 | 1734 | 90.3 | 1.57 | 1.33 | 1.86 | <0.01 | 1.56 | 1.32 | 1.85 | <0.01 | 1.57 | 1.33 | 1.85 | <0.01 | ||
| Previous medical history | ||||||||||||||||||
| No | 642 | 6.9 | 8721 | 93.1 | 0.71 | Reference | Reference | Reference | ||||||||||
| Yes | 549 | 7.0 | 7290 | 93.0 | 1.02 | 0.92 | 1.14 | 0.71 | 1.00 | 0.89 | 1.12 | 0.94 | 0.99 | 0.88 | 1.11 | 0.87 | ||
| Regular use of any supplement | ||||||||||||||||||
| No | 201 | 1.8 | 11,164 | 98.2 | 0.07 | Reference | Reference | Reference | ||||||||||
| Yes | 390 | 7.4 | 4848 | 92.6 | 1.11 | 0.99 | 1.25 | 0.08 | 1.12 | 0.99 | 1.26 | 0.08 | 1.16 | 1.03 | 1.30 | 0.02 | ||
| Using ART | ||||||||||||||||||
| No | 1081 | 6.8 | 14,751 | 93.2 | 0.42 | Reference | Reference | Reference | ||||||||||
| Yes | 50 | 7.6 | 604 | 92.4 | 1.12 | 0.85 | 1.47 | 0.43 | 1.10 | 0.83 | 1.44 | 0.52 | 1.07 | 0.79 | 1.44 | 0.68 | ||
| Maternal educational level (years) | ||||||||||||||||||
| ≤9 | 74 | 8.3 | 813 | 91.7 | <0.01 | 1.23 | 0.98 | 1.56 | 0.09 | 1.27 | 1.00 | 1.61 | 0.06 | 1.23 | 0.98 | 1.56 | 0.09 | |
| 10–12 | 486 | 6.8 | 6704 | 93.2 | Reference | Reference | Reference | |||||||||||
| 13–15 | 475 | 7.2 | 6154 | 92.8 | 1.06 | 0.94 | 1.20 | 0.35 | 1.04 | 0.92 | 1.18 | 0.53 | 1.06 | 0.94 | 1.20 | 0.35 | ||
| ≥16 | 91 | 5.1 | 1681 | 94.9 | 0.76 | 0.61 | 0.94 | 0.01 | 0.73 | 0.59 | 0.91 | <0.01 | 0.76 | 0.61 | 0.94 | 0.01 | ||
| Paternal characteristics | ||||||||||||||||||
| Age at entry (years old) | ||||||||||||||||||
| <24 | 90 | 7.1 | 1173 | 92.9 | 0.82 | 1.05 | 0.85 | 1.30 | 0.64 | 1.19 | 0.92 | 1.54 | 0.18 | 1.03 | 0.83 | 1.28 | 0.77 | |
| 25-34 | 673 | 6.8 | 9265 | 93.2 | Reference | Reference | Reference | |||||||||||
| ≥35 | 354 | 7.0 | 4708 | 93.0 | 1.03 | 0.91 | 1.17 | 0.61 | 1.01 | 0.87 | 1.16 | 0.93 | 1.04 | 0.92 | 1.18 | 0.54 | ||
| Smoking habit during 1st trimester | ||||||||||||||||||
| No | 309 | 6.4 | 4500 | 93.6 | 0.09 | Reference | Reference | Reference | ||||||||||
| Yes | 688 | 7.2 | 8901 | 92.8 | 1.12 | 0.98 | 1.27 | 0.09 | 1.09 | 0.96 | 1.25 | 0.19 | 1.07 | 0.94 | 1.23 | 0.32 | ||
| Previous medical history | ||||||||||||||||||
| No | 736 | 6.8 | 10,113 | 93.2 | 0.34 | Reference | Reference | Reference | ||||||||||
| Yes | 456 | 7.2 | 5909 | 92.8 | 1.06 | 0.94 | 1.18 | 0.34 | 1.02 | 0.91 | 1.15 | 0.71 | 1.03 | 0.91 | 1.16 | 0.65 | ||
| Paternal educational level (years) | ||||||||||||||||||
| ≤ 9 | 93 | 7.3 | 1181 | 92.7 | 0.08 | 1.05 | 0.85 | 1.30 | 0.68 | 1.01 | 0.81 | 1.26 | 0.91 | 1.05 | 0.85 | 1.30 | 0.68 | |
| 10–12 | 477 | 7.0 | 6364 | 93.0 | Reference | Reference | Reference | |||||||||||
| 13–15 | 279 | 7.3 | 3517 | 92.7 | 1.05 | 0.91 | 1.22 | 0.47 | 1.03 | 0.89 | 1.19 | 0.70 | 1.05 | 0.91 | 1.22 | 0.47 | ||
| ≥16 | 260 | 6.0 | 4056 | 94.0 | 0.86 | 0.75 | 1.00 | 0.05 | 0.89 | 0.76 | 1.04 | 0.15 | 0.86 | 0.75 | 1.00 | 0.05 | ||
| Familial characteristics | ||||||||||||||||||
| Household income (million yen) | ||||||||||||||||||
| <3.0 | 238 | 7.3 | 3026 | 92.7 | 0.70 | 1.10 | 0.94 | 1.28 | 0.24 | 1.11 | 0.95 | 1.30 | 0.18 | 1.09 | 0.92 | 1.28 | 0.31 | |
| 3.0–4.9 | 419 | 6.7 | 5879 | 93.3 | Reference | Reference | Reference | |||||||||||
| 5.0–7.9 | 249 | 7.0 | 3304 | 93.0 | 1.05 | 0.91 | 1.23 | 0.50 | 1.08 | 0.92 | 1.25 | 0.36 | 1.10 | 0.94 | 1.28 | 0.26 | ||
| ≥8 | 71 | 6.9 | 959 | 93.1 | 1.04 | 0.81 | 1.32 | 0.78 | 1.11 | 0.87 | 1.43 | 0.40 | 1.14 | 0.88 | 1.47 | 0.32 | ||
| PTB | Non PTB | Crude 2 | Adjustment Model 2,3 | Based on DAG Model 2,4 | ||||||||||||||
|---|---|---|---|---|---|---|---|---|---|---|---|---|---|---|---|---|---|---|
| 95%CI | 95%CI | 95%CI | ||||||||||||||||
| N | % | N | % | p-Value 1 | RRs | Lower | Upper | p-Value | RRs | Lower | Upper | p-Value | RRs | Lower | Upper | p-Value | ||
| Maternal characteristics | ||||||||||||||||||
| Age at entry (years old) | ||||||||||||||||||
| <24 | 95 | 3.6 | 2539 | 96.4 | <0.01 | 0.86 | 0.69 | 1.06 | 0.15 | 0.86 | 0.69 | 1.09 | 0.20 | 0.86 | 0.69 | 1.09 | 0.20 | |
| 25–34 | 518 | 4.2 | 11,766 | 95.8 | Reference | Reference | Reference | |||||||||||
| ≥35 | 192 | 6.1 | 2940 | 93.9 | 1.45 | 1.24 | 1.71 | <0.01 | 1.45 | 1.23 | 1.71 | <0.01 | 1.45 | 1.23 | 1.71 | <0.01 | ||
| Prepregnancy BMI (kg/m2) | ||||||||||||||||||
| <18.5 | 1164 | 29.2 | 2827 | 70.8 | 0.01 | 1.34 | 1.12 | 1.59 | <0.01 | 1.39 | 1.17 | 1.65 | <0.01 | 1.45 | 1.21 | 1.73 | <0.01 | |
| 18.5–24.9 | 505 | 4.1 | 11,795 | 95.9 | Reference | Reference | Reference | |||||||||||
| 25.0–29.9 | 64 | 4.8 | 1277 | 95.2 | 1.16 | 0.90 | 1.50 | 0.26 | 1.13 | 0.87 | 1.46 | 0.36 | 1.15 | 0.88 | 1.50 | 0.30 | ||
| ≥30.0 | 17 | 4.7 | 345 | 95.3 | 1.14 | 0.71 | 1.83 | 0.59 | 1.12 | 0.70 | 1.80 | 0.64 | 0.97 | 0.57 | 1.67 | 0.92 | ||
| Active smoking during 1st trimester | ||||||||||||||||||
| No | 642 | 4.5 | 13,783 | 95.5 | 0.75 | Reference | Reference | Reference | ||||||||||
| Yes | 91 | 4.6 | 1884 | 95.4 | 1.04 | 0.84 | 1.28 | 0.75 | 1.04 | 0.83 | 1.30 | 0.73 | 1.03 | 0.83 | 1.29 | 0.76 | ||
| Passive smoking during 1st trimester | ||||||||||||||||||
| No | 203 | 4.2 | 4654 | 95.8 | 0.44 | Reference | Reference | Reference | ||||||||||
| Yes | 504 | 4.4 | 10,823 | 95.6 | 1.06 | 0.91 | 1.25 | 0.44 | 1.12 | 0.95 | 1.32 | 0.18 | 0.82 | 0.58 | 1.15 | 0.23 | ||
| Drinking habit during 1st trimester | ||||||||||||||||||
| Never | 317 | 4.7 | 6371 | 95.3 | 0.27 | Reference | Reference | Reference | ||||||||||
| Ex-drinker | 358 | 4.2 | 8088 | 95.8 | 0.89 | 0.77 | 1.04 | 0.14 | 0.90 | 0.78 | 1.04 | 0.16 | 0.89 | 0.77 | 1.03 | 0.13 | ||
| Current drinker | 83 | 4.1 | 1926 | 95.9 | 0.87 | 0.69 | 1.1 | 0.25 | 0.85 | 0.67 | 1.08 | 0.17 | 0.87 | 0.69 | 1.10 | 0.24 | ||
| Previous medical history | ||||||||||||||||||
| No | 398 | 4.1 | 9382 | 95.9 | <0.01 | Reference | Reference | Reference | ||||||||||
| Yes | 406 | 4.9 | 7854 | 95.1 | 1.21 | 1.06 | 1.38 | 0.01 | 1.17 | 1.02 | 1.35 | 0.03 | 1.17 | 1.02 | 1.35 | 0.02 | ||
| Regular use of any supplement | ||||||||||||||||||
| No | 558 | 4.4 | 11,991 | 95.6 | 0.92 | Reference | Reference | Reference | ||||||||||
| Yes | 246 | 4.5 | 5246 | 95.5 | 1.01 | 0.87 | 1.17 | 0.92 | 1.00 | 0.86 | 1.17 | 0.99 | 0.98 | 0.85 | 1.14 | 0.84 | ||
| Using ART | ||||||||||||||||||
| No | 703 | 4.2 | 15,862 | 95.8 | <0.01 | Reference | Reference | Reference | ||||||||||
| Yes | 58 | 8.1 | 654 | 91.9 | 1.92 | 1.48 | 2.48 | <0.01 | 1.76 | 1.36 | 2.29 | <0.01 | 1.56 | 1.16 | 2.09 | <0.01 | ||
| Maternal educational level (years) | ||||||||||||||||||
| ≤9 | 43 | 4.6 | 891 | 95.4 | 0.03 | 1.13 | 0.82 | 1.54 | 0.46 | 1.20 | 0.88 | 1.65 | 0.26 | 1.13 | 0.82 | 1.54 | 0.46 | |
| 10–12 | 307 | 4.1 | 7205 | 95.9 | Reference | Reference | Reference | |||||||||||
| 13–15 | 329 | 4.7 | 6639 | 95.3 | 1.16 | 0.99 | 1.35 | 0.06 | 1.12 | 0.96 | 1.31 | 0.14 | 1.16 | 0.99 | 1.35 | 0.06 | ||
| ≥16 | 79 | 4.3 | 1773 | 95.7 | 1.04 | 0.82 | 1.33 | 0.73 | 1.00 | 0.78 | 1.27 | 0.98 | 1.04 | 0.82 | 1.33 | 0.73 | ||
| Paternal characteristics | ||||||||||||||||||
| Age at entry (years old) | ||||||||||||||||||
| <24 | 48 | 3.7 | 1265 | 96.3 | 0.01 | 0.88 | 0.65 | 1.18 | 0.37 | 0.99 | 0.70 | 1.39 | 0.95 | 0.92 | 0.69 | 1.24 | 0.59 | |
| 25-34 | 433 | 4.2 | 9960 | 95.8 | Reference | Reference | Reference | |||||||||||
| ≥35 | 269 | 5.0 | 5071 | 95.0 | 1.21 | 1.04 | 1.40 | 0.01 | 1.05 | 0.88 | 1.25 | 0.58 | 1.22 | 1.05 | 1.42 | 0.01 | ||
| Smoking habit during 1st trimester | ||||||||||||||||||
| No | 203 | 4.0 | 4818 | 96.0 | 0.12 | Reference | Reference | Reference | ||||||||||
| Yes | 463 | 4.6 | 9608 | 95.4 | 1.14 | 0.97 | 1.34 | 0.12 | 1.18 | 1.00 | 1.40 | 0.05 | 1.16 | 0.98 | 1.37 | 0.09 | ||
| Previous medical history | ||||||||||||||||||
| No | 477 | 4.2 | 10,871 | 95.8 | 0.03 | Reference | Reference | Reference | ||||||||||
| Yes | 328 | 4.9 | 6377 | 95.1 | 1.16 | 1.01 | 1.34 | 0.03 | 1.11 | 0.96 | 1.28 | 0.17 | 1.13 | 0.97 | 1.30 | 0.12 | ||
| Paternal educational level (years) | ||||||||||||||||||
| ≤9 | 51 | 3.8 | 1278 | 96.2 | 0.04 | 0.94 | 0.7 | 1.26 | 0.67 | 0.96 | 0.71 | 1.30 | 0.80 | 0.94 | 0.70 | 1.26 | 0.67 | |
| 10–12 | 292 | 4.1 | 6857 | 95.9 | Reference | Reference | Reference | |||||||||||
| 13–15 | 207 | 5.2 | 3804 | 94.8 | 1.26 | 1.06 | 1.5 | 0.01 | 1.25 | 1.05 | 1.49 | 0.01 | 1.26 | 1.06 | 1.50 | <0.01 | ||
| ≥16 | 200 | 4.4 | 4318 | 95.6 | 1.08 | 0.91 | 1.29 | 0.37 | 1.04 | 0.86 | 1.25 | 0.71 | 1.08 | 0.91 | 1.29 | 0.37 | ||
| Familial characteristics | ||||||||||||||||||
| Household income (million yen) | ||||||||||||||||||
| <3.0 | 120 | 3.5 | 3271 | 96.5 | 0.03 | 0.80 | 0.65 | 0.98 | 0.03 | 0.83 | 0.67 | 1.02 | 0.08 | 0.80 | 0.64 | 1.00 | 0.04 | |
| 3.0–4.9 | 294 | 4.5 | 6311 | 95.5 | Reference | Reference | Reference | |||||||||||
| 5.0–7.9 | 179 | 4.8 | 3557 | 95.2 | 1.08 | 0.9 | 1.29 | 0.43 | 1.03 | 0.86 | 1.24 | 0.75 | 1.02 | 0.84 | 1.23 | 0.84 | ||
| ≥8 | 59 | 5.4 | 1030 | 94.6 | 1.16 | 0.88 | 1.53 | 0.31 | 1.10 | 0.83 | 1.47 | 0.51 | 1.10 | 0.82 | 1.48 | 0.53 | ||
| Case | Non Case | Based on DAG Model 1,2 | ||||||||
|---|---|---|---|---|---|---|---|---|---|---|
| 95%CI | ||||||||||
| N | % | N | % | RRs | Lower | Upper | p-Value | |||
| VLBW | ||||||||||
| Maternal age at entry (years old) | * | Maternal educational level (years) | ||||||||
| <24 | * | ≤9 | 2 | 0.5 | 419 | 99.5 | 1.37 | 0.27 | 7.06 | 0.71 |
| * | 10–12 | 5 | 0.3 | 1441 | 99.7 | Reference | ||||
| * | 13–15 | 2 | 0.4 | 562 | 99.6 | 1.03 | 0.20 | 5.27 | 0.98 | |
| * | ≥16 | 0 | 0.0 | 73 | 100.0 | NA | NA | NA | NA | |
| 25-34 | * | ≤9 | 2 | 0.5 | 427 | 99.5 | 1.52 | 0.35 | 6.62 | 0.60 |
| * | 10–12 | 15 | 0.3 | 4873 | 99.7 | Reference | ||||
| * | 13–15 | 14 | 0.3 | 5069 | 99.7 | 0.90 | 0.43 | 1.86 | 0.77 | |
| * | ≥16 | 8 | 0.6 | 1348 | 99.4 | 1.92 | 0.82 | 4.52 | 0.15 | |
| ≥35 | * | ≤9 | 0 | 0.0 | 84 | 100.0 | NA | NA | NA | NA |
| * | 10–12 | 10 | 0.9 | 1163 | 99.1 | Reference | ||||
| * | 13–15 | 7 | 0.5 | 1312 | 99.5 | 0.62 | 0.24 | 1.63 | 0.33 | |
| * | ≥16 | 2 | 0.5 | 422 | 99.5 | 0.56 | 0.12 | 2.53 | 0.42 | |
| PTB | ||||||||||
| Maternal educational level (years) | * | Prepregnancy BMI (kg/m2) | ||||||||
| ≤9 | * | <18.5 | 13 | 6.7 | 180 | 93.3 | 2.31 | 1.15 | 4.65 | 0.02 |
| * | 18.5–24.9 | 21 | 3.6 | 556 | 96.4 | Reference | ||||
| * | 25.0–29.9 | 4 | 4.4 | 86 | 95.6 | 1.31 | 0.45 | 3.79 | 0.63 | |
| * | ≥30.0 | 3 | 9.7 | 28 | 90.3 | 1.60 | 0.39 | 6.60 | 0.52 | |
| 10–12 | * | <18.5 | 71 | 5.7 | 1178 | 94.3 | 1.72 | 1.31 | 2.26 | <0.01 |
| * | 18.5–24.9 | 191 | 3.6 | 5054 | 96.4 | Reference | ||||
| * | 25.0–29.9 | 35 | 5.4 | 608 | 94.6 | 1.45 | 1.01 | 2.10 | 0.06 | |
| * | ≥30.0 | 3 | 1.5 | 191 | 98.5 | NA | NA | NA | NA | |
| 13–15 | * | <18.5 | 59 | 4.9 | 1150 | 95.1 | 1.06 | 0.79 | 1.43 | 0.69 |
| * | 18.5–24.9 | 236 | 4.7 | 4814 | 95.3 | Reference | ||||
| * | 25.0–29.9 | 24 | 4.8 | 478 | 95.2 | 1.00 | 0.65 | 1.54 | 0.99 | |
| * | ≥30.0 | 9 | 7.8 | 106 | 92.2 | 1.64 | 0.84 | 3.24 | 0.19 | |
| ≥16 | * | <18.5 | 21 | 6.4 | 307 | 93.6 | 1.87 | 1.12 | 3.12 | 0.02 |
| * | 18.5–24.9 | 55 | 4.0 | 1325 | 96.0 | Reference | ||||
| * | 25.0–29.9 | 1 | 1.0 | 102 | 99.0 | 0.27 | 0.04 | 1.94 | 0.19 | |
| * | ≥30.0 | 2 | 10.0 | 18 | 90.0 | 2.78 | 0.73 | 10.59 | 0.13 | |
| Maternal age at entry (years old) | * | Using ART | ||||||||
| <24 | * | no | 88 | 3.5 | 2395 | 96.5 | Reference | |||
| * | yes | 2 | 9.1 | 20 | 90.9 | 3.05 | 0.80 | 11.62 | 0.18 | |
| 25–34 | * | no | 451 | 4.0 | 10,890 | 96.0 | Reference | |||
| * | yes | 39 | 9.2 | 386 | 90.8 | 2.06 | 1.45 | 2.93 | <0.01 | |
| ≥35 | * | no | 164 | 6.0 | 2570 | 94.0 | Reference | |||
| * | yes | 17 | 6.4 | 247 | 93.6 | 0.98 | 0.59 | 1.65 | 0.95 | |
© 2018 by the authors. Licensee MDPI, Basel, Switzerland. This article is an open access article distributed under the terms and conditions of the Creative Commons Attribution (CC BY) license (http://creativecommons.org/licenses/by/4.0/).
Share and Cite
Tamura, N.; Hanaoka, T.; Ito, K.; Araki, A.; Miyashita, C.; Ito, S.; Minakami, H.; Cho, K.; Endo, T.; Sengoku, K.; et al. Different Risk Factors for Very Low Birth Weight, Term-Small-for-Gestational-Age, or Preterm Birth in Japan. Int. J. Environ. Res. Public Health 2018, 15, 369. https://doi.org/10.3390/ijerph15020369
Tamura N, Hanaoka T, Ito K, Araki A, Miyashita C, Ito S, Minakami H, Cho K, Endo T, Sengoku K, et al. Different Risk Factors for Very Low Birth Weight, Term-Small-for-Gestational-Age, or Preterm Birth in Japan. International Journal of Environmental Research and Public Health. 2018; 15(2):369. https://doi.org/10.3390/ijerph15020369
Chicago/Turabian StyleTamura, Naomi, Tomoyuki Hanaoka, Kumiko Ito, Atsuko Araki, Chihiro Miyashita, Sachiko Ito, Hisanori Minakami, Kazutoshi Cho, Toshiaki Endo, Kazuo Sengoku, and et al. 2018. "Different Risk Factors for Very Low Birth Weight, Term-Small-for-Gestational-Age, or Preterm Birth in Japan" International Journal of Environmental Research and Public Health 15, no. 2: 369. https://doi.org/10.3390/ijerph15020369