Understanding Weather and Hospital Admissions Patterns to Inform Climate Change Adaptation Strategies in the Healthcare Sector in Uganda

 , , ,
, , ,
Abstract
:1. Introduction
2. Methods
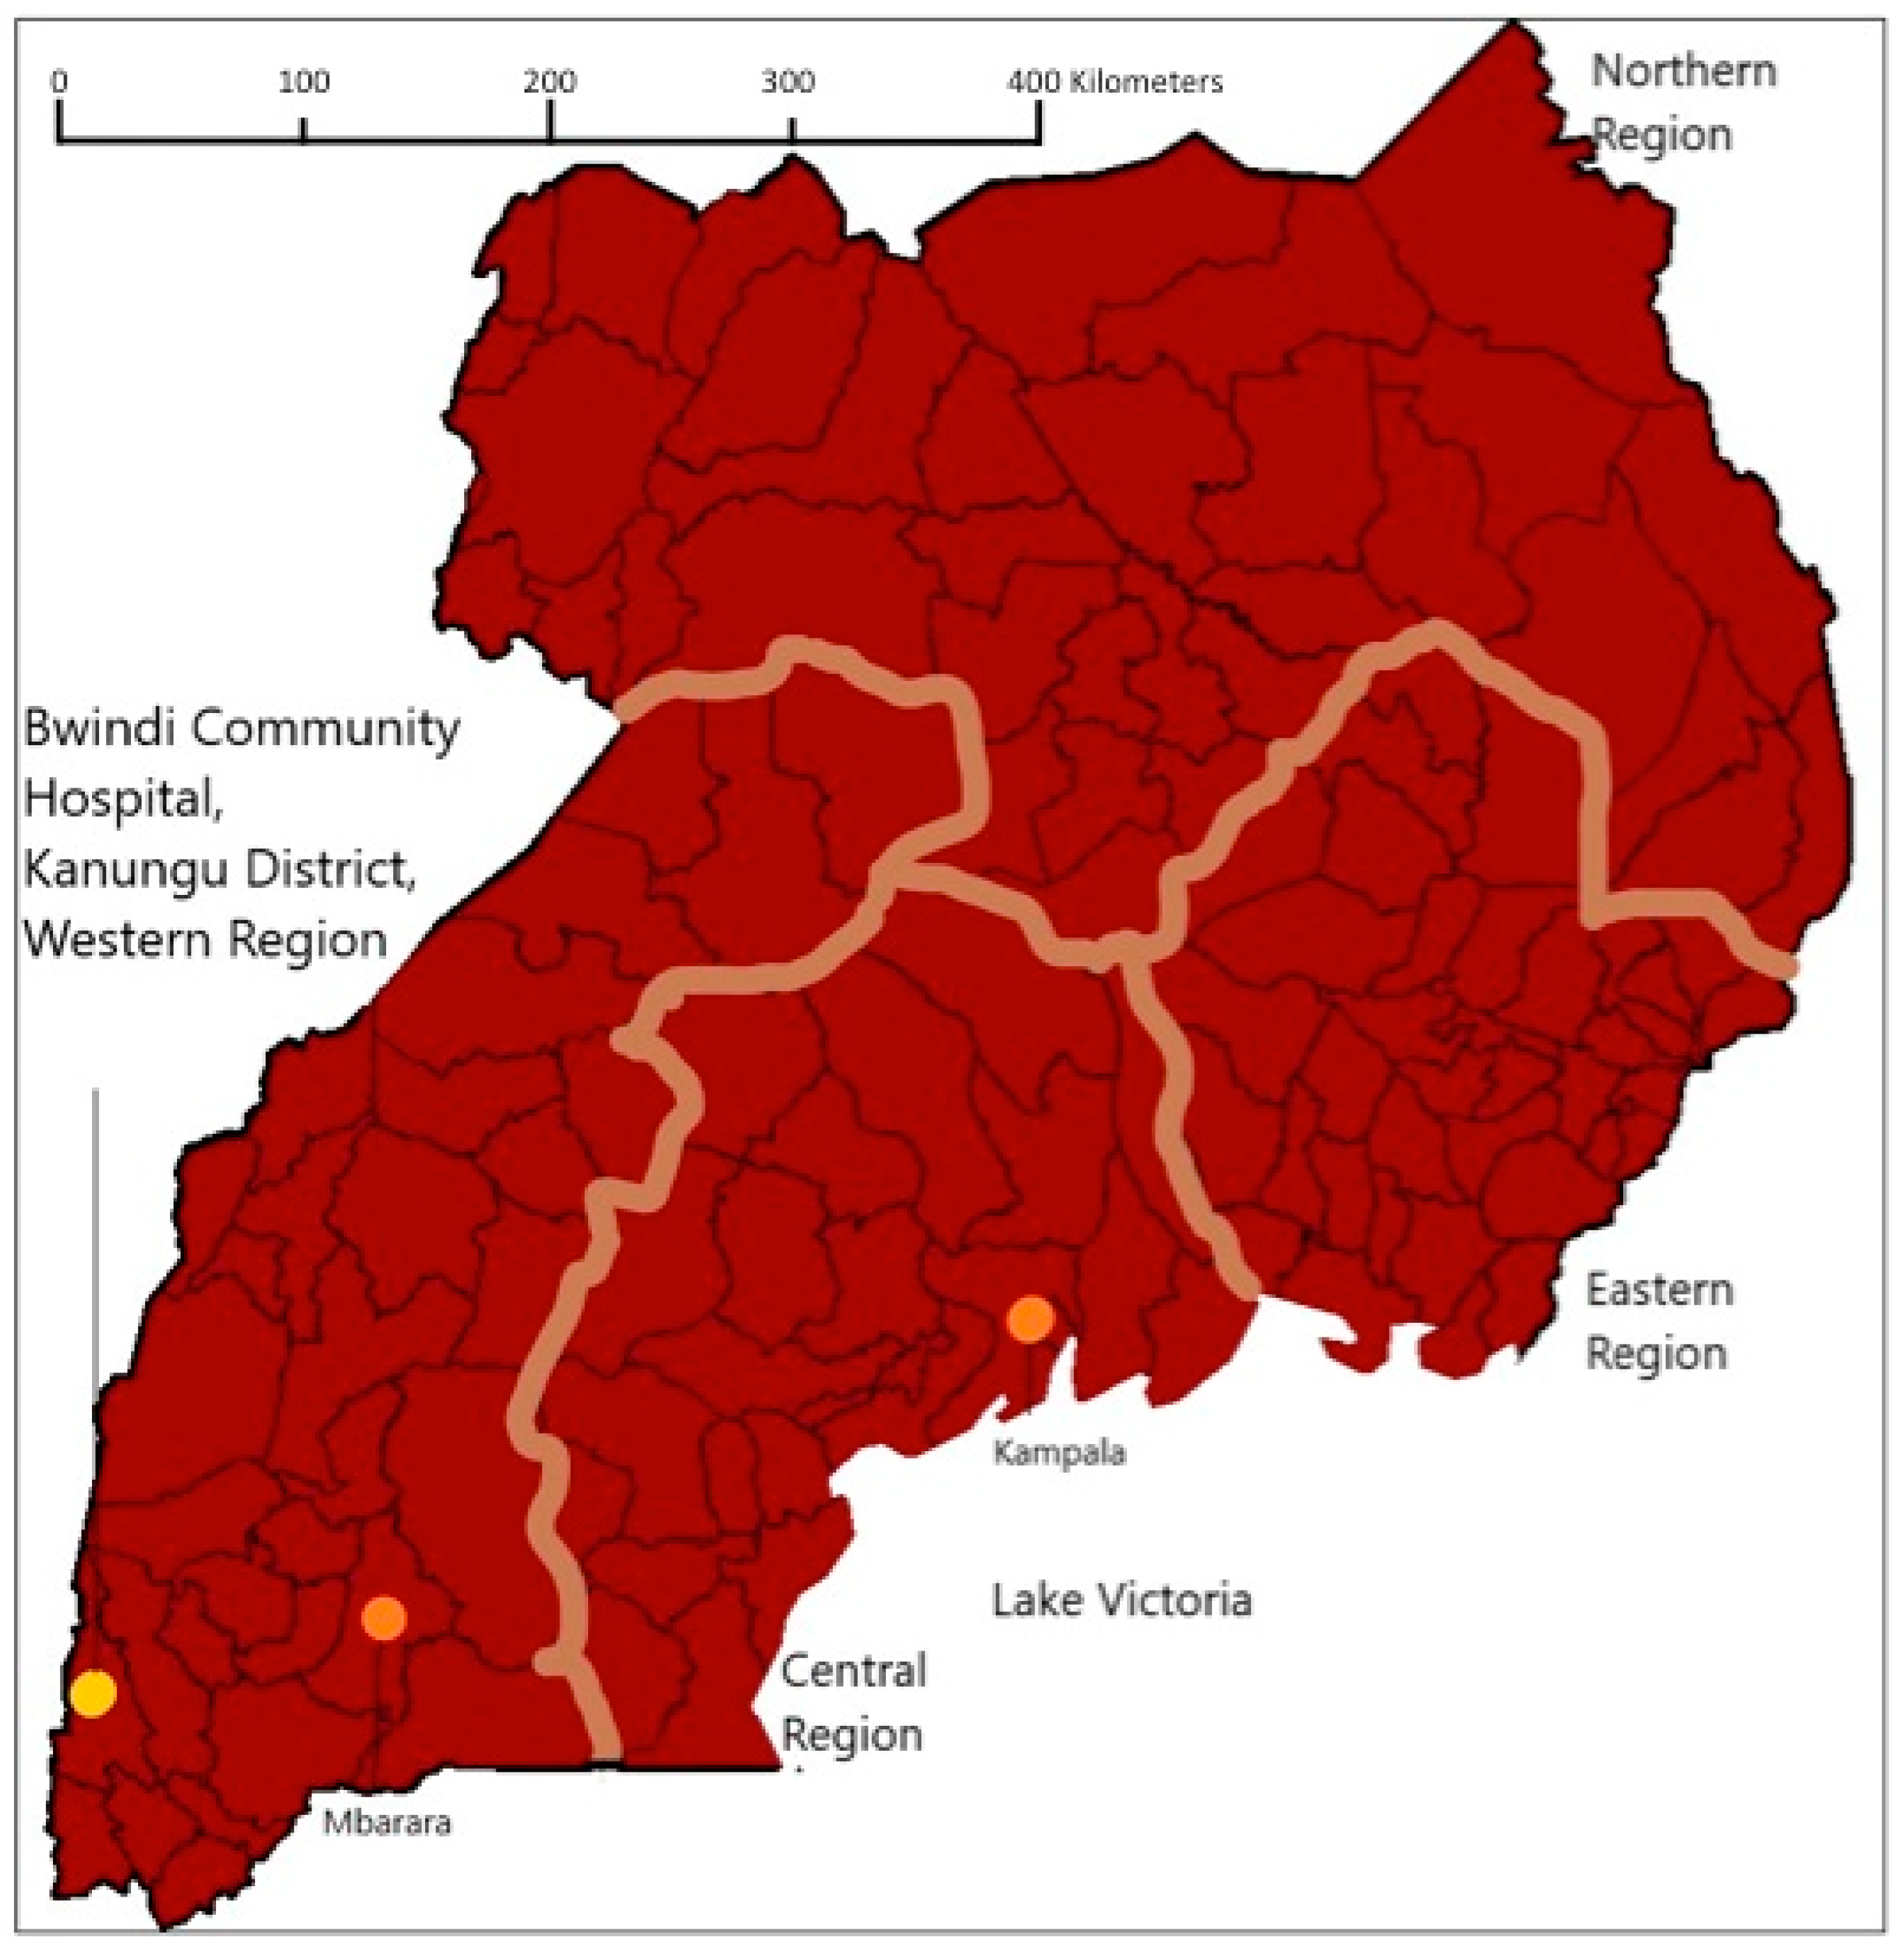
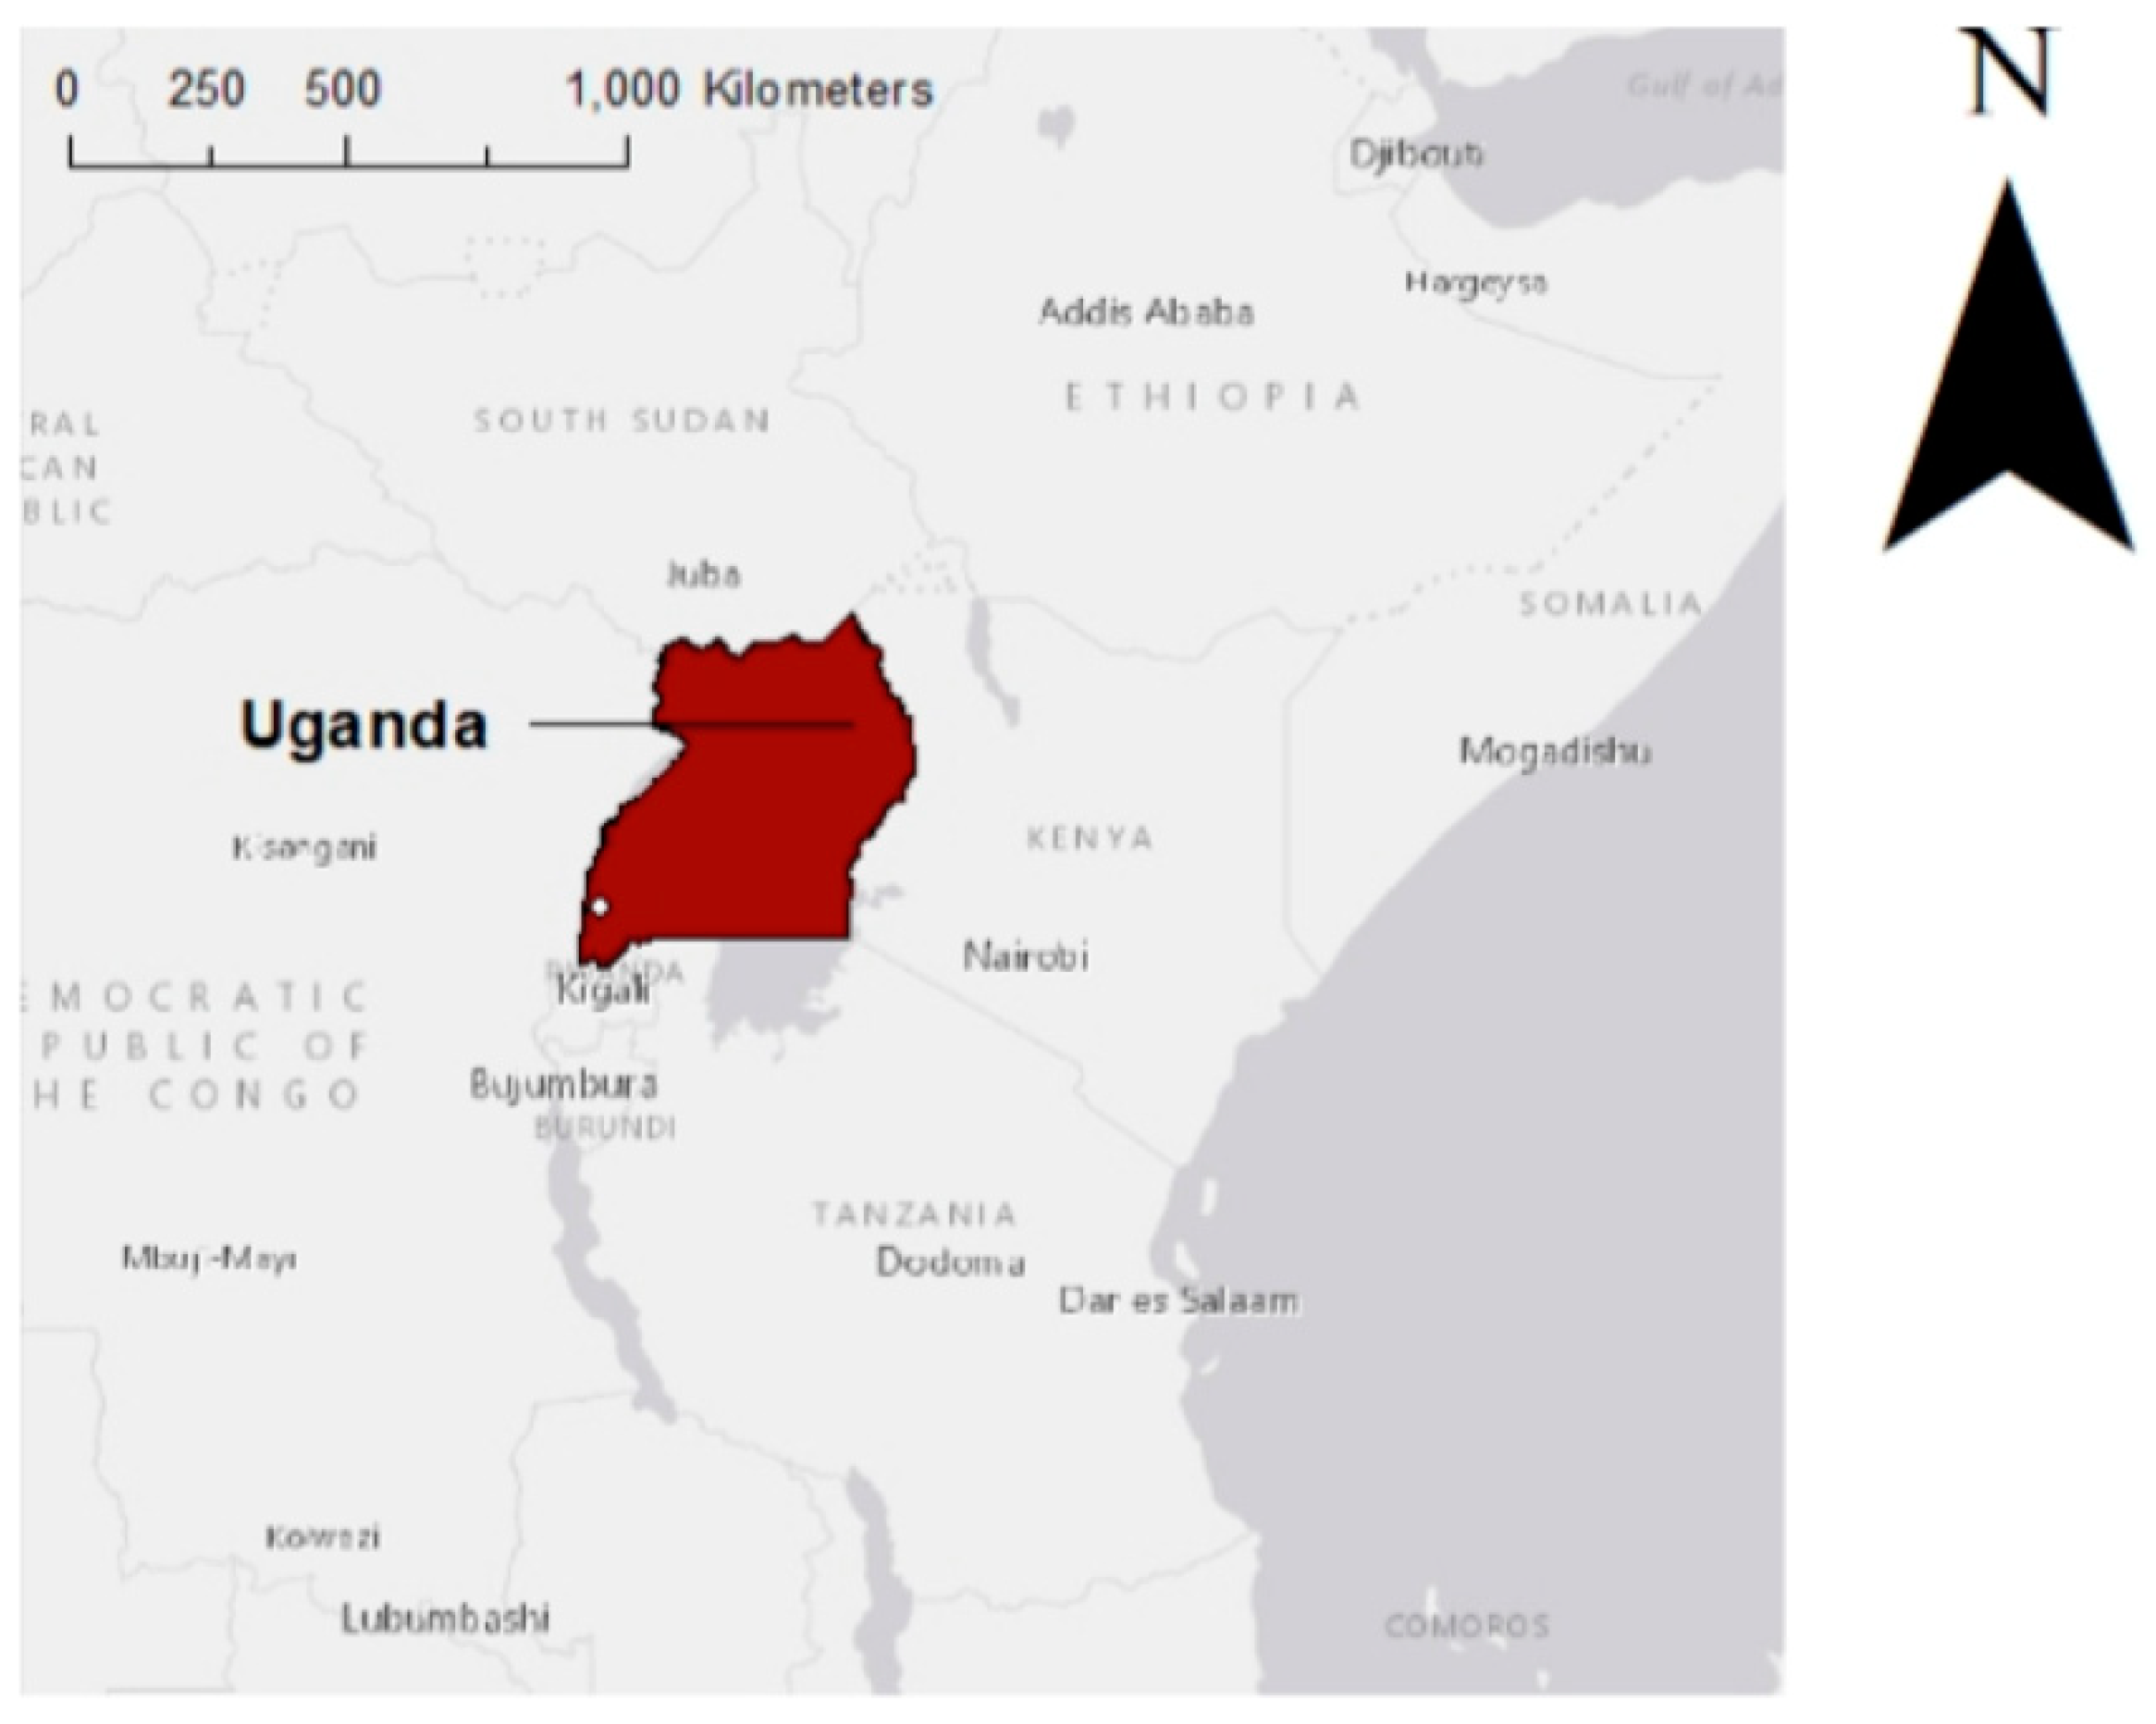
2.1. Study Location
2.2. Data Collection and Management
2.3. Analyses
2.3.1. Descriptive Statistics
2.3.2. Regression Analyses
2.3.3. Ethical Standards
2.3.4. Availability of Data
3. Results
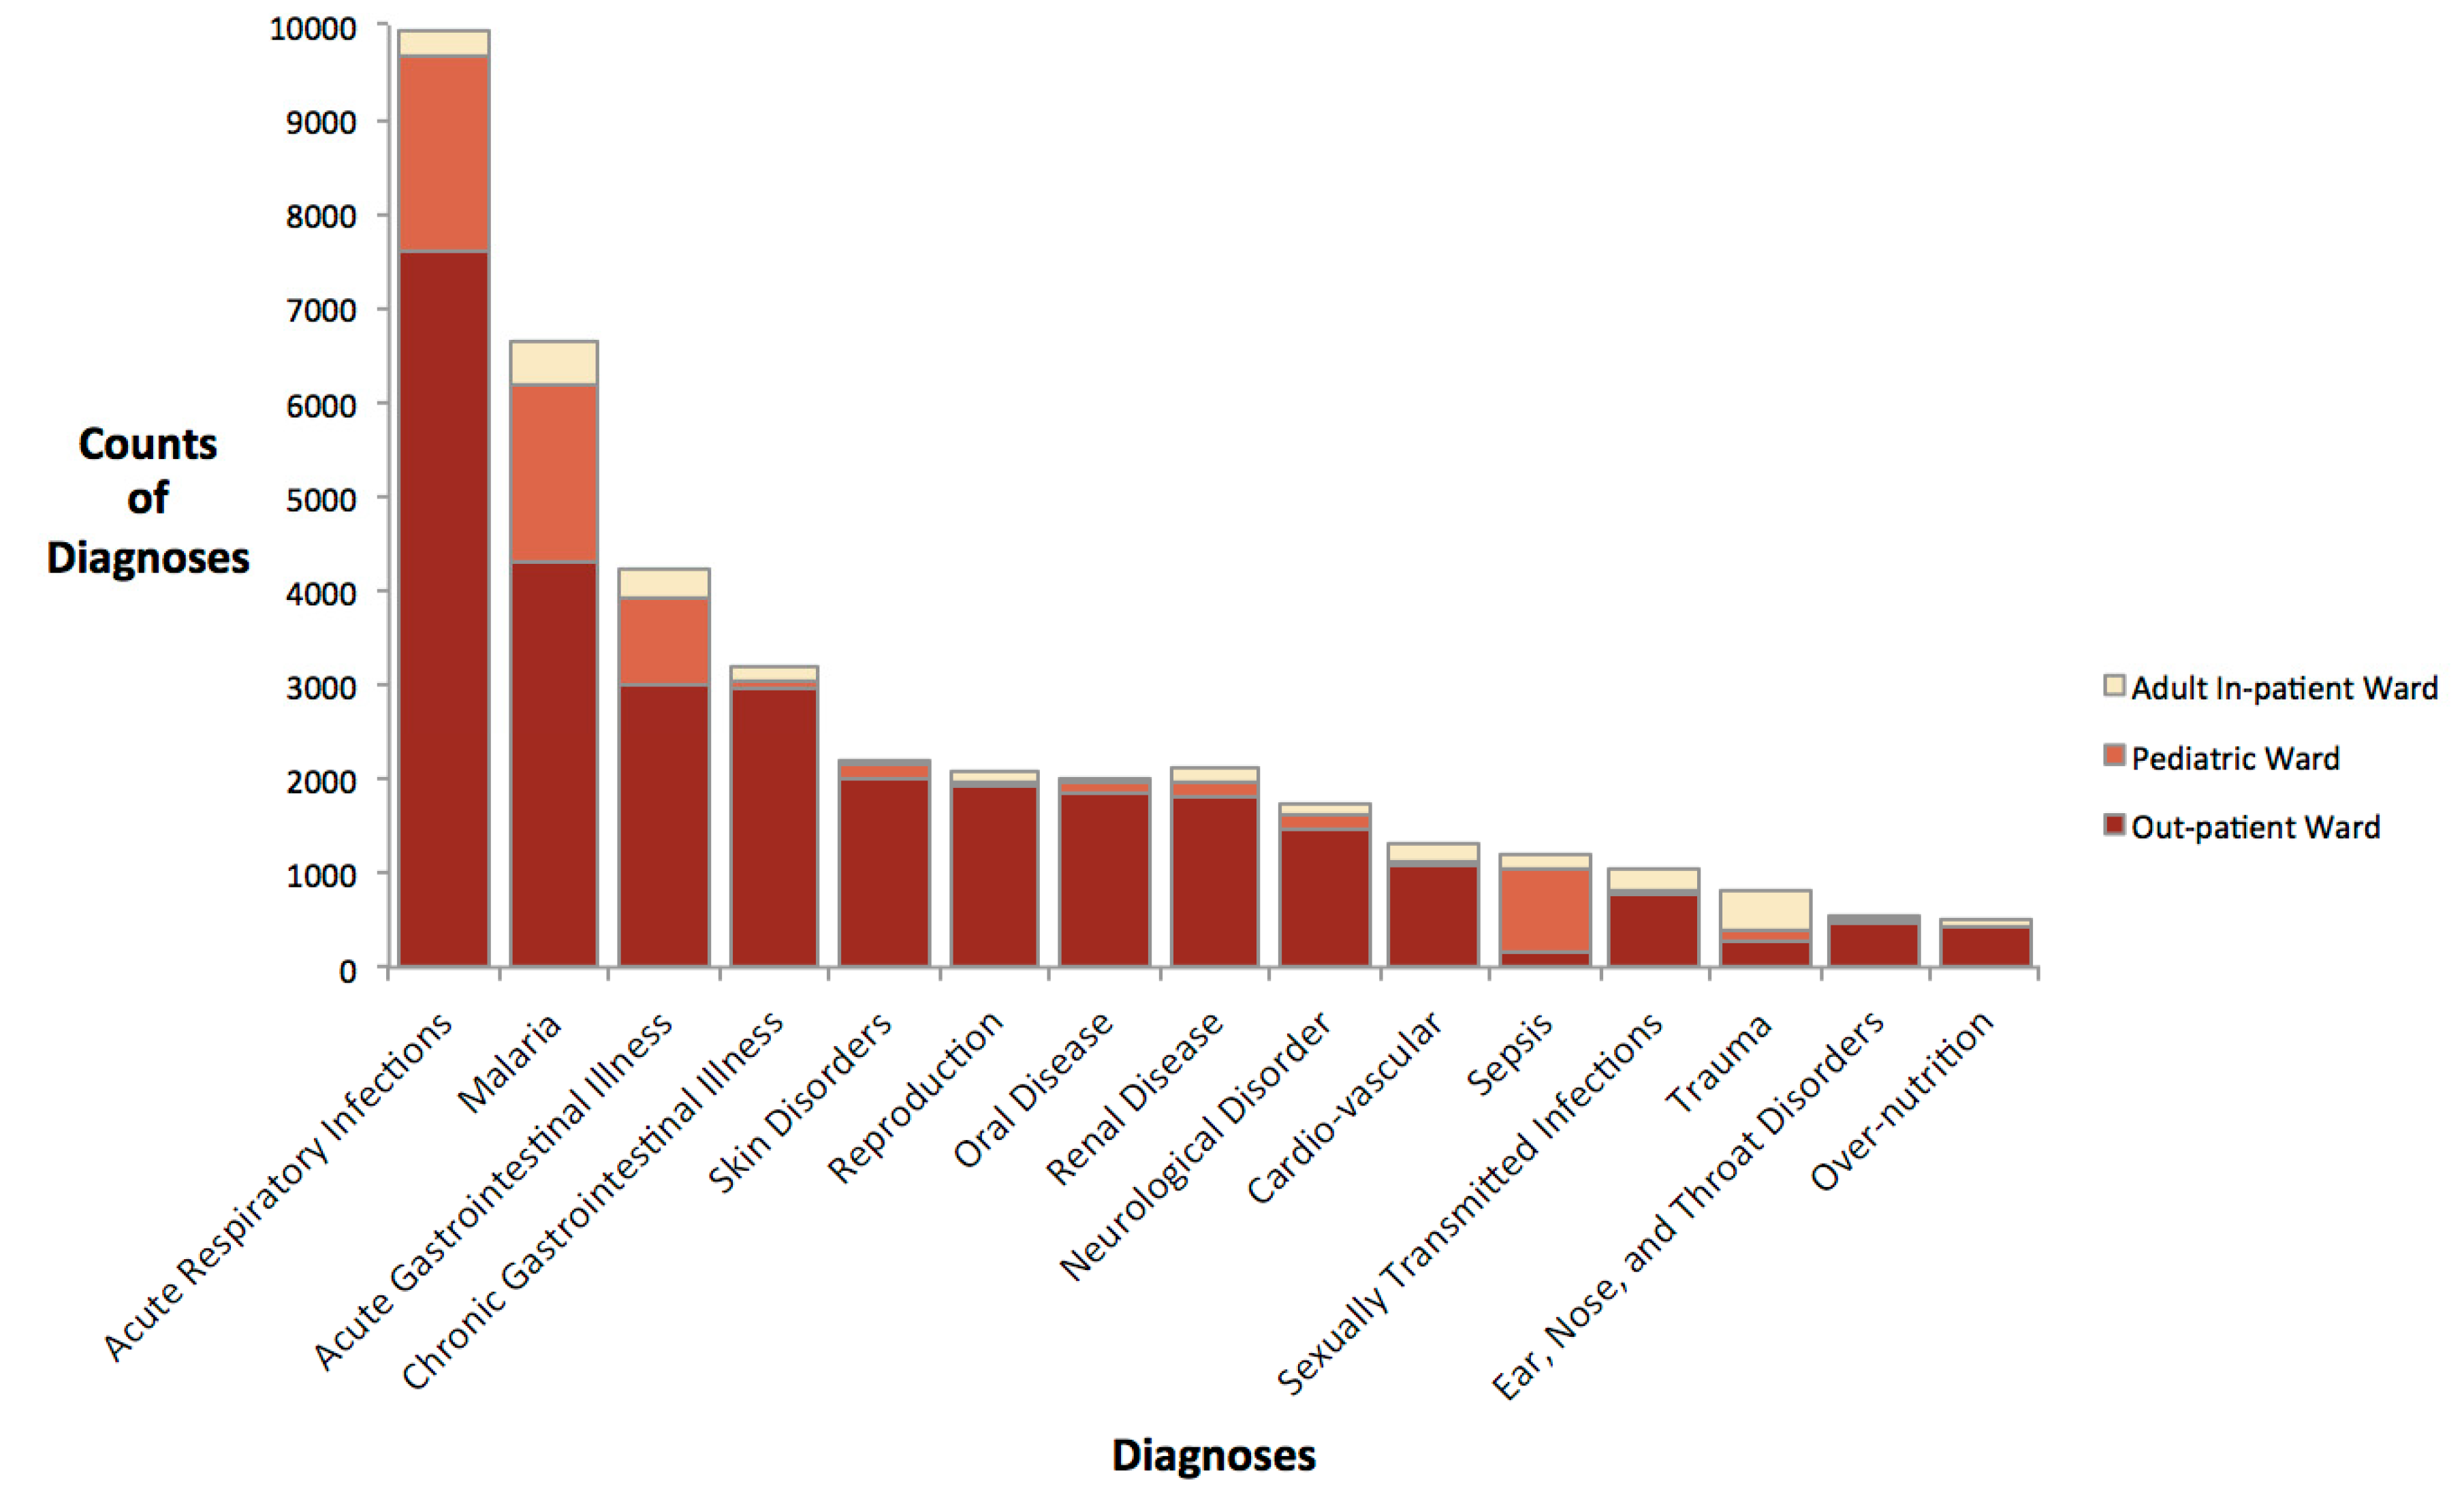
3.1. Description of Hospital Admissions and Meteorological Data
3.2. Trends in Meteorological Variables
3.3. Associations between Hospital Admissions and Meteorological Parameters
4. Discussion
5. Conclusions
Author Contributions
Funding
Acknowledgments
Conflicts of Interest
References
- Ma, W.; Xu, X.; Peng, L.; Kan, H. Impact of extreme temperature on hospital admission in Shanghai, China. Sci. Total. Environ. 2011, 409, 3634–3637. [Google Scholar] [CrossRef] [PubMed]
- Kinney, P.L.; Schwartz, J.; Pascal, M.; Petkova, E.; Le Tertre, A.; Medina, S.; Vautard, R. Winter season mortality: Will climate warming bring benefits? Environ. Res. Lett. 2015, 10, 064016. [Google Scholar] [CrossRef] [PubMed]
- Bishop-Williams, K.E.; Berke, O.; Pearl, D.L.; Kelton, D.F. A spatial analysis of heat stress related emergency room visits in rural Southern Ontario during heat waves. BMC Emerg. Med. 2015, 15, 17. [Google Scholar] [CrossRef] [PubMed]
- Githeko, A.K.; Ndegwa, W. Predicting malaria epidemics in the Kenyan highlands using climate data: A tool for decision makers. Glob. Chang. Hum. Health 2001, 2, 54–63. [Google Scholar] [CrossRef]
- Adger, W.N.; Barnett, J.; Brown, K.; Marshall, N.; O’brien, K. Cultural dimensions of climate change impacts and adaptation. Nat. Clim. Chang. 2013, 3, 112. [Google Scholar] [CrossRef]
- Adger, W.N.; Arnell, N.W.; Tompkins, E.L. Successful adaptation to climate change across scales. Glob. Environ. Chang. 2005, 15, 77–86. [Google Scholar] [CrossRef]
- Heltberg, R.; Siegel, P.B.; Jorgensen, S.L. Addressing human vulnerability to climate change: Toward a ‘no-regrets’ approach. Glob. Environ. Chang. 2009, 19, 89–99. [Google Scholar] [CrossRef]
- Wilbanks, T.J.; Kates, R.W. Global change in local places: How scale matters. Clim. Chang. 1999, 43, 601–628. [Google Scholar] [CrossRef]
- Gernaat, H.; Dechering, W.; Voorhoeve, H. Clinical epidemiology of paediatric disease at Nchelenge, north-east Zambia. Ann. Trop. Paediatr. 1998, 18, 129. [Google Scholar] [CrossRef] [PubMed]
- Ansa, V.; Ansa, V.O.; Ekott, J.U.; Essien, I.O.; Bassey, E.O. Seasonal variation in admission for heart failure, hypertension and stroke. Ann. Afr. Med. 2008, 7, 62–66. [Google Scholar] [CrossRef] [PubMed]
- Whitman, S.; Good, G.; Donoghue, E.R.; Benbow, N.; Shou, W.; Mou, S. Mortality in Chicago attributed to the July 1995 heat wave. Am. J. Public Health 1997, 87, 1515–1518. [Google Scholar] [CrossRef] [PubMed]
- Pudpong, N.; Hajat, S. High temperature effects on out-patient visits and hospital admissions in Chiang Mai, Thailand. Sci. Total. Environ. 2011, 409, 5260–5267. [Google Scholar] [CrossRef] [PubMed]
- Kudamatsu, M.; Persson, T.; Strömberg, D. Weather and Infant Mortality in Africa; Stockholm University: Stockholm, Sweden, 2012. [Google Scholar]
- Olago, D.; Marshall, M.; Wandiga, S.O.; Opondo, M.; Yanda, P.Z.; Kangalawe, R.; Githeko, A.; Downs, T.; Opere, A.; Kabumbuli, R.; et al. Climatic, socio-economic, and health factors affecting human vulnerability to cholera in the Lake Victoria basin, East Africa. AMBIO A J. Hum. Environ. 2007, 36, 350–358. [Google Scholar] [CrossRef]
- Isezuo, S. Seasonal variation in hospitalisation for hypertension-related morbidities in Sokoto, north-western Nigeria. Int. J. Circumpolar Health 2003, 62, 397–409. [Google Scholar] [CrossRef] [PubMed]
- Immink, A.; Scherjon, S.; Wolterbeek, R.; Wilhelm Steyn, D. Seasonal influence on the admittance of pre-eclampsia patients in Tygerberg Hospital. Acta Obstet. Et Gynecol. Scand. 2008, 87, 36–42. [Google Scholar] [CrossRef] [PubMed]
- Wang, L.; Kanji, S.; Bandyopadhyay, S. The Health Impact of Extreme Weather Events in Sub-Saharan Africa; World Bank Policy Research Working Paper Series; The World Bank: Washington, DC, USA, 2009. [Google Scholar]
- Van der Sande, M.A.; Goetghebuer, T.; Sanneh, M.; Whittle, H.C.; Weber, M.W. Seasonal variation in respiratory syncytial virus epidemics in the Gambia, West Africa. Pediatr. Infect. Dis. J. 2004, 23, 73–74. [Google Scholar] [CrossRef] [PubMed]
- Berrang-Ford, L.; Dingle, K.; Ford, J.D.; Lee, C.; Lwasa, S.; Namanya, D.B.; Henderson, J.; Llanos, A.; Carcamo, C.; Edge, V. Vulnerability of indigenous health to climate change: A case study of Uganda’s Batwa Pygmies. Soc. Sci. Med. 2012, 75, 1067–1077. [Google Scholar] [CrossRef] [PubMed]
- Ebi, K.L.; Kovats, R.S.; Menne, B. An approach for assessing human health vulnerability and public health interventions to adapt to climate change. Environ. Health Perspect. 2006, 114, 1930–1934. [Google Scholar] [CrossRef] [PubMed]
- United States Agency for International Development. Climate Change Vulnerability and Adaptation in East Africa: Health, Sanitation, and Human Settlements. In Fact Sheets; USAID: Arusha, Tanzania, 2018; p. 4. [Google Scholar]
- McSweeney, C.; New, M.; Lizcano, G. UNDP Climate Change Country Profiles: Uganda; University of Oxford: Oxford, UK, 2010. [Google Scholar]
- Boehlert, B.; Strzepek, K.M.; Groves, D.; Hewitson, B.; Jack, C. Climate Change Projections in Africa. In Enhancing the Climate Resilience of Africa’s Infrastructure: The Power and Water Sectors; Cervigni, R., Liden, R., Neumann, J.E., Strzepek, K.M., Eds.; World Bank Group: Washington, DC, USA, 2015; pp. 59–75. [Google Scholar]
- Ohenjo, N.; Willis, R.; Jackson, D.; Nettleton, C.; Good, K.; Mugarura, B. Health of Indigenous people in Africa. Lancet 2006, 367, 1937–1946. [Google Scholar] [CrossRef]
- BakamaNume, B.B. A Contemporary Geography of Uganda; African Books Collective: Dar Es Salam, Ethiopia, 2010. [Google Scholar]
- Google. Google Maps. 2016. Available online: www.google.ca/maps (accessed on 2 August 2016).
- Uganda Bureau of Statistics. National Population and Housing Census 2014 Provisional Results; Uganda Bureau of Statistics: Kampala, Uganda, 2014. [Google Scholar]
- Labbé, J.; Ford, J.D.; Berrang-Ford, L.; Donnelly, B.; Lwasa, S.; Namanya, D.B.; Twesigomwe, S.; IHACC Research Team; Harper, S.L. Vulnerability to the health effects of climate variability in rural southwestern Uganda. Mitig. Adapt. Strat. Glob. Chang. 2015, 21, 931–953. [Google Scholar]
- Jackson, D. The Health Situation of Women and Children in Central African Pygmy Peoples; Indigenous Affairs; International Work Group for Indigenous Affairs: Copenhagen, Denmark, 2006; Volume 1, pp. 38–45. [Google Scholar]
- Musinguzi, G. Uganda Radio Network (URN). In Kambuga Hospital to Close; Musinguzi, G., Ed.; Uganda Radio Network: Kanungu, Uganda, 2006. [Google Scholar]
- Bwindi Community Hospital. Patient Care. Hospital Services n.d. Available online: http://www.bwindihospital.com/patient-care.html (accessed on 15 November 2016).
- Charron, D.F. Ecohealth Research in Practice; Springer: Berlin, Germany, 2012. [Google Scholar]
- National Centre for Atmospheric Research. Climate Data Guide. 2016. Available online: www.climatedataguide.ucar.edu (accessed on 2 August 2016).
- Kulldorff, M.; Heffernan, R.; Hartman, J.; Assunçao, R.; Mostashari, F. A space-time permutation scan statistic for disease outbreak detection. PLoS Med. 2005, 2, e59. [Google Scholar] [CrossRef] [PubMed] [Green Version]
- Dohoo, I.R.; Martin, W.; Stryhn, H.E. Veterinary Epidemiologic Research, 2nd ed.; Veterinary Epidemiologic Research Inc.: Charlottetown, PE, Canada, 2003; p. 865. [Google Scholar]
- Liao, J.; Yu, S.; Yang, F.; Yang, M.; Hu, Y.; Zhang, J. Short-Term Effects of Climatic Variables on Hand, Foot, and Mouth Disease in Mainland China, 2008–2013: A Multilevel Spatial Poisson Regression Model Accounting for Overdispersion. PLoS ONE 2016, 11, e0147054. [Google Scholar] [CrossRef] [PubMed]
- Rodrigues, N.C.P.; Lino, V.T.S.; Daumas, R.P.; de Noronha Andrade, M.K.; O’Dwyer, G.; Monteiro, D.L.M.; Gerardi, A.; Fernandes, G.H.B.V.; Ramos, J.A.S.; Ferreira, C.E.G. Temporal and Spatial Evolution of Dengue Incidence in Brazil, 2001–2012. PLoS ONE 2016, 11, e0165945. [Google Scholar] [CrossRef] [PubMed]
- Mousam, A.; Maggioni, V.; Delamater, P.L.; Quispe, A.M. Using remote sensing and modeling techniques to investigate the annual parasite incidence of malaria in Loreto, Peru. Adv. Water Resour. 2017, 108, 423–438. [Google Scholar] [CrossRef]
- World Health Organization. World Health Statistics 2015. In World Health Statistics; World Health Organization: Geneva, Switzerland, 2015. [Google Scholar]
- Clark, S.; Berrang-Ford, L.; Lwasa, S.; Namanya, D.B.; Edge, V.L.; Harper, S.L. IHACC Research Team. The burden and determinants of self-reported acute gastrointestinal illness in an Indigenous Batwa Pygmy population in southwestern Uganda. Epidemiol. Infect. 2015, 143, 2287–2298. [Google Scholar] [CrossRef] [PubMed]
- Hamad, A.A.; Abd El Hamid, D.N.; Arnot, D.E.; Giha, H.A.; Abdel-Muhsin, A.M.A.; Satti, G.M.; Theander, T.G.; Creasey, A.M.; Babiker, H.A.; Elnaiem, D.E.A.; et al. A marked seasonality of malaria transmsission in two rural sites in eastern Sudan. Acta Trop. 2002, 83, 71–82. [Google Scholar] [CrossRef]
- Tong, S.; Berrang-Ford, L.; Lwasa, S.; Namanya, D.B.; Edge, V.L.; Harper, S.; IHACC Research Team. Managing and mitigating the health risks of climate change: Calling for evidence-informed policy and action. Environ. Health Perspect. 2016, 124, A176. [Google Scholar] [CrossRef] [PubMed]
- Shackleton, S.; Ziervogel, G.; Sallu, S.; Gill, T.; Tschakert, P. Why is socially-just climate change adaptation in sub-Saharan Africa so challenging? A review of barriers identified from empirical cases. Wiley Interdiscip. Rev. Clim. Chang. 2015, 6, 321–344. [Google Scholar] [CrossRef] [Green Version]
- Kovats, R.S.; Hajat, S. Heat stress and public health: A critical review. Annu. Rev. Public Health 2008, 29, 41–55. [Google Scholar] [CrossRef] [PubMed]
- Watts, N.; Adger, W.N.; Agnolucci, P.; Blackstock, J.; Byass, P.; Cai, W.; Chaytor, S.; Colbourn, T.; Collins, M.; Cooper, A. Health and climate change: Policy responses to protect public health. Lancet 2015, 386, 1861–1914. [Google Scholar] [CrossRef]
- Ebi, K.L.; Frumkin, H.; Hess, J.J. Protecting and promoting population health in the context of climate and other global environmental changes. Anthropocene 2017, 19, 1–12. [Google Scholar] [CrossRef]
- Hartmann, D.; Klein Tank, A.; Rusticucci, M.; Alexander, L.; Broennimann, S.; Charabi, Y.A.-R.; Dentener, F.; Dlugokencky, E.; Easterling, D.; Kaplan, A.; et al. Technical Summary. In Climate Change 2013: The Physical Science Basis. Contribution of Working Group I to the Fifth Assessment Report of the Intergovernmental Panel on Climate Change; Fifth Assessment Report of the Intergovernmental Panel on Climate Change; Stocker, T.F., Qin, D., Plattner, G.-K., Tignor, M.M.B., Allen, S.K., Boschung, J., Nauels, A., Xia, Y., Bex, V., Midgley, P.M., Eds.; Cambridge University Press: Cambridge, UK; New York, NY, USA,, 2013. [Google Scholar]
- Ford, J.D.; Sherman, M.; Berrang-Ford, L.; Llanos, A.; Carcamo, C.; Harper, S.; Lwasa, S.; Namanya, D.; Marcello, T.; Maillet, M.; et al. Preparing for the health impacts of climate change in Indigenous communities: The role of community-based adaptation. Glob. Environ. Chang. 2018, 49, 129–139. [Google Scholar] [CrossRef]
- Ludi, E.; Jones, L.; Levine, S. Changing Focus? How to Take Adaptive Capacity Seriously; Overseas Development Institute: London, UK, 2012. [Google Scholar]
- Roncoli, C.; Orlove, B.S.; Kabugo, M.R.; Waiswa, M.M. Cultural styles of participation in farmers’ discussions of seasonal climate forecasts in Uganda. Agric. Hum. Values 2011, 28, 123–138. [Google Scholar] [CrossRef]
- Ebi, K.L.; Semenza, J.C. Community-based adaptation to the health impacts of climate change. Am. J. Prev. Med. 2008, 35, 501–507. [Google Scholar] [CrossRef] [PubMed]
- Berrang-Ford, L.; Ford, J.D.; Paterson, J. Are we adapting to climate change? Glob. Environ. Chang. 2011, 21, 25–33. [Google Scholar] [CrossRef]
- Duff, P.; Kipp, W.; Wild, T.C.; Rubaale, T.; Okech-Ojony, J. Barriers to accessing highly active antiretroviral therapy by HIV-positive women attending an antenatal clinic in a regional hospital in western Uganda. J. Int. AIDS Soc. 2010, 13, 37. [Google Scholar] [CrossRef] [PubMed]
- Hjortsberg, C.; Mwikisa, C. Cost of access to health services in Zambia. Health Policy Plan. 2002, 17, 71–77. [Google Scholar] [CrossRef] [PubMed] [Green Version]
- Sacks, E.; Vail, D.; Austin-Evelyn, K.; Greeson, D.; Atuyambe, L.M.; Macwan’gi, M.; Kruk, M.E.; Grépin, K.A. Factors influencing modes of transport and travel time for obstetric care: A mixed methods study in Zambia and Uganda. Health Policy Plan. 2015, 31, 293–301. [Google Scholar] [CrossRef] [PubMed]
- Posse, M.; Meheus, F.; Van Asten, H.; Van Der Ven, A.; Baltussen, R. Barriers to access to antiretroviral treatment in developing countries: A review. Trop. Med. Int. Health 2008, 13, 904–913. [Google Scholar] [CrossRef] [PubMed]
- Essendi, H.; Mills, S.; Fotso, J.-C. Barriers to formal emergency obstetric care services’ utilization. J. Urban Health 2011, 88, 356–369. [Google Scholar] [CrossRef] [PubMed]

| Variable + | Coefficient | IRR * | p-Value | Confidence Interval of IRR | |
|---|---|---|---|---|---|
| Season | Wet | (Ref) | |||
| Dry | 0.567 | 1.764 | 0.21 | 0.225–4.290 | |
| Year | 2011 | (Ref) | |||
| 2012 | 2.459 | 11.755 | <0.001 | 5.314–26.008 | |
| 2013 | 2.366 | 10.723 | <0.001 | 4.842–23.746 | |
| 2014 | 0.882 | 3.317 | 0.003 | 1.516–7.255 | |
| Ward | Adult In-Patient | (Ref) | |||
| Out-Patient | 2.419 | 11.238 | <0.001 | 6.634–19.037 | |
| Pediatric | 1.71 | 5.531 | <0.001 | 3.250–9.412 | |
| Average Temperature on Admission Date | Below 95th percentile | (Ref) | |||
| Above 95th percentile | 0.155 | 1.168 | 0.008 | 1.041–9.412 | |
| Season * Year | Wet 2011 | (Ref) | |||
| Wet 2012 | −0.474 | 0.622 | 0.445 | 0.184–2.104 | |
| Wet 2013 | −0.636 | 0.529 | 0.307 | 0.156–1.792 | |
| Wet 2014 | −1.386 | 0.25 | 0.018 | 0.079–0.788 |
| a. Wet and Dry Seasons by Year | ||||
| Year | Wet Season IRR * | Dry Season IRR * | p-Value | Confidence Interval |
| 2011 | REF | 1.763 | 0.205 | 0.733–4.242 |
| 2012 | REF | 1.097 | 0.825 | 0.482–2.499 |
| 2013 | REF | 1.069 | 0.873 | 0.410–2.133 |
| 2014 | REF | 0.501 | 0.874 | 0.377–2.134 |
| b. Hospital Admissions Association with Years by Season | ||||
| Season | Year | Year IRR * | p-Value | Confidence Interval |
| Wet | 2011 | (REF) | ||
| 2012 | 11.690 | <0.001 | 5.335–25.618 | |
| 2013 | 10.658 | <0.001 | 4.859–23.376 | |
| 2014 | 2.4152 | 0.030 | 1.090–5.354 | |
| Dry | 2011 | (REF) | ||
| 2012 | 7.274 | <0.001 | 2.573–14.201 | |
| 2013 | 5.651 | <0.001 | 2.297–14.155 | |
| 2014 | 1.278 | 0.606 | 0.503–3.249 | |
© 2018 by the authors. Licensee MDPI, Basel, Switzerland. This article is an open access article distributed under the terms and conditions of the Creative Commons Attribution (CC BY) license (http://creativecommons.org/licenses/by/4.0/).
Share and Cite
Bishop-Williams, K.E.; Berrang-Ford, L.; Sargeant, J.M.; Pearl, D.L.; Lwasa, S.; Namanya, D.B.; Edge, V.L.; Cunsolo, A.; IHACC Research Team; Bwindi Community Hospital; et al. Understanding Weather and Hospital Admissions Patterns to Inform Climate Change Adaptation Strategies in the Healthcare Sector in Uganda. Int. J. Environ. Res. Public Health 2018, 15, 2402. https://doi.org/10.3390/ijerph15112402
Bishop-Williams KE, Berrang-Ford L, Sargeant JM, Pearl DL, Lwasa S, Namanya DB, Edge VL, Cunsolo A, IHACC Research Team, Bwindi Community Hospital, et al. Understanding Weather and Hospital Admissions Patterns to Inform Climate Change Adaptation Strategies in the Healthcare Sector in Uganda. International Journal of Environmental Research and Public Health. 2018; 15(11):2402. https://doi.org/10.3390/ijerph15112402
Chicago/Turabian StyleBishop-Williams, Katherine E., Lea Berrang-Ford, Jan M. Sargeant, David L. Pearl, Shuaib Lwasa, Didacus Bambaiha Namanya, Victoria L. Edge, Ashlee Cunsolo, IHACC Research Team, Bwindi Community Hospital, and et al. 2018. "Understanding Weather and Hospital Admissions Patterns to Inform Climate Change Adaptation Strategies in the Healthcare Sector in Uganda" International Journal of Environmental Research and Public Health 15, no. 11: 2402. https://doi.org/10.3390/ijerph15112402