The Guatemalan Construction Industry: Approach of Knowledge Regarding Work Risks Prevention

 , ,
, ,
Abstract
:1. Introduction
2. Materials and Methods
2.1. Research Design
2.2. Questionnaire Development
- General Company Data: containing 8 variables (Table A1, see Appendix A).
- Prevention Activities and Health and Safety Management in the Company and on the worksite; containing 38 variables (Table A2, Table A3, Table A4 and Table A5, see Appendix A).
- Health and Safety in the Contractor Companies: containing 11 variables (Table A6, see Appendix A).
2.3. Sample
3. Results
3.1. Response Rate and Consistency
3.2. Descriptive Analysis
3.3. MCA
3.3.1. Reliability of the Multiple Correspondence Model
3.3.2. Discrimination Measures
3.3.3. Quantifications
3.3.4. Contribution of the Dimension to the Inertia of the Point for Each Variable
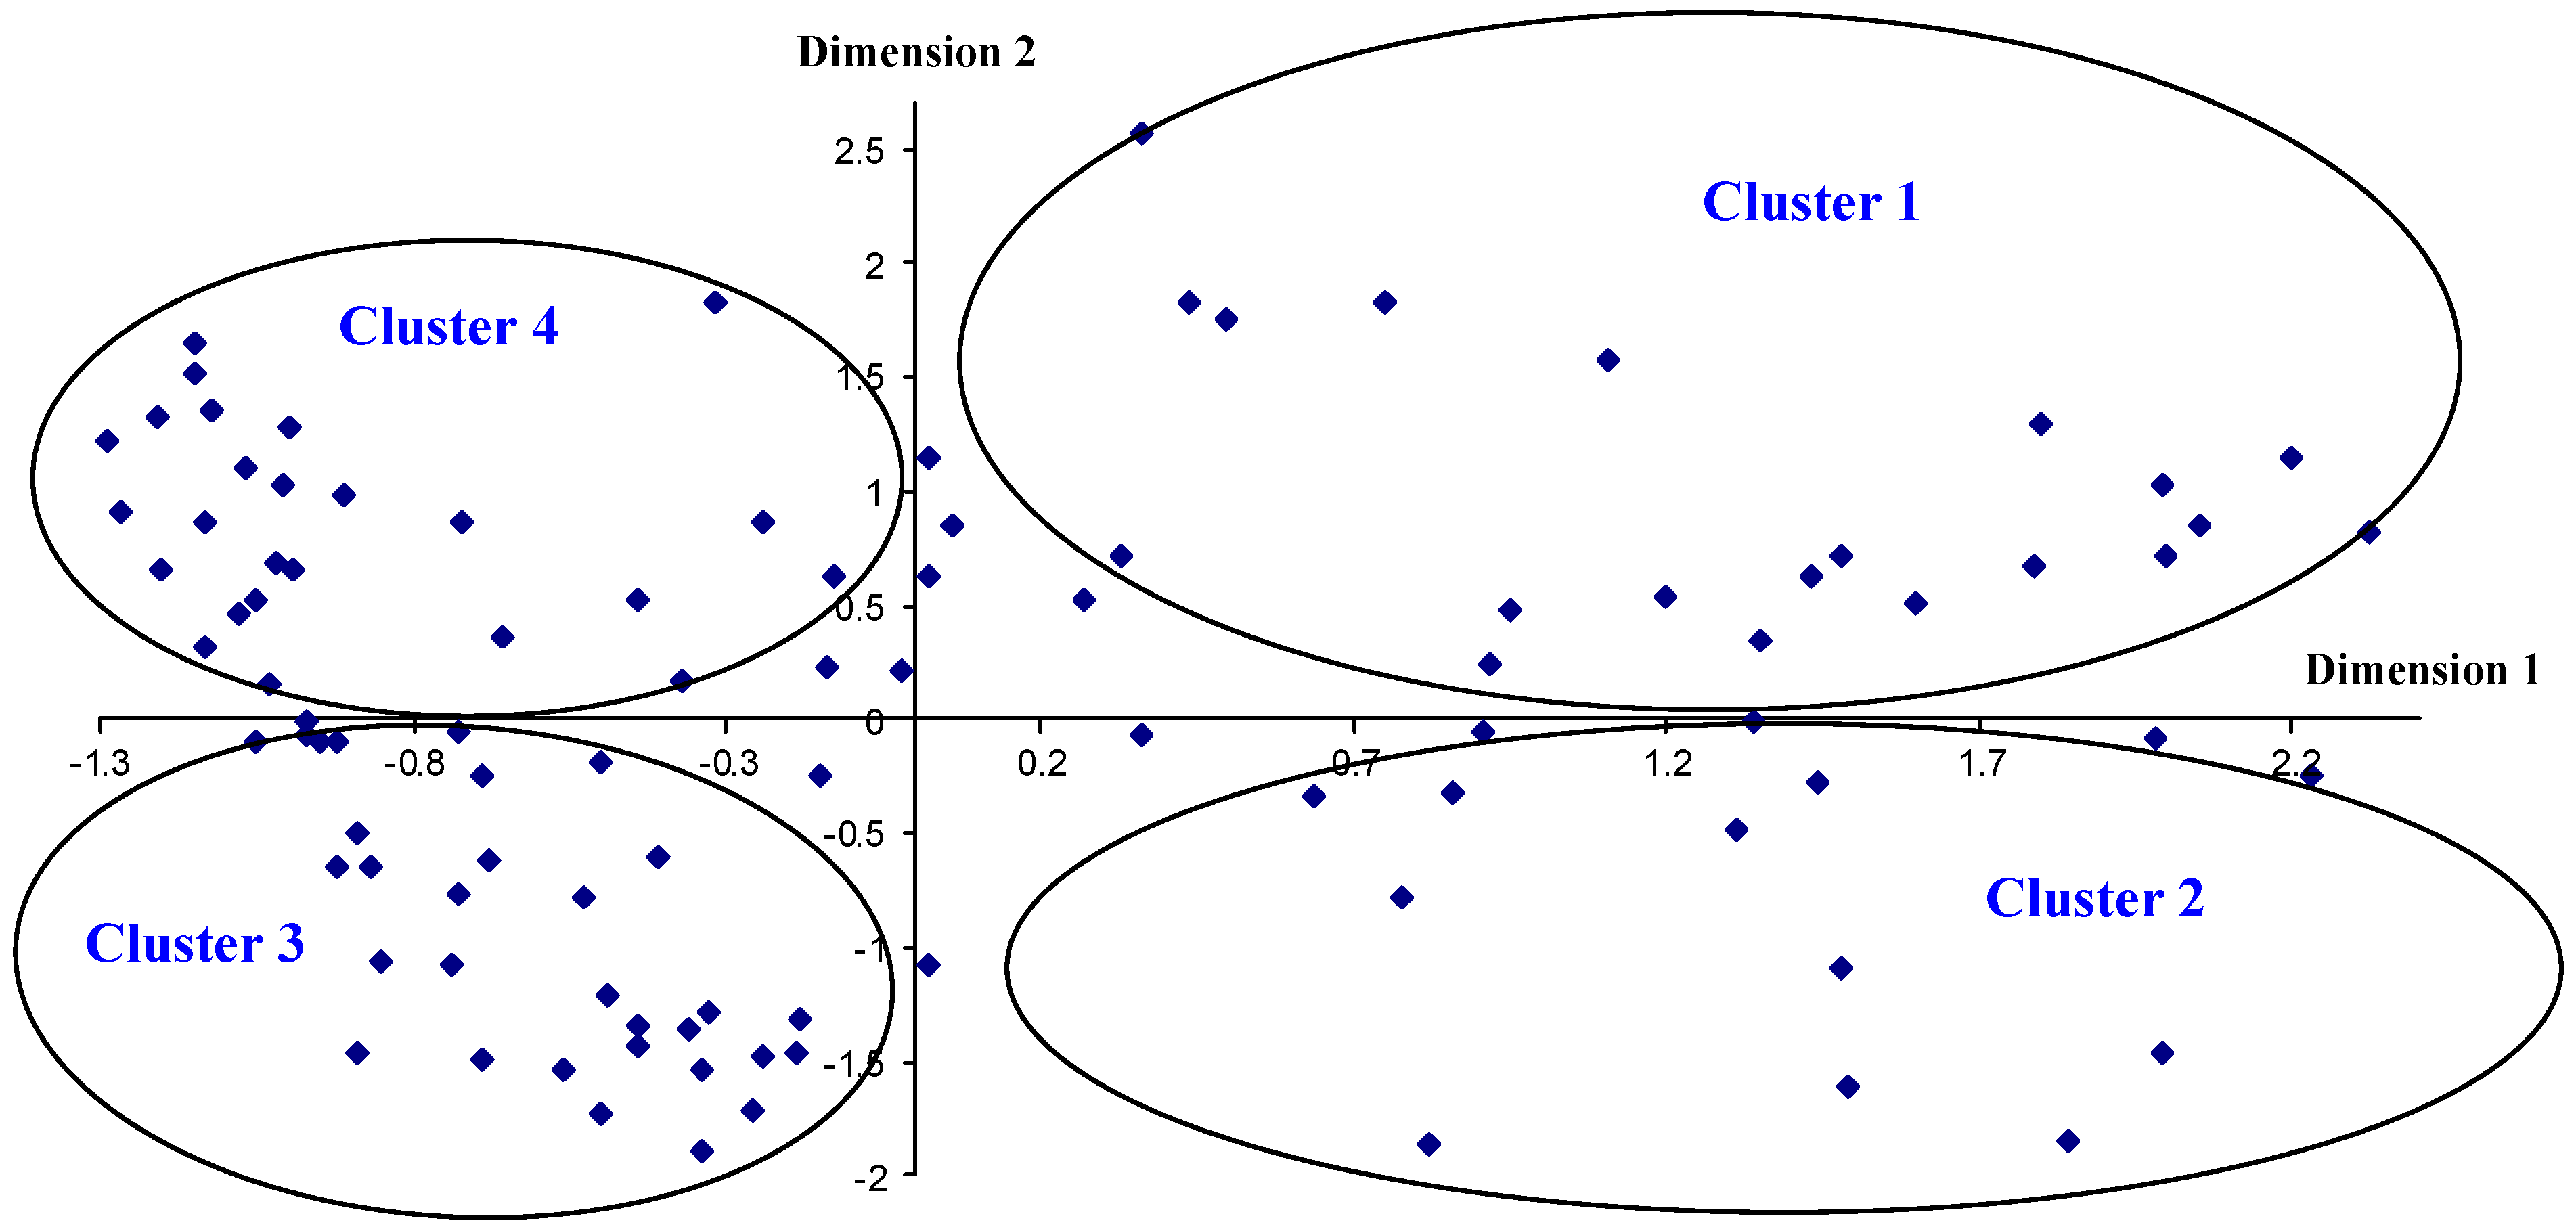
3.3.5. Object Scoring (Companies)
4. Discussion
4.1. Study Limitations
4.2. Descriptive Analysis of the Variables
4.2.1. Characterization of the General Company Variables
4.2.2. Characteristics of the Prevention Activities and Health and Safety Management in the Companies and on the Building Sites
4.2.3. Characteristics of the Health and Safety Activities That Contractors Take Part in on the Worksite
4.3. MCA
4.4. Recommendations
- Make a great effort to increase training in matters of safety and health prevention of their managers and workers, as well as the entrepreneurs themselves.
- Adopt as a priority, perform medical examinations to their workers, both when joining the company, and through their professional career in it.
- Implement a mandatory risk assessment in all phases of the construction works.
- Establish operating manuals for tools, equipment, and machinery, carrying out an inventory and providing training in their management.
- Provide work clothes that are better suited to the task developed by the worker.
- Communicate compulsorily the accidents suffered in the company with the periodicity established by the competent authority.
- Increase the use and compliance of Safety and Health Plans in the construction works.
- Promote the participation of safety and health coordinators in the design, planning and execution of the construction works.
- Complement the existing labor legislation for the construction industry, to ensure adequate prevention and risk management in these companies.
- Promote educational plans for all professionals involved in construction works that incorporate a minimum of mandatory training in safety and health.
- Promote economic aid and/or tax incentives to companies, so that they adopt appropriate safety and health practices, checking and certifying that they perform it.
5. Conclusions
Author Contributions
Funding
Acknowledgments
Conflicts of Interest
Appendix A

| Variable/Category Codes | Variables/Category of Variables | Frequency (%) |
|---|---|---|
| A | Construction activity | 100.0 |
| A1 | Only civil engineering | 11.0 |
| A2 | Only building construction | 13.0 |
| A3 | Only specialized construction | 2.0 |
| A4 | Civil engineering and building construction | 21.0 |
| A5 | Civil engineering and specialized construction | 1.0 |
| A6 | Construction of building and specialized construction | 0.0 |
| A7 | Civil engineering, building and specialized construction | 52.0 |
| B | Guatemalan departments where the work is carried out 1 | 100.0 |
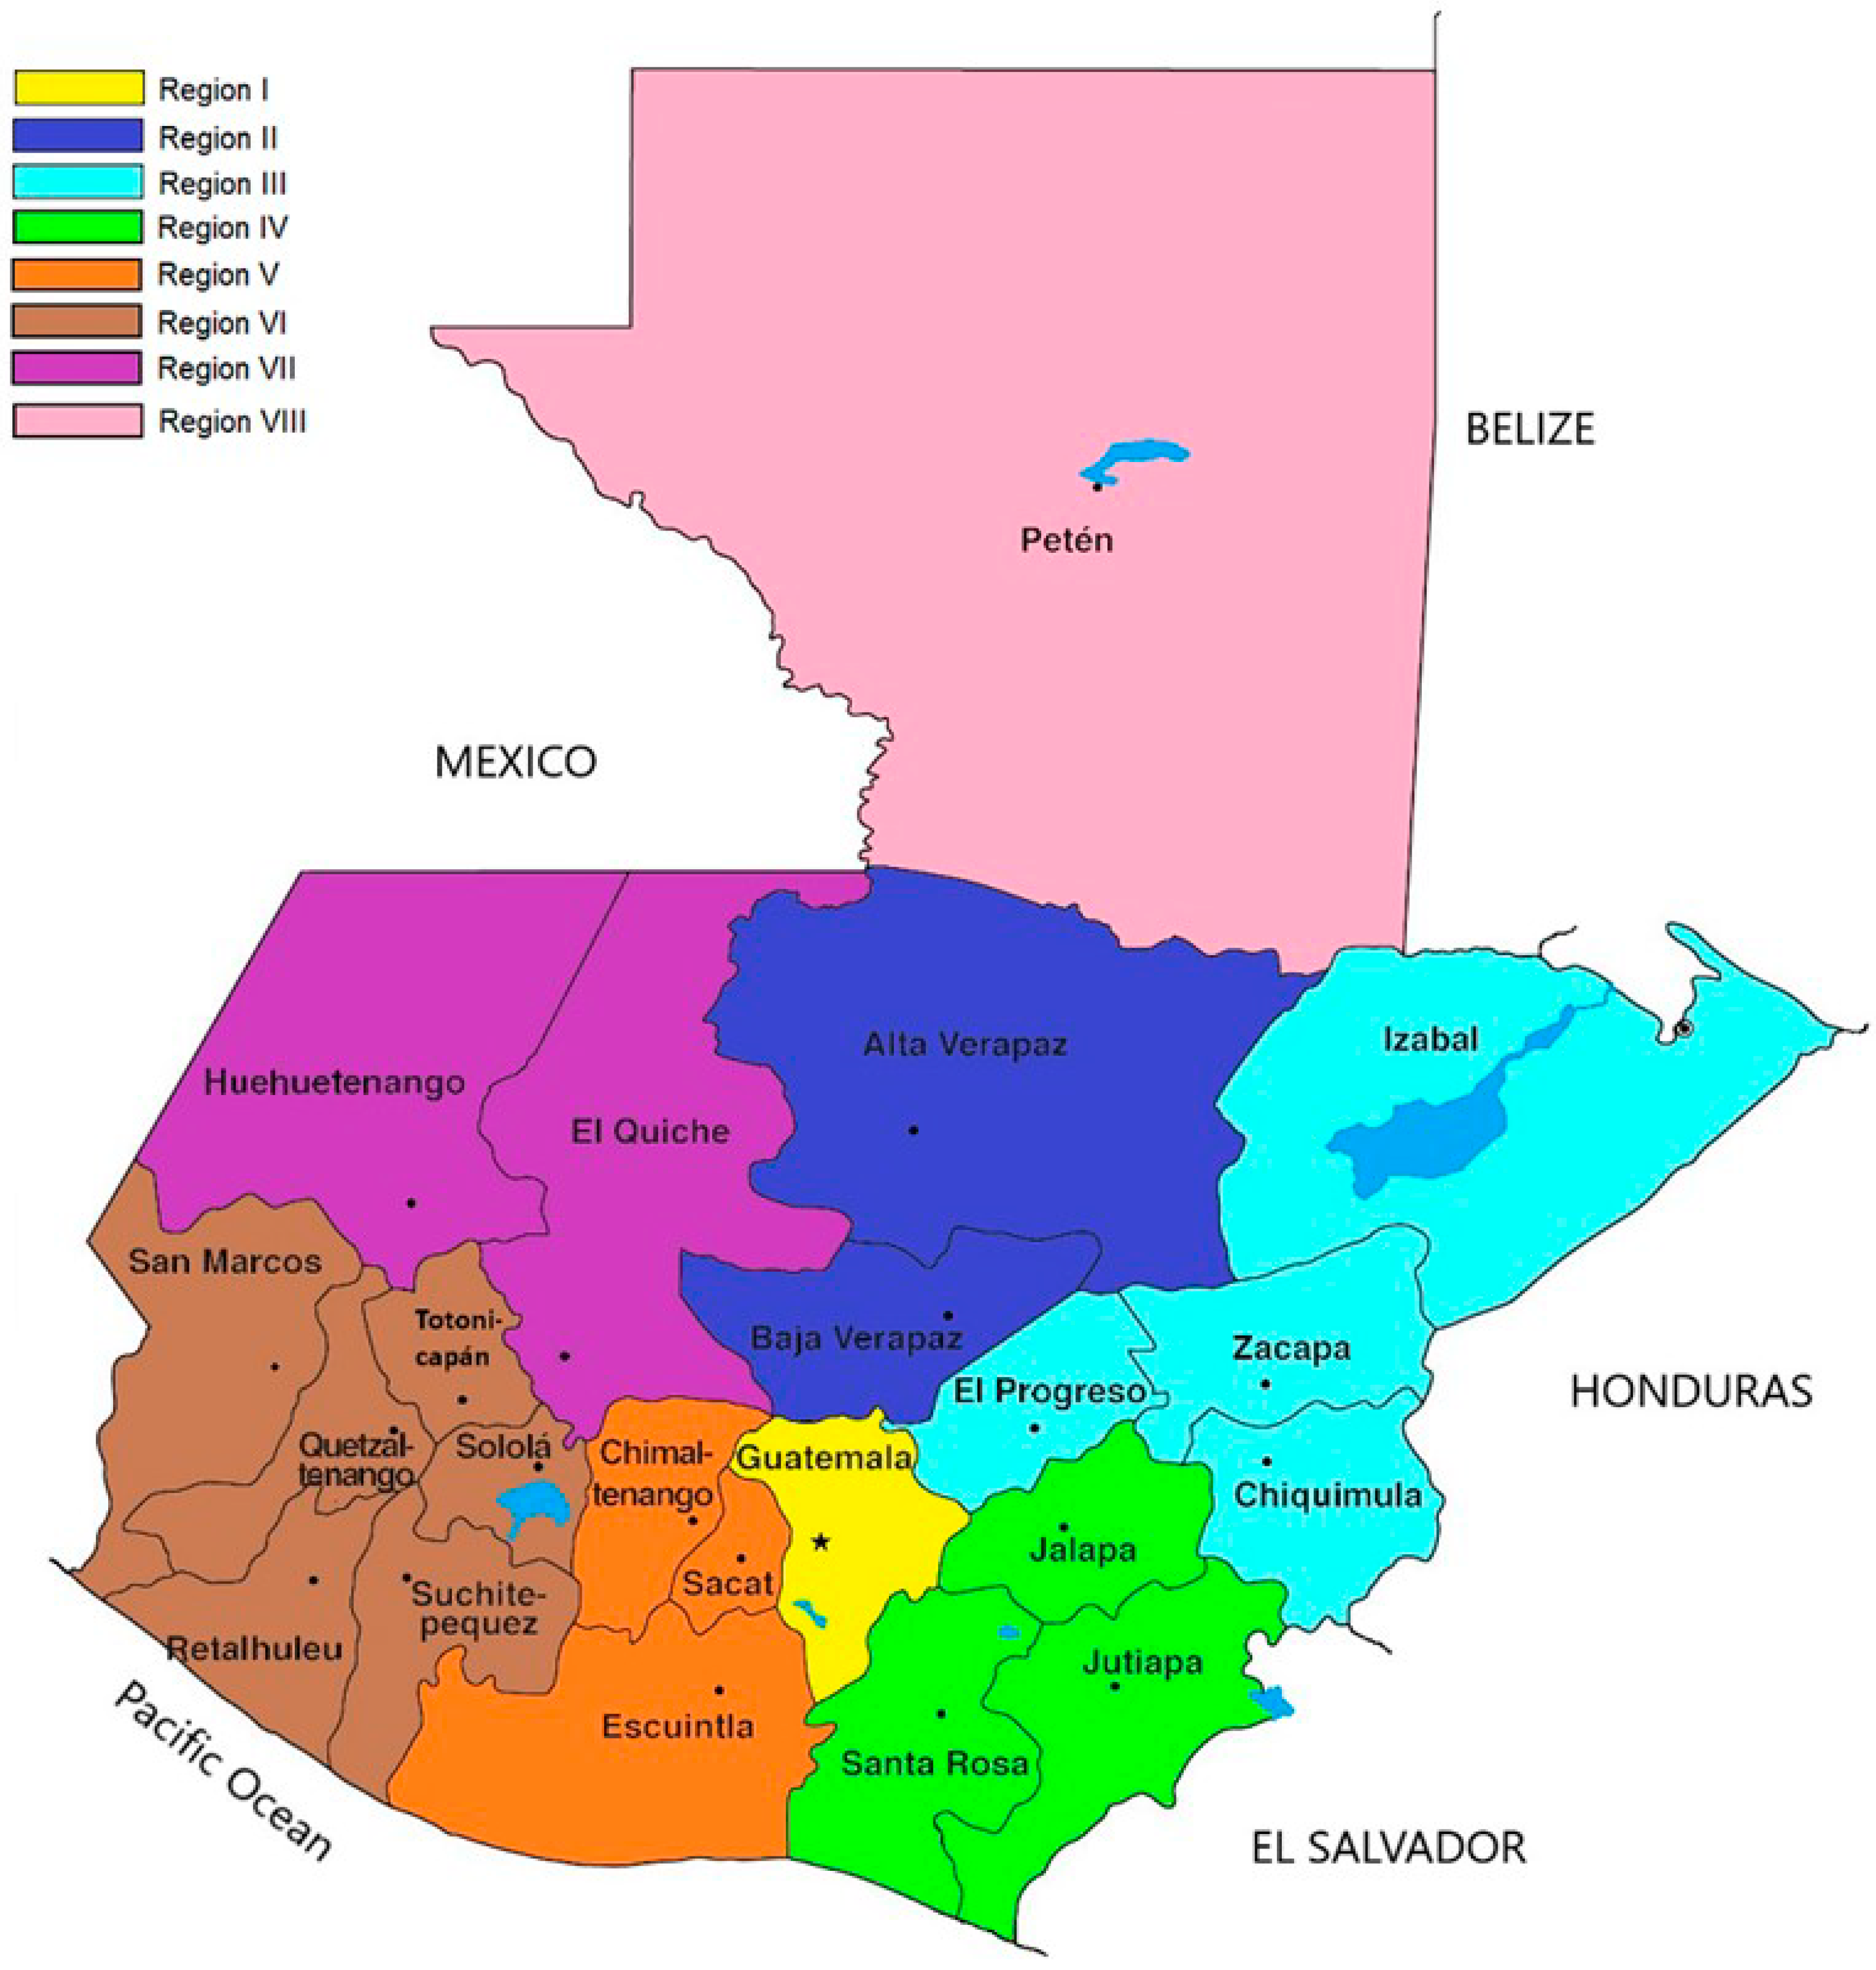
| B4 | Throughout the country | 26.0 |
| B9 | Quetzaltenango, San Marcos, Totonicapán, Suchitepéquez, Retalhuleu, Sololá, REGION VI | 8.0 |
| B13 | Guatemala REGION I, Sacatepéquez, Escuintla, Chimaltenango. REGION IV | 17.0 |
| B18 | Guatemala REGION I | 17.0 |
| C | Annual company turnover (€) | 87.0 |
| C1 | <100,000 | 17.2 |
| C2 | 100,001–300,000 | 21.8 |
| C3 | 300,001–500,000 | 23.0 |
| C4 | 500,001–700,000 | 12.6 |
| C4 | 700,001–1,000,000 | 11.5 |
| C6 | 1,000,001–2,000,000 | 8.0 |
| C7 | 2,000,001–10,000,000 | 4.6 |
| C8 | >10,000,000 | 1.1 |
| D | Number of office workers in the company | 98.0 |
| D1 | <6 | 61.2 |
| D2 | 6–10 | 30.6 |
| D3 | 11–20 | 6.1 |
| D4 | >20 | 2.1 |
| E | Number of on-site workers in the company | 97.0 |
| E1 | <11 | 11.3 |
| E2 | 11–50 | 39.2 |
| E3 | 51–100 | 17.5 |
| E4 | 101–150 | 13.4 |
| E5 | 151–200 | 11.3 |
| E6 | >200 | 7.2 |
| F | Number of work crews annually | 96.0 |
| F1 | <4 | 22.9 |
| F2 | 4–6 | 41.7 |
| F3 | 7–10 | 22.9 |
| F4 | 11–20 | 10.4 |
| F5 | >20 | 2.1 |
| G | Years working on site | 98.0 |
| G1 | 0–10 | 32.7 |
| G2 | 11–20 | 49.0 |
| G3 | 21–30 | 15.3 |
| G4 | 31–40 | 2.0 |
| G5 | >40 | 1.0 |
| H | Work on the job | 99.0 |
| H1 | Only as the developer | 2.0 |
| H2 | Only as the contractor | 47.5 |
| H3 | Only as the subcontractor | 2.0 |
| H4 | As developer and contractor | 7.1 |
| H5 | As developer and subcontractor | 0.0 |
| H6 | As contractor and subcontractor | 25.2 |
| H7 | As developer, contractor, and subcontractor | 16.2 |
| Variable/Category Codes | Variables/Category of Variables | Frequency (%) |
|---|---|---|
| I | Execute prevention plan before starting the job | 100.0 |
| I1 | Yes | 42.0 |
| I2 | No | 15.0 |
| I3 | Sometimes | 43.0 |
| J | Preventative measures adopted on site 1 | 100.0 |
| J1 | Only collective protection | 3.0 |
| J2 | Only personal protection | 19.0 |
| J5 | Collective and personal protection plus signaling | 28.0 |
| J6 | Personal protection, color coding plus signaling | 3.0 |
| J7 | Personal protection plus signaling | 28.0 |
| J8 | Collective and personal protection, color coding plus signaling | 14.0 |
| J11 | Collective protection and signaling | 1.0 |
| J12 | Personal protection and color coding | 2.0 |
| J13 | Collective and personal protection | 2.0 |
| K | Types of personal protection adopted on site 1 | 100.0 |
| K13 | Head, ear, eye, hand, nose, feet, and face protection as well as fall protection (harness) | 10.0 |
| K18 | Head, eye, hand, and feet protection as well as fall protection (harness) | 8.0 |
| K19 | Head, eye, ear, hand, nose, and feet protection as well as fall protection (harness) | 6.0 |
| K22 | Head, eye, ear, hand, nose, feet, face, and skin protection as well as fall protection (harness) | 7.0 |
| K29 | Head, ear, eye, hand, nose, feet, and face protection as well as fall protection (harness) | 25.0 |
| L | Training given to workers on health and safety | 99.0 |
| L1 | Yes | 42.4 |
| L2 | No | 4.0 |
| L3 | Sometimes | 53.6 |
| M | Medical assessments carried out on the workers | 97.0 |
| M1 | Yes | 12.4 |
| M2 | No | 72.2 |
| M3 | Sometimes | 15.4 |
| N | Modality of on-site safety and risk control 1 | 99.0 |
| N1 | Supervisor | 56.6 |
| N2 | Employer assumes responsibility for prevention | 6.1 |
| N3 | Supervisor and safety manager | 13.1 |
| N7 | No modality | 4.0 |
| N8 | Other modalities | 3.0 |
| N9 | Safety manager | 3.0 |
| N14 | Supervisor, safety manager, design group or commission and in-house permanent service | 3.0 |
| O | How often are on-site risks and safety verified | 100.0 |
| O1 | At the beginning | 22.0 |
| O2 | Daily | 11.0 |
| O3 | Weekly | 7.0 |
| O4 | At the end | 3.0 |
| O5 | Never | 7.0 |
| O6 | At the beginning and at the end | 19.0 |
| O7 | At the beginning and weekly | 11.0 |
| O8 | At the beginning and daily | 19.0 |
| O9 | At the beginning, weekly and at the end | 1.0 |
| P | When is the on-site risk assessment carried out | 100.0 |
| P1 | Before starting the work | 43.0 |
| P2 | Before starting and during the work | 22.0 |
| P3 | During and at the end of the work | 1.0 |
| P4 | During the work | 16.0 |
| P5 | Before starting, during and at the end of the work | 13.0 |
| P6 | Never | 3.0 |
| P7 | Before starting and at the end of the work | 1.0 |
| P8 | At the end | 1.0 |
| Variable/Category Codes | Variables/Category of Variables | Frequency (%) |
|---|---|---|
| Q | First-aid equipment available and personnel trained to use it | 100.0 |
| Q1 | Yes | 64.0 |
| Q2 | No | 6.0 |
| Q3 | Sometimes | 30.0 |
| R | A place is available on site to discard waste and rubbish | 100.0 |
| R1 | Yes | 51.0 |
| R2 | No | 7.0 |
| R3 | Sometimes | 42.0 |
| S | Frequency of general cleaning carried out on site | 91.0 |
| S1 | Daily | 54.9 |
| S2 | Once a week | 41.8 |
| S3 | On demand | 3.3 |
| T | Toilet facilities provided on site 1 | 70.0 |
| T1 | Toilet paper and bars of soap or soap powder | 40.0 |
| T2 | Bars of soap or soap powder | 8.6 |
| T5 | Toilet paper | 17.1 |
| T7 | Toilet paper, bars of soap or soap powder, and paper or cloth towels | 18.6 |
| T9 | Toilet paper, bars of soap or soap powder, paper or cloth towels, and sponge or brush for the skin | 7.1 |
| U | Toilets installed on site | 97.0 |
| U1 | Yes | 42.3 |
| U2 | No | 11.3 |
| U3 | Sometimes | 46.4 |
| V | Urinals installed on site | 94.0 |
| V1 | Yes | 30.9 |
| V2 | No | 40.4 |
| V3 | Sometimes | 28.7 |
| W | Emergency showers installed on site | 96.0 |
| W1 | Yes | 20.8 |
| W2 | No | 47.9 |
| W3 | Sometimes | 31.3 |
| X | Changing rooms installed on site | 95.0 |
| X1 | Yes | 26.3 |
| X2 | No | 42.1 |
| X3 | Sometimes | 31.6 |
| Y | Lunch area installed on site | 98.0 |
| Y1 | Yes | 21.5 |
| Y2 | No | 46.9 |
| Y3 | Sometimes | 31.6 |
| Z | Emergency routes installed on site | 99.0 |
| Z1 | Yes | 30.3 |
| Z2 | No | 35.4 |
| Z3 | Sometimes | 34.3 |
| ZZ | Zones designated specifically for unloading on site | 100.0 |
| ZZ1 | Yes | 40.0 |
| ZZ2 | No | 17.0 |
| ZZ3 | Sometimes | 43.0 |
| Variable/Category Codes | Variables/Category of Variables | Frequency (%) |
|---|---|---|
| AA | A tool and equipment operating manual exists | 100.0 |
| AA1 | Yes | 18.0 |
| AA2 | No | 24.0 |
| AA3 | Some | 58.0 |
| BB | A tool and equipment inventory exists | 100.0 |
| BB1 | Yes | 45.0 |
| BB2 | No | 20.0 |
| BB3 | Sometimes | 35.0 |
| CC | Tool and equipment-handling training is given | 100.0 |
| CC1 | Yes | 31.0 |
| CC2 | No | 23.0 |
| CC3 | Sometimes | 46.0 |
| DD | The loading and unloading of provided equipment is controlled with a card | 99.0 |
| DD1 | Yes | 34.3 |
| DD2 | No | 35.4 |
| DD3 | Sometimes | 30.3 |
| EE | A machinery operating manual exists | 99.0 |
| EE1 | Yes | 22.2 |
| EE2 | No | 13.1 |
| EE3 | Some | 64.7 |
| FF | Machinery operation training is given | 99.0 |
| FF1 | Yes | 39.4 |
| FF2 | No | 13.1 |
| FF3 | Sometimes | 47.5 |
| GG | Some entity exists that makes the control of on-site risks obligatory | 100.0 |
| GG1 | Yes | 28.0 |
| GG2 | No | 28.0 |
| GG3 | Sometimes | 44.0 |
| HH | Which entity obliges the control of on-site risks | 61.0 |
| HH1 | Contractor or developer | 59.0 |
| HH2 | The Social Security Institute and the Ministry of Work | 1.6 |
| HH3 | Contractor or developer and the Ministry of Work | 1.6 |
| HH4 | Contractor or developer and the Ministry of Work and the local authority | 6.6 |
| HH5 | The Social Security Institute | 8.2 |
| HH6 | The Ministry of Work and the local authority | 3.3 |
| HH7 | The Ministry of Work | 18.1 |
| HH8 | Contractor or developer and the Social Security Institute | 1.6 |
| II | Safety networks located on site | 100.0 |
| II1 | Yes | 25.0 |
| II2 | No | 40.0 |
| II3 | Sometimes | 35.0 |
| JJ | Lighting is considered on site | 99.0 |
| JJ1 | Yes | 37.4 |
| JJ2 | No | 10.1 |
| JJ3 | Sometimes | 52.5 |
| KK | Ventilation is considered on site | 99.0 |
| KK1 | Yes | 24.2 |
| KK2 | No | 56.6 |
| KK3 | Sometimes | 19.2 |
| LL | Protection against noise is considered on site | 98.0 |
| LL1 | Yes | 16.3 |
| LL2 | No | 58.2 |
| LL3 | Sometimes | 25.5 |
| Variable/Category Codes | Variables/Category of Variables | Frequency (%) |
|---|---|---|
| MM | Electric cable protection is installed on site | 96.0 |
| MM1 | Yes | 41.7 |
| MM2 | No | 20.8 |
| MM3 | Sometimes | 37.5 |
| NN | Types of clothing worn by personnel on site | 100.0 |
| NN1 | T-shirt | 2.0 |
| NN2 | Hi-viz jacket | 14.0 |
| NN3 | No specific work clothes | 1.0 |
| NN4 | Others (uniform or canvas trousers) | 4.0 |
| NN5 | T-shirt and Hi-viz jacket | 37.0 |
| NN6 | T-shirt and others (Uniform or canvas trousers) | 12.0 |
| NN7 | T-shirt and Hi-viz jacket and others (uniform or canvas trousers) | 16.0 |
| NN8 | T-shirt, Hi-viz jacket, work smock and others (uniform or canvas trousers) | 6.0 |
| NN9 | Hi-viz jacket and others (uniform or canvas trousers) | 3.0 |
| NN10 | Hi-viz jacket and work smock | 2.0 |
| NN11 | T-shirt, Hi-viz jacket and work smock | 2.0 |
| NN12 | Hi-viz jacket, work smock and others (uniform or canvas trousers) | 1.0 |
| OO | An action protocol is available in the case of an on-site accident | 100.0 |
| OO1 | Yes | 92.0 |
| OO2 | No | 8.0 |
| PP | Where an on-site accident victim is treated 1 | 93.0 |
| PP3 | The nearest Social Security Institute | 6.5 |
| PP7 | The nearest infirmary, health center, public hospital, Social Security Institute, or private hospital/clinic | 25.8 |
| PP8 | The nearest infirmary, health center, public hospital, or Social Security Institute | 7.5 |
| PP13 | The nearest infirmary, public hospital, or Social Security Institute | 9.7 |
| PP14 | The nearest health center, public hospital or Social Security Institute, or a private hospital/clinic | 5.4 |
| Any entity contacted following accidents suffered on site | 97.0 | |
| QQ1 | Yes | 13.4 |
| QQ2 | No | 42.3 |
| QQ3 | Sometimes | 44.3 |
| RR | Entity or organization contacted after an accident has occurred | 49.0 |
| RR1 | Contractor or developer | 71.4 |
| RR3 | Others | 4.1 |
| RR4 | Contractor or developer and the Ministry of Work | 12.2 |
| RR5 | Contractor, developer, and the Guatemalan Social Security Institute | 6.1 |
| RR6 | The Guatemalan Social Security Institute | 2.1 |
| RR7 | The Ministry of Work | 4.1 |
| EEE | Company awareness of the risk of suffering on-site accidents | 100.0 |
| EEE1 | Low awareness of accident risk | 63.0 |
| EEE2 | Medium awareness of accident risk | 33.0 |
| EEE3 | High awareness of accident risk | 4.0 |
| Variable/Category Codes | Variables/Category of Variables | Frequency (%) |
|---|---|---|
| SS | A Health and Safety Plan is prepared for the jobs carried out | 82.0 |
| SS1 | Yes | 13.4 |
| SS2 | No | 34.2 |
| SS3 | Sometimes | 52.4 |
| TT | What the Health and Safety Plan is based upon 1 | 57.0 |
| TT1 | A Health and Safety Study | 12.3 |
| TT2 | A risk assessment is only requested from the subcontractor | 3.5 |
| TT3 | Prior meetings with the subcontractor | 38.6 |
| TT4 | Others | 26.3 |
| TT5 | On nothing | 3.5 |
| TT6 | A Health and Safety Study and prior meetings with the subcontractor | 5.2 |
| TT8 | A risk assessment is requested from the subcontractor and prior meetings are held with them | 1.8 |
| TT9 | A Health and Safety Study, a risk assessment requested from the subcontractor and prior meetings are held with them | 7.0 |
| TT10 | A Health and Safety Study, a risk assessment requested from the subcontractor and prior meetings are held with them, and others | 1.8 |
| UU | The stipulations of the Health and Safety Plan are complied with on site | 74.0 |
| UU1 | Always | 20.3 |
| UU2 | Partially | 62.1 |
| UU3 | Never | 17.6 |
| VV | Copies of the Health and Safety Plan are sent to the subcontractors | 74.0 |
| VV1 | Yes | 14.9 |
| VV2 | No | 41.9 |
| VV3 | Sometimes | 43.2 |
| WW | Conoce al Coordinador de Seguridad y Salud de la obra | 76.0 |
| WW1 | Yes | 42.1 |
| WW2 | No | 57.9 |
| XX | The on-site Health and Safety Coordinator is known 1 | 38.0 |
| XX1 | Not known | 7.9 |
| XX2 | Once a month | 5.3 |
| XX3 | Once a fortnight | 15.8 |
| XX4 | One or two days a week | 21.1 |
| YY | The developer evaluated the health and safety measures that the contractor company would undertake when awarding the work. | 74.0 |
| YY1 | Yes | 16.2 |
| YY2 | No | 29.7 |
| YY3 | Sometimes | 54.1 |
| AAA | Safety meetings were held with the subcontractors to disclose the progress and incidents of on-site safety conditions | 79.0 |
| AAA1 | Yes | 15.2 |
| AAA2 | No | 46.8 |
| AAA3 | Sometimes | 38.0 |
| BBB | Who paid the Health and Safety Coordinator’s fees | 49.0 |
| BBB1 | Contractor | 44.9 |
| BBB2 | Developer | 32.7 |
| BBB4 | Contractor and developer | 22.4 |
| CCC | Do you consider that the creation of a Classification of Contractor Companies, based on criteria of quality and management of workplace risk prevention would contribute favorably to improving safety conditions on the worksite? | 81.0 |
| CCC1 | Yes | 51.8 |
| CCC2 | No | 2.5 |
| CCC3 | Probably | 45.7 |
| DDD | When you subcontract a worksite activity, do you evaluate the subcontractor based on their levels of safety? | 80.0 |
| DDD1 | Yes | 10.0 |
| DDD2 | No | 42.5 |
| DDD3 | Sometimes | 47.5 |
| Variables | Dimension | Mean | |
|---|---|---|---|
| 1 | 2 | ||
| A | 0.143 | 0.155 | 0.149 |
| B | 0.382 | 0.264 | 0.323 |
| C | 0.357 | 0.487 | 0.422 |
| D | 0.157 | 0.330 | 0.244 |
| E | 0.182 | 0.639 | 0.411 |
| F | 0.162 | 0.596 | 0.379 |
| G | 0.167 | 0.144 | 0.156 |
| H | 0.342 | 0.065 | 0.203 |
| I | 0.398 | 0.116 | 0.257 |
| J | 0.398 | 0.337 | 0.368 |
| K | 0.594 | 0.365 | 0.480 |
| L | 0.610 | 0.021 | 0.316 |
| M | 0.621 | 0.123 | 0.372 |
| N | 0.423 | 0.271 | 0.347 |
| O | 0.399 | 0.308 | 0.354 |
| P | 0.135 | 0.334 | 0.234 |
| Q | 0.098 | 0.138 | 0.118 |
| R | 0.333 | 0.099 | 0.216 |
| S | 0.113 | 0.121 | 0.117 |
| T | 0.365 | 0.332 | 0.349 |
| U | 0.665 | 0.162 | 0.413 |
| V | 0.717 | 0.329 | 0.523 |
| W | 0.574 | 0.195 | 0.384 |
| X | 0.658 | 0.183 | 0.420 |
| Y | 0.620 | 0.434 | 0.527 |
| Z | 0.673 | 0.382 | 0.528 |
| ZZ | 0.695 | 0.213 | 0.454 |
| AA | 0.492 | 0.375 | 0.434 |
| BB | 0.558 | 0.264 | 0.411 |
| CC | 0.523 | 0.247 | 0.385 |
| DD | 0.276 | 0.198 | 0.237 |
| EE | 0.480 | 0.157 | 0.318 |
| FF | 0.196 | 0.214 | 0.205 |
| GG | 0.568 | 0.369 | 0.469 |
| HH | 0.176 | 0.256 | 0.216 |
| II | 0.721 | 0.114 | 0.418 |
| JJ | 0.524 | 0.100 | 0.312 |
| KK | 0.728 | 0.143 | 0.436 |
| LL | 0.623 | 0.073 | 0.348 |
| MM | 0.232 | 0.216 | 0.224 |
| NN | 0.427 | 0.304 | 0.366 |
| OO | 0.005 | 0.043 | 0.024 |
| PP | 0.511 | 0.446 | 0.478 |
| 0.437 | 0.194 | 0.315 | |
| RR | 0.187 | 0.146 | 0.166 |
| EEE | 0.043 | 0.018 | 0.030 |
| SS | 0.409 | 0.334 | 0.372 |
| TT | 0.130 | 0.579 | 0.355 |
| UU | 0.277 | 0.304 | 0.291 |
| VV | 0.339 | 0.305 | 0.322 |
| WW | 0.516 | 0.358 | 0.437 |
| XX | 0.115 | 0.364 | 0.239 |
| YY | 0.328 | 0.366 | 0.347 |
| AAA | 0.805 | 0.451 | 0.628 |
| BBB | 0.050 | 0.253 | 0.151 |
| CCC | 0.178 | 0.141 | 0.160 |
| DDD | 0.284 | 0.285 | 0.284 |
| Active Total | 22.122 | 14.765 | 18.443 |
References
- Cheng, C.W.; Leu, S.S.; Lin, C.C.; Chihhao, F. Characteristic analysis of occupational accidents at small construction enterprises. Saf. Sci. 2010, 48, 698–707. [Google Scholar] [CrossRef]
- Martínez-Aires, M.D.; Rubio Gámez, M.C.; Gibb, A. Prevention through design: The effect of European Directives on construction workplace accidents. Saf. Sci. 2010, 48, 248–258. [Google Scholar] [CrossRef] [Green Version]
- Chia-Wen, L.; Tsung-Lung, C. Reducing occupational injuries attributed to in attentional blindness in the construction industry. Saf. Sci. 2016, 89, 129–137. [Google Scholar] [CrossRef]
- Raheem, A.A.; Issa, R.R.A. Safety implementation framework for Pakistani construction industry. Saf. Sci. 2016, 82, 301–314. [Google Scholar] [CrossRef]
- Reis, C.M.; Machado, T.L.; Mieiro, M.A.A.; Oliveira, C. Safety coordinator specific on a road construction. Occup. Saf. Hyg. 2016, IV, 519–522. [Google Scholar]
- Katarzyna, M.; Bartosz, M. Methodology of improving occupational safety in the construction industry on the basis of the TWI program. Saf. Sci. 2017, 92, 225–231. [Google Scholar] [CrossRef]
- Yuan, J.; Yi, W.; Miao, M.; Zhang, L. Evaluating the impacts of health, social network and capital on craft efficiency and productivity: A case study of construction workers in China. Int. J. Environ. Res. Public Health 2018, 15, 345. [Google Scholar] [CrossRef] [PubMed]
- López-Alonso, M.; Ibarrondo-Dávila, M.P.; Rubio-Gámez, M.C.; Muñoz, T.G. The impact of health and safety investment on construction company costs. Saf. Sci. 2013, 60, 151–159. [Google Scholar] [CrossRef]
- Feng, Y.; Teo, E.A.L.; Ling, F.Y.Y.; Low, S.P. Exploring the interactive effects of safety investments, safety culture and project hazard on safety performance: An empirical analysis. Int. J. Proj. Manag. 2014, 32, 932–943. [Google Scholar] [CrossRef]
- Feng, Y.; Zhang, S.; Wu, P. Factors influencing workplace accident costs of building projects. Saf. Sci. 2015, 72, 97–104. [Google Scholar] [CrossRef]
- Ibarrondo-Dávila, M.P.; López-Alonso, M.; Rubio-Gámez, M.C. Managerial accounting for safety management. The case of a Spanish construction company. Saf. Sci. 2015, 79, 116–125. [Google Scholar] [CrossRef]
- Lopez-Valcarcel, A. Occupational safety and health in the construction work. Afr. Newsl. Occup. Health Saf. 2001, 11, 61–63. [Google Scholar]
- Tadesse, S.; Israel, D. Occupational injuries among building construction workers in Addis Ababa, Ethiopia. J. Occup. Med. Toxicol. 2016, 11, 16. [Google Scholar] [CrossRef] [PubMed]
- Sousa, V.; Almeida, N.M.; Dias, L.A. Risk-based management of occupational safety and health in the construction industry—Part 1: Background knowledge. Saf. Sci. 2014, 66, 75–86. [Google Scholar] [CrossRef]
- Hinze, J.; Wiegand, F. Role of designers in construction worker safety. J. Constr. Eng. Manag. 1992, 118, 677–684. [Google Scholar] [CrossRef]
- Arévalo, C. Integración de la prevención en el diseño de las obras de construcción: Relación con la siniestralidad laboral, análisis de su regulación normativa, bases conceptuales y desarrollo internacional. Inf. Constr. 2013, 65, 325–334. [Google Scholar] [CrossRef]
- Gillen, M.; Kools, S.; Sum, J.; McCall, C.; Moulden, K. Construction workers’ perceptions of management safety practices: A qualitative investigation. Work 2004, 23, 245–256. [Google Scholar] [PubMed]
- Alli, B.O. Fundamental Principles of Occupational Health and Safety; International Labour Organization (ILO): Geneva, Switzerland, 2001. [Google Scholar]
- Kim, S.C.; Ro, Y.S.; Shin, S.D.; Kim, J.Y. Preventive effects of safety kelmets on traumatic brain injury after work-related falls. Int. J. Environ. Res. Public Health 2016, 13, 1063. [Google Scholar] [CrossRef] [PubMed]
- Liang, H.; Lin, K.-Y.; Zhang, S.; Su, Y. The impact of coworkers’ safety violations on an individual worker: A social contagion effect within the construction crew. Int. J. Environ. Res. Public Health 2018, 15, 773. [Google Scholar] [CrossRef] [PubMed]
- Zack, M. The Safety Manager’s Guide to Personal Protective Equipment. Occup. Hazards 2013, 126, 19. [Google Scholar]
- Ulang, N.M.; Salim, N.S.; Baharum, F.; Agus Salim, N.A. Construction Site Workers’ Awareness on Using Safety Equipment: Case Study. In Proceedings of the Building Surveying, Facilities Management and Engineering Conference (BSFMEC 2014), MATEC Web of Conferences Volume 15, Perak, Malaysia, 27 August 2014; Othuman Mydin, M.A., Ed.; EDP Sciences: Les Ulis, France, 2014. Art 01023. [Google Scholar]
- Vinodkumar, M.N.; Bhasi, M. Safety management practices and safety behaviour: Assessing the mediating role of safety knowledge and motivation. Accid. Anal. Prev. 2010, 42, 2082–2093. [Google Scholar] [CrossRef] [PubMed]
- Bridi, M.E.; Pellicer, E.; Fabro, F.; Viguer, M.E.; Echeveste, M.E.S.; Formoso, C.T. IdentificaÇão de práticas de gestão da SST em obras de construÇão civil. Ambiente Construído 2013, 13, 43–58. [Google Scholar] [CrossRef]
- Alarcón, L.F.; Acuña, D.; Diethelm, S.; Pellicer, E. Strategies for improving safety performance in construction firms. Accid. Anal. Prev. 2016, 94, 107–118. [Google Scholar] [CrossRef] [PubMed]
- Tam, C.M.; Zeng, S.X.; Deng, Z.M. Identifying elements of poor construction safety in China. Saf. Sci. 2004, 42, 569–586. [Google Scholar] [CrossRef]
- Goh, K.C.; Goh, H.H.; Goh, H.H.; Omar, M.F.; Toh, T.C.; Zin, A.A.M. Accidents Preventive Practice for High-Rise Construction. In Proceedings of the 3rd International Conference on Civil and Environmental Engineering for Sustainability (IConCEES 2015), MATEC Web of Conferences Volume 47, Melaka, Malaysia, 1–2 December 2015; Rahman, N.A., Jaini, Z.M., Yunus, R., Rahmat, S.N., Eds.; EDP Sciences: Les Ulis, France, 2016. Art 04004. [Google Scholar] [CrossRef]
- Haslam, R.A.; Hide, S.A.; Gibb, A.G.F. Contributing factors in construction accidents. Appl. Ergon. 2005, 36, 401–415. [Google Scholar] [CrossRef] [PubMed] [Green Version]
- Carrillo-Castrillo, J.A.; Trillo-Cabello, A.F.; Rubio-Romero, J.C. Construction accidents: Identification of the main associations between causes, mechanisms and stages of the construction process. Int. J. Occup. Saf. Ergon. 2017, 23, 240–250. [Google Scholar] [CrossRef] [PubMed]
- Zeng, S.X.; Tam, V.W.Y.; Tam, C.M. Towards occupational health and safety systems in the construction industry of China. Saf. Sci. 2008, 46, 1155–1168. [Google Scholar] [CrossRef]
- ILO. Safety and Health in Building and Civil Engineering Work; International Labor Office (ILO): Geneva, Switzerland, 1985. [Google Scholar]
- Weinstein, W.; Gambatese, J.; Hecker, S. Can design improve construction safety? Assessing the impact of a collaborative safety-in-design process. J. Constr. Eng. Manag. ASCE 2005, 131, 1125–1134. [Google Scholar] [CrossRef]
- López-Arquillos, A.; Rubio-Romero, J.C.; Martínez-Aires, M.D. Prevention through Design (PtD). The importance of the concept in Engineering and Architecture university courses. Saf. Sci. 2015, 73, 8–14. [Google Scholar] [CrossRef]
- Gambatese, J.; Behm, M.; Rajendran, S. Design’s role in construction accident causality and prevention: Perspectives from an expert panel. Saf. Sci. 2008, 46, 675–691. [Google Scholar] [CrossRef]
- Toole, T.M.; Gambatese, J. The trajectories of construction prevention through design. J. Saf. Res. 2008, 39, 225–230. [Google Scholar] [CrossRef] [PubMed]
- Saunders, L.W.; Kleiner, B.M.; McCoy, A.P.; Ellis, K.P.; Smith-Jackson, T.; Wernz, C. Developing an inter-organizational safety climate instrument for the construction industry. Saf. Sci. 2017, 98, 17–24. [Google Scholar] [CrossRef]
- Teo, A.L.E.; Ofori, G.; Tjandra, I.K.; Kim, H. Design for safety: Theoretical framework of the safety aspect of BIM system to determine the safety index. Constr. Econ. Build. 2016, 16, 1–18. [Google Scholar] [CrossRef]
- Alomari, K.; Gambatese, J.; Anderson, J. Opportunities for using Building Information Modeling to improve worker safety performance. Safety 2017, 3, 7. [Google Scholar] [CrossRef]
- Martínez-Aires, M.D.; López-Alonso, M.; Martínez-Rojas, M. Building information modeling and safety management: A systematic review. Saf. Sci. 2018, 101, 11–18. [Google Scholar] [CrossRef]
- ILO-OSH 2001. The Guidelines on Occupational Safety and Health Management System. ILO–OSH 2001; International Labor Office (ILO): Geneva, Switzerland, 2001. [Google Scholar]
- BS-OHSAS 18001. Occupational Health and Safety Management (OHS); British Standars Institution (BSI): London, UK, 1999. [Google Scholar]
- ISO 45001. Occupational Health and Safety Management Systems—Requirements with Guidance for Use; International Organization for Standardization (ISO): Geneva, Switzerland, 2018. [Google Scholar]
- MINTRAB (Ministerio de Trabajo y Asistencia Social de Guatemala). Reglamento General sobre Higiene y Seguridad en el trabajo. Available online: http://www.mintrabajo.gob.gt/images/organizacion/leyesconveniosyacuerdos/Leyes_Ordinarias/ACUERDO_GUBERNATIVO_229-2014.pdf (accessed on 5 June 2018).
- Consejo Nacional de Salud y Seguridad Ocupacional: Guatemala. Perfil Diagnóstico Nacional sobre Condiciones de Trabajo, Salud y Seguridad Ocupacional. Available online: https://www.ilo.org/wcmsp5/groups/public/@ed_protect/@protrav/@safework/documents/policy/wcms_187681.pdf (accessed on 8 October 2018).
- BE (Boletín Estadístico). Prestaciones en salud año 2016. In Boletín Estadístico 2016; Departamento Actuarial y Estadístico del Instituto Guatemalteco de Seguridad Social: Guatemala, 2016. [Google Scholar]
- Dong, X. Long work hours, work scheduling and work-related injuries among construction workers in the United States. Scand. J. Work Environ. Health 2005, 31, 329–335. [Google Scholar] [CrossRef] [PubMed]
- Calderón-Gálvez, C.G. Análisis de modelos de gestión de seguridad y salud en las PYMES del sector de la construcción. Ph.D. Thesis, University of Granada, Granada, Spain, 2006. [Google Scholar]
- Pérez-Alonso, J.; Carreño-Ortega, A.; Callejón-Ferre, A.J.; Vázquez-Cabrera, F.J. Preventive activity in the greenhouse-construction industry of south-eastern Spain. Saf. Sci. 2011, 49, 345–354. [Google Scholar] [CrossRef]
- INE. Clasificación de empresas constructoras por tamaño en base al Acuerdo Gubernativo 211-2015 del Ministerio de Economía. In Directorio Nacional Estadístico de Empresas; Instituto Nacional de Estadística: Guatemala.
- Chen, L.; Mohamed, S. The strategic importance of tacit knowledge management activities in construction. Constr. Innov. 2009, 10, 138–163. [Google Scholar] [CrossRef]
- Chia-Fen, C.; Tin-Chang, C.; Hsin-I, T. Accident patterns and prevention measures for fatal occupational falls in the construction industry. Appl. Ergon. 2005, 36, 391–400. [Google Scholar] [CrossRef] [PubMed]
- Fabiano, B.; Curro, F.; Pastorino, R. A study of the relationship between occupational injuries and firm size and type in the Italian industry. Saf. Sci. 2004, 42, 587–600. [Google Scholar] [CrossRef]
- Sorensen, O.H.; Hasle, P.; Bach, E. Working in small enterprises—Is there a special risk? Saf. Sci. 2007, 45, 1044–1059. [Google Scholar] [CrossRef]
- Hasle, P.; Kines, P.; Andersen, L. Small enterprise owner’s accident causation attribution and prevention. Saf. Sci. 2008, 47, 9–19. [Google Scholar] [CrossRef]
- Beaver, G. Management and the small firm. Strateg. Chang. 2003, 12, 63–68. [Google Scholar] [CrossRef]
- Pérez-Alonso, J.; Carreño-Ortega, A.; Vázquez-Cabrera, F.J.; Callejón-Ferre, A.J. Accidents in the greenhouse-construction industry of SE Spain. Appl. Ergon. 2012, 43, 69–80. [Google Scholar] [CrossRef] [PubMed]
- Aboagye-Nimo, E.; Raiden, A.; King, A.; Tietze, S. Using tacit knowledge in training and accident prevention. Manag. Procure. Law 2015, 168, 232–240. [Google Scholar] [CrossRef] [Green Version]
- Berry, A.J.; Coad, A.F.; Harris, E.P.; Otley, D.T.; Stringer, C. Emerging themes in management control: A review of recent literature. Br. Account. Rev. 2009, 41, 2–20. [Google Scholar] [CrossRef] [Green Version]
- Akroush, N.S.; El-adaway, I.H. Utilizing Construction Leading Safety Indicators: Case Study of Tennessee. J. Manag. Eng. 2017, 33. [Google Scholar] [CrossRef]
- Rodríguez-Garzón, I.; Lucas-Ruiz, V.; Martínez-Fiestas, M.; Delgado-Padial, A. Association between perceived risk and training in the construction industry. J. Constr. Eng. Manag. 2014, 141, 04014095. [Google Scholar] [CrossRef]
- Rodríguez-Garzón, I.; Martínez-Fiestas, M.; Delgado-Padial, A.; Lucas-Ruiz, V. An Exploratory Analysis of Perceived Risk among Construction Workers in Three Spanish-Speaking Countries. J. Constr. Eng. Manag. 2016, 142, 045016066. [Google Scholar] [CrossRef]


© 2018 by the authors. Licensee MDPI, Basel, Switzerland. This article is an open access article distributed under the terms and conditions of the Creative Commons Attribution (CC BY) license (http://creativecommons.org/licenses/by/4.0/).
Share and Cite
Hernández-Arriaza, F.A.; Pérez-Alonso, J.; Gómez-Galán, M.; Salata, F. The Guatemalan Construction Industry: Approach of Knowledge Regarding Work Risks Prevention. Int. J. Environ. Res. Public Health 2018, 15, 2252. https://doi.org/10.3390/ijerph15102252
Hernández-Arriaza FA, Pérez-Alonso J, Gómez-Galán M, Salata F. The Guatemalan Construction Industry: Approach of Knowledge Regarding Work Risks Prevention. International Journal of Environmental Research and Public Health. 2018; 15(10):2252. https://doi.org/10.3390/ijerph15102252
Chicago/Turabian StyleHernández-Arriaza, Francisco Arturo, José Pérez-Alonso, Marta Gómez-Galán, and Ferdinando Salata. 2018. "The Guatemalan Construction Industry: Approach of Knowledge Regarding Work Risks Prevention" International Journal of Environmental Research and Public Health 15, no. 10: 2252. https://doi.org/10.3390/ijerph15102252