Biointeractions of Herbicide Atrazine with Human Serum Albumin: UV-Vis, Fluorescence and Circular Dichroism Approaches

 ,
,
Abstract
: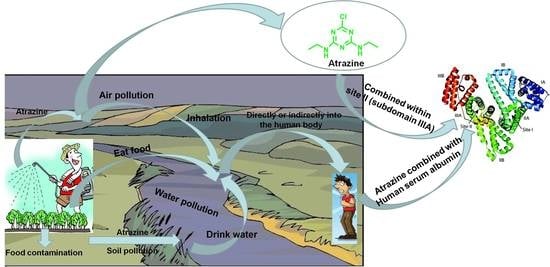
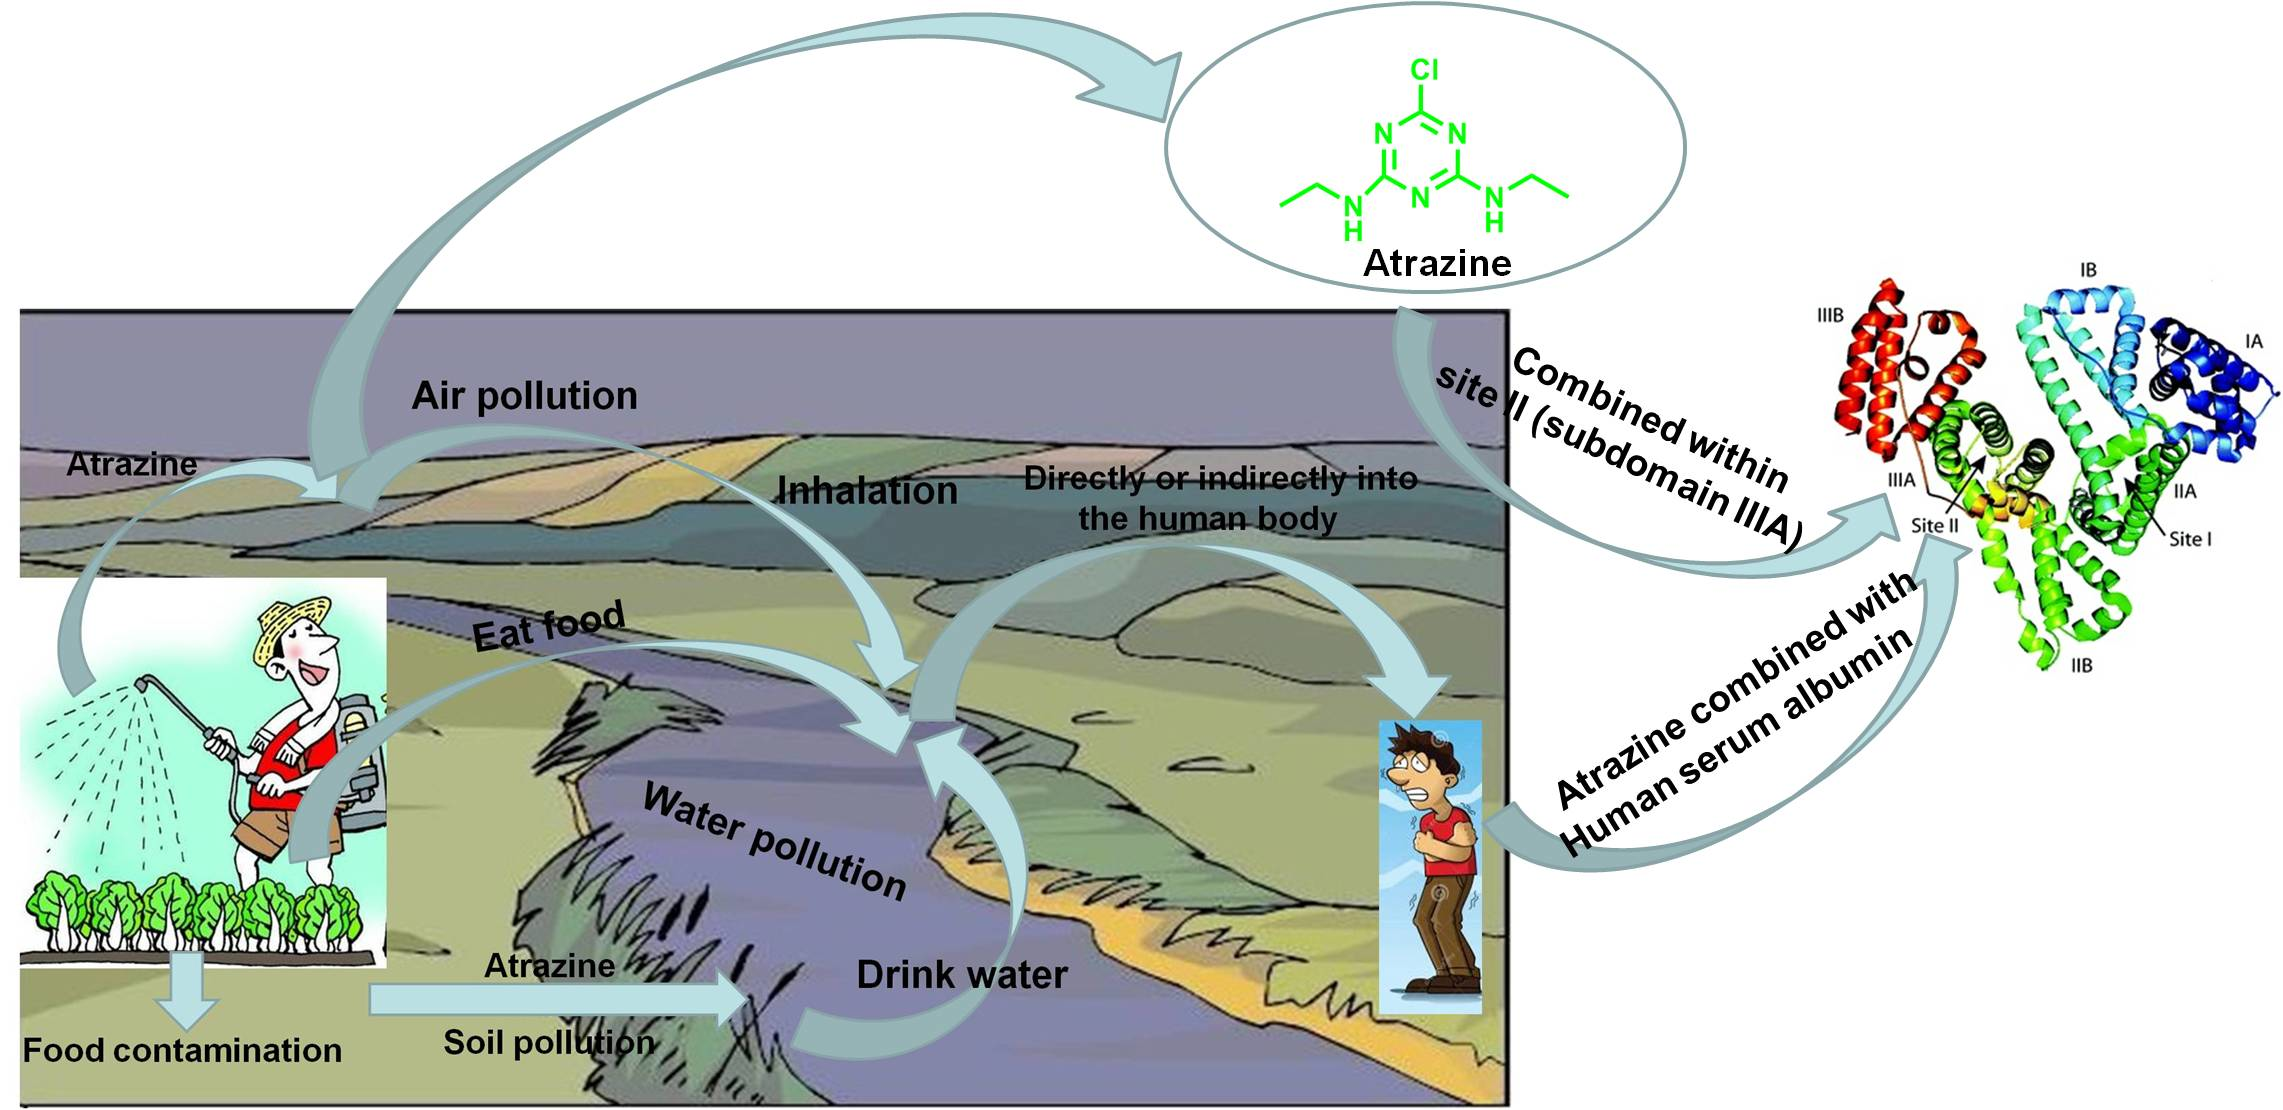
1. Introduction
2. Experimental Section
2.1. Materials
2.2. Instrumentation
2.3. Steady-State Fluorescence Spectra
2.4. Fluorescence Titration Experiments
2.5. Site Marker Competition Experiments
2.6. UV-Vis Spectra
2.7. CD Spectra
2.8. 3D Fluorescence Spectra
2.9. Synchronous Fluorescence Spectra
3. Results and Discussion
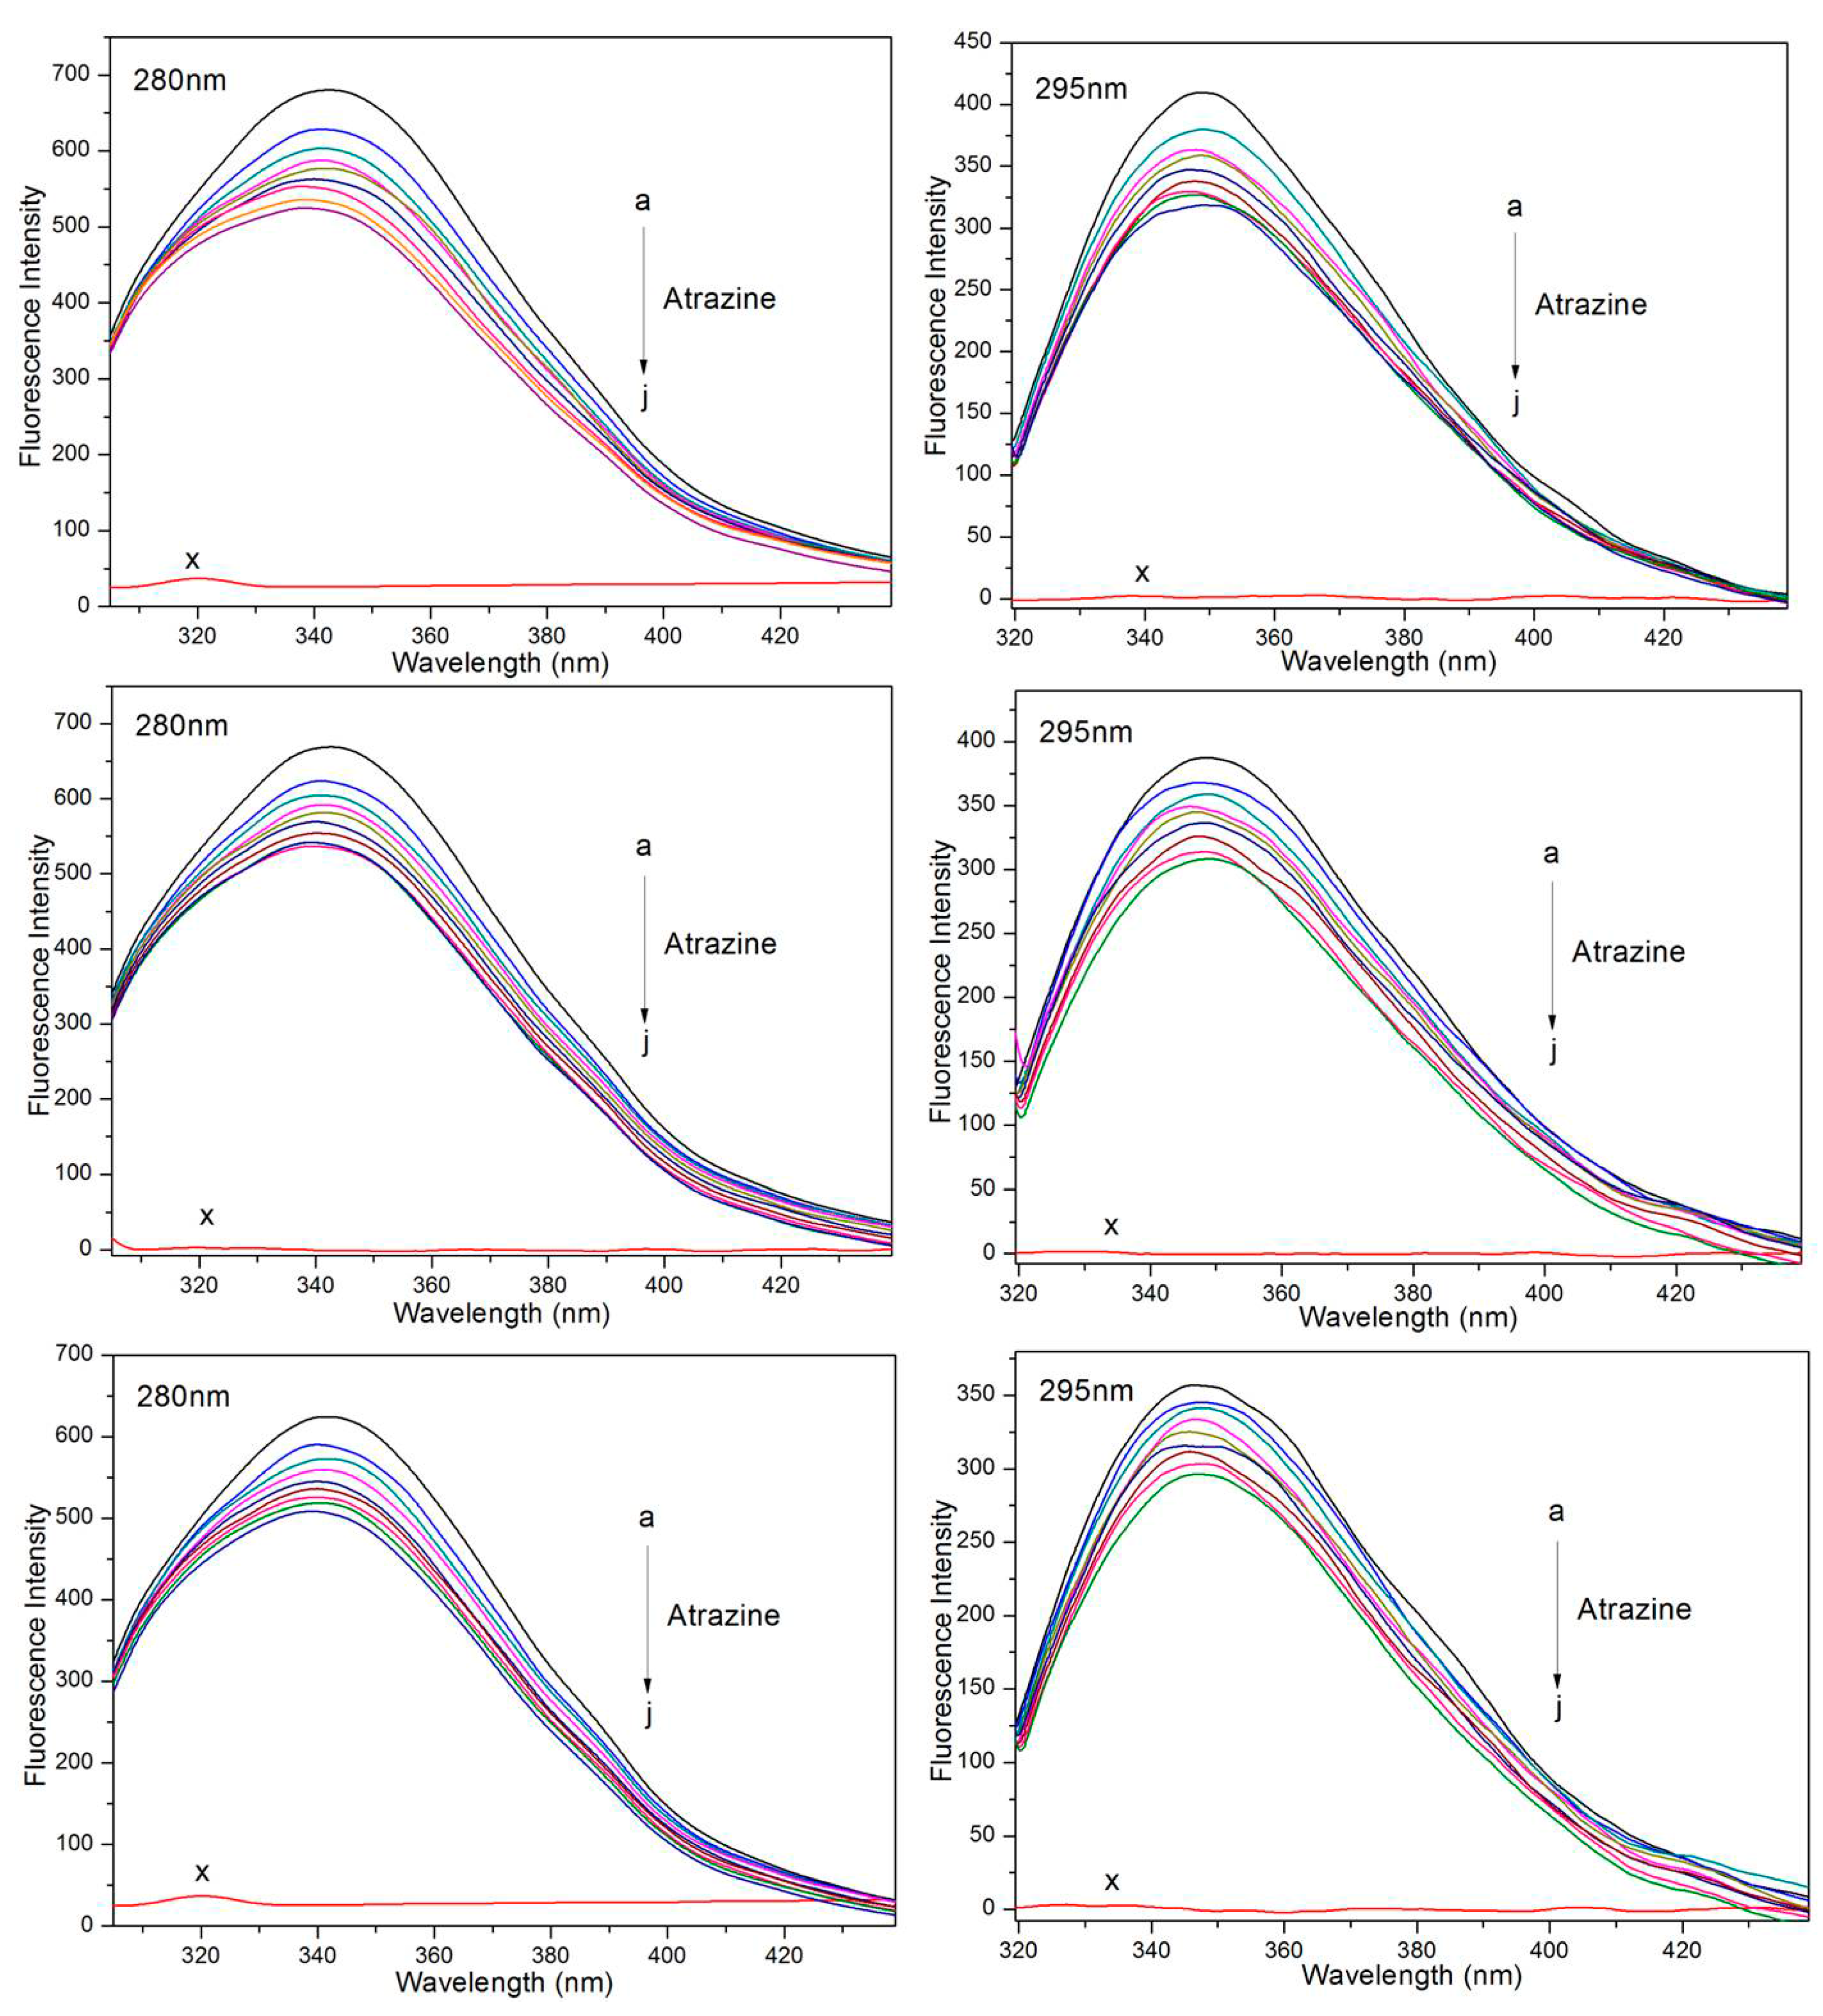
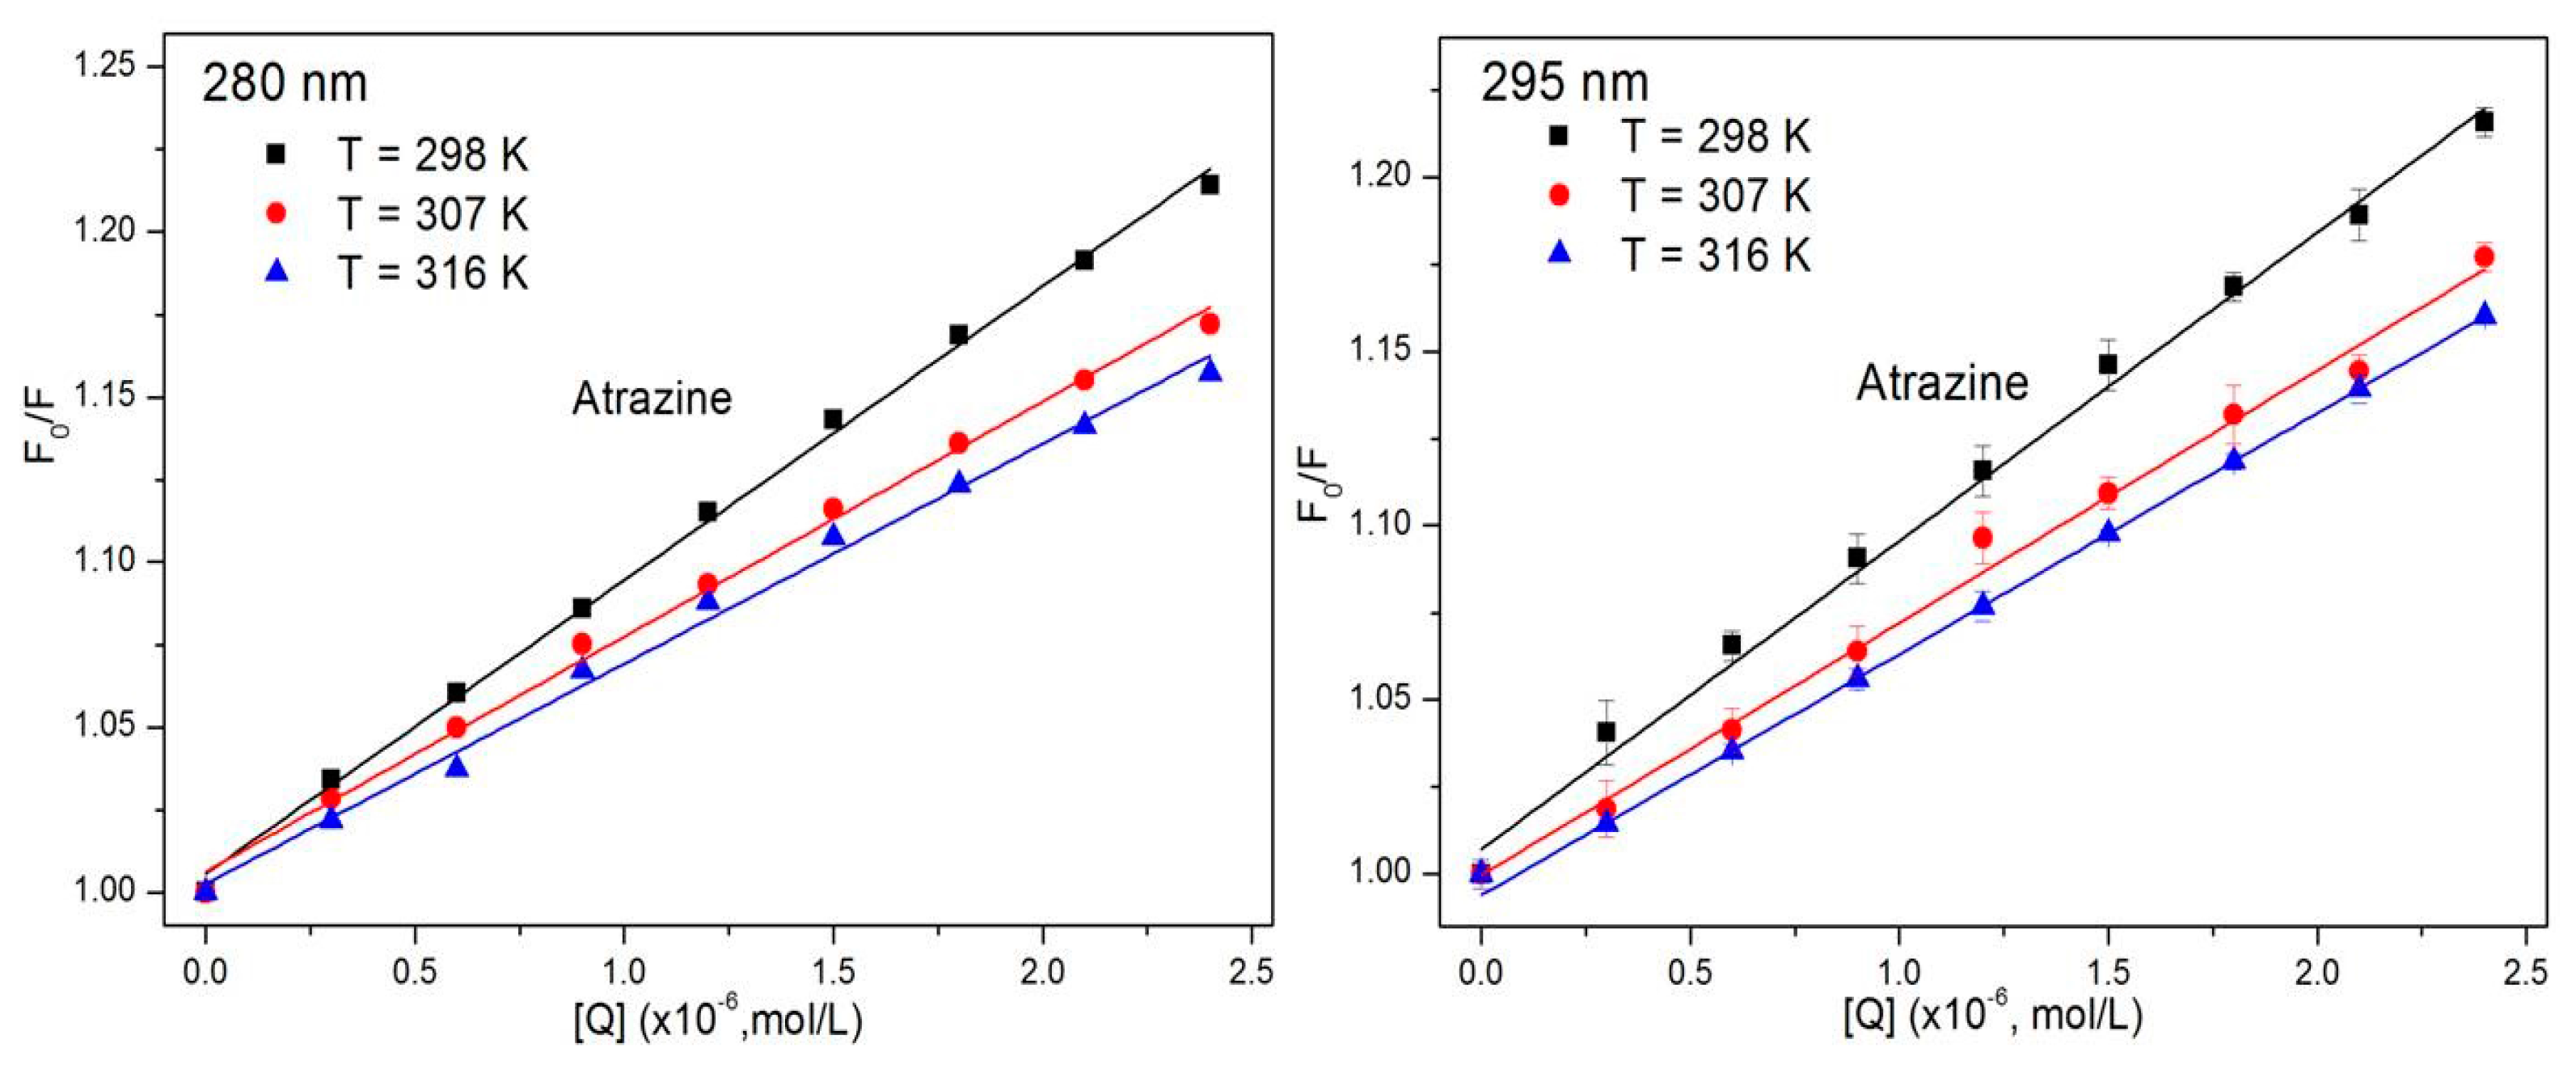
3.1. Study of the Quenching Mechanism of HSA by ATR
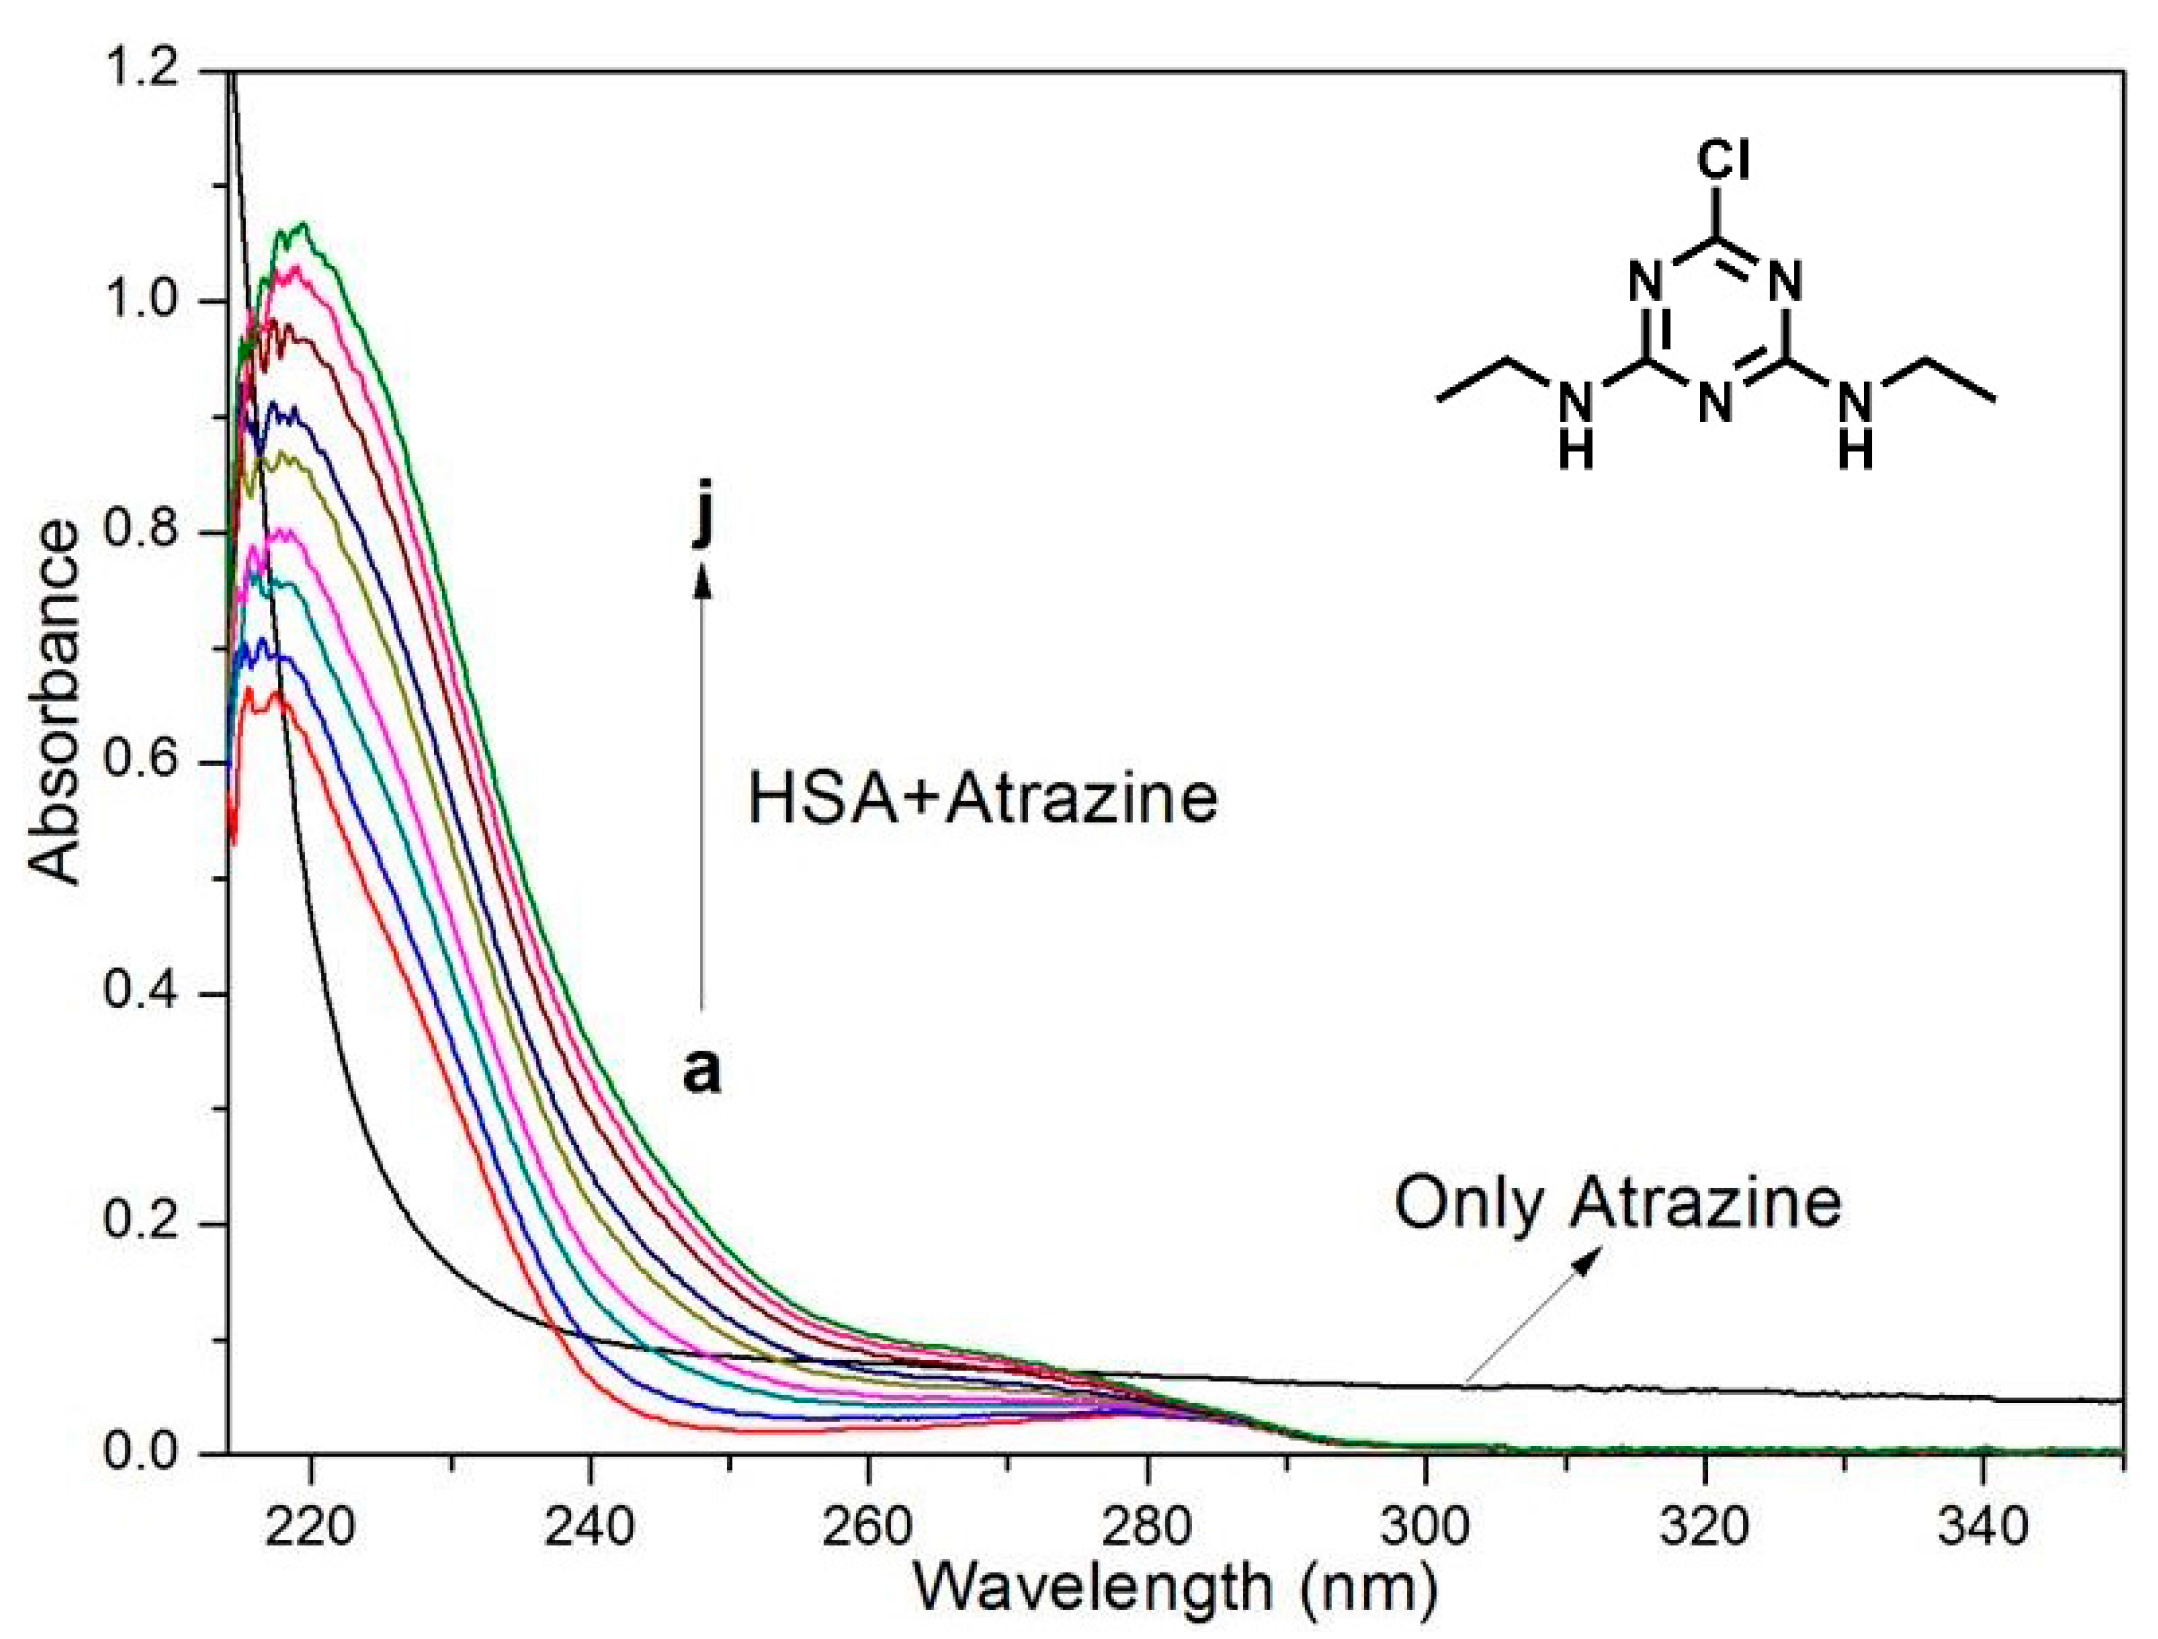
3.2. UV-Vis Spectra of ATR Interacting with HSA
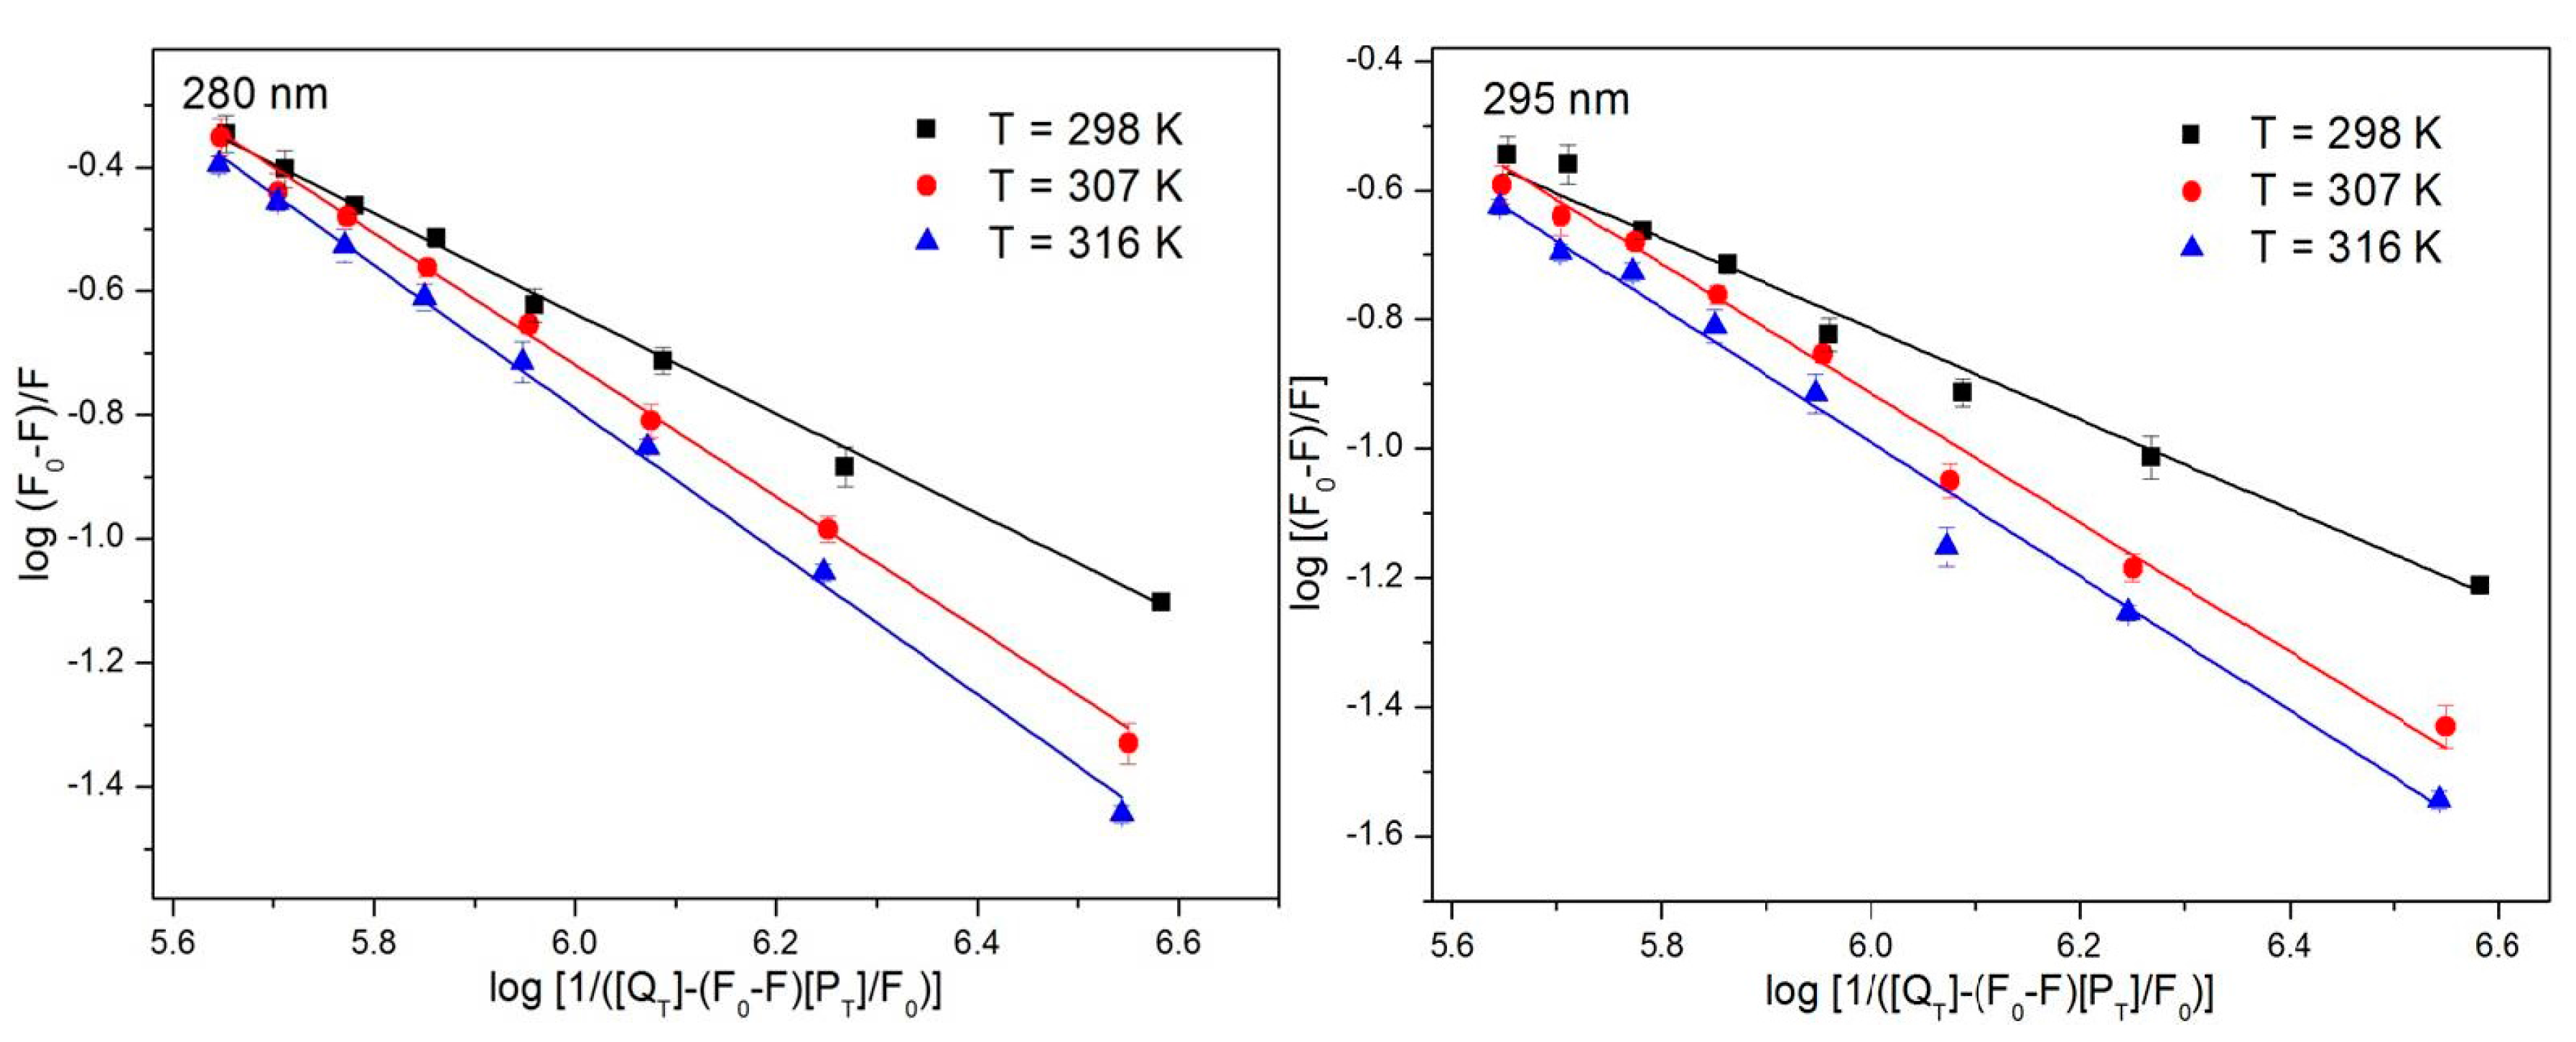
3.3. Study of the Binding Sites and Binding Number
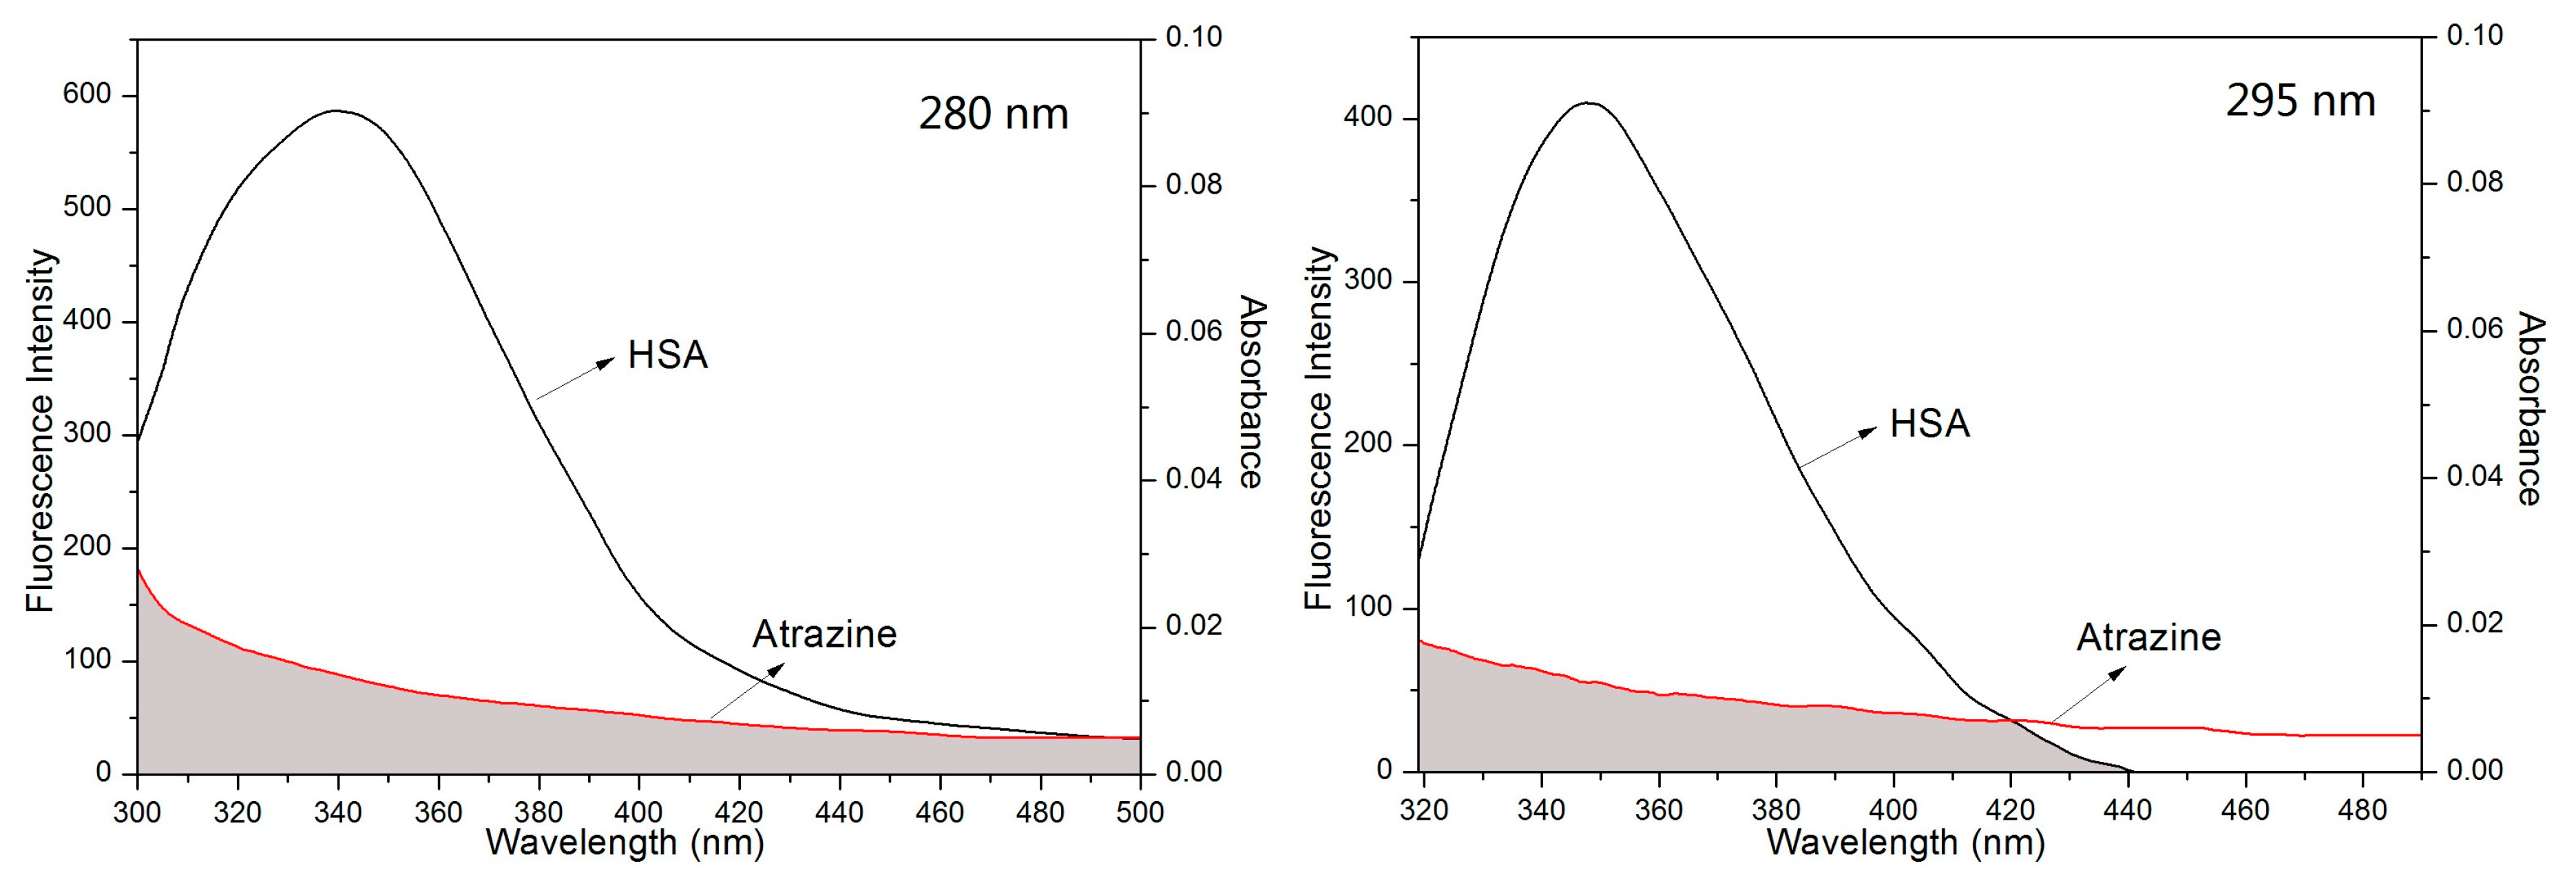
3.4. Combination Distance between ATR and HSA
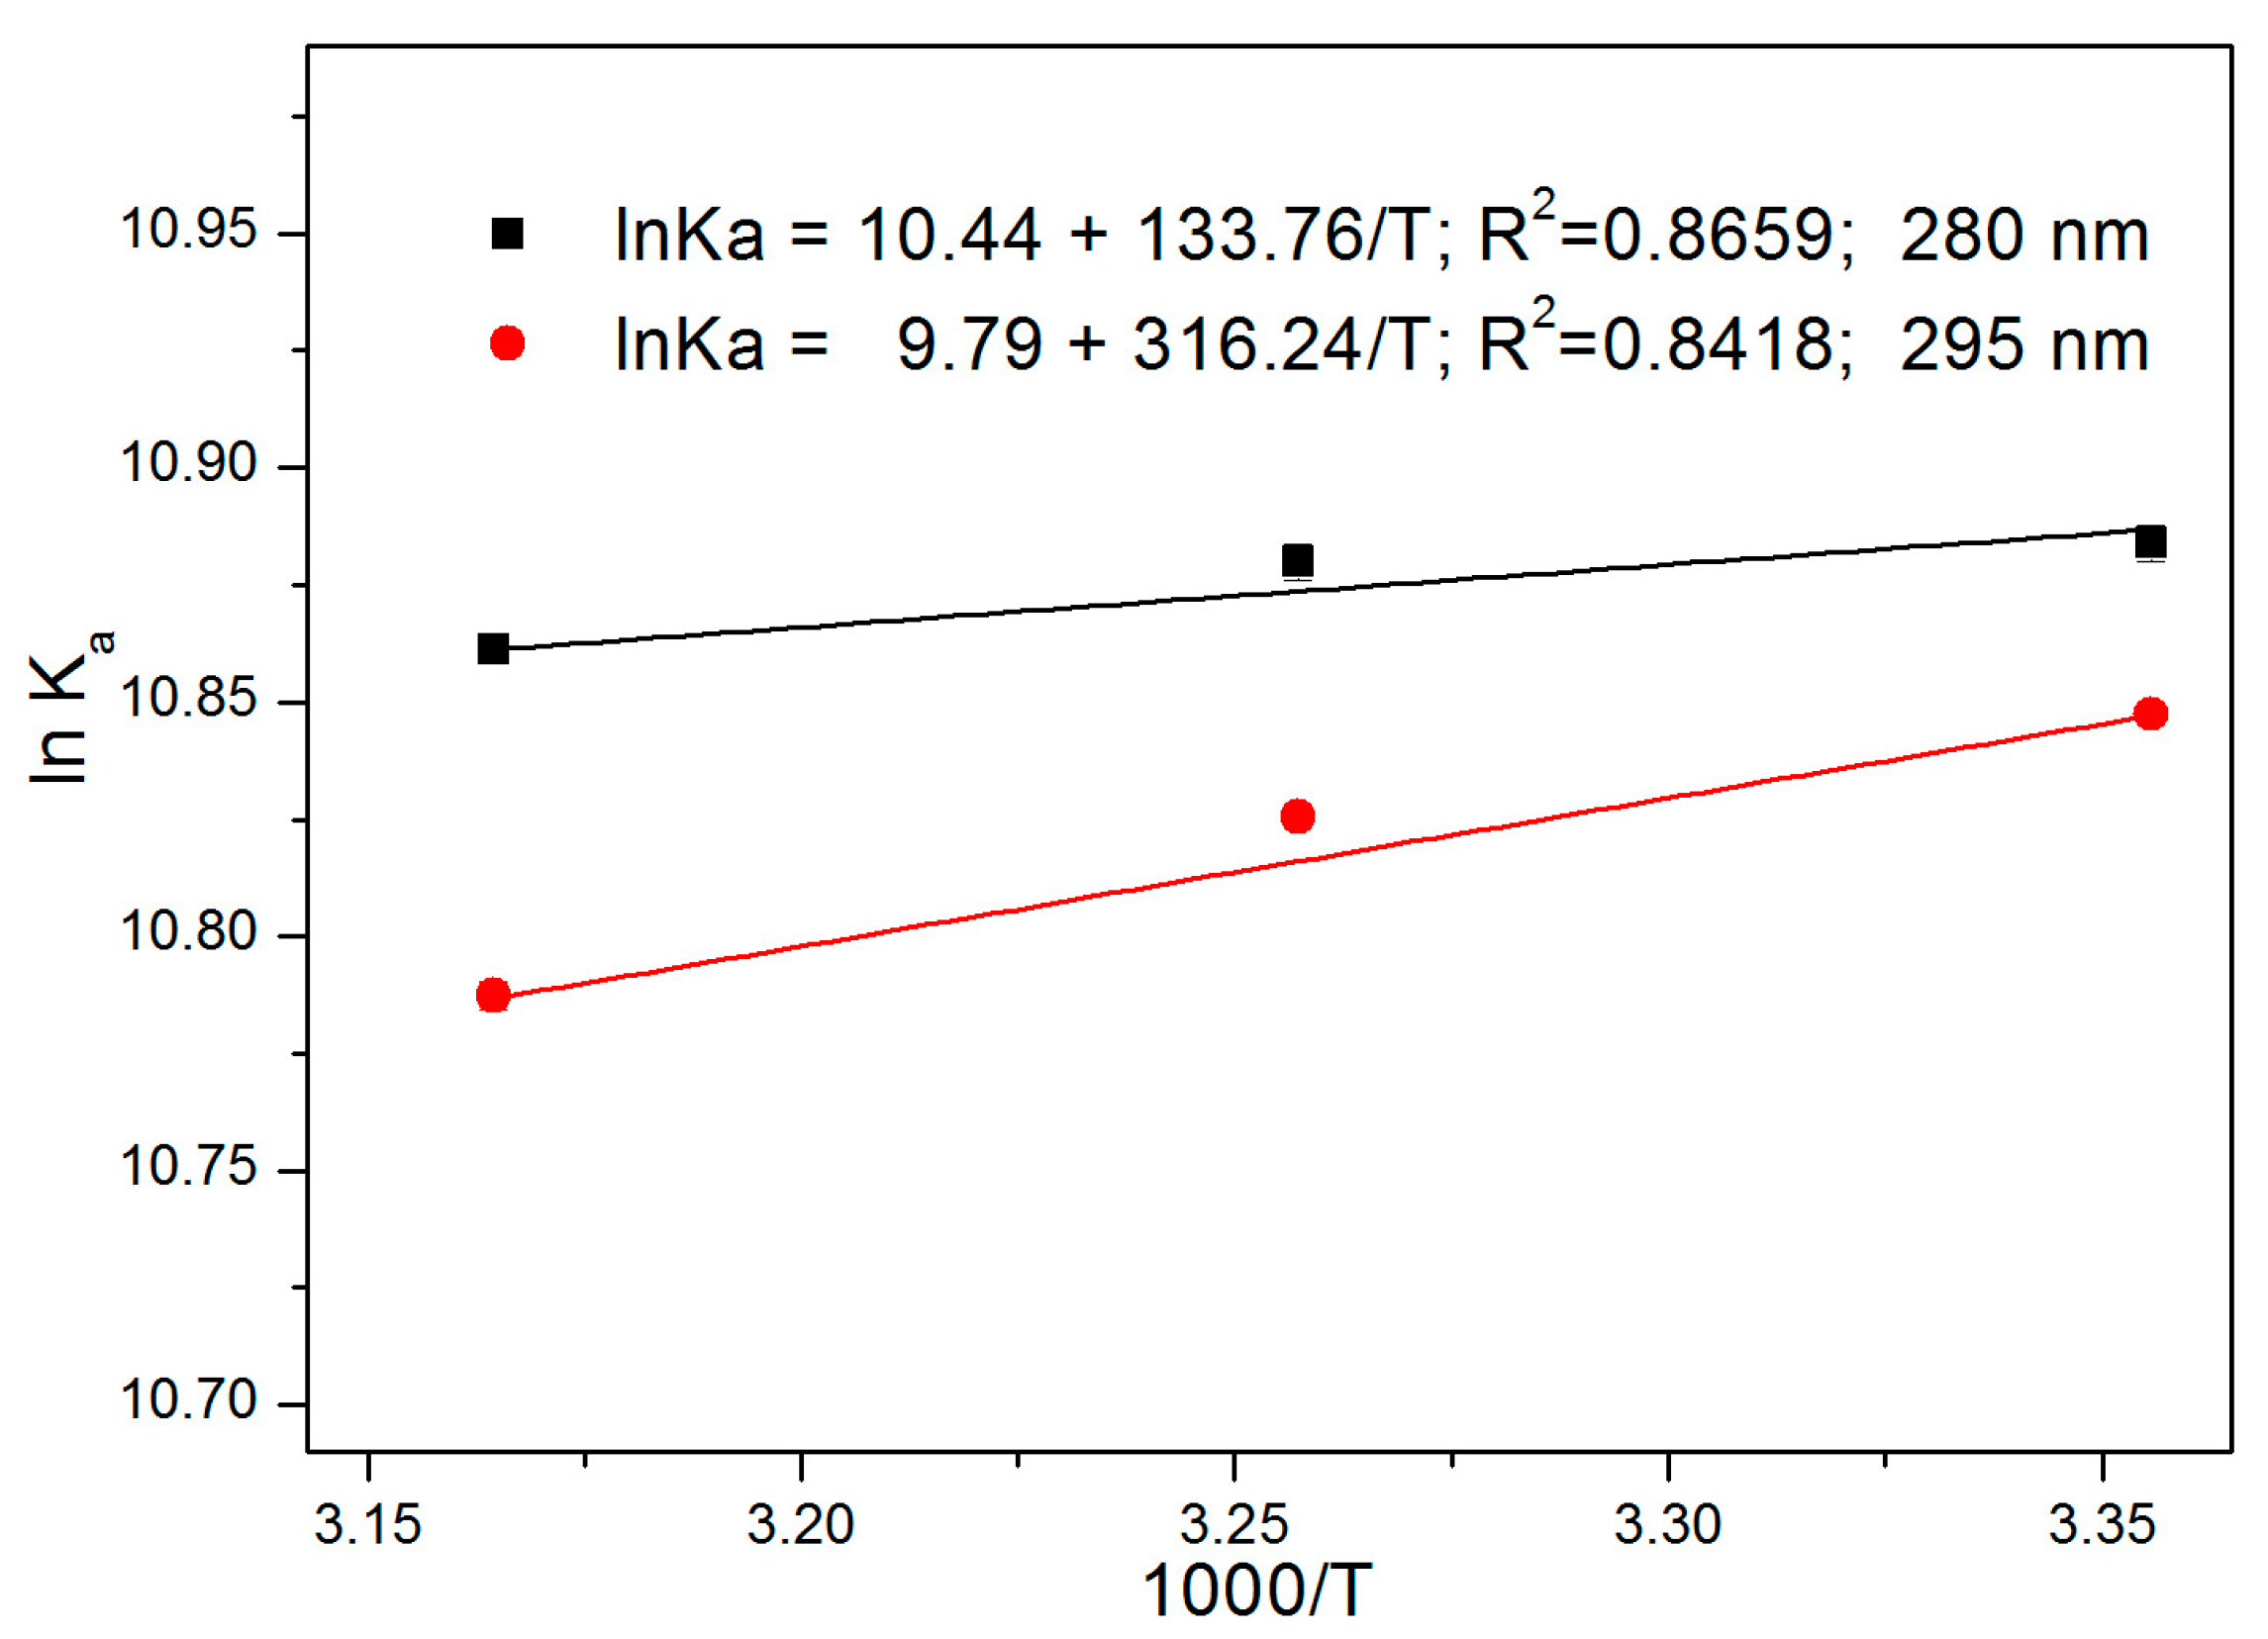
3.5. Thermodynamic Parameters and Binding Modes
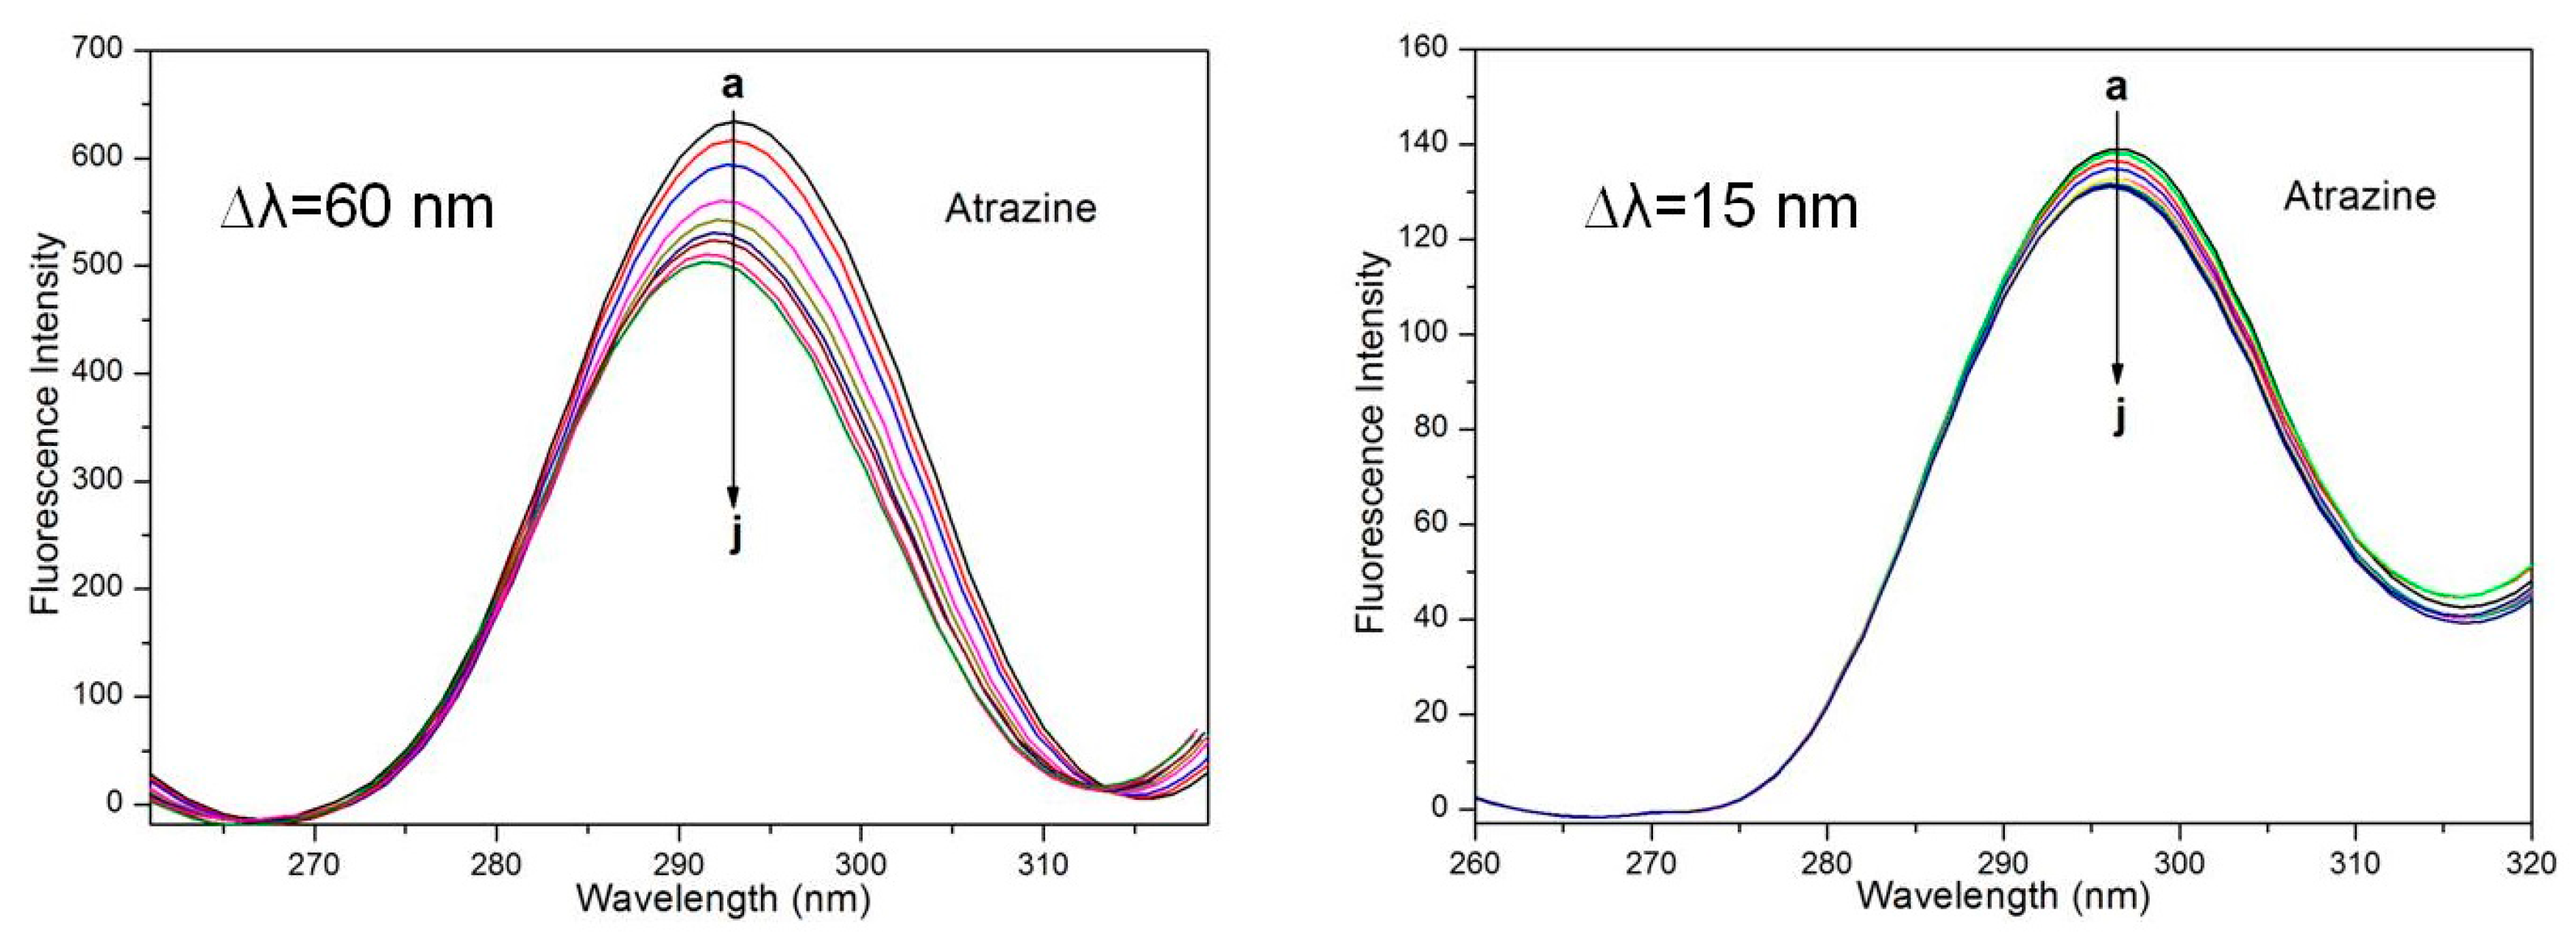
3.6. Study of the Synchronous Fluorescence Spectra
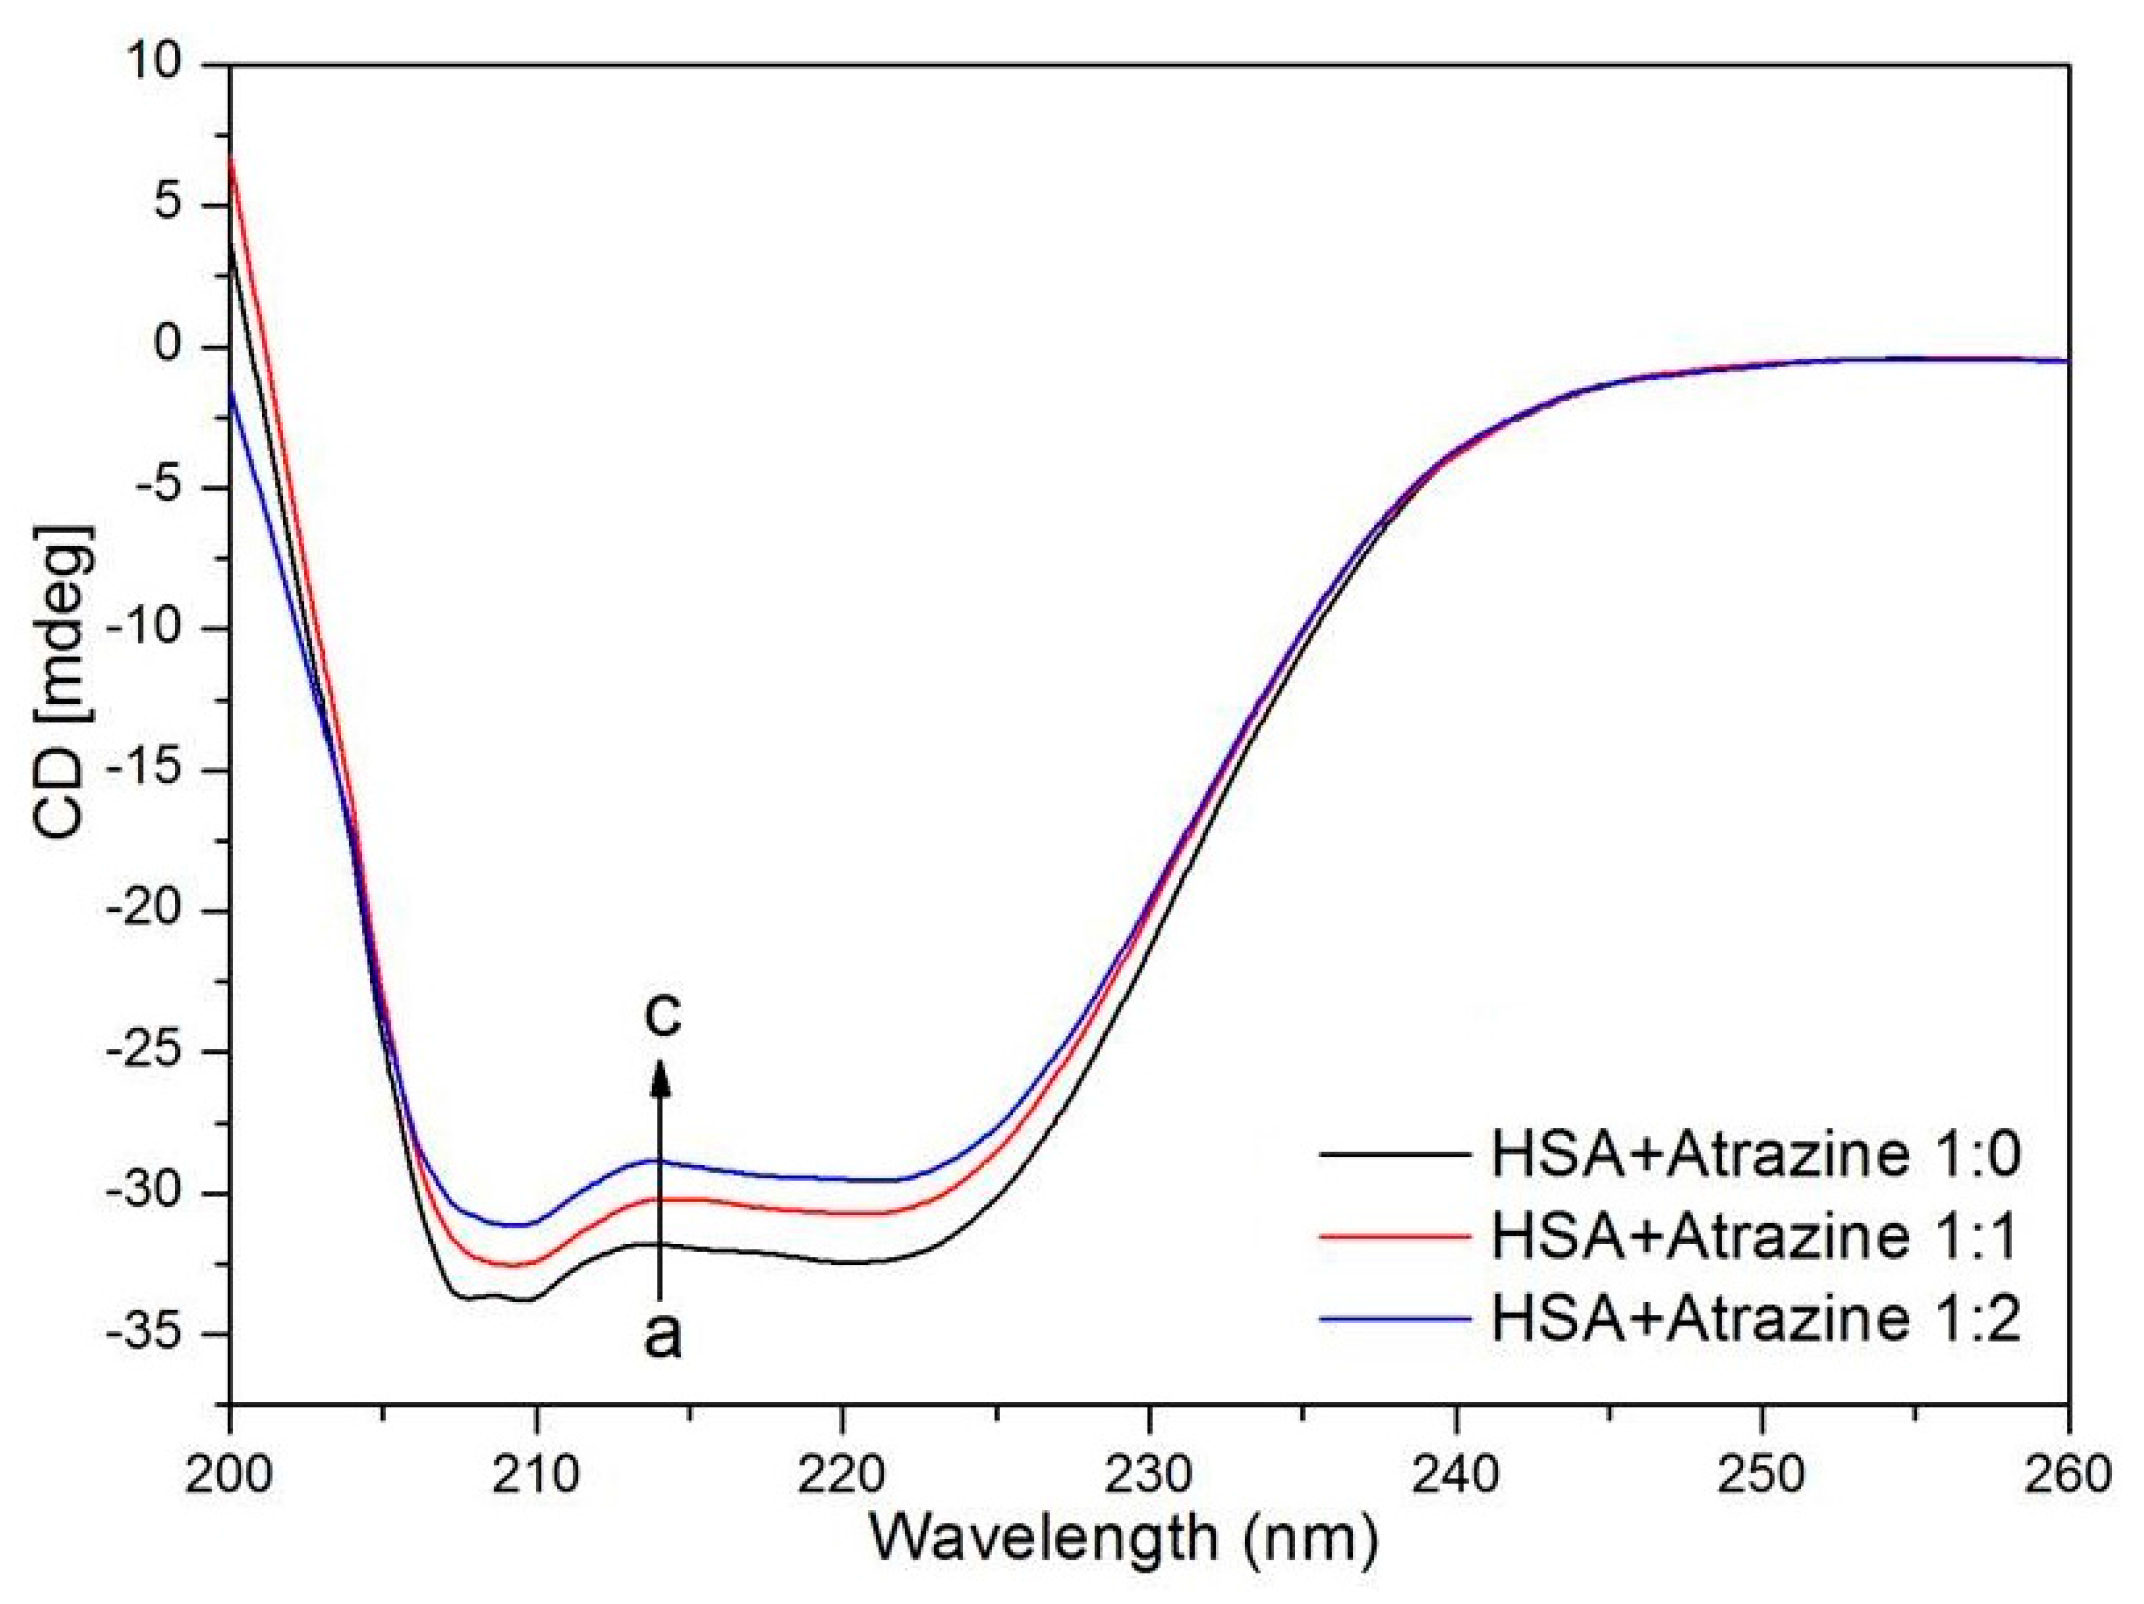
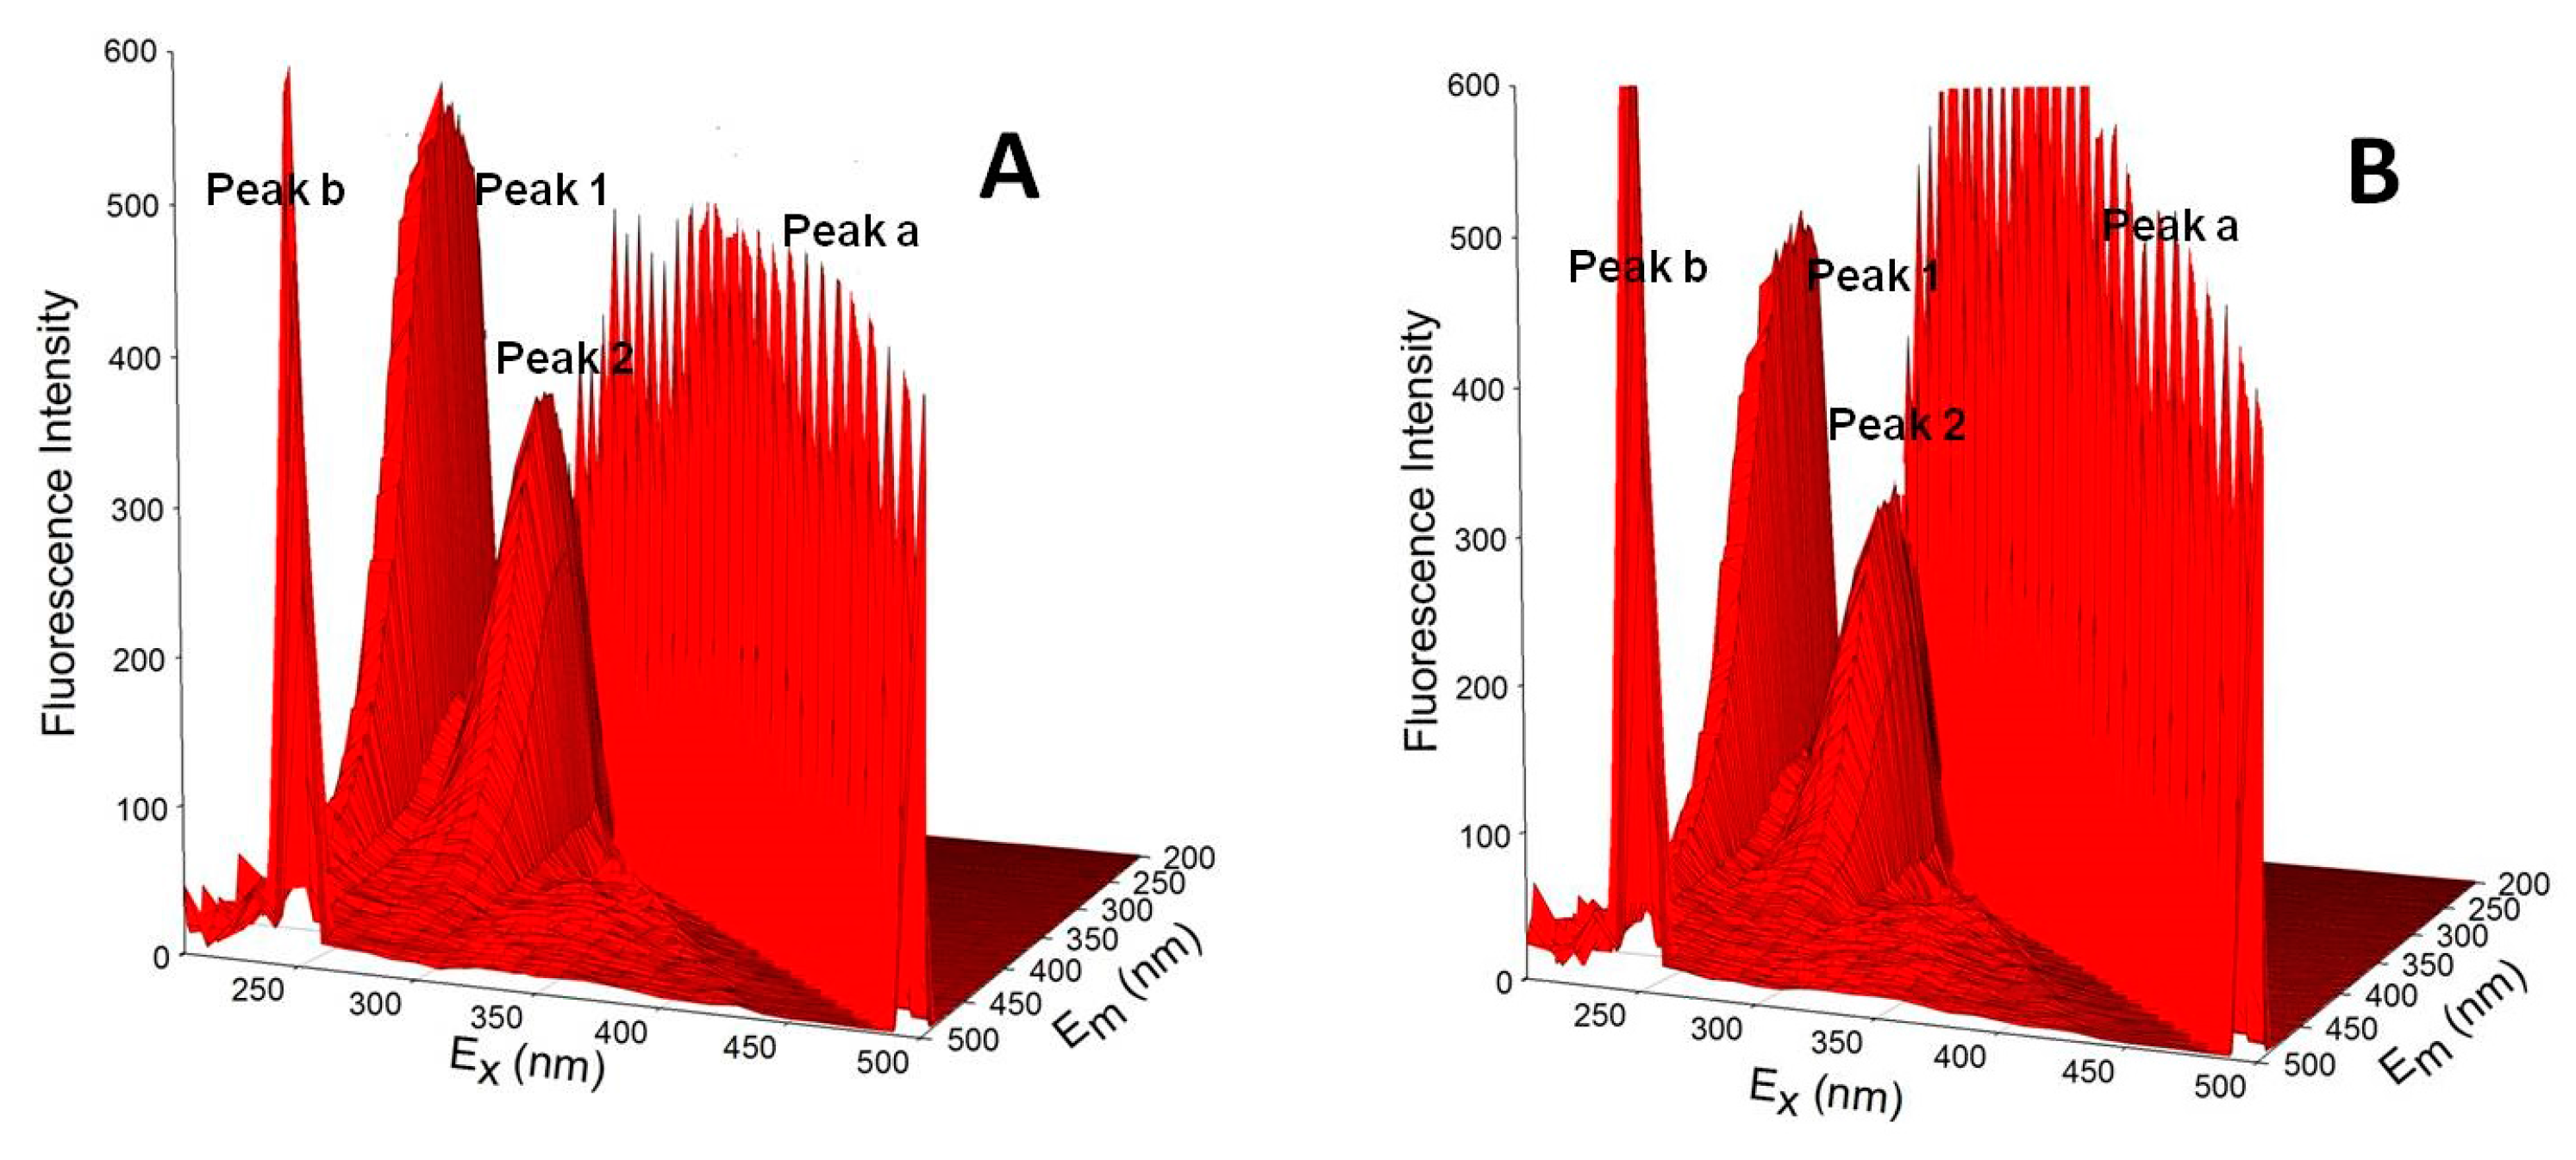
3.7. Conformational Changes of HSA Detected by CD and 3D Fluorescence Spectroscopy
4. Conclusions
Acknowledgments
Author Contributions
Conflicts of Interest
References
- Broszat, M.; Ernst, H.; Spangenberg, B. A simple method for quantifying triazine herbicides using thin-layer chromatography and a CCD camera. J. Liquid Chromatogr. Relat. Technol. 2010, 33, 948–956. [Google Scholar] [CrossRef]
- Fernandez, M.V.; Gardinali, P.R. Risk assessment of triazine herbicides in surface waters and bioaccumulation of Irgarol and M1 by submerged aquatic vegetation in Southeast Florida. Sci. Total Environ. 2016, 541, 1556–1571. [Google Scholar] [CrossRef] [PubMed]
- Frias, S.; Sanchez, M.J.; Rodriguez, M.A. Determination of triazine compounds in ground water samples by micellar electrokinetic capillary chromatography. Anal. Chim. Acta 2004, 503, 271–278. [Google Scholar] [CrossRef]
- Alfonso, M.; Collados, R.; Yruela, I.; Picorel, R. Photoinhibition and recovery in a herbicide-resistant mutant from Glycine max (L.) Merr. cell cultures deficient in fatty acid unsaturation. Planta 2004, 219, 428–439. [Google Scholar] [CrossRef] [PubMed]
- Buonasera, K.; Pezzotti, G.; Scognamiglio, V.; Tibuzzi, A.; Giardi, M.T. New platform of biosensors for prescreening of pesticide residues to support laboratory analyses. J. Agric. Food Chem. 2010, 58, 5982–5990. [Google Scholar] [CrossRef] [PubMed]
- Lambreva, M.D.; Giardi, M.T.; Rambaldi, I.; Antonacci, A.; Pastorelli, S.; Bertalan, I.; Husu, I.; Johanningmeier, U.; Rea, G. A powerful molecular engineering tool provided efficient chlamydomonas mutants as bio-sensing elements for herbicides detection. PLoS ONE 2013, 8, e061851. [Google Scholar] [CrossRef] [PubMed]
- Thiel, H.; Varrelmann, M. Identification of a new PSII target site psbA mutation leading to D1 amino acid Leu (218) Val exchange in the Chenopodium album D1 protein and comparison to cross-resistance profiles of known modifications at positions 251 and 264. Pest Manag. Sci. 2014, 70, 278–285. [Google Scholar] [CrossRef] [PubMed]
- Zhou, B.; Liu, Z.F.; Deng, G.G.; Chen, W.; Li, M.Y.; Yang, L.J.; Li, Y.; Yang, X.D.; Zhang, H.B. Synthesis and antitumor activity of novel N-substituted tetrahydro-beta-carboline-imidazolium salt derivatives. Org. Biomol. Chem. 2016, 14, 9423–9430. [Google Scholar] [CrossRef] [PubMed]
- Yang, L.J.; Xia, S.; Ma, S.X.; Zhou, S.Y.; Zhao, X.Q.; Wang, S.H.; Li, M.Y.; Yang, X.D. Host-guest system of hesperetin and beta-cyclodextrin or its derivatives: Preparation, characterization, inclusion mode, solubilization and stability. Mater. Sci. Eng. 2016, 59, 1016–1024. [Google Scholar] [CrossRef] [PubMed]
- Li, M.; Gonzalez-Esguevillas, M.; Berritt, S.; Yang, X.; Bellomo, A.; Walsh, P.J. Palladium-catalyzed C-H arylation of alpha, beta-unsaturated imines: Catalyst-controlled synthesis of enamine and allylic amine derivatives. Angew. Chem. 2016, 55, 2825–2829. [Google Scholar] [CrossRef] [PubMed]
- Sun, L.; Li, Y.; Li, A.M. Treatment of actual chemical wastewater by a heterogeneous fenton process using natural pyrite. Int. J. Environ. Res. Public Health 2015, 12, 13762–13778. [Google Scholar] [CrossRef] [PubMed]
- Brvar, M.; Okrajsek, R.; Kosmina, P.; Staric, F.; Kaps, R.; Kozelj, G.; Bunc, M. Metabolic acidosis in prometryn (triazine herbicide) self-poisoning. Clin. Toxicol. 2008, 46, 270–273. [Google Scholar] [CrossRef] [PubMed]
- Liu, F.; Zhong, J.; Li, S.; Li, M.; Wu, L.; Wang, Q.; Mao, J.; Liu, S.; Zheng, B.; Wang, M.; et al. Total syntheses of (R)-Strongylodiols C and D. J. Nat. Prod. 2016, 79, 244–247. [Google Scholar] [CrossRef] [PubMed]
- Zhang, F.S.; Zhao, Q.; Yan, X.; Li, H.Y.; Zhang, P.; Wang, L.; Zhou, T.Y.; Li, Y.; Ding, L. Rapid preparation of expanded graphite by microwave irradiation for the extraction of triazine herbicides in milk samples. Food Chem. 2016, 197, 943–949. [Google Scholar] [CrossRef] [PubMed]
- Boffetta, P.; Adami, H.O.; Berry, C.; Mandel, J.S. Atrazine and cancer: A review of the epidemiologic evidence. Eur. J. Cancer Prev. 2013, 22, 169–180. [Google Scholar] [CrossRef] [PubMed]
- Gammon, D.W.; Aldous, C.N.; Carr, W.C.; Sanborn, J.R.; Pfeifer, K.F. A risk assessment of atrazine use in California: Human health and ecological aspects. Pest Manag. Sci. 2005, 61, 331–355. [Google Scholar] [CrossRef] [PubMed]
- Kuhnisch, J.; Goddon, I.; Berger, S.; Senkel, H.; Bucher, K.; Oehme, T.; Hickel, R.; Heinrich-Weltzien, R. Development, methodology and potential of the new universal visual scoring system (UniViSS) for caries detection and diagnosis. Int. J. Environ. Res. Public Health 2009, 6, 2500–2509. [Google Scholar] [CrossRef] [PubMed] [Green Version]
- Cavas, T. In vivo genotoxicity evaluation of atrazine and atrazine-based herbicide on fish Carassius auratus using the micronucleus test and the comet assay. Food Chem. Toxicol. 2011, 49, 1431–1435. [Google Scholar] [CrossRef] [PubMed]
- Stara, A.; Kristan, J.; Zuskova, E.; Velisek, J. Effect of chronic exposure to prometryne on oxidative stress and antioxidant response in common carp (Cyprinus carpio L.). Pest Biochem. Phys. 2013, 105, 18–23. [Google Scholar] [CrossRef] [PubMed]
- Vieira, C.E.D.; Costa, P.G.; Lunardelli, B.; de Oliveira, L.F.; Cabrera, L.D.; Risso, W.E.; Primel, E.G.; Meletti, P.C.; Fillmann, G.; dos Reis Martinez, C.B. Multiple biomarker responses in Prochilodus lineatus subjected to short-term in situ exposure to streams from agricultural areas in Southern Brazil. Sci. Total Environ. 2016, 542, 44–56. [Google Scholar] [CrossRef] [PubMed]
- Cao, X.; Sha, S.C.; Li, M.; Kim, B.S.; Morgan, C.; Huang, R.; Yang, X.; Walsh, P.J. Nickel-catalyzed arylation of heteroaryl-containing diarylmethanes: Exceptional reactivity of the Ni (NIXANTPHOS)-based catalyst. Chem. Sci. 2016, 7, 611–618. [Google Scholar] [CrossRef] [PubMed]
- Li, M.; Yucel, B.; Jiménez, J.; Rotella, M.; Fu, Y.; Walsh, P.J. Umpolung synthesis of diarylmethylaminesviapalladium—Catalyzed arylation ofn-benzyl aldimines. Adv. Synth. Catal. 2016, 358, 1910–1915. [Google Scholar] [CrossRef] [PubMed]
- Jin, J.; Zhang, X. Spectrophotometric studies on the interaction between pazufloxacin mesilate and human serum albumin or lysozyme. J. Lumin. 2008, 128, 81–86. [Google Scholar] [CrossRef]
- Yue, Y.Y.; Zhang, Y.H.; Li, Y.; Zhu, J.H.; Qin, J.; Chen, X.G. Interaction of nobiletin with human serum albumin studied using optical spectroscopy and molecular modeling methods. J. Lumin. 2008, 128, 513–520. [Google Scholar] [CrossRef]
- Chen, C.L.; Capanema, E.A.; Gracz, H.S. Comparative studies on the delignification of pine kraft-anthraquinone pulp with hydrogen peroxide by binucleus Mn (IV) complex catalysis. J. Agric. Food Chem. 2003, 51, 6223–6232. [Google Scholar] [CrossRef] [PubMed]
- Liitia, T.M.; Maunu, S.L.; Hortling, B.; Toikka, M.; Kilpelainen, I. Analysis of technical lignins by two- and three-dimensional NMR spectroscopy. J. Agric. Food Chem. 2003, 51, 2136–2143. [Google Scholar] [CrossRef] [PubMed]
- Wang, S.; Wang, Y.; Jiang, J.; Liu, R.; Li, M.; Wang, Y.; Su, Y.; Zhu, B.; Zhang, S.; Huang, W. A DRIFTS study of low-temperature CO oxidation over Au/SnO2 catalyst prepared by co-precipitation method. Catal. Commun. 2009, 10, 640–644. [Google Scholar] [CrossRef]
- Wang, S.; Zhang, J.; Jiang, J.; Liu, R.; Zhu, B.; Xu, M.; Wang, Y.; Cao, J.; Li, M.; Yuan, Z.; et al. Porous ceria hollow microspheres: Synthesis and characterization. Microporous Mesoporous Mater. 2009, 123, 349–353. [Google Scholar] [CrossRef]
- Makarska-Bialokoz, M. Investigation of the binding affinity in vitamin B12-Bovine serum albumin system using various spectroscopic methods. Spectrochim. Acta A 2017, 184, 262–269. [Google Scholar] [CrossRef] [PubMed]
- Cysewski, P. A post-SCF complete basis set study on the recognition patterns of uracil and cytosine by aromatic and pi-aromatic stacking interactions with amino acid residues. Phys. Chem. Chem. Phys. 2008, 10, 2636–2645. [Google Scholar] [CrossRef] [PubMed]
- Li, M.; Yucel, B.; Adrio, J.; Bellomo, A.; Walsh, P.J. Synthesis of diarylmethylamines via palladium-catalyzed regioselective arylation of 1,1,3-triaryl-2-azaallyl anions. Chem. Sci. 2014, 5, 2383–2391. [Google Scholar] [CrossRef] [PubMed]
- Makarska-Bialokoz, M. Analysis of the binding interaction in uric acid—Human hemoglobin system by spectroscopic techniques. Spectrochim. Acta A 2017, 178, 47–54. [Google Scholar] [CrossRef] [PubMed]
- Shi, S.Y.; Zhang, Y.P.; Chen, X.Q.; Peng, M.J. Investigation of flavonoids bearing different substituents on ring c and their Cu2+ complex binding with bovine serum albumin: Structure-affinity relationship aspects. J. Agric. Food Chem. 2011, 59, 10761–10769. [Google Scholar] [CrossRef] [PubMed]
- Wang, W.Q.; Bao, Y.H.; Chen, Y. Characteristics and antioxidant activity of water-soluble mail lard reaction products from interactions in a whey protein isolate and sugars system. Food Chem. 2013, 139, 355–361. [Google Scholar] [CrossRef] [PubMed]
- Ali, M.S.; Al-Lohedan, H.A. Interaction of human serum albumin with sulfadiazine. J. Mol. Liq. 2014, 197, 124–130. [Google Scholar] [CrossRef]
- Li, M.; Berritt, S.; Walsh, P.J. Palladium-catalyzed regioselective arylation of 1,1,3-triaryl-2-azaallyl anions with aryl chlorides. Org. Lett. 2014, 16, 4312–4315. [Google Scholar] [CrossRef] [PubMed]
- Wang, Y.; Zhu, M.Q.; Liu, F.; Wu, X.W.; Pan, D.D.; Liu, J.; Fan, S.S.; Wang, Z.; Tang, J.; Na, R.S.; et al. Comparative studies of interactions between fluorodihydroquinazolin derivatives and human serum albumin with fluorescence spectroscopy. Molecules 2016, 21, 1373. [Google Scholar] [CrossRef] [PubMed]
- Soares, S.; Mateus, N.; de Freitas, V. Interaction of different polyphenols with bovine serum albumin (BSA) and human salivary alpha-amylase (HSA) by fluorescence quenching. J. Agric. Food Chem. 2007, 55, 6726–6735. [Google Scholar] [CrossRef] [PubMed]
- Cheng, X.X.; Fan, X.Y.; Jiang, F.L.; Liu, Y.; Lei, K.L. Resonance energy transfer, pH-induced folded states and the molecular interaction of human serum albumin and icariin. Luminescence 2015, 30, 1026–1033. [Google Scholar] [CrossRef] [PubMed]
- Mueller, D.R.; Krenos, J. Reaction of metastable Ar* (P-3 (2)) and Kr* (P-3 (2)) atoms with water vapor: Excitation functions for electronic quenching collisions. J. Phys. Chem. B 2002, 106, 8142–8147. [Google Scholar] [CrossRef]
- Liu, F.P.; Zhong, J.C.; Zheng, B.; Li, S.N.; Gao, G.; Wang, Z.Y.; Li, M.Y.; Hou, S.C.; Wang, M.; Bian, Q.H. Catalytic asymmetric synthesis of (S,4E,15Z)-docosa-4,15-dien-1-yn-3-ol, an antitumor marine natural product. Tetrahedron 2015, 26, 961–965. [Google Scholar] [CrossRef]
- Sohn, Y. Structural and spectroscopic characteristics of terbium hydroxide/oxide nanorods and plates. Ceram. Int. 2014, 40, 13803–13811. [Google Scholar] [CrossRef]
- Yang, R.H.; Zhu, J.Z.; Li, Y.L.; Zhang, H. A study on the preparation of regular multiple micro-electrolysis filler and the application in pretreatment of oil refinery wastewater. Int. J. Environ. Res. Public Health 2016, 13, 457. [Google Scholar] [CrossRef] [PubMed]
- Zheng, B.; Li, M.; Gao, G.; He, Y.; Walsh, P.J. Palladium-catalyzed α-arylation of methyl sulfonamides with aryl chlorides. Adv. Synth. Catal. 2016, 358, 2156–2162. [Google Scholar] [CrossRef] [PubMed]
- Ding, F.; Wang, M.L.; Zhang, S.X.; Ai, X.Z. Changes in SBPase activity influence photosynthetic capacity, growth, and tolerance to chilling stress in transgenic tomato plants. Sci. Rep. 2016, 6, 32741–32755. [Google Scholar] [CrossRef] [PubMed]
- Yang, X.; Kim, B.S.; Li, M.; Walsh, P.J. Palladium-catalyzed selective alpha-alkenylation of pyridylmethyl ethers with vinyl bromides. Org. Lett. 2016, 18, 2371–2374. [Google Scholar] [CrossRef] [PubMed]
- Bessonneau, V.; Thomas, O. Assessment of exposure to alcohol vapor from alcohol-based hand rubs. Int. J. Environ. Res. Public Health 2012, 9, 868–879. [Google Scholar] [CrossRef] [PubMed]
- Xu, D.; Wang, Q.Y.; Yang, T.; Cao, J.Z.; Lin, Q.L.; Yuan, Z.Q.; Li, L. Polyethyleneimine capped silver nanoclusters as efficient antibacterial agents. Int. J. Environ. Res. Public Health 2016, 13, 334. [Google Scholar] [CrossRef] [PubMed]
- Lakowicz, J.R. On spectral relaxation in proteins. Photochem. Photobiol. 2000, 72, 421–437. [Google Scholar] [CrossRef]
- Li, M.; Gutierrez, O.; Berritt, S.; Pascual-Escudero, A.; Yeşilçimen, A.; Yang, X.; Adrio, J.; Huang, G.; Nakamaru-Ogiso, E.; Kozlowski, M.C.; et al. Transition-metal-free chemo- and regioselective vinylation of azaallyls. Nat. Chem. 2017, 9, 997–1004. [Google Scholar] [CrossRef] [PubMed]
- Chen, Y.C.; Wang, H.M.; Niu, Q.X.; Ye, D.Y.; Liang, G.W. Binding between saikosaponin C and human serum albumin by fluorescence spectroscopy and molecular docking. Molecules 2016, 21, 153. [Google Scholar] [CrossRef] [PubMed]
- Handing, K.B.; Shabalin, I.G.; Szlachta, K.; Majorek, K.A.; Minor, W. Crystal structure of equine serum albumin in complex with cetirizine reveals a novel drug binding site. Mol. Immunol. 2016, 71, 143–151. [Google Scholar] [CrossRef] [PubMed]
- Forster, M.T.; Hoecker, A.C.; Kang, J.S.; Quick, J.; Seifert, V.; Hattingen, E.; Hilker, R.; Weise, L.M. Does navigated transcranial stimulation increase the accuracy of tractography? A prospective clinical trial based on intraoperative motor evoked potential monitoring during deep brain stimulation. Neurosurgery 2015, 76, 766–775. [Google Scholar] [CrossRef] [PubMed]
- Ross, P.D.; Conway, J.F.; Cheng, N.Q.; Dierkes, L.; Firek, B.A.; Hendrix, R.W.; Steven, A.C.; Duda, R.L. A free energy cascade with locks drives assembly and maturation of bacteriophage HK97 capsid. J. Mol. Biol. 2006, 364, 512–525. [Google Scholar] [CrossRef] [PubMed]
- Sessions, R.B.; Thomas, G.L.; Parker, M.J. Water as a conformational editor in protein folding. J. Mol. Biol. 2004, 343, 1125–1133. [Google Scholar] [CrossRef] [PubMed]
- Peng, W.; Ding, F.; Peng, Y.K.; Jiang, Y.T.; Zhang, L. Binding patterns and structure-affinity relationships of food azo dyes with lysozyme: A multitechnique approach. J. Agric. Food Chem. 2013, 61, 12415–12428. [Google Scholar] [CrossRef] [PubMed]
- Duan, Y.Q.; Lei, H.G.; Min, S.G.; Duan, Z.Q. Spectroscopic study on interaction of rodenticide brodifacoum with bovine serum albumin. Spectrosc. Spect. Anal. 2009, 29, 2998–3002. [Google Scholar]
- Ding, F.; Huang, J.L.; Lin, J.; Li, Z.Y.; Liu, F.; Jiang, Z.Q.; Sun, Y. A study of the binding of CI Mordant Red 3 with bovine serum albumin using fluorescence spectroscopy. Dyes Pigment. 2009, 82, 65–70. [Google Scholar] [CrossRef]
- Dong, J.H.; Dai, W.T.; Xu, J.R.; Li, S.N. Spectral estimation model construction of heavy metals in mining reclamation areas. Int. J. Environ. Res. Public Health 2016, 13, 640. [Google Scholar] [CrossRef] [PubMed]
- Zheng, X.X.; Zhao, W.J.; Yan, X.; Shu, T.T.; Xiong, Q.L.; Chen, F.T. Pollution characteristics and health risk assessment of airborne heavy metals collected from Beijing bus stations. Int. J. Environ. Res. Public Health 2015, 12, 9658–9671. [Google Scholar] [CrossRef] [PubMed]
- Purcell, M.; Neault, J.F.; Malonga, H.; Arakawa, H.; Carpentier, R.; Tajmir-Riahi, H.A. Interactions of atrazine and 2,4-D with human serum albumin studied by gel and capillary electrophoresis, and FTIR spectroscopy. Biochim. Biophys. Acta 2001, 1548, 129–138. [Google Scholar] [CrossRef]
- Zhou, X.M.; Lu, W.J.; Su, L.; Shan, Z.J.; Chen, X.G. Binding of phthalate plasticizers to human serum albumin in vitro: A multispectroscopic approach and molecular modeling. J. Agric. Food Chem. 2012, 60, 1135–1145. [Google Scholar] [CrossRef] [PubMed]


| Compound | T (K) | KSV (×104·M−1) | Kq (×1012·M−1·s−1) | R a | SD b |
|---|---|---|---|---|---|
| ATR (280 nm) | 298 | 8.90 | 8.90 | 0.9975 | 0.0226 |
| 307 | 7.12 | 7.12 | 0.9957 | 0.0235 | |
| 316 | 6.66 | 6.66 | 0.9934 | 0.0274 | |
| ATR (295 nm) | 298 | 8.12 | 8.12 | 0.9990 | 0.0147 |
| 307 | 6.83 | 6.83 | 0.9984 | 0.0184 | |
| 316 | 6.07 | 6.07 | 0.9989 | 0.0239 |
| Compound | T (K) | Ka (×104 L mol−1) | n | R a | ΔH (kJ·mol−1) | ΔG (kJ·mol−1) | ΔS (J·mol−1·K−1) |
|---|---|---|---|---|---|---|---|
| ATR (λex = 280 nm) | 298 | 5.33 ± 0.01 | 1.0434 | 0.9986 | −26.97 | ||
| 307 | 5.31 ± 0.03 | 0.9647 | 0.9961 | −1.11 | −27.75 | 86.79 | |
| 316 | 5.21 ± 0.02 | 0.8743 | 0.9949 | −28.54 | |||
| ATR (λex = 295 nm) | 298 | 5.14 ± 0.02 | 0.9874 | 0.9978 | −26.88 | ||
| 307 | 5.13 ± 0.02 | 0.9437 | 0.9965 | −2.63 | −27.62 | 81.39 | |
| 316 | 4.84 ± 0.03 | 0.8256 | 0.9984 | −28.35 |
| Compound | Site Marker | K (×104 L mol−1) | R a |
|---|---|---|---|
| ATR (λex = 280 nm) | Blank | 5.33 ± 0.04 | 0.9986 |
| PB | 5.41 ± 0.02 | 0.9948 | |
| FA | 2.09 ± 0.01 | 0.9972 | |
| Dig | 5.19 ± 0.02 | 0.9831 | |
| ATR (λex = 295 nm) | Blank | 5.14 ± 0.02 | 0.9978 |
| PB | 4.98 ± 0.03 | 0.9932 | |
| FA | 1.93 ± 0.02 | 0.9918 | |
| Dig | 5.17 ± 0.03 | 0.9938 |
| Compound | E (%) | J (cm3 L mol−1) | R0 (nm) | r (nm) |
|---|---|---|---|---|
| ATR (λex = 280 nm) | 5.8739 | 1.6383 × 10⁻¹⁴ | 2.7638 | 4.3871 |
| ATR (λex = 295 nm) | 4.2154 | 1.0895 × 10⁻¹⁴ | 1.9324 | 3.3289 |
| Sample | Secondary Structure (%) | |||
|---|---|---|---|---|
| α-Helix | β-Sheet | β-Turn | Random Coil | |
| HSA | 32.5 | 8.3 | 28.2 | 31.0 |
| HSA + ATR (1:1) | 30.3 | 8.5 | 26.3 | 34.8 |
| HSA + ATR (1:2) | 27.3 | 5.2 | 28.8 | 38.6 |
| Compound | Peak | Peak Position λex/λem (nm/nm) | Stokes Δλ (nm) | Intensity F |
|---|---|---|---|---|
| HSA | Peak 1 | 230/320 | 90 | 594 |
| Peak 2 | 280/330 | 50 | 387 | |
| HSA-ATR | Peak 1 | 230/320 | 90 | 519 |
| Peak 2 | 280/330 | 50 | 321 |
© 2018 by the authors. Licensee MDPI, Basel, Switzerland. This article is an open access article distributed under the terms and conditions of the Creative Commons Attribution (CC BY) license (http://creativecommons.org/licenses/by/4.0/).
Share and Cite
Zhu, M.; Wang, L.; Wang, Y.; Zhou, J.; Ding, J.; Li, W.; Xin, Y.; Fan, S.; Wang, Z.; Wang, Y. Biointeractions of Herbicide Atrazine with Human Serum Albumin: UV-Vis, Fluorescence and Circular Dichroism Approaches. Int. J. Environ. Res. Public Health 2018, 15, 116. https://doi.org/10.3390/ijerph15010116
Zhu M, Wang L, Wang Y, Zhou J, Ding J, Li W, Xin Y, Fan S, Wang Z, Wang Y. Biointeractions of Herbicide Atrazine with Human Serum Albumin: UV-Vis, Fluorescence and Circular Dichroism Approaches. International Journal of Environmental Research and Public Health. 2018; 15(1):116. https://doi.org/10.3390/ijerph15010116
Chicago/Turabian StyleZhu, Meiqing, Lijun Wang, Yu Wang, Jie Zhou, Jie Ding, Wei Li, Yue Xin, Shisuo Fan, Zhen Wang, and Yi Wang. 2018. "Biointeractions of Herbicide Atrazine with Human Serum Albumin: UV-Vis, Fluorescence and Circular Dichroism Approaches" International Journal of Environmental Research and Public Health 15, no. 1: 116. https://doi.org/10.3390/ijerph15010116