The Influence of Spatial Configuration of Residential Area and Vector Populations on Dengue Incidence Patterns in an Individual-Level Transmission Model


Abstract
:1. Introduction
- How does the spatial configuration of buildings influence dengue incidence rates?
- How does the spatial configuration impact serotype-specific dominance?
- How does mosquito population distribution influence dengue infection rates, as well as serotype-specific dominance?
2. Materials and Methods
2.1. Study Area and Data
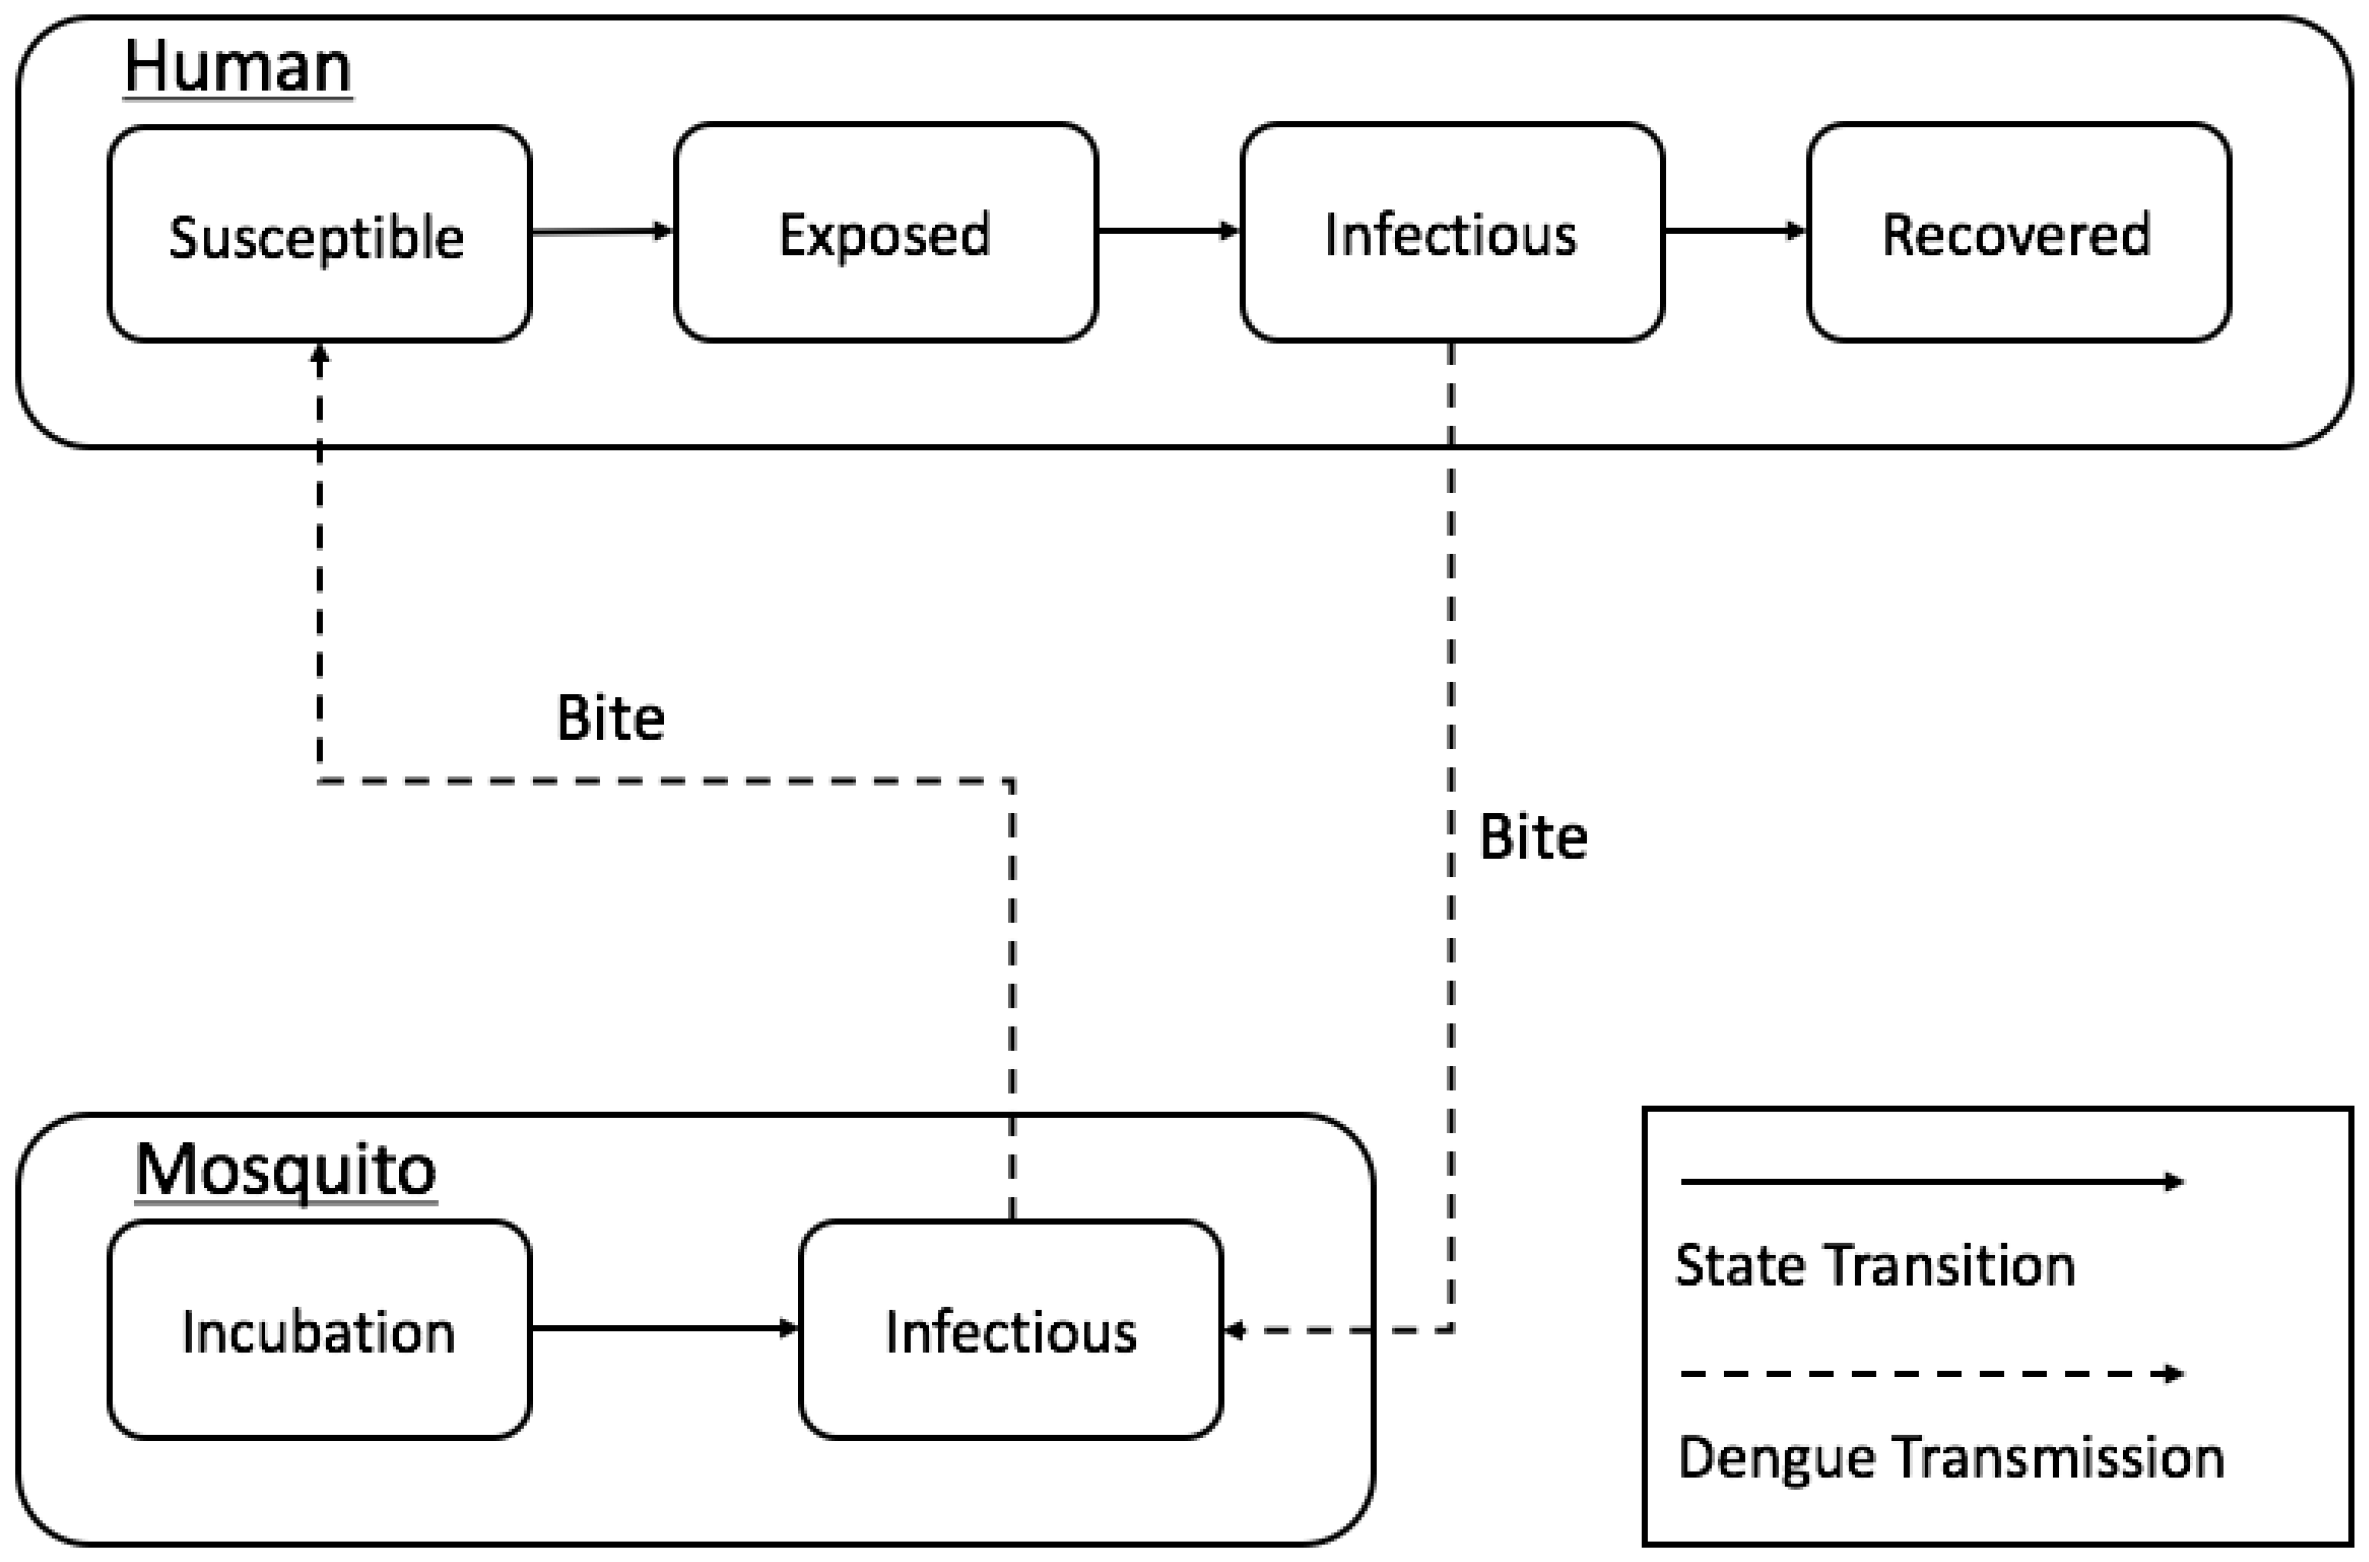
2.2. Conceptual Model
2.3. Agent-Based Model
3. Results
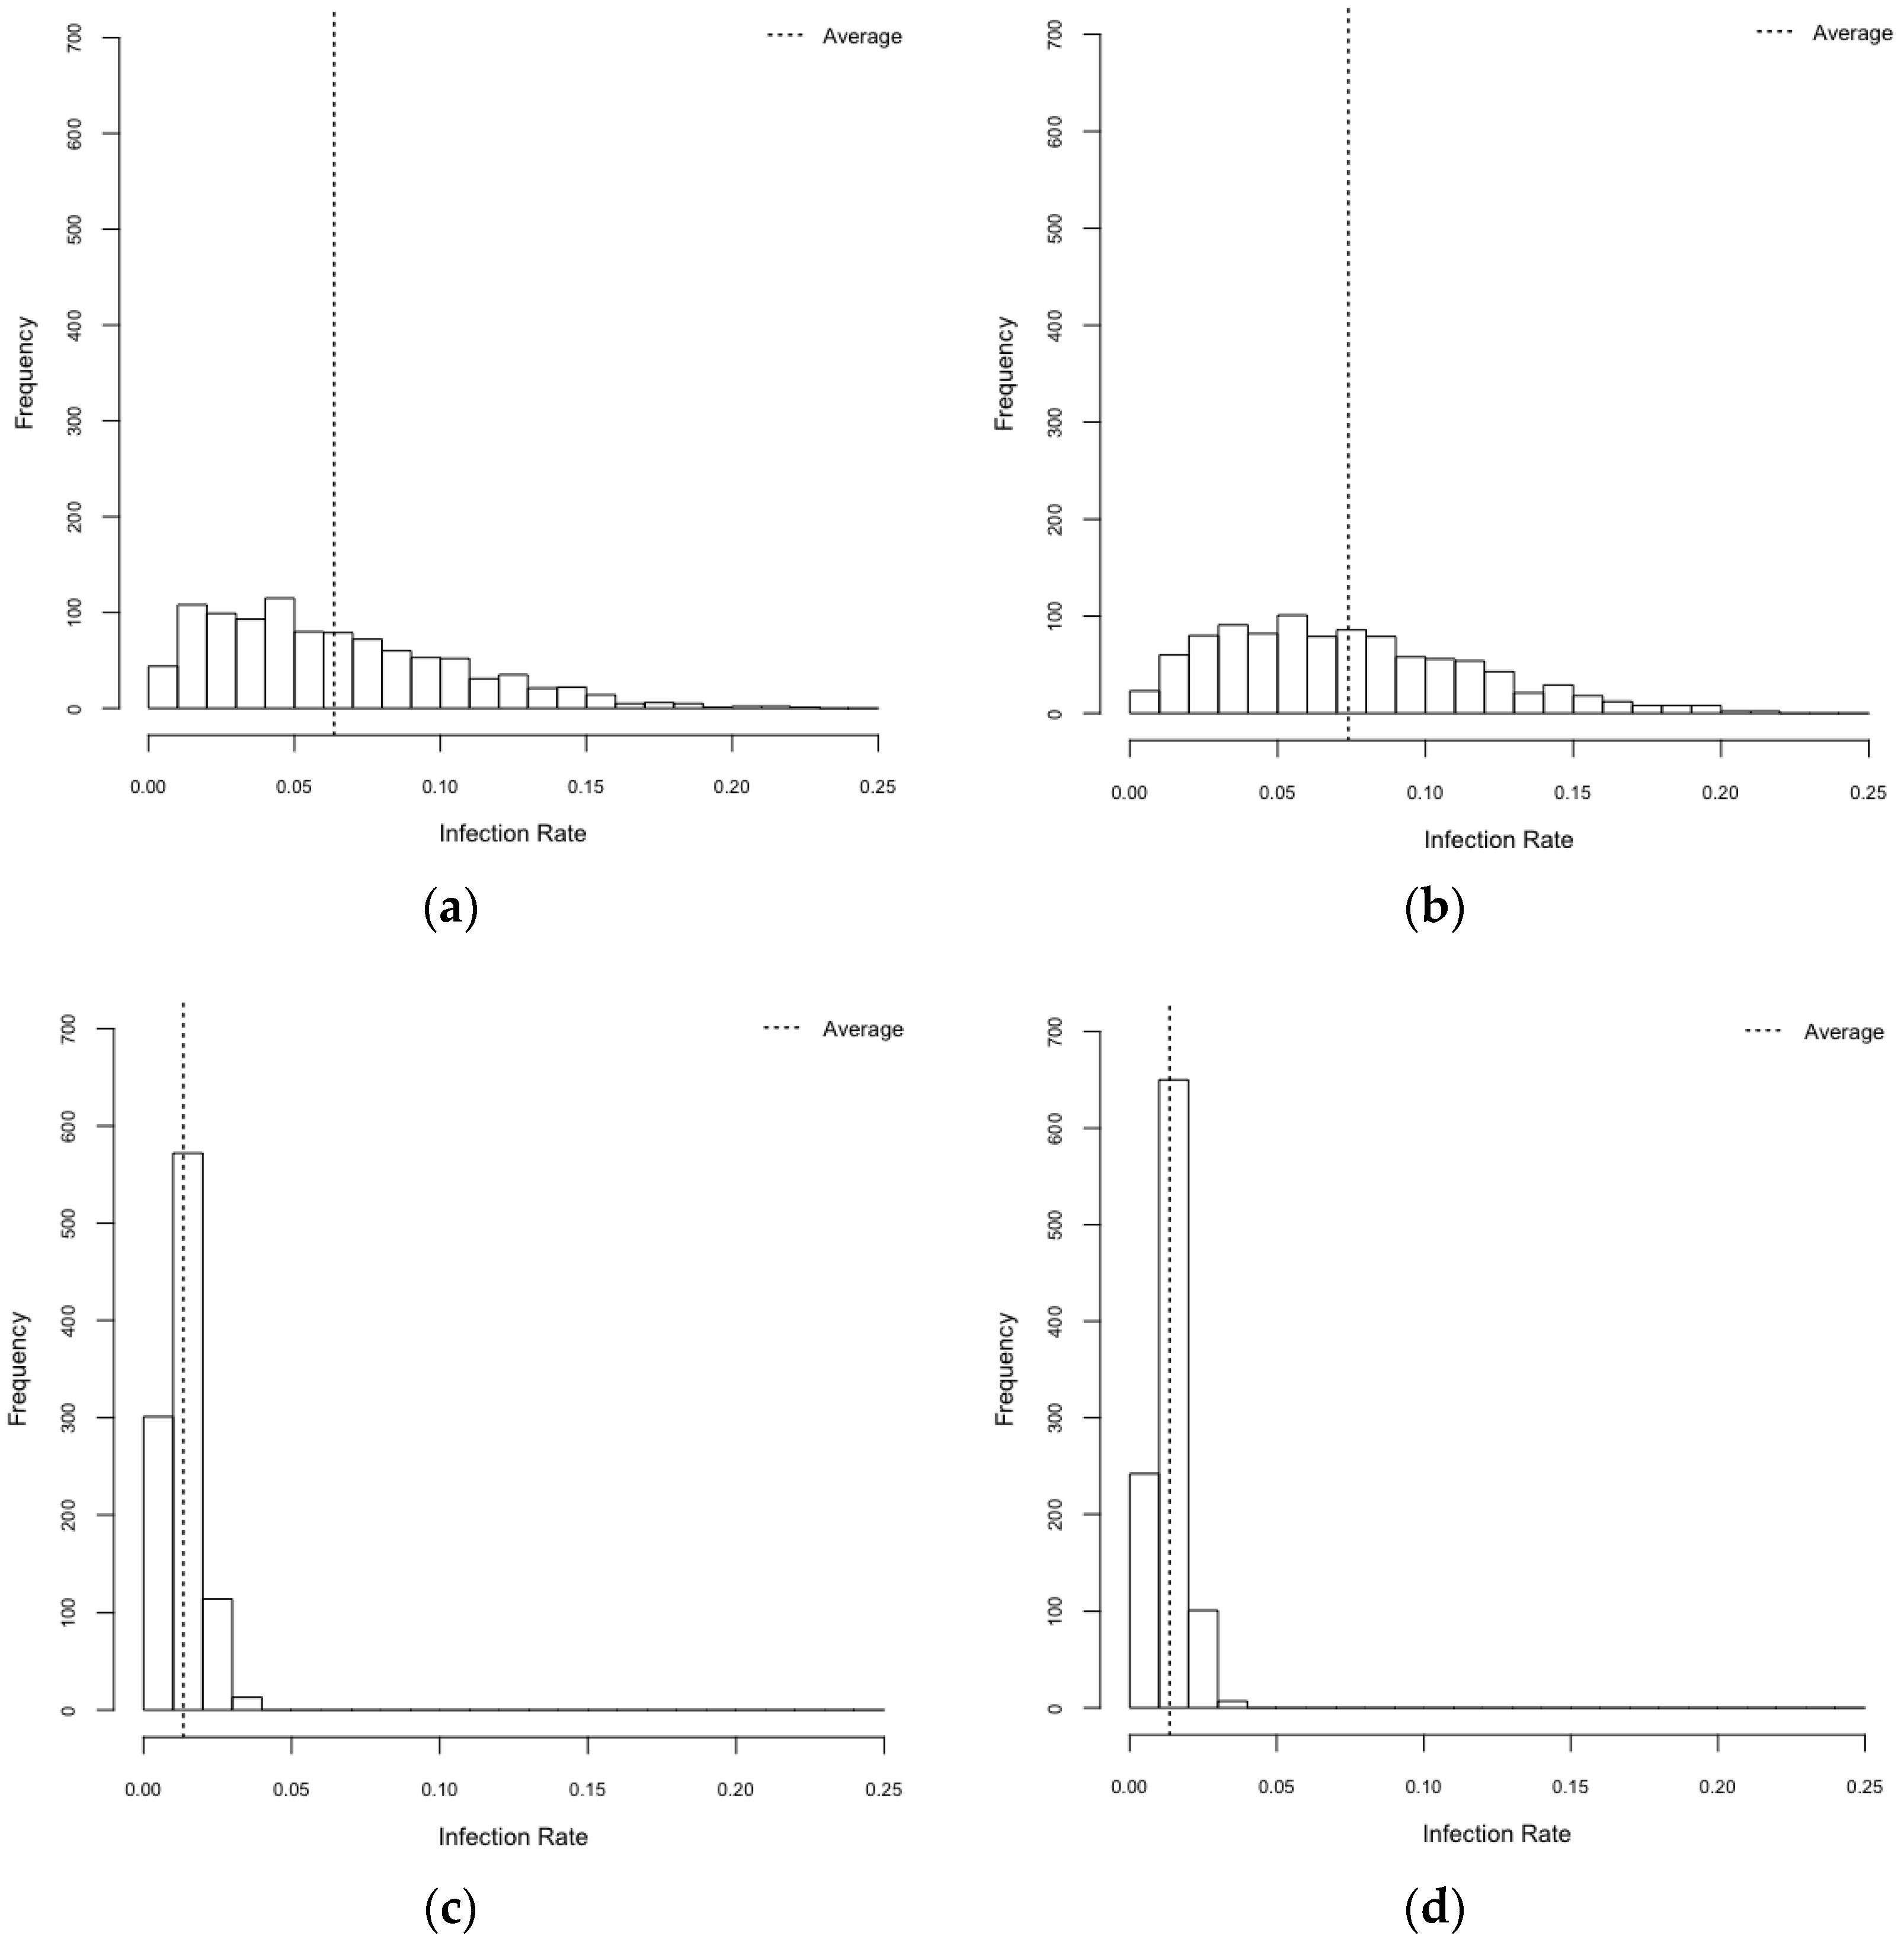
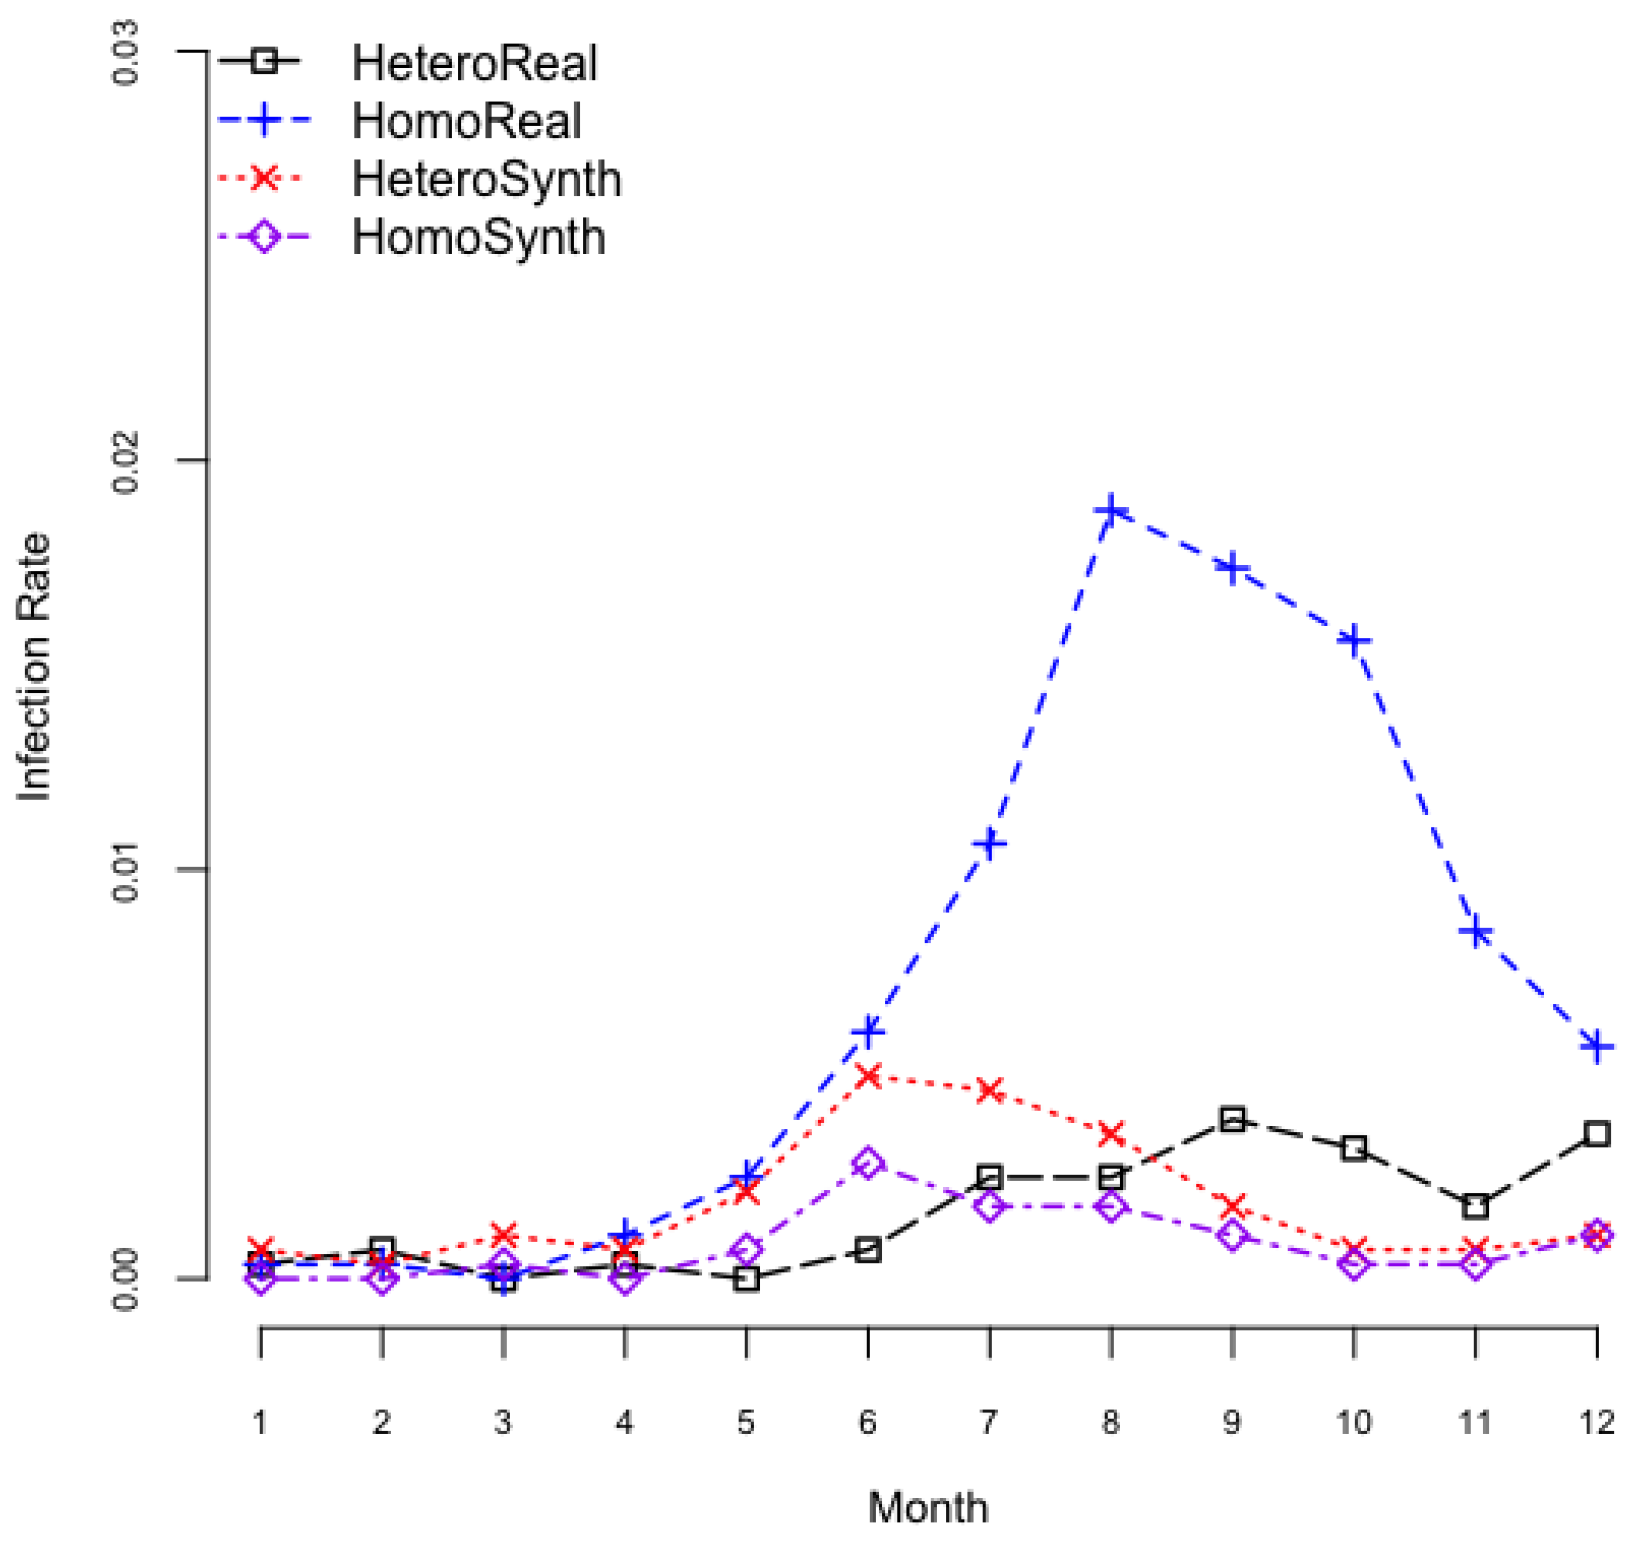
3.1. Exploration on Infectious Rate
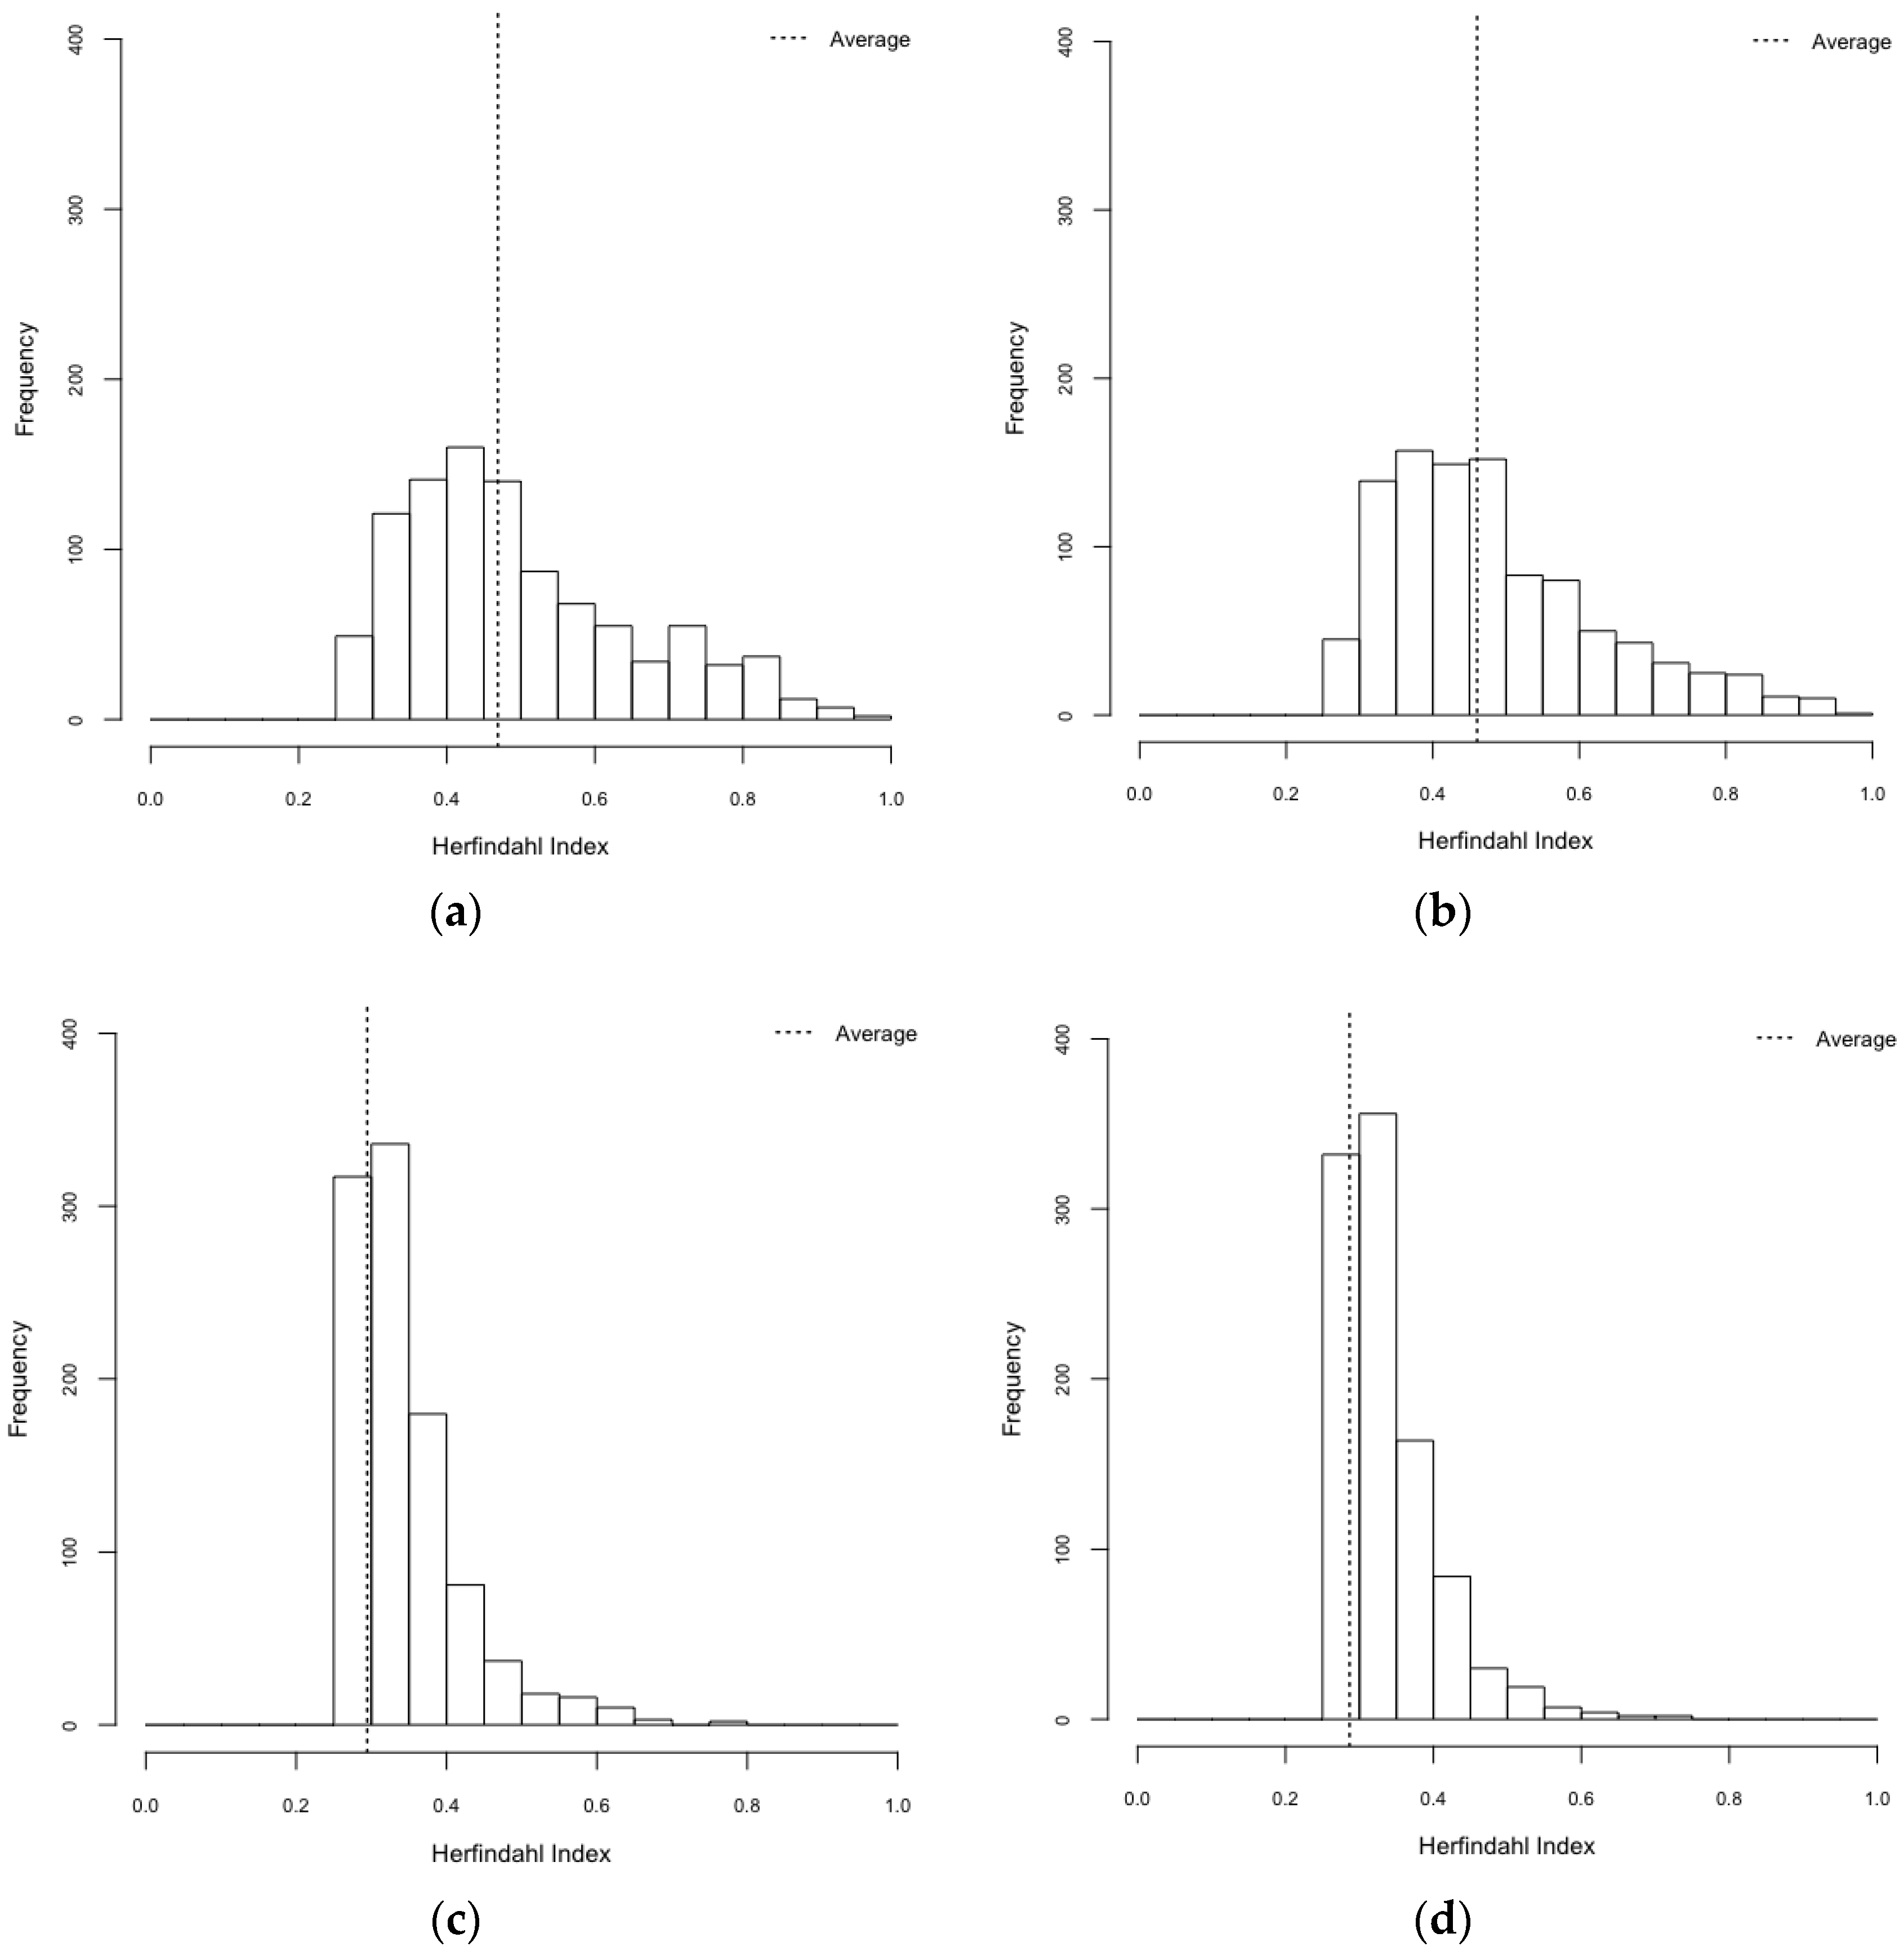
3.2. Exploration on Dengue Serotype Dominance
4. Conclusions
Acknowledgments
Author Contributions
Conflicts of Interest
Abbreviations
| ABM: | Agent-Based Model |
| HeteroReal: | Heterogeneous mosquito population in a realistic spatial configuration |
| HomoReal: | Homogeneous mosquito population in a realistic spatial configuration |
| HeteroSynth: | Heterogeneous mosquito population in a synthetic spatial configuration |
| HomoSynth: | Homogeneous mosquito population in a synthetic spatial configuration |
| ODD: | Overview, Design concepts, and Details |
Appendix A

| Overview | |
|---|---|
| Purpose | To simulate a local-level dengue transmission with four scenarios: (1) HeteroReal, (2) HomoReal, (3) HeteroSynth, and (4) HomoSynth |
| Entities, state variables, and scales | ABM consist of three entities: (1) human, (2) mosquito, and (3) building agents, and each entity has several state variables. |
| (1) Human agent | |
| ● Age | |
| ● Gender | |
| ● Occupation status | |
| ● House location: x-y coordinates | |
| ● School/workplace location: x-y coordinates | |
| ● Current location: x-y coordinates | |
| ● SEIR states for all DENV serotypes | |
| ● Cross immunity state | |
| (2) Mosquito agent | |
| ● Age | |
| ● Serotype | |
| (3) Building agent | |
| ● Type | |
| ● Location: x-y coordinates | |
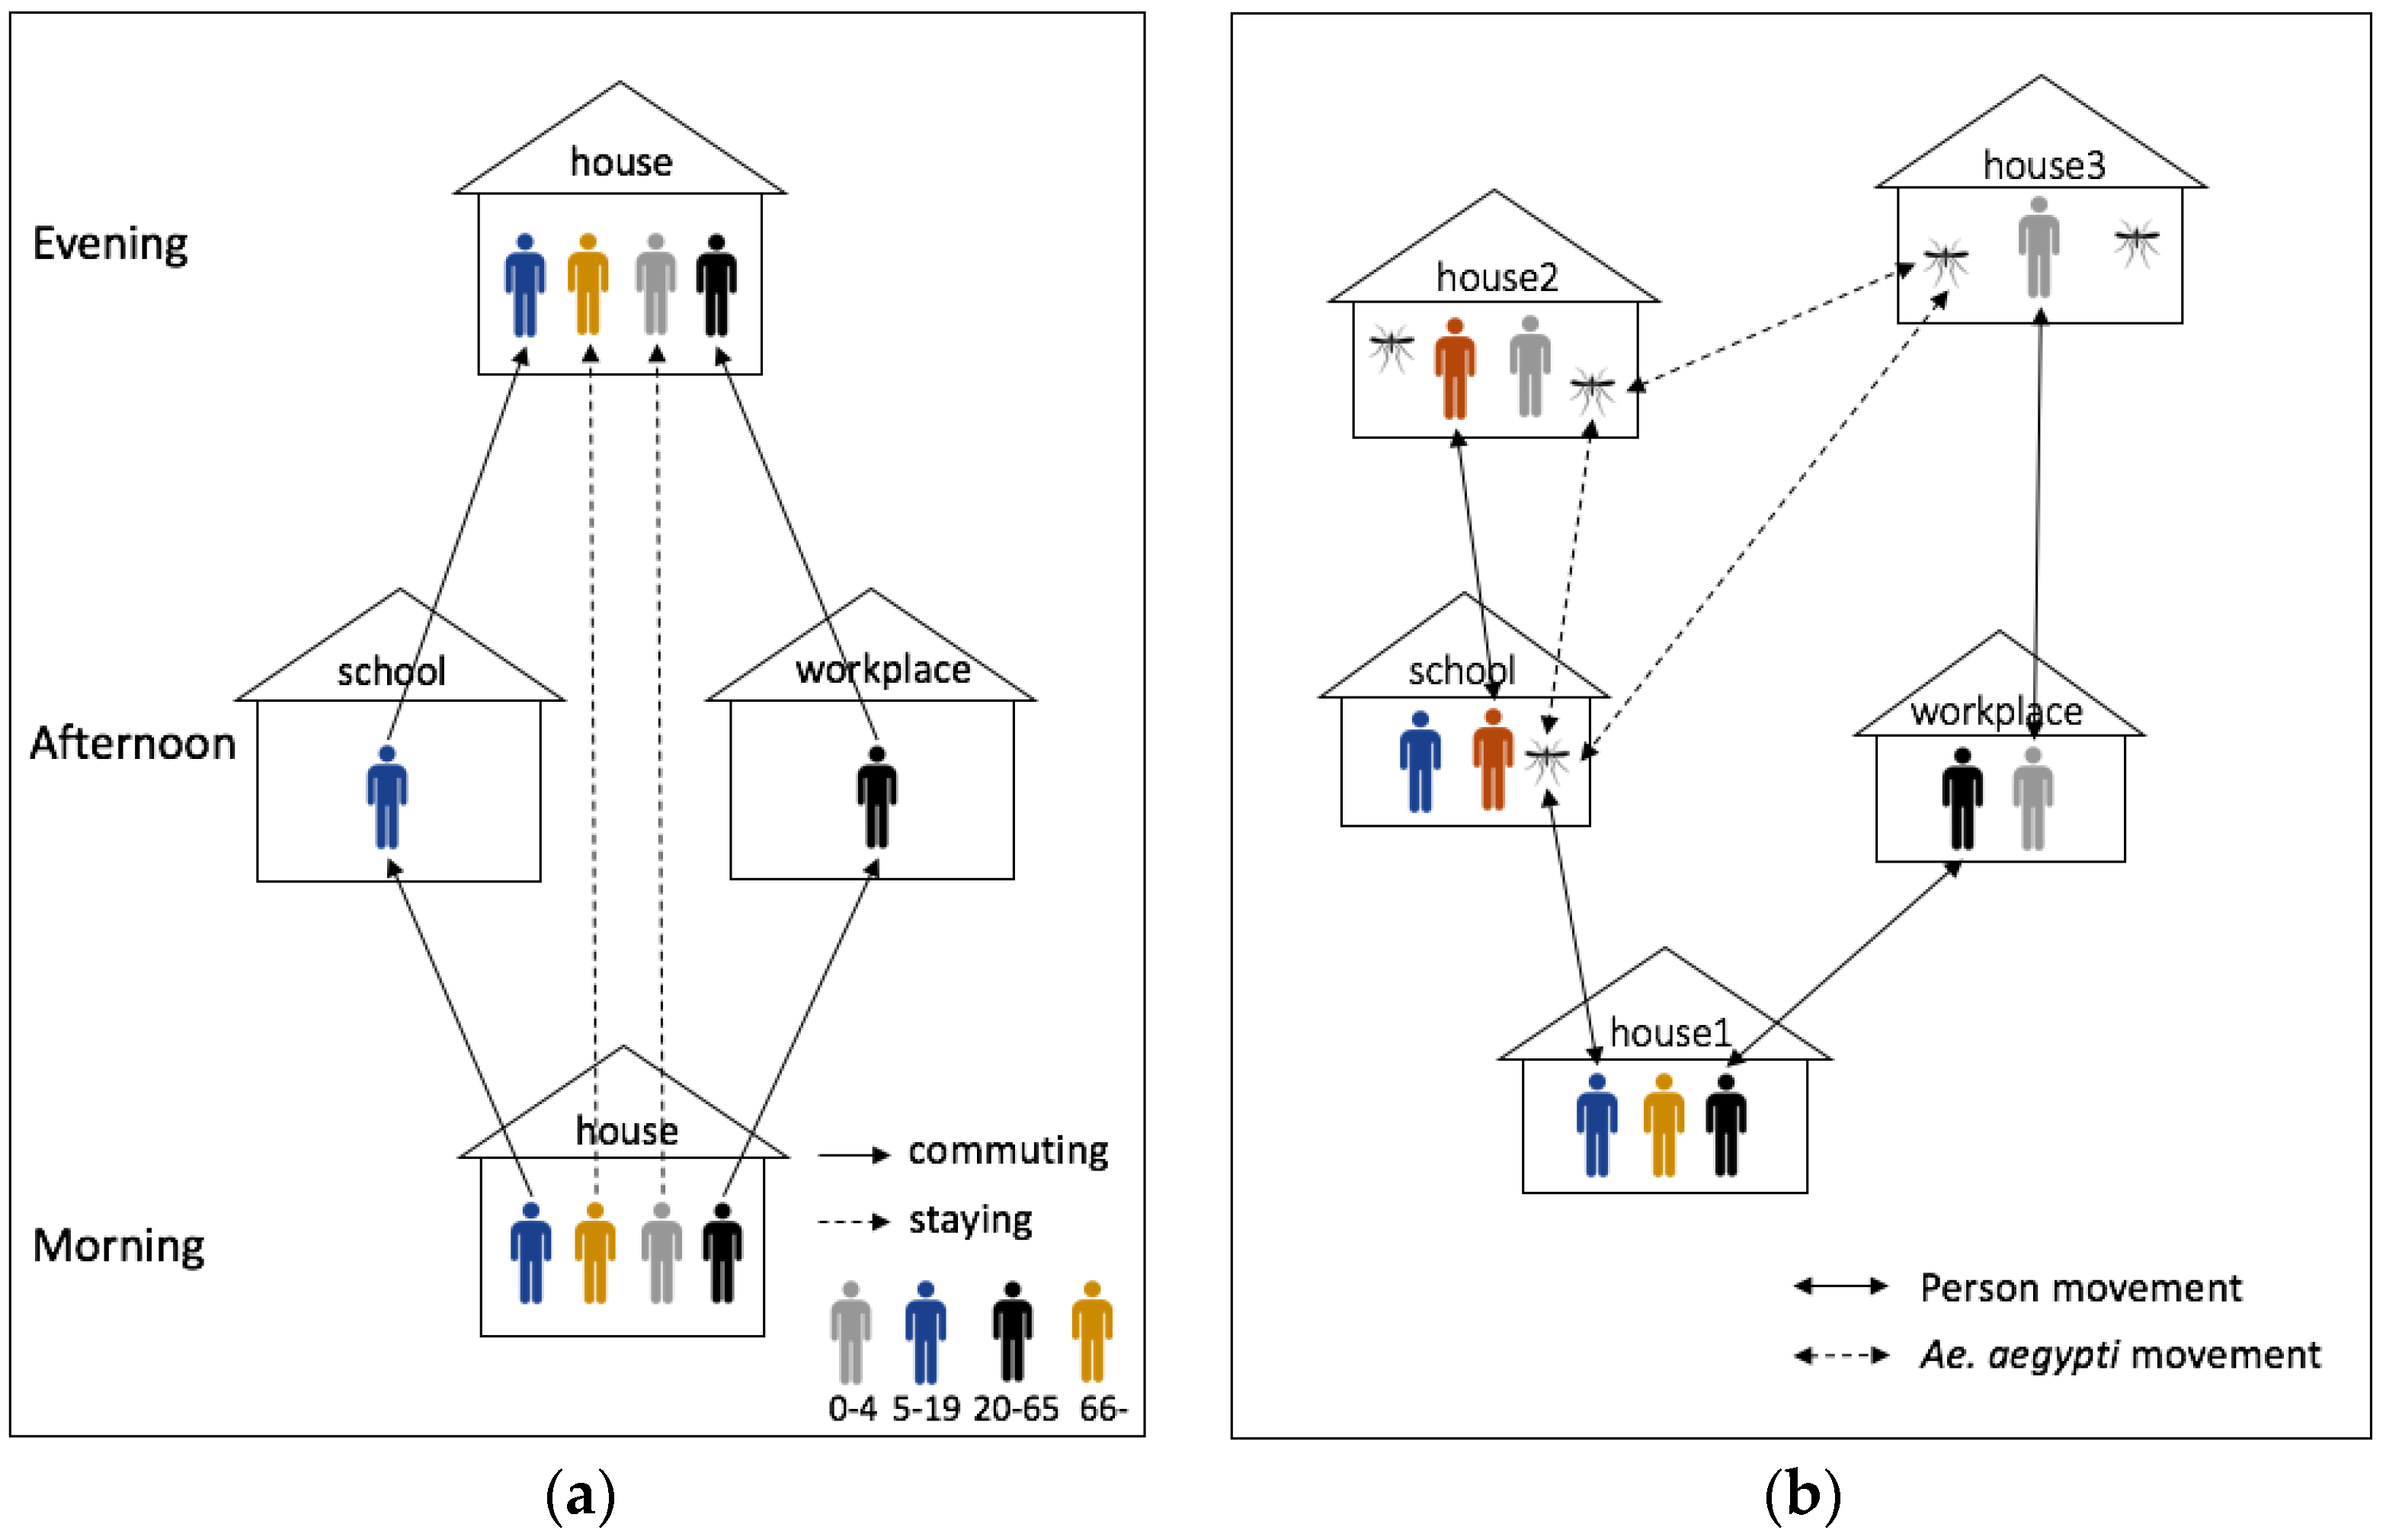
| Process overview and scheduling | (1) Movement |
| ● Human: commuting process: school (aged 5–19) and workplace (aged 20–64) | |
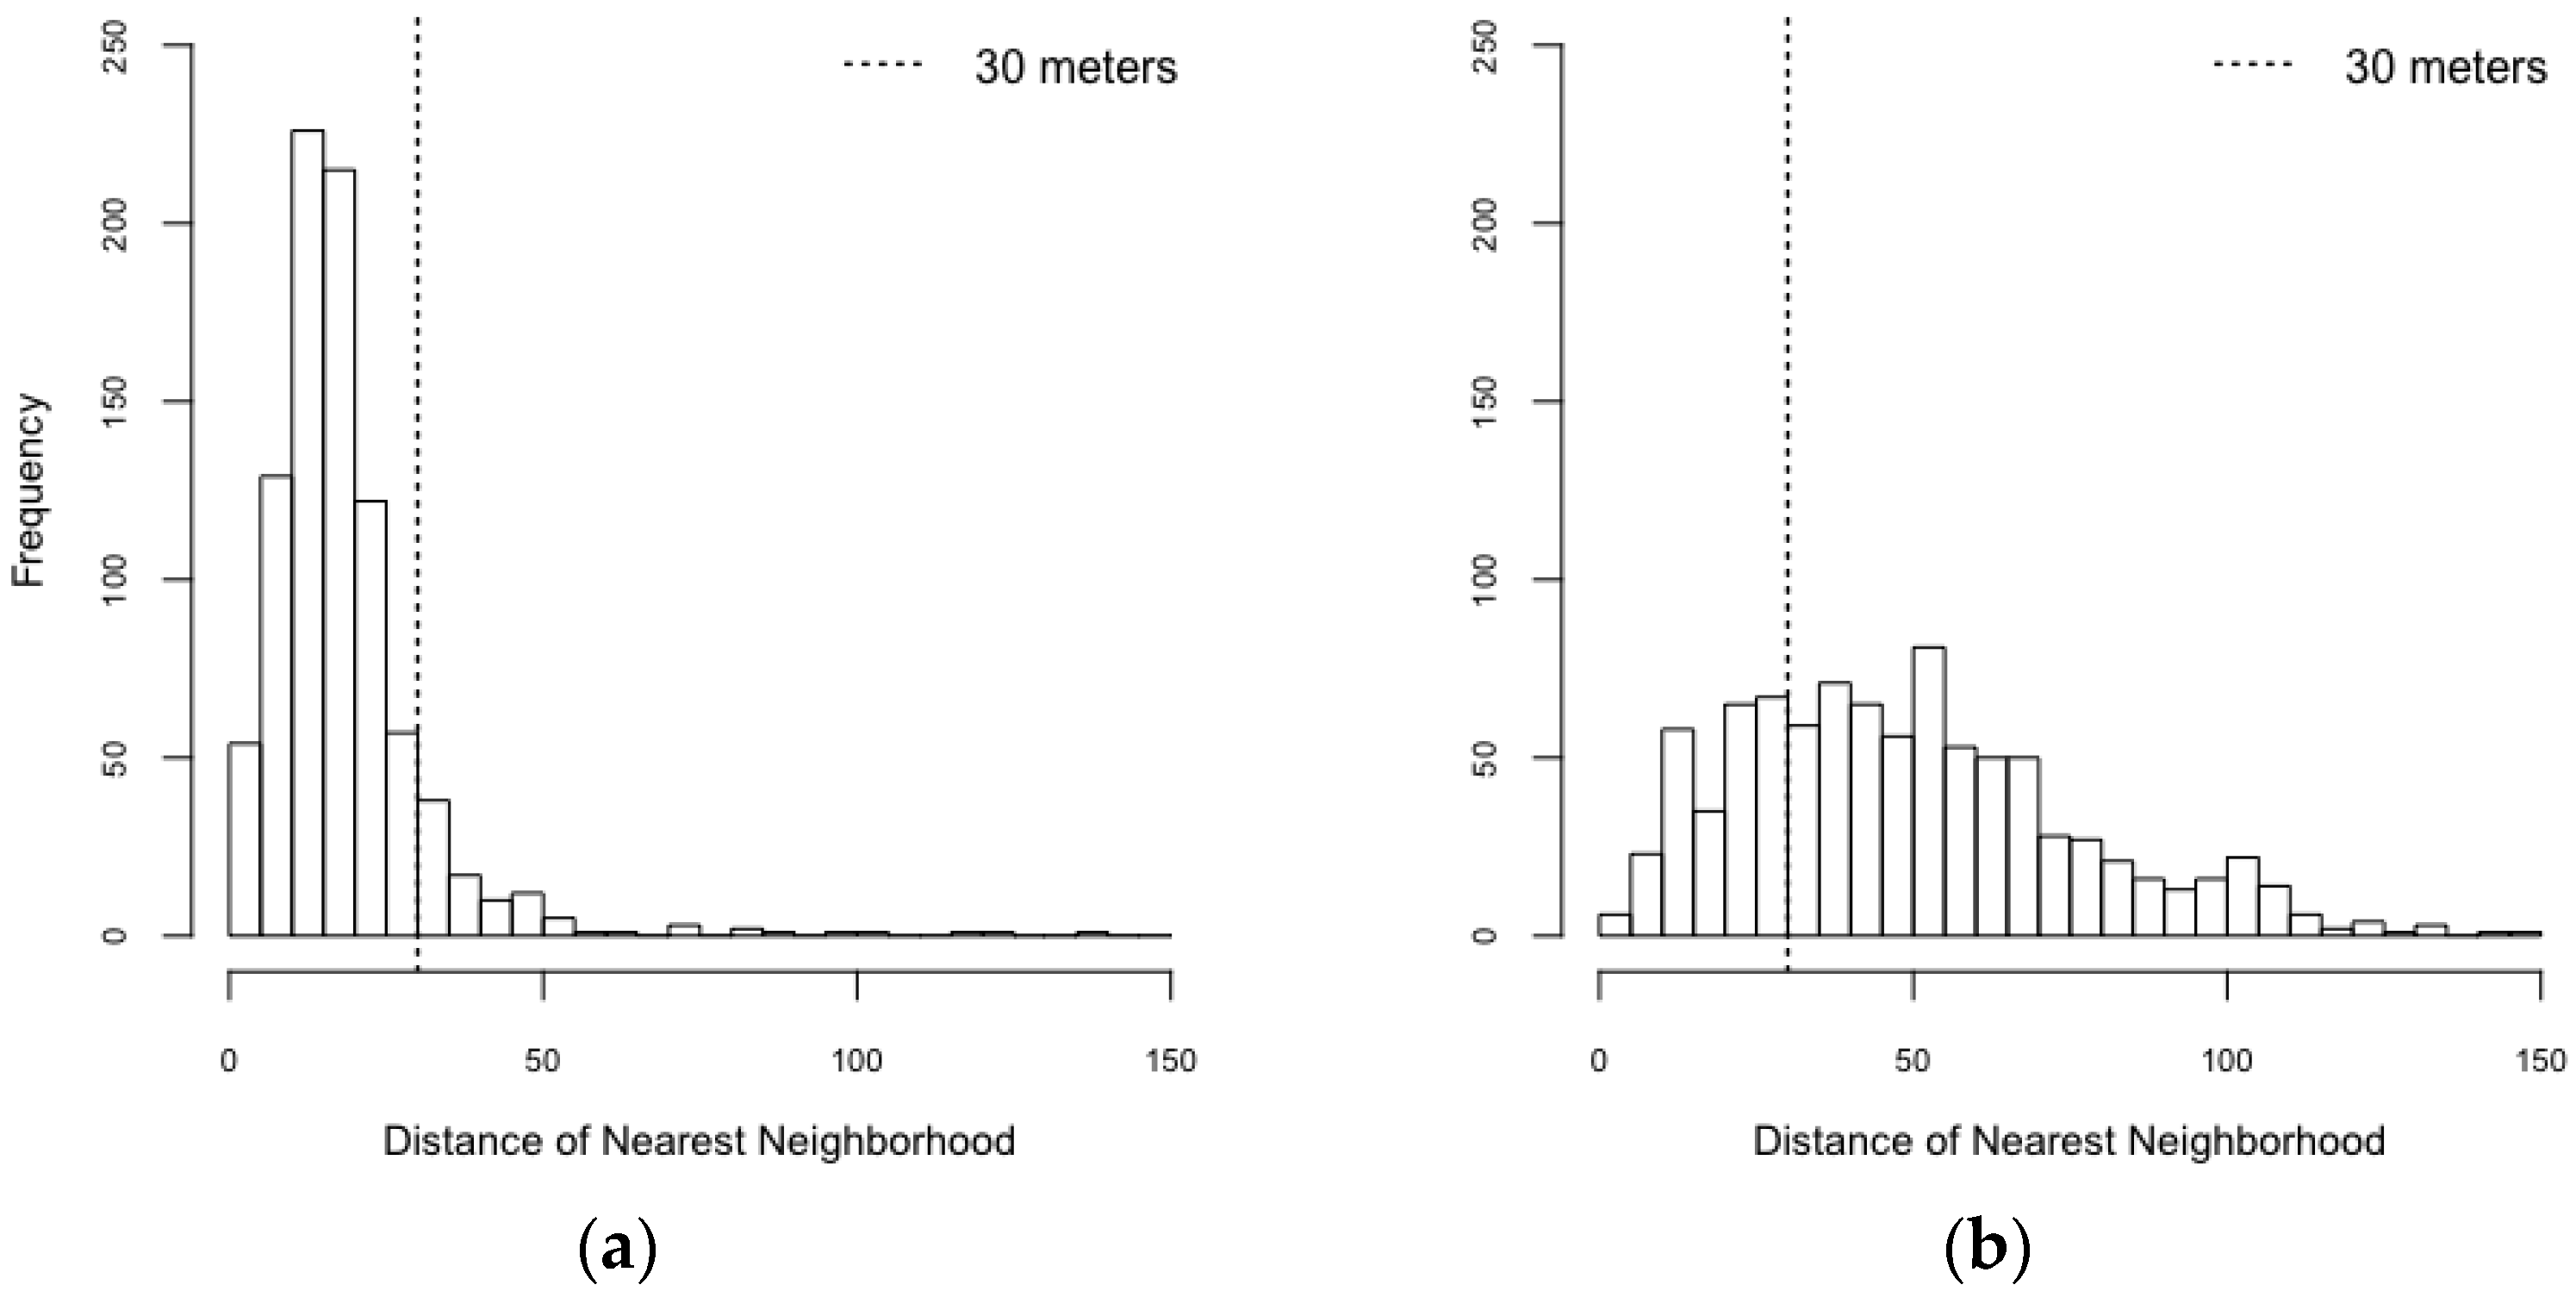
| ● Mosquito: moving around within 30 m (15% of probability) and random locations (1% of probability) | |
| (2) Biting | |
| ● Mosquitoes bite humans with a certain probability. | |
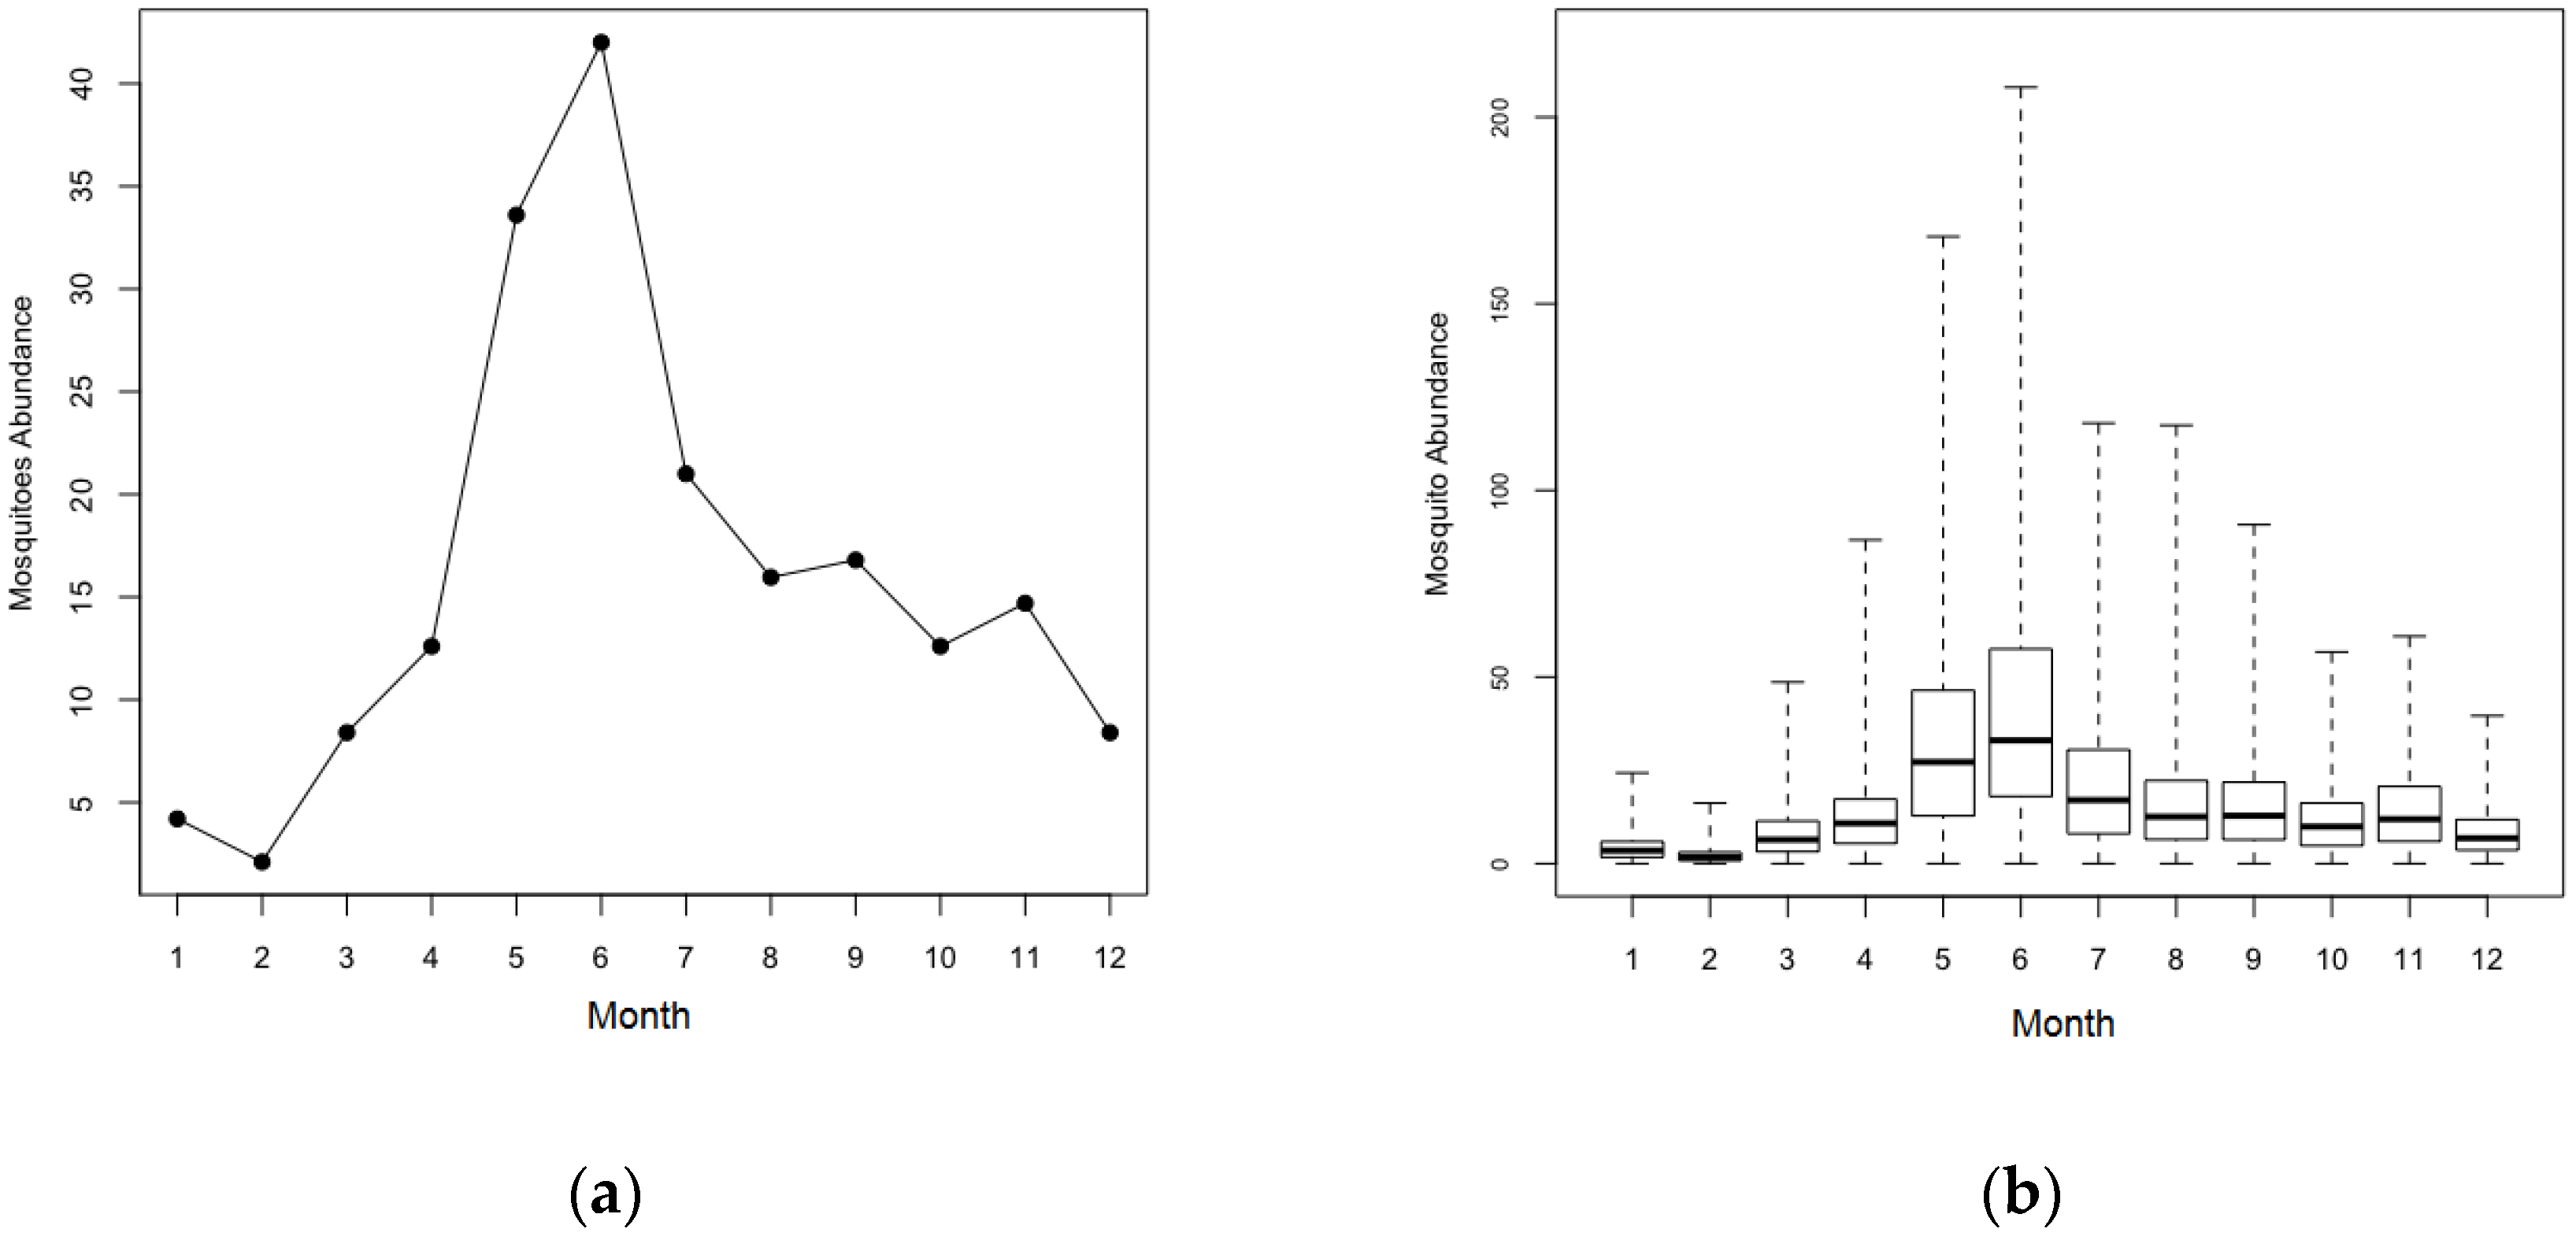
| (3) Seasonal fluctuation of mosquito population | |
| ● The counts of mosquito population vary by month. | |
| Design Concepts | |
| Basic principles | Our model purposes to test hypothesis: (1) in what ways spatial configurations of buildings influence dengue transmission at a local scale; and (2) how the structure of a mosquito population affects dengue transmission at a local scale. |
| The model was implemented based on Chao, Halstead, Halloran and Longini Jr [23]. A considerable difference between our model and Chao, Halstead, Halloran and Longini Jr [23] is the environment. Chao, Halstead, Halloran and Longini Jr [23] built the model based on grid spatial structures at which each grid (30 m2) has only one type of building, but our model represented each building as a point. Therefore, our model can have a finer scale to measure Euclidean distances for mosquito’s movements. | |
| Sensing | Each mosquito senses the neighboring houses to move around and human to bite in all buildings. |
| Interaction | There is an interaction between humans and mosquitoes by biting process of mosquitoes. |
| Details | |
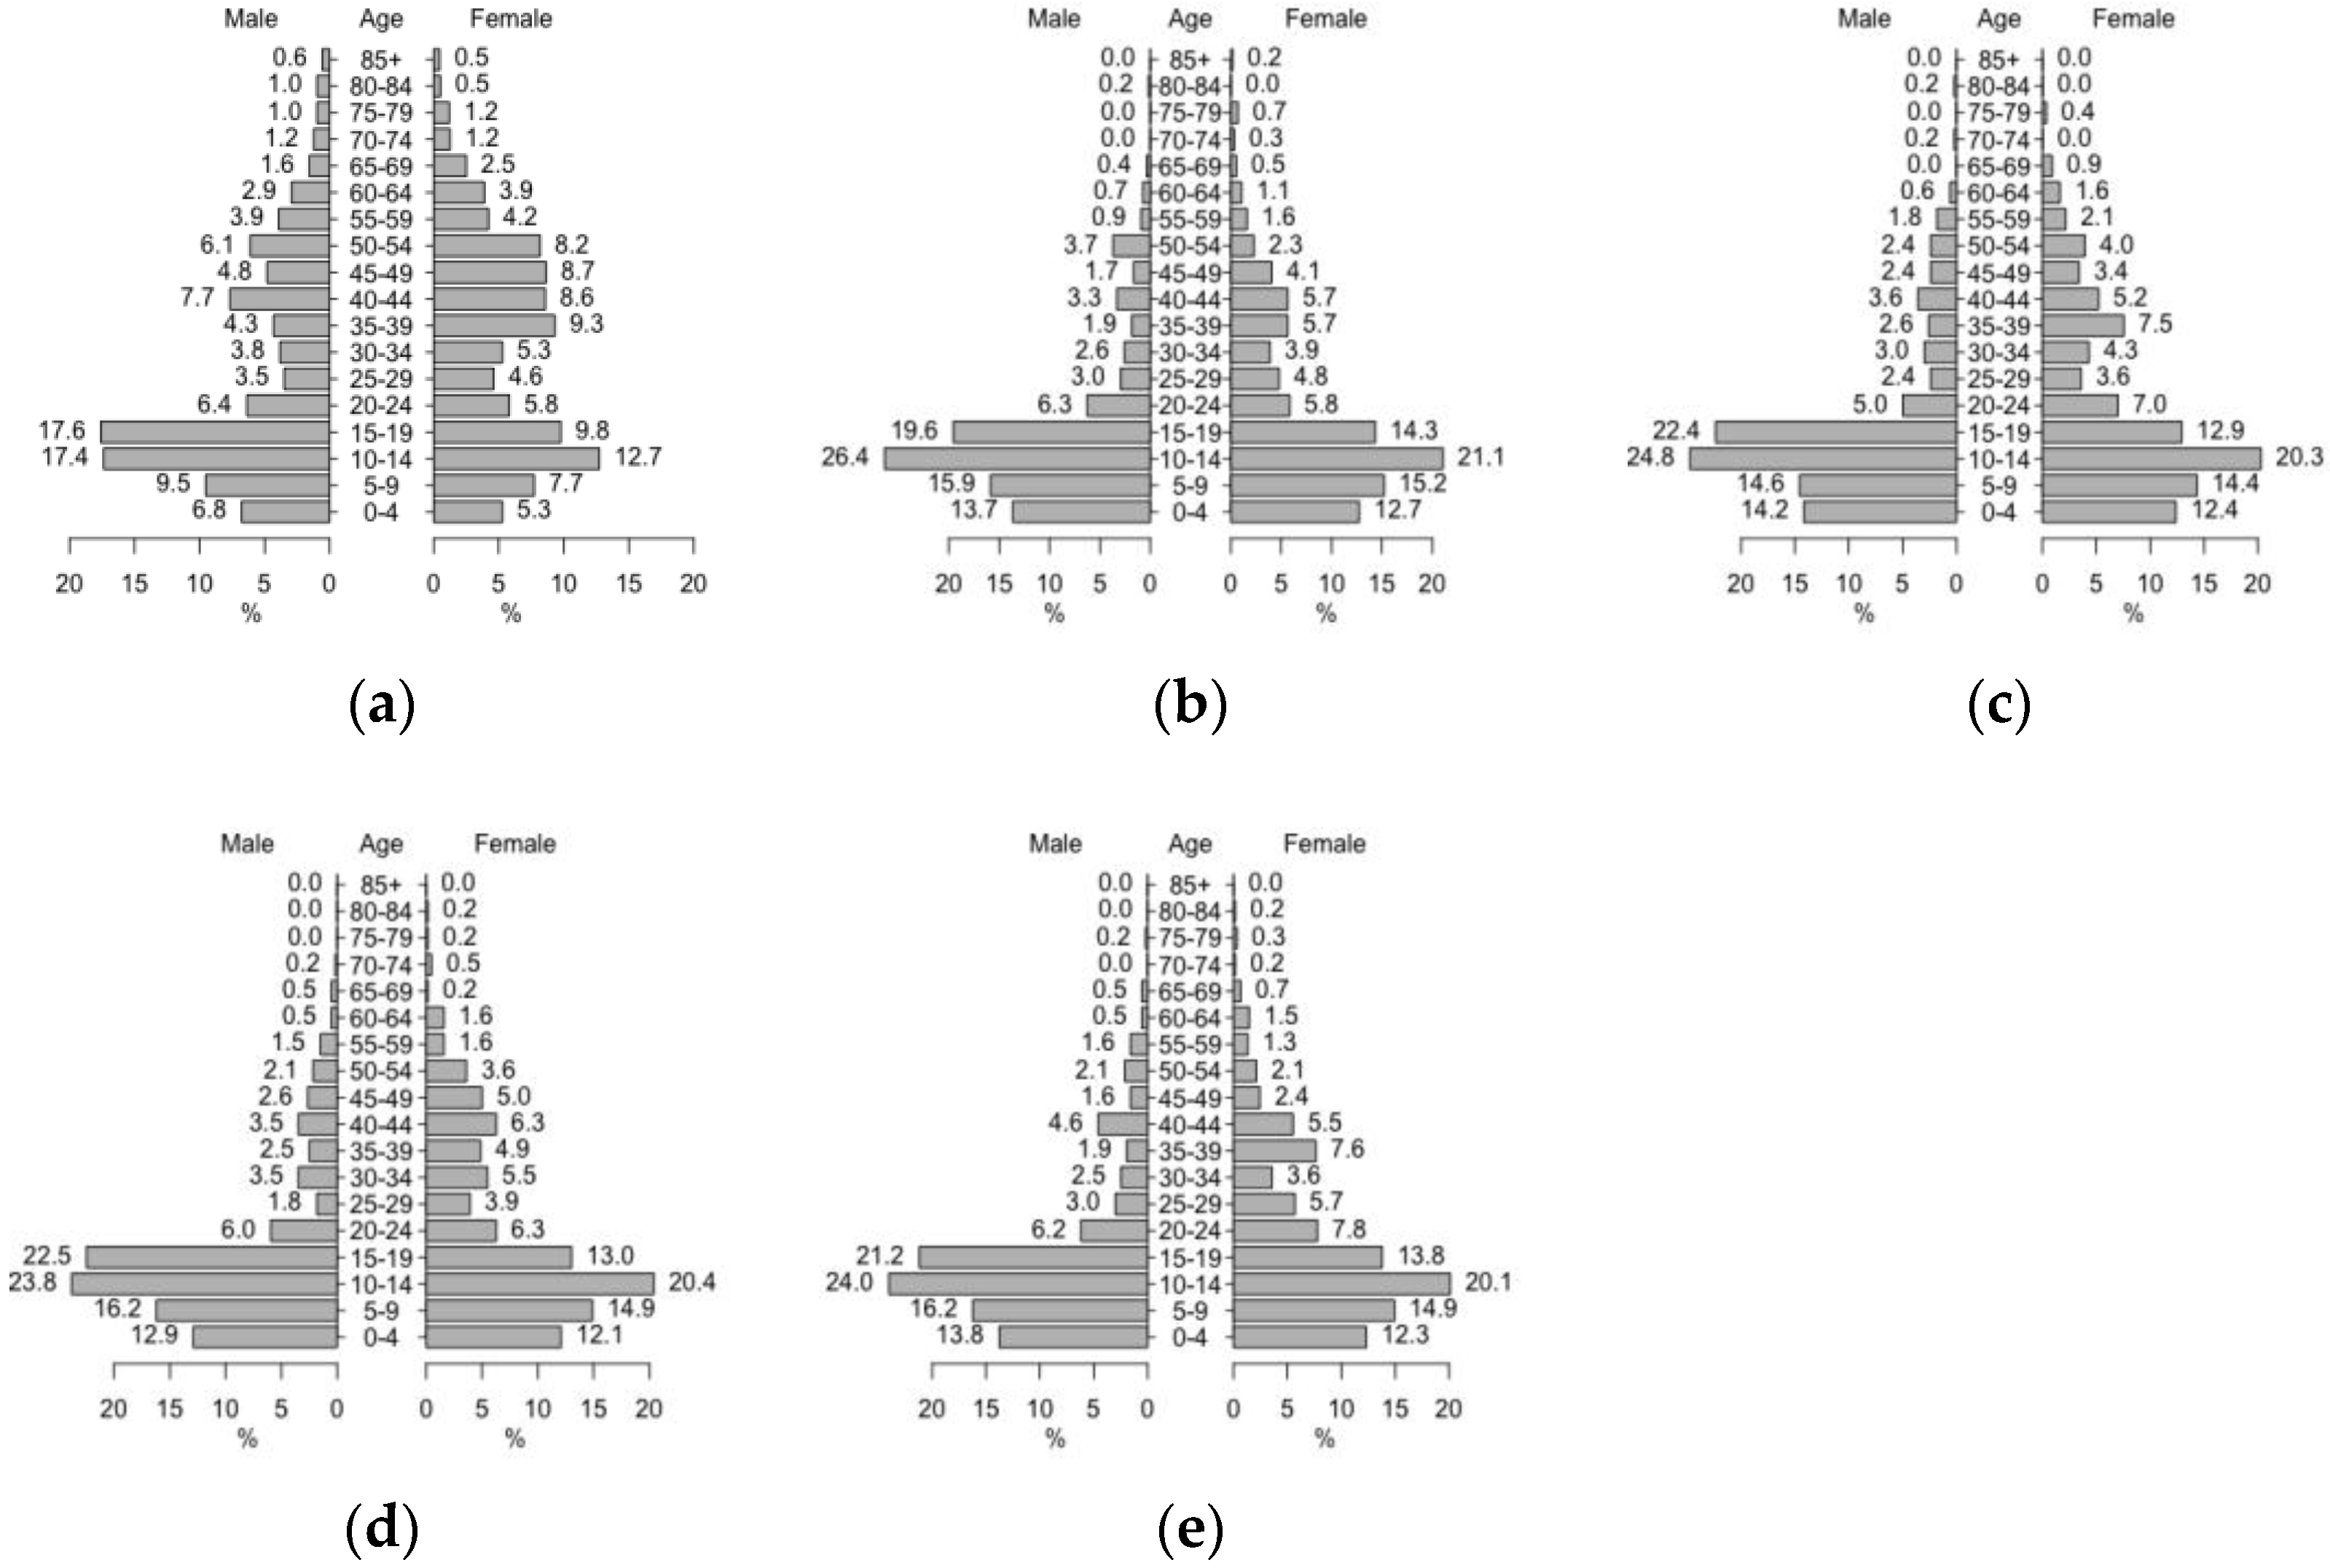
| Initialization | The model synthesizes human population within 895 households. |
| Individual humans’ immune statuses to each serotype are assigned based on their ages with a certain probability (0.14). | |
| For scenarios of heterogeneous mosquito population, the populations are determined by a negative binomial distribution (0.0344, 1.5) where 0.0344 and 1.5 denote the number of failures and the probability of success. | |
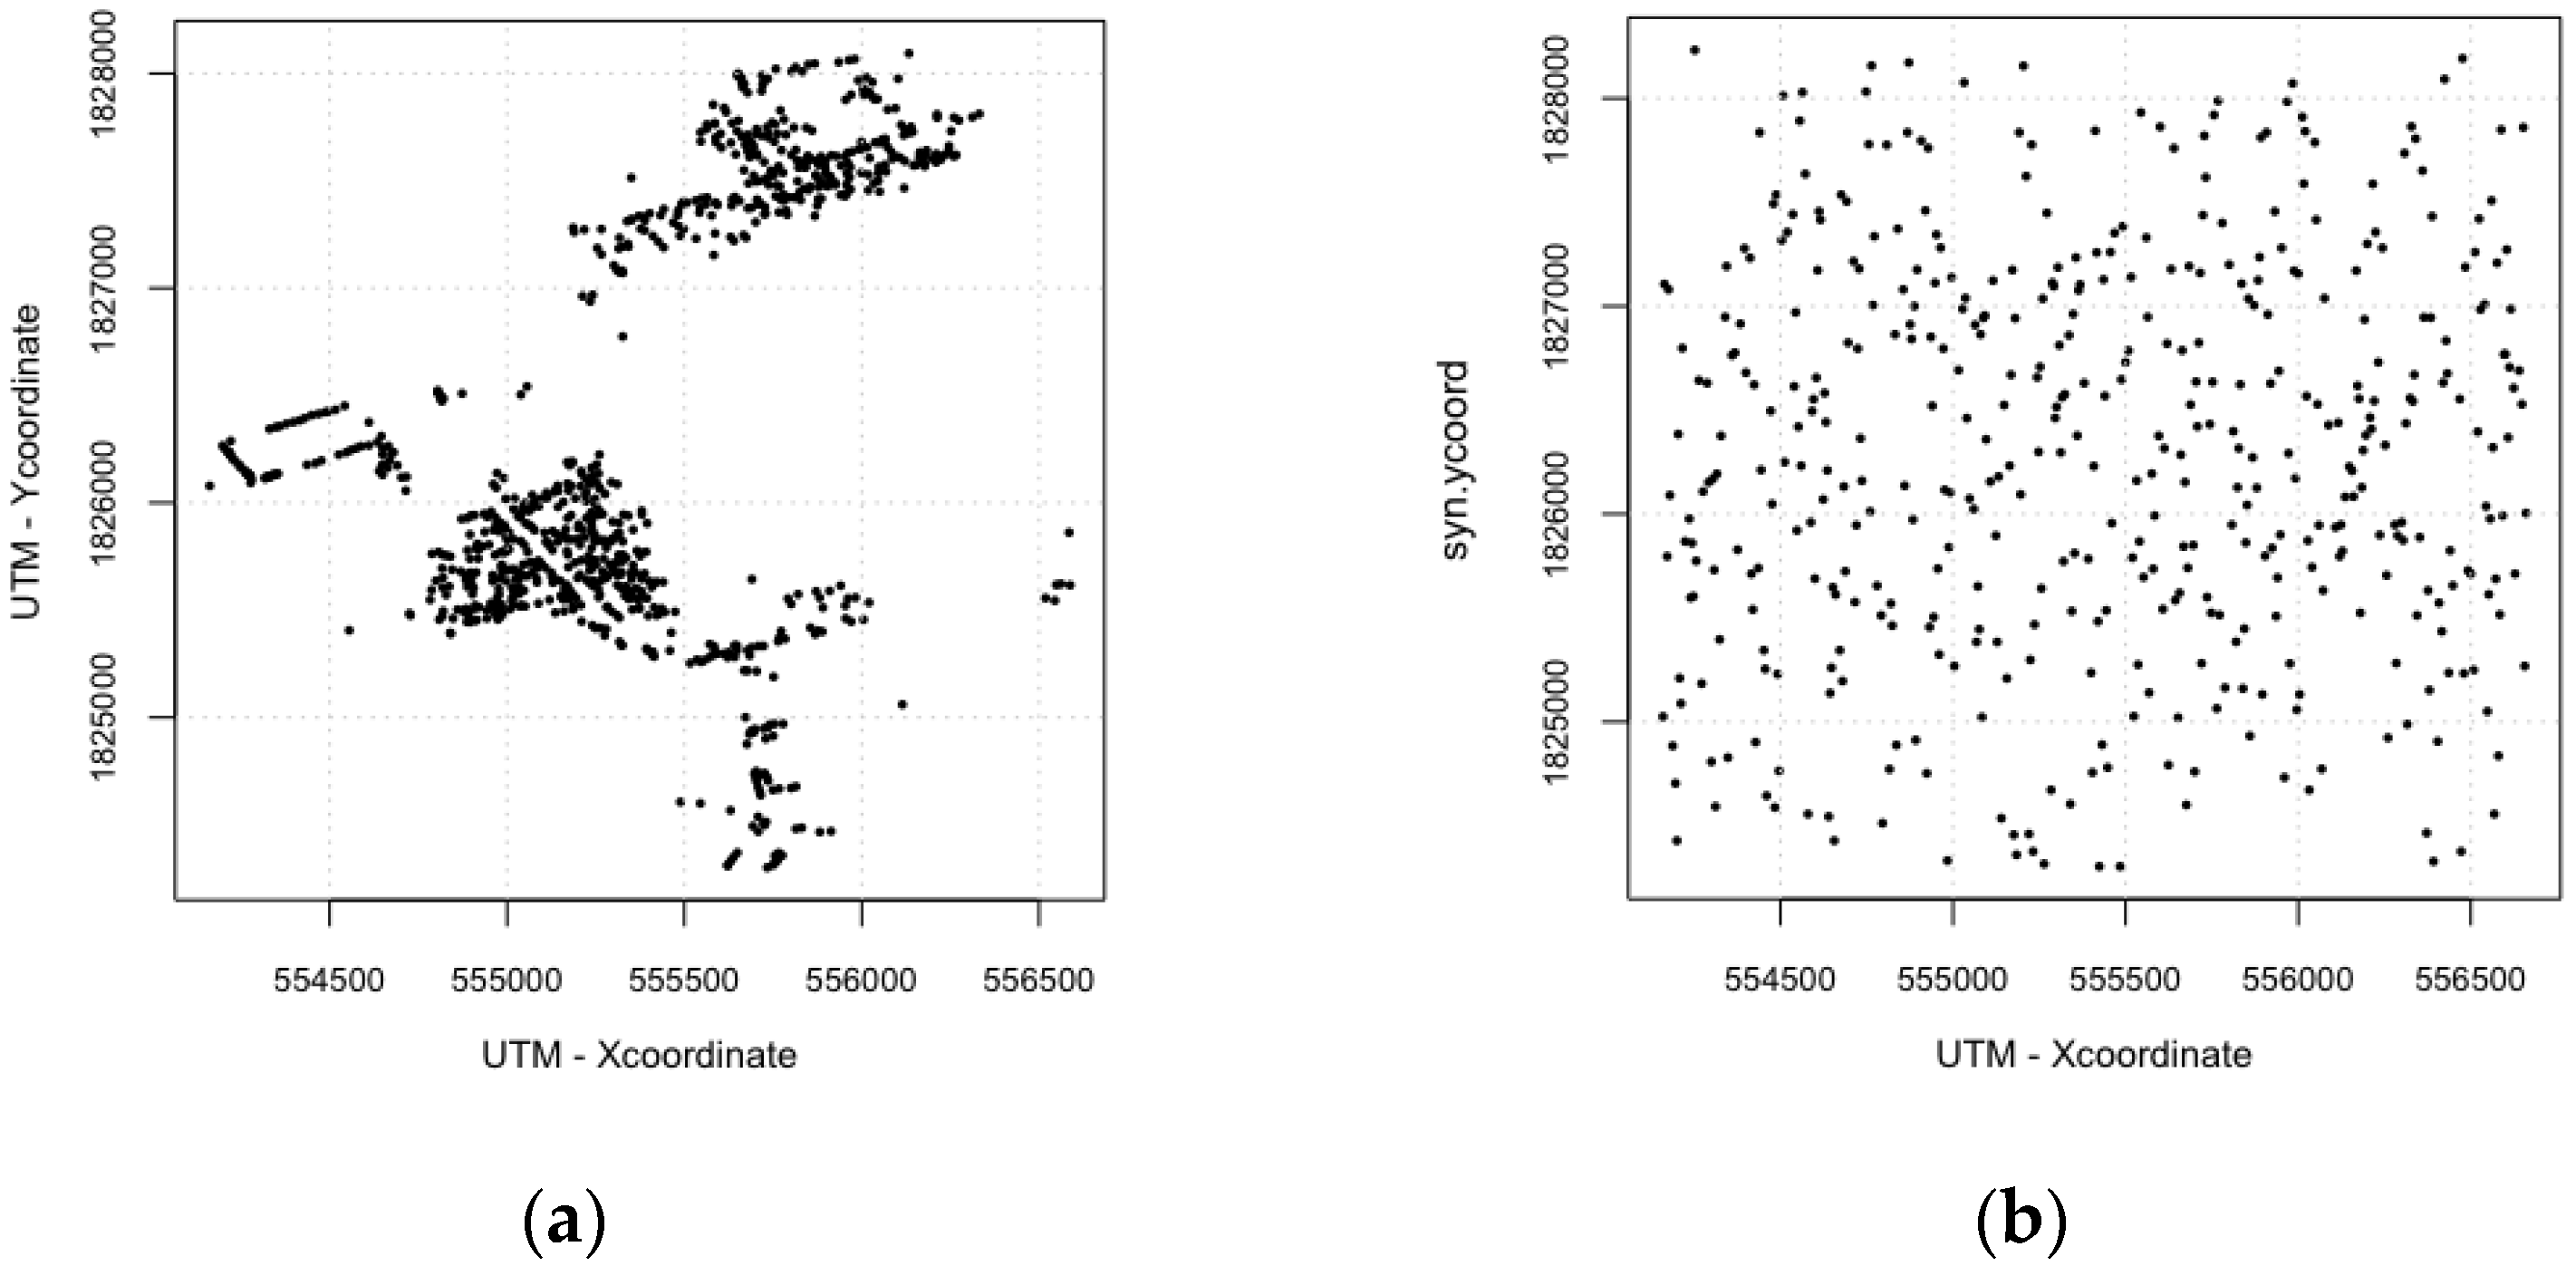
| For scenarios of synthetic environments, all buildings are randomly arranged. | |
| Input data | (1) locations of houses and schools identified from GPS data [32] |
| (2) household census data [32] | |
| Parameters | The parameters of human and mosquito agents were provided in Table 1 and Table 2. |
References
- World Health Organization. Global Strategy for Dengue Prevention and Control 2012–2020; WHO: Geneva, Switzerland, 2012. [Google Scholar]
- Buathong, R.; Iamsiritaworn, S.; Siriarayapon, P.; Panket, P.; Anantapreecha, S.; O’Reilly, M.; Ungchusak, K. Changing epidemiology of dengue infection in Thailand: Evidence from an outbreak investigation in rural villages of Sukhothai province, Thailand, 2006. Wkly. Epidemiol. Surveill. Rep. 2013, 44, S8–S14. [Google Scholar]
- Scott, T.W.; Morrison, A.C. Vector dynamics and transmission of dengue virus: Implications for dengue surveillance and prevention strategies. In Dengue Virus; Springer: Berlin/Heidelberg, Germany, 2010; pp. 115–128. [Google Scholar]
- Cazelles, B.; Chavez, M.; McMichael, A.J.; Hales, S. Nonstationary influence of El Nino on the synchronous dengue epidemics in Thailand. PLoS Med. 2005, 2, e106. [Google Scholar] [CrossRef] [PubMed]
- Fried, J.R.; Gibbons, R.V.; Kalayanarooj, S.; Thomas, S.J.; Srikiatkhachorn, A.; Yoon, I.-K.; Jarman, R.G.; Green, S.; Rothman, A.L.; Cummings, D.A. Serotype-specific differences in the risk of dengue hemorrhagic fever: An analysis of data collected in Bangkok, Thailand from 1994 to 2006. PLoS Negl. Trop. Dis. 2010, 4, e617. [Google Scholar] [CrossRef] [PubMed]
- Thai, K.T.; Cazelles, B.; Van Nguyen, N.; Vo, L.T.; Boni, M.F.; Farrar, J.; Simmons, C.P.; van Doorn, H.R.; de Vries, P.J. Dengue dynamics in Binh Thuan province, southern Vietnam: Periodicity, synchronicity and climate variability. PLoS Negl. Trop. Dis. 2010, 4, e747. [Google Scholar] [CrossRef] [PubMed]
- Chen, S.-C.; Hsieh, M.-H. Modeling the transmission dynamics of dengue fever: Implications of temperature effects. Sci. Total Environ. 2012, 431, 385–391. [Google Scholar] [CrossRef] [PubMed]
- Erickson, R.A.; Presley, S.M.; Allen, L.J.; Long, K.R.; Cox, S.B. A dengue model with a dynamic Aedes albopictus vector population. Ecol. Model. 2010, 221, 2899–2908. [Google Scholar] [CrossRef]
- Halstead, S.B. Dengue virus-mosquito interactions. Annu. Rev. Entomol. 2008, 53, 273–291. [Google Scholar] [CrossRef] [PubMed]
- Pant, C.P.; Yasuno, M. Field studies on the gonotrophic cycle of Aedes aegypti in Bangkok, Thailand. J. Med. Entomol. 1973, 10, 219–223. [Google Scholar] [CrossRef] [PubMed]
- Scott, T.W.; Chow, E.; Strickman, D.; Kittayapong, P.; Wirtz, R.A.; Lorenz, L.H.; Edman, J.D. Blood-feeding patterns of Aedes aegypti (Diptera: Culicidae) collected in a rural Thai village. J. Med. Entomol. 1993, 30, 922–927. [Google Scholar] [CrossRef] [PubMed]
- Hopp, M.J.; Foley, J.A. Global-scale relationships between climate and the dengue fever vector, Aedes aegypti. Clim. Chang. 2001, 48, 441–463. [Google Scholar] [CrossRef]
- Stewart-Ibarra, A.M.; Muñoz, Á.G.; Ryan, S.J.; Ayala, E.B.; Borbor-Cordova, M.J.; Finkelstein, J.L.; Mejía, R.; Ordoñez, T.; Recalde-Coronel, G.C.; Rivero, K. Spatiotemporal clustering, climate periodicity, and social-ecological risk factors for dengue during an outbreak in Machala, Ecuador, in 2010. BMC Infect. Dis. 2014, 14, 610. [Google Scholar] [CrossRef] [PubMed]
- Harrington, L.C.; Scott, T.W.; Lerdthusnee, K.; Coleman, R.C.; Costero, A.; Clark, G.G.; Jones, J.J.; Kitthawee, S.; Kittayapong, P.; Sithiprasasna, R. Dispersal of the dengue vector Aedes aegypti within and between rural communities. Am. J. Trop. Med. Hyg. 2005, 72, 209–220. [Google Scholar] [PubMed]
- Harrington, L.C.; Buonaccorsi, J.P.; Edman, J.D.; Costero, A.; Kittayapong, P.; Clark, G.G.; Scott, T.W. Analysis of survival of young and old Aedes aegypti (Diptera: Culicidae) from Puerto Rico and Thailand. J. Med. Entomol. 2001, 38, 537–547. [Google Scholar] [CrossRef] [PubMed]
- Schafrick, N.H.; Milbrath, M.O.; Berrocal, V.J.; Wilson, M.L.; Eisenberg, J.N. Spatial clustering of aedes aegypti related to breeding container characteristics in coastal Ecuador: Implications for dengue control. Am. J. Trop. Med. Hyg. 2013, 89, 758–765. [Google Scholar] [CrossRef] [PubMed]
- Kolivras, K.N. Mosquito habitat and dengue risk potential in Hawaii: A conceptual framework and GIS application. Prof. Geogr. 2006, 58, 139–154. [Google Scholar] [CrossRef]
- Van Benthem, B.H.; Vanwambeke, S.O.; Khantikul, N.; Burghoorn-Maas, C.; Panart, K.; Oskam, L.; Lambin, E.F.; Somboon, P. Spatial patterns of and risk factors for seropositivity for dengue infection. Am. J. Trop. Med. Hyg. 2005, 72, 201–208. [Google Scholar] [PubMed]
- Mammen, M.P., Jr.; Pimgate, C.; Koenraadt, C.J.; Rothman, A.L.; Aldstadt, J.; Nisalak, A.; Jarman, R.G.; Jones, J.W.; Srikiatkhachorn, A.; Ypil-Butac, C.A. Spatial and temporal clustering of dengue virus transmission in Thai villages. PLoS Med. 2008, 5, e205. [Google Scholar] [CrossRef] [PubMed]
- Yoon, I.-K.; Getis, A.; Aldstadt, J.; Rothman, A.L.; Tannitisupawong, D.; Koenraadt, C.J.; Fansiri, T.; Jones, J.W.; Morrison, A.C.; Jarman, R.G. Fine scale spatiotemporal clustering of dengue virus transmission in children and Aedes aegypti in rural Thai villages. PLoS Negl. Trop. Dis. 2012, 6, e1730. [Google Scholar] [CrossRef] [PubMed]
- Delmelle, E.; Dony, C.; Casas, I.; Jia, M.; Tang, W. Visualizing the impact of space-time uncertainties on dengue fever patterns. Int. J. Geogr. Inf. Sci. 2014, 28, 1107–1127. [Google Scholar] [CrossRef]
- Nisalak, A.; Endy, T.P.; Nimmannitya, S.; Kalayanarooj, S.; Scott, R.M.; Burke, D.S.; Hoke, C.H.; Innis, B.L.; Vaughn, D.W. Serotype-specific dengue virus circulation and dengue disease in Bangkok, Thailand from 1973 to 1999. Am. J. Trop. Med. Hyg. 2003, 68, 191–202. [Google Scholar] [PubMed]
- Chao, D.L.; Halstead, S.B.; Halloran, M.E.; Longini, I.M., Jr. Controlling dengue with vaccines in Thailand. PLoS Negl. Trop. Dis. 2012, 6, e1876. [Google Scholar] [CrossRef] [PubMed]
- de Castro Medeiros, L.C.; Castilho, C.; Braga, C.; de Souza, W.V.; Regis, L.; Monteiro, A. Modeling the dynamic transmission of dengue fever: Investigating disease persistence. PLoS Negl. Trop. Dis. 2011, 5, e942. [Google Scholar]
- Deng, C.; Tao, H.; Ye, Z. Agent-Based Modeling to Simulate the Dengue Spread. In Proceedings of the Sixth International Conference on Advanced Optical Materials and Devices, Riga, Latvia, 24–27 August 2008; International Society for Optics and Photonics: Bellingham, WA, USA; p. 71431O. [Google Scholar]
- Isidoro, C.; Fachada, N.; Barata, F.; Rosa, A. Agent-based model of Aedes aegypti population dynamics. In Progress in Artificial Intelligence; Springer: Berlin/Heidelberg, Germany, 2009; pp. 53–64. [Google Scholar]
- Jacintho, L.F.; Batista, A.F.; Ruas, T.L.; Marietto, M.G.; Silva, F.A. An Agent-Based model for the spread of the dengue fever: A swarm platform simulation approach. In Proceedings of the 2010 Spring Simulation Multiconference, Orlando, FL, USA, 11–15 April 2010; Society for Computer Simulation International: San Diego, CA, USA. [Google Scholar]
- Stoddard, S.; Morrison, A.; Vazquez-Prokopec, G.; Paz, S.V.; Kochel, T.; Kitron, U.; Elder, J.; Scott, T. The role of human movement in the transmission of vector-borne pathogens. PLoS Negl. Trop. Dis. 2008, 3, e481. [Google Scholar] [CrossRef] [PubMed]
- Tsuda, Y.; Takagi, M.; Wang, S.; Wang, Z.; Tang, L. Movement of Aedes aegypti (Diptera: Culicidae) released in a small isolated village on Hainan island, China. J. Med. Entomol. 2001, 38, 93–98. [Google Scholar] [CrossRef] [PubMed]
- Smith, D.L.; Dushoff, J.; McKenzie, F.E. The risk of a mosquito-borne infectionin a heterogeneous environment. PLoS Biol. 2004, 2, e368. [Google Scholar] [CrossRef] [PubMed]
- Favier, C.; Schmit, D.; Müller-Graf, C.D.; Cazelles, B.; Degallier, N.; Mondet, B.; Dubois, M.A. Influence of spatial heterogeneity on an emerging infectious disease: The case of dengue epidemics. Proc. R. Soc. Lond. B Biol. Sci. 2005, 272, 1171–1177. [Google Scholar] [CrossRef] [PubMed]
- Thomas, S.J.; Aldstadt, J.; Jarman, R.G.; Buddhari, D.; Yoon, I.-K.; Richardson, J.H.; Ponlawat, A.; Iamsirithaworn, S.; Scott, T.W.; Rothman, A.L. Improving dengue virus capture rates in humans and vectors in Kamphaeng Phet province, Thailand, using an enhanced spatiotemporal surveillance strategy. Am. J. Trop. Med. Hyg. 2015, 93, 24–32. [Google Scholar] [CrossRef] [PubMed]
- Guzmán, M.; Kourí, G.; Valdés, L.; Bravo, J.; Vázquez, S.; Halstead, S. Enhanced severity of secondary dengue-2 infections: Death rates in 1981 and 1997 Cuban outbreaks. Revista Panamericana de Salud Pública 2002, 11, 223–227. [Google Scholar] [CrossRef] [PubMed]
- OhAinle, M.; Balmaseda, A.; Macalalad, A.R.; Tellez, Y.; Zody, M.C.; Saborío, S.; Nuñez, A.; Lennon, N.J.; Birren, B.W.; Gordon, A. Dynamics of dengue disease severity determined by the interplay between viral genetics and serotype-specific immunity. Sci. Transl. Med. 2011, 3, 114–128. [Google Scholar] [CrossRef] [PubMed]
- Reich, N.; Shrestha, S.; King, A.; Rohani, P.; Lessler, J.; Kalayanarooj, S.; Yoon, I.; Gibbons, R.; Burke, D.; Cummings, D. Interactions between serotypes of dengue highlight epidemiological impact of cross-immunity. J. R. Soc. Interface 2013, 10. [Google Scholar] [CrossRef] [PubMed]
- Sabin, A.B. Research on dengue during World War II. Am. J. Trop. Med. Hyg. 1952, 1, 30–50. [Google Scholar] [CrossRef] [PubMed]
- Grimm, V.; Berger, U.; DeAngelis, D.L.; Polhill, J.G.; Giske, J.; Railsback, S.F. The odd protocol: A review and first update. Ecol. Model. 2010, 221, 2760–2768. [Google Scholar] [CrossRef]
- Vaughn, D.W.; Green, S.; Kalayanarooj, S.; Innis, B.L.; Nimmannitya, S.; Suntayakorn, S.; Endy, T.P.; Raengsakulrach, B.; Rothman, A.L.; Ennis, F.A. Dengue viremia titer, antibody response pattern, and virus serotype correlate with disease severity. J. Infect. Dis. 2000, 181, 2–9. [Google Scholar] [CrossRef] [PubMed]
- Aldstadt, J.; Koenraadt, C.J.M.; Fansiri, T.; Kijchalao, U.; Richardson, J.; Jones, J.W.; Scott, T.W. Ecological modeling of Aedes aegypti (l.) pupal production in rural Kamphaeng Phet, Thailand. PLoS Negl. Trop. Dis. 2011, 5, e940. [Google Scholar] [CrossRef] [PubMed]
- Barrera, R.; Amador, M.; Clark, G.G. Use of the pupal survey technique for measuring Aedes aegypti (Diptera: Culicidae) productivity in Puerto Rico. Am. J. Trop. Med. Hyg. 2006, 74, 290–302. [Google Scholar] [PubMed]
- Harrington, L.C.; Jones, J.J.; Kitthawee, S.; Sithiprasasna, R.; Edman, J.D.; Scott, T.W. Age-dependent survival of the dengue vector Aedes aegypti (Diptera: Culicidae) demonstrated by simultaneous release-recapture of different age cohorts. J. Med. Entomol. 2008, 45, 307–313. [Google Scholar] [PubMed]


| Parameters | Value | Note |
|---|---|---|
| Incubation period | 6 days | Time between exposure and infectiousness |
| Viremic period | 4 days | Time between infectious and recovered stages |
| Recovered period | 120 days | Days of complete cross-immunity after recovery |
| PMP | 0.25 | Probability of mosquito to person transmission |
| PPM | 0.1 | Probability of person to mosquito transmission |
| Introduction rate | 0.00001 | Influx DENV from outside of study area |
| Infected rate | 0.14 | Annual infection rate used to simulate population immunity |
| Parameters | Value | Note |
|---|---|---|
| Movement probability | 0.15, 0.01 | Daily movement probability within neighbors and random locations |
| Movement radius | <30 m | Movement radius |
| Extrinsic incubation period | 11 days | Days to become infectious |
| Hazard rate | 0.09, 0.08 | Younger than 10 days and older than 10 days |
| Biting rate | 0.08, 0.76, 0.13, 0.03 | Varies by time period (08–13, 13–18, 18–24, 00–08) |
| Scenarios | Infection Rates (95% CI) |
|---|---|
| HeteroReal | 0.064 (0.061–0.066) |
| HomoReal | 0.074 (0.071–0.077) |
| HeteroSynth | 0.013 (0.013–0.014) |
| HomoSynth | 0.014 (0.013–0.014) |
| Spatial Configuration | Counts of Isolated Buildings | Counts of Connected Buildings |
|---|---|---|
| Realistic configuration | 111 | 804 |
| Synthetic configuration | 693 | 222 |
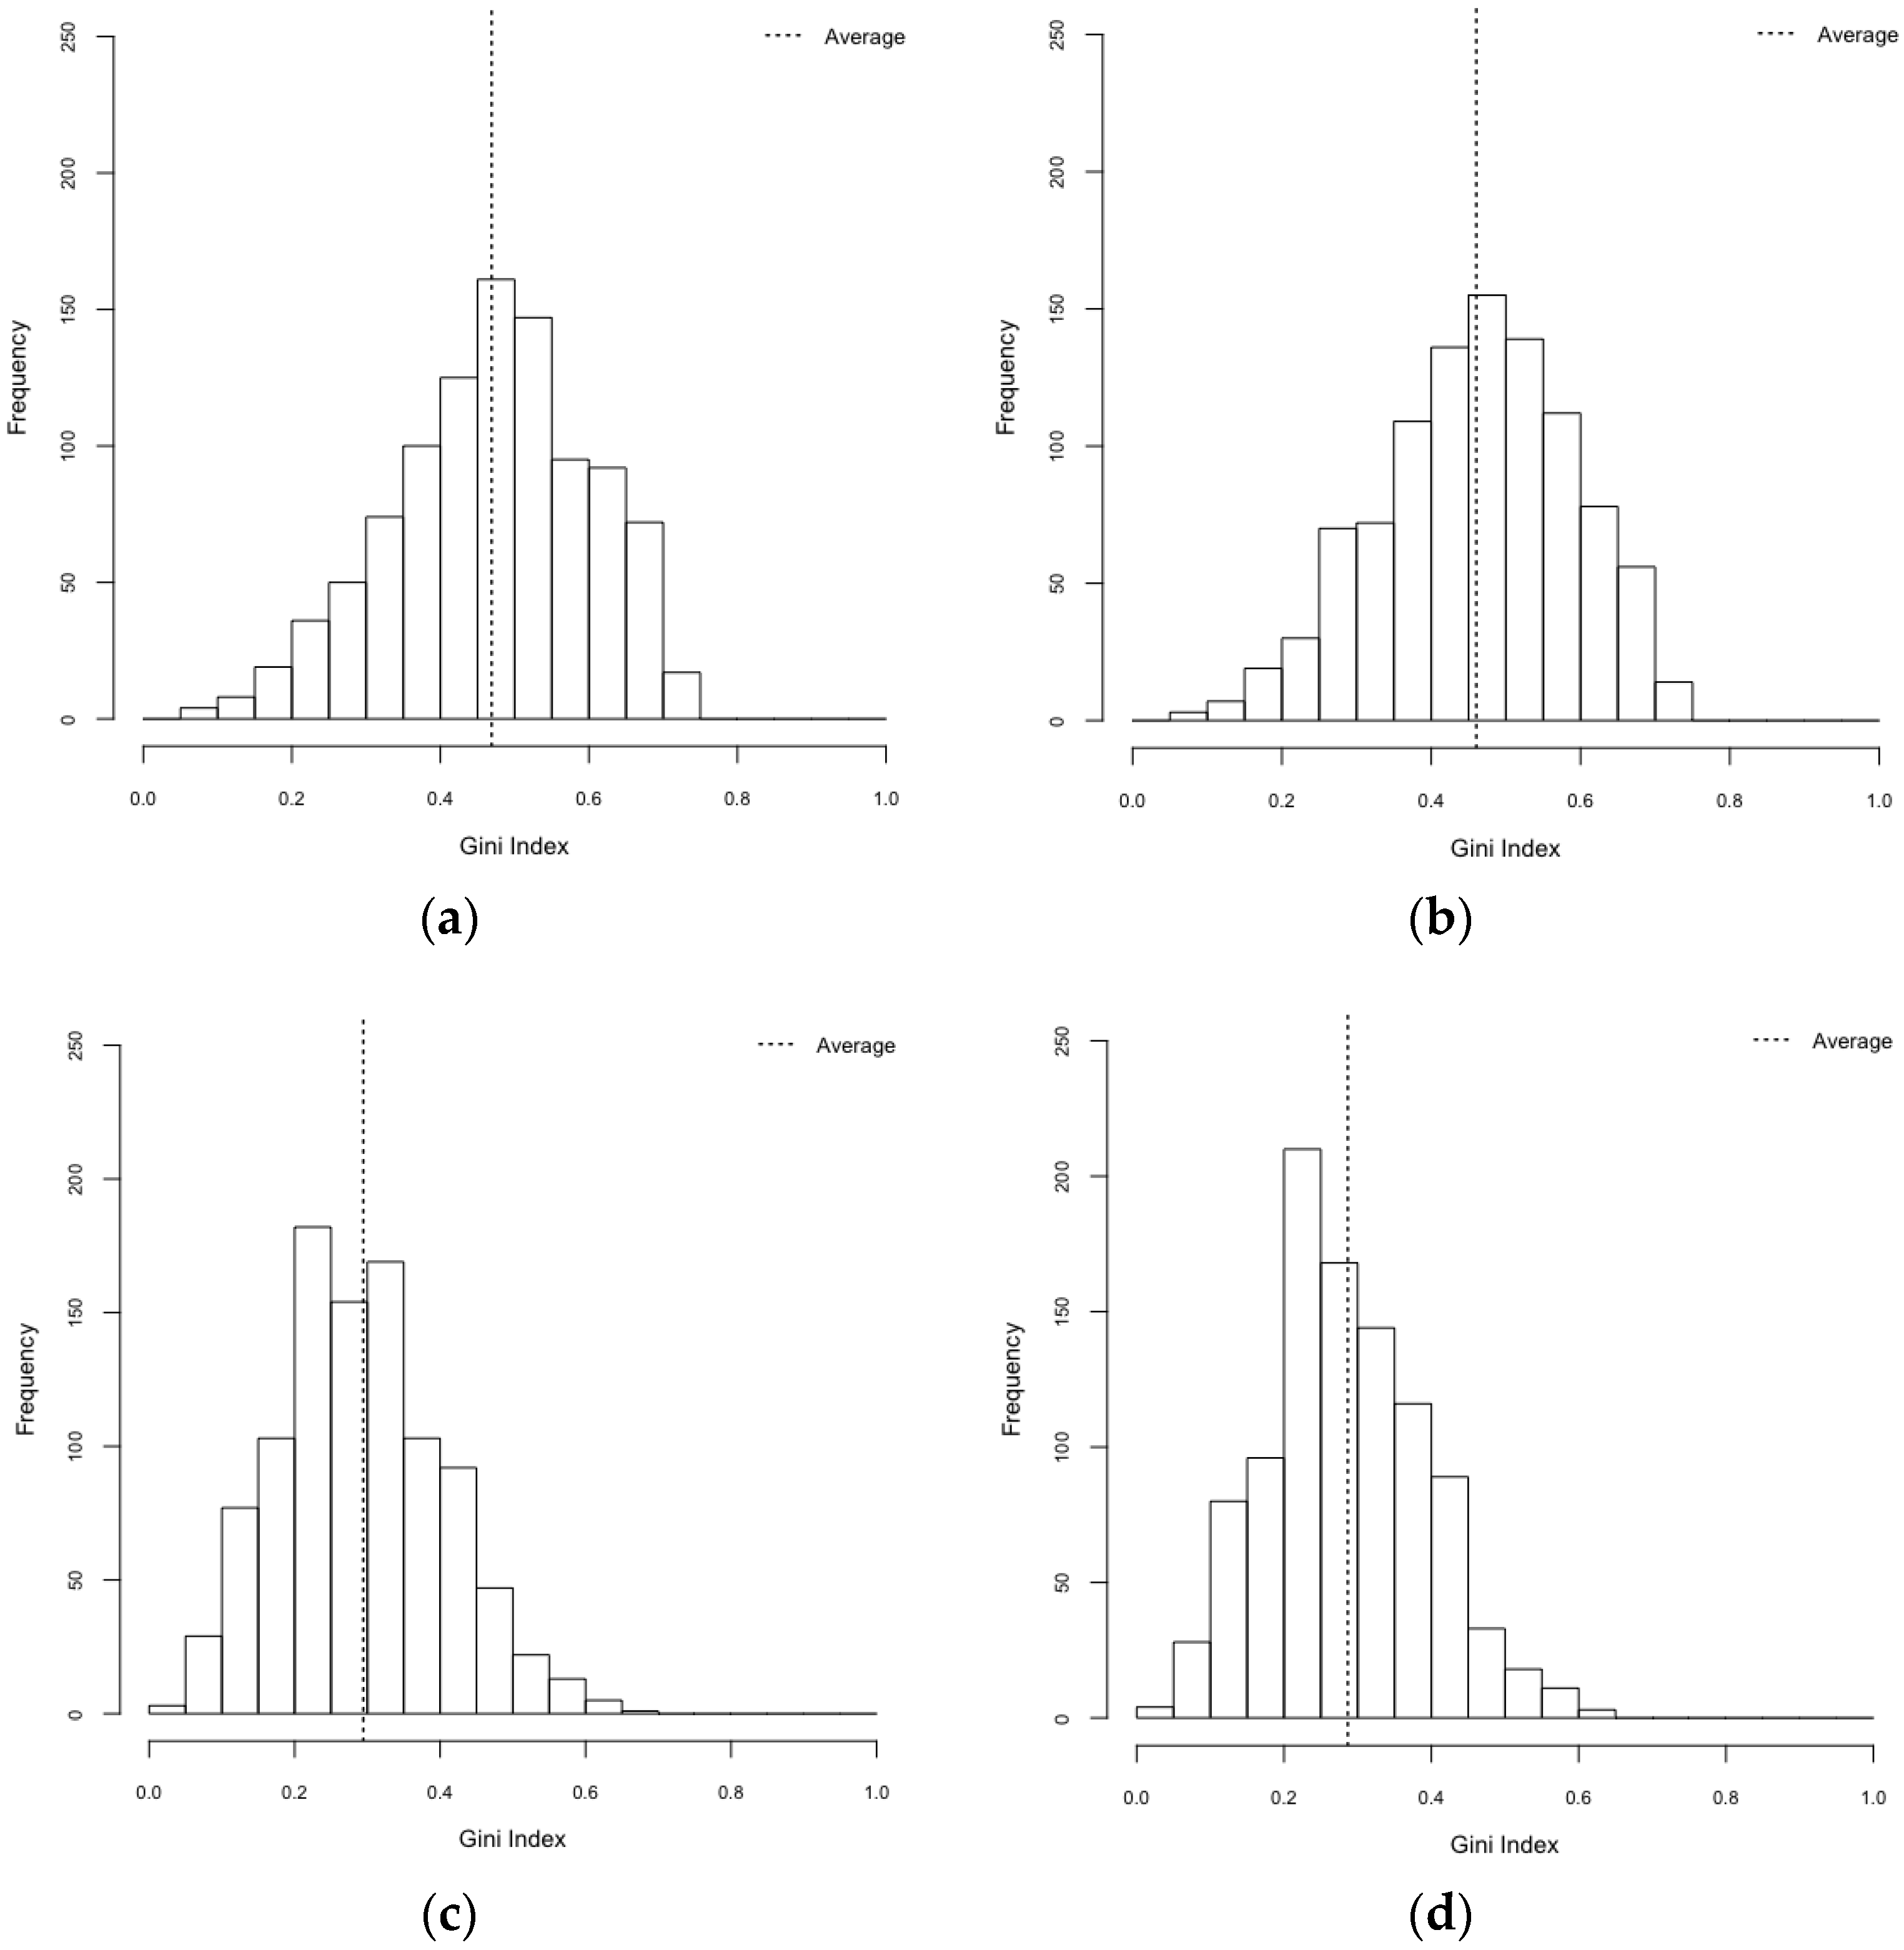
| Scenarios | Gini Index (95% CI) | Herfindahl Index (95% CI) |
|---|---|---|
| HeteroReal | 0.469 (0.461–0.477) | 0.497 (0.487–0.506) |
| HomoReal | 0.460 (0.452–0.469) | 0.483 (0.473–0.492) |
| HeteroSynth | 0.294 (0.287–0.301) | 0.344 (0.339–0.348) |
| HomoSynth | 0.287 (0.280–0.293) | 0.337 (0.333–0.341) |
© 2017 by the authors. Licensee MDPI, Basel, Switzerland. This article is an open access article distributed under the terms and conditions of the Creative Commons Attribution (CC BY) license (http://creativecommons.org/licenses/by/4.0/).
Share and Cite
Kang, J.-Y.; Aldstadt, J. The Influence of Spatial Configuration of Residential Area and Vector Populations on Dengue Incidence Patterns in an Individual-Level Transmission Model. Int. J. Environ. Res. Public Health 2017, 14, 792. https://doi.org/10.3390/ijerph14070792
Kang J-Y, Aldstadt J. The Influence of Spatial Configuration of Residential Area and Vector Populations on Dengue Incidence Patterns in an Individual-Level Transmission Model. International Journal of Environmental Research and Public Health. 2017; 14(7):792. https://doi.org/10.3390/ijerph14070792
Chicago/Turabian StyleKang, Jeon-Young, and Jared Aldstadt. 2017. "The Influence of Spatial Configuration of Residential Area and Vector Populations on Dengue Incidence Patterns in an Individual-Level Transmission Model" International Journal of Environmental Research and Public Health 14, no. 7: 792. https://doi.org/10.3390/ijerph14070792