Article

A Pilot Study to Examine Exposure to Residential Radon in Under-Sampled Census Tracts of DeKalb County, Georgia, in 2015

1
School of Public Health, Georgia State University, Atlanta, GA 30302, USA
2
Department of Geosciences, Georgia State University, Atlanta, GA 30302, USA
*
Author to whom correspondence should be addressed.
Int. J. Environ. Res. Public Health 2017, 14(3), 332; https://doi.org/10.3390/ijerph14030332
Submission received: 30 December 2016 / Revised: 14 February 2017 / Accepted: 18 March 2017 / Published: 22 March 2017
(This article belongs to the Special Issue Indoor Air Quality and Health 2016)

Abstract

:
While DeKalb County, Georgia, offers free radon screening for all eligible residents, portions of the county remain relatively under-sampled. This pilot study focused on 10% of the census tracts in the county with the lowest proportion of radon testing; most were in southern DeKalb County. In total, 217 households were recruited and homes were tested for indoor radon concentrations on the lowest livable floor over an eight-week period from March–May 2015. Tract-level characteristics were examined to understand the differences in socio-demographic and economic factors between the pilot study area and the rest of the county. The pilot study tracts had a higher proportion of African Americans compared to the rest of DeKalb County (82% versus 47%). Radon was detected above 11.1 Bq/m3 (0.3 pCi/L) in 73% of the indoor samples and 4% of samples were above 148 Bq/m3 (4 pCi/L). Having a basement was the strongest predictive factor for detectable and hazardous levels of radon. Radon screening can identify problems and spur homeowners to remediate but more research should be done to identify why screening rates vary across the county and how that varies with radon levels in homes to reduce radon exposure.

1. Introduction

1.1. Background

Radon has been classified as a known human lung carcinogen [1]. In pooled case-control studies in both Europe and North America, researchers found direct evidence that residential exposure to radon was associated with lung cancer risk [2,3]. In the United States, radon is currently the second leading cause of lung cancer, behind only smoking cigarettes; it is the number one cause of lung cancer in non-smokers [1]. From 1988 to 2013, approximately 25 million tests for radon were completed in the U.S. although most of these were the result of real estate transactions [4]. However, the results of these screening tests are often not shared widely as a lack of resources constrains the information about the proportion of homes above hazardous levels.
The U.S. Environmental Protection Agency (EPA) has provided radon risk maps for all counties in the U.S. and categorized them into three tiers according to potential radon exposure: zone 1 counties have predicted indoor radon screening levels >148 Bq/m3 (4 pCi/L), zone 2 are between 74 and 148 Bq/m3 (2 and 4 pCi/L), and zone 3 are estimated to be <74 Bq/m3) (2 pCi/L) [5]. There are four zone 1 counties in Georgia: DeKalb, Fulton, Gwinnett, and Cobb. The DeKalb County Board of Health (DBH), through the Division of Environmental Health, offers free radon screening to all residents [6]. Although the county—which consists of 144 census tracts—offers radon screening through homeowner initiated tests, screening prevalence is overall relatively low and some census tracts are estimated to have less than 0.5% of the eligible households screened for radon. Since the screening program is voluntary and provided to those who request the service, there is a need to understand exposure in areas of the county which have relatively low screening prevalence. Examining exposure in these areas of the county can determine whether indoor radon exposure may constitute a significant health risk.

1.2. Study Objective

The objectives of this study were:
  • To describe a pilot study of randomly selected households for recruitment for in-home radon measurements in 14 census tracts in DeKalb County, GA, USA
  • To analyze tract-level socio-economic and demographic characteristics to understand differences between the pilot study tracts and the remaining tracts in the county
  • To analyze radon levels in homes and identify housing characteristics associated with radon in homes.

2. Materials and Methods

2.1. Training and Institutional Review Board (IRB) Approval

Georgia State University graduate students from the Department of Geosciences and the School of Public Health recruited additional student volunteers from both departments. All students and faculty members who were involved in the field work completed human subjects’ research training via the Collaborative Institutional Training Initiative (CITI) collaborative (https://www.citiprogram.org/). In addition, each member of the team received additional training with details for household recruitment, surveying, use of the radon test kit, and information regarding radon resources to be shared with participants. Training took place in March 2015, and household recruitment took place in March through May 2015. Because this pilot study involved interaction with human subjects, institutional review board (IRB) approval was required and obtained from the Georgia State University IRB (IRB No. H14542).

2.2. Study Recruitment Procedures

To examine radon in under-sampled census tracts, the county was evaluated for percentage of single family homes screened for radon. Data was provided by the DBH and from Air Chek (Air Chek Inc., Mills River, NC, USA). The screening prevalence (see Supplemental Materials Figure S1) was calculated as follows: the numerator was the number of radon tests and the denominator was the number of residential parcels. We ranked the county by the radon screening prevalence and then chose the bottom 10% of the tracts (n = 14) for our sampling. The 10% was used as a pilot to understand the residential exposure in the low-screening areas in order to prepare a study focused on screening-disparity research. The recruitment goal for the project was to collect indoor air samples on the bottom livable floor from 200 houses. A list of all study-eligible, single-unit land parcels within the selected 14 census tracts was compiled. From this list, households were randomly selected with allocation across census tracts that was proportional to the total number of single-unit parcels within the census tract. As a result, selection probabilities were approximately equal. For each census tract, we generated a list of randomly selected households and addresses were drawn from this list for visits. Starting in March 2015, groups of two traveled to the census tracts weekly, typically on Saturdays. Randomly selected addresses were provided for initial approach. If the household did not respond (because no one came to the door), a household on the same street within three to five households was contacted. If no houses were available, the next address on the list was visited.

2.3. Data Collection

Homeowners were approached and provided information about the project and invited to participate. Informed consent was obtained and documented, a survey was conducted, and a radon test kit was installed in the home which was retrieved within 3–5 days. The survey was conducted to collect housing characteristic data by self-report or observation including: age of home, foundation type, building type, and housing type. In addition, the primary respondent answered questions about the presence of any children under 18 years of age, smoking and any prior knowledge of radon. The test kits (Air Chek Inc., Mills River, NC, USA) were hung at eye-level on any interior wall of the lowest livable floor. For every 20 homes sampled, a duplicate test kit was placed on the same floor to measure the reproducibility of the test kit and laboratory analysis. For successful completion of the radon test (aka retrieval 3–5 days later), the resident received a $15 Walmart gift card. Upon retrieval from the home, each kit was sealed and immediately dropped in the mail for analysis by Air Chek laboratories. Results were shared with the principal investigator and provided via mail or email to the homeowner as well.

2.4. Data Analysis

Radon test results and questionnaire data were manually entered into Microsoft Excel. The data were then analyzed using descriptive statistics and bivariate and multivariate logistic regression. For analytical purposes, all non-detects were assigned a value of 5.5 Bq/m3 (0.15 pCi/L) or one half of the detection limit of the test. To evaluate initial differences, radon data were plotted using box and whisker plots. However, because the radon data were not normally distributed, non-parametric comparisons were performed using Kruskal-Wallis tests. In addition, two binary categories were used to assess statistically significant associations between housing characteristics and radon: one variable that was developed based the detection of radon above the sample kit detection level (11.1 Bq/m3 or 0.3 pCi/L) and one that assessed hazardous levels of exposure to radon (>148 Bq/m3 or >4 pCi/L). All statistical tests were conducted using Stata version 13.0 (Stata, College Station, TX, USA).

2.5. American Community Survey Data

In addition to the data collected in the pilot study, data from the 2011–2015 American Community Survey (ACS) database were also examined. The following variables were extracted from the ACS database for all tracts in DeKalb County: educational attainment, income, race and poverty status. Mean percentages were generated for each variable of interest for the pilot tracts and the remaining 130 tracts and compared using Wilcoxon rank-sum tests.

3. Results

3.1. Descriptive Statistics Regarding Census Tracts

As shown in Table 1, the most prominent difference between our 14 sampled tracts and the remaining 130 census tracts in DeKalb was a higher proportion of African Americans present in the 14 pilot study tracts (82% versus 47% respectively); a difference that was statistically significant via Wilcoxon rank-sum test. Comparison of educational attainment for the pilot study tracts and the rest of the county suggested a lower proportion with a bachelor’s degree (or higher) compared to the rest of the county. Mean and median income were higher in the rest of the county and the proportion in poverty was lower for the rest of the county, but these were not statistically significant differences.

3.2. Household Recruitment
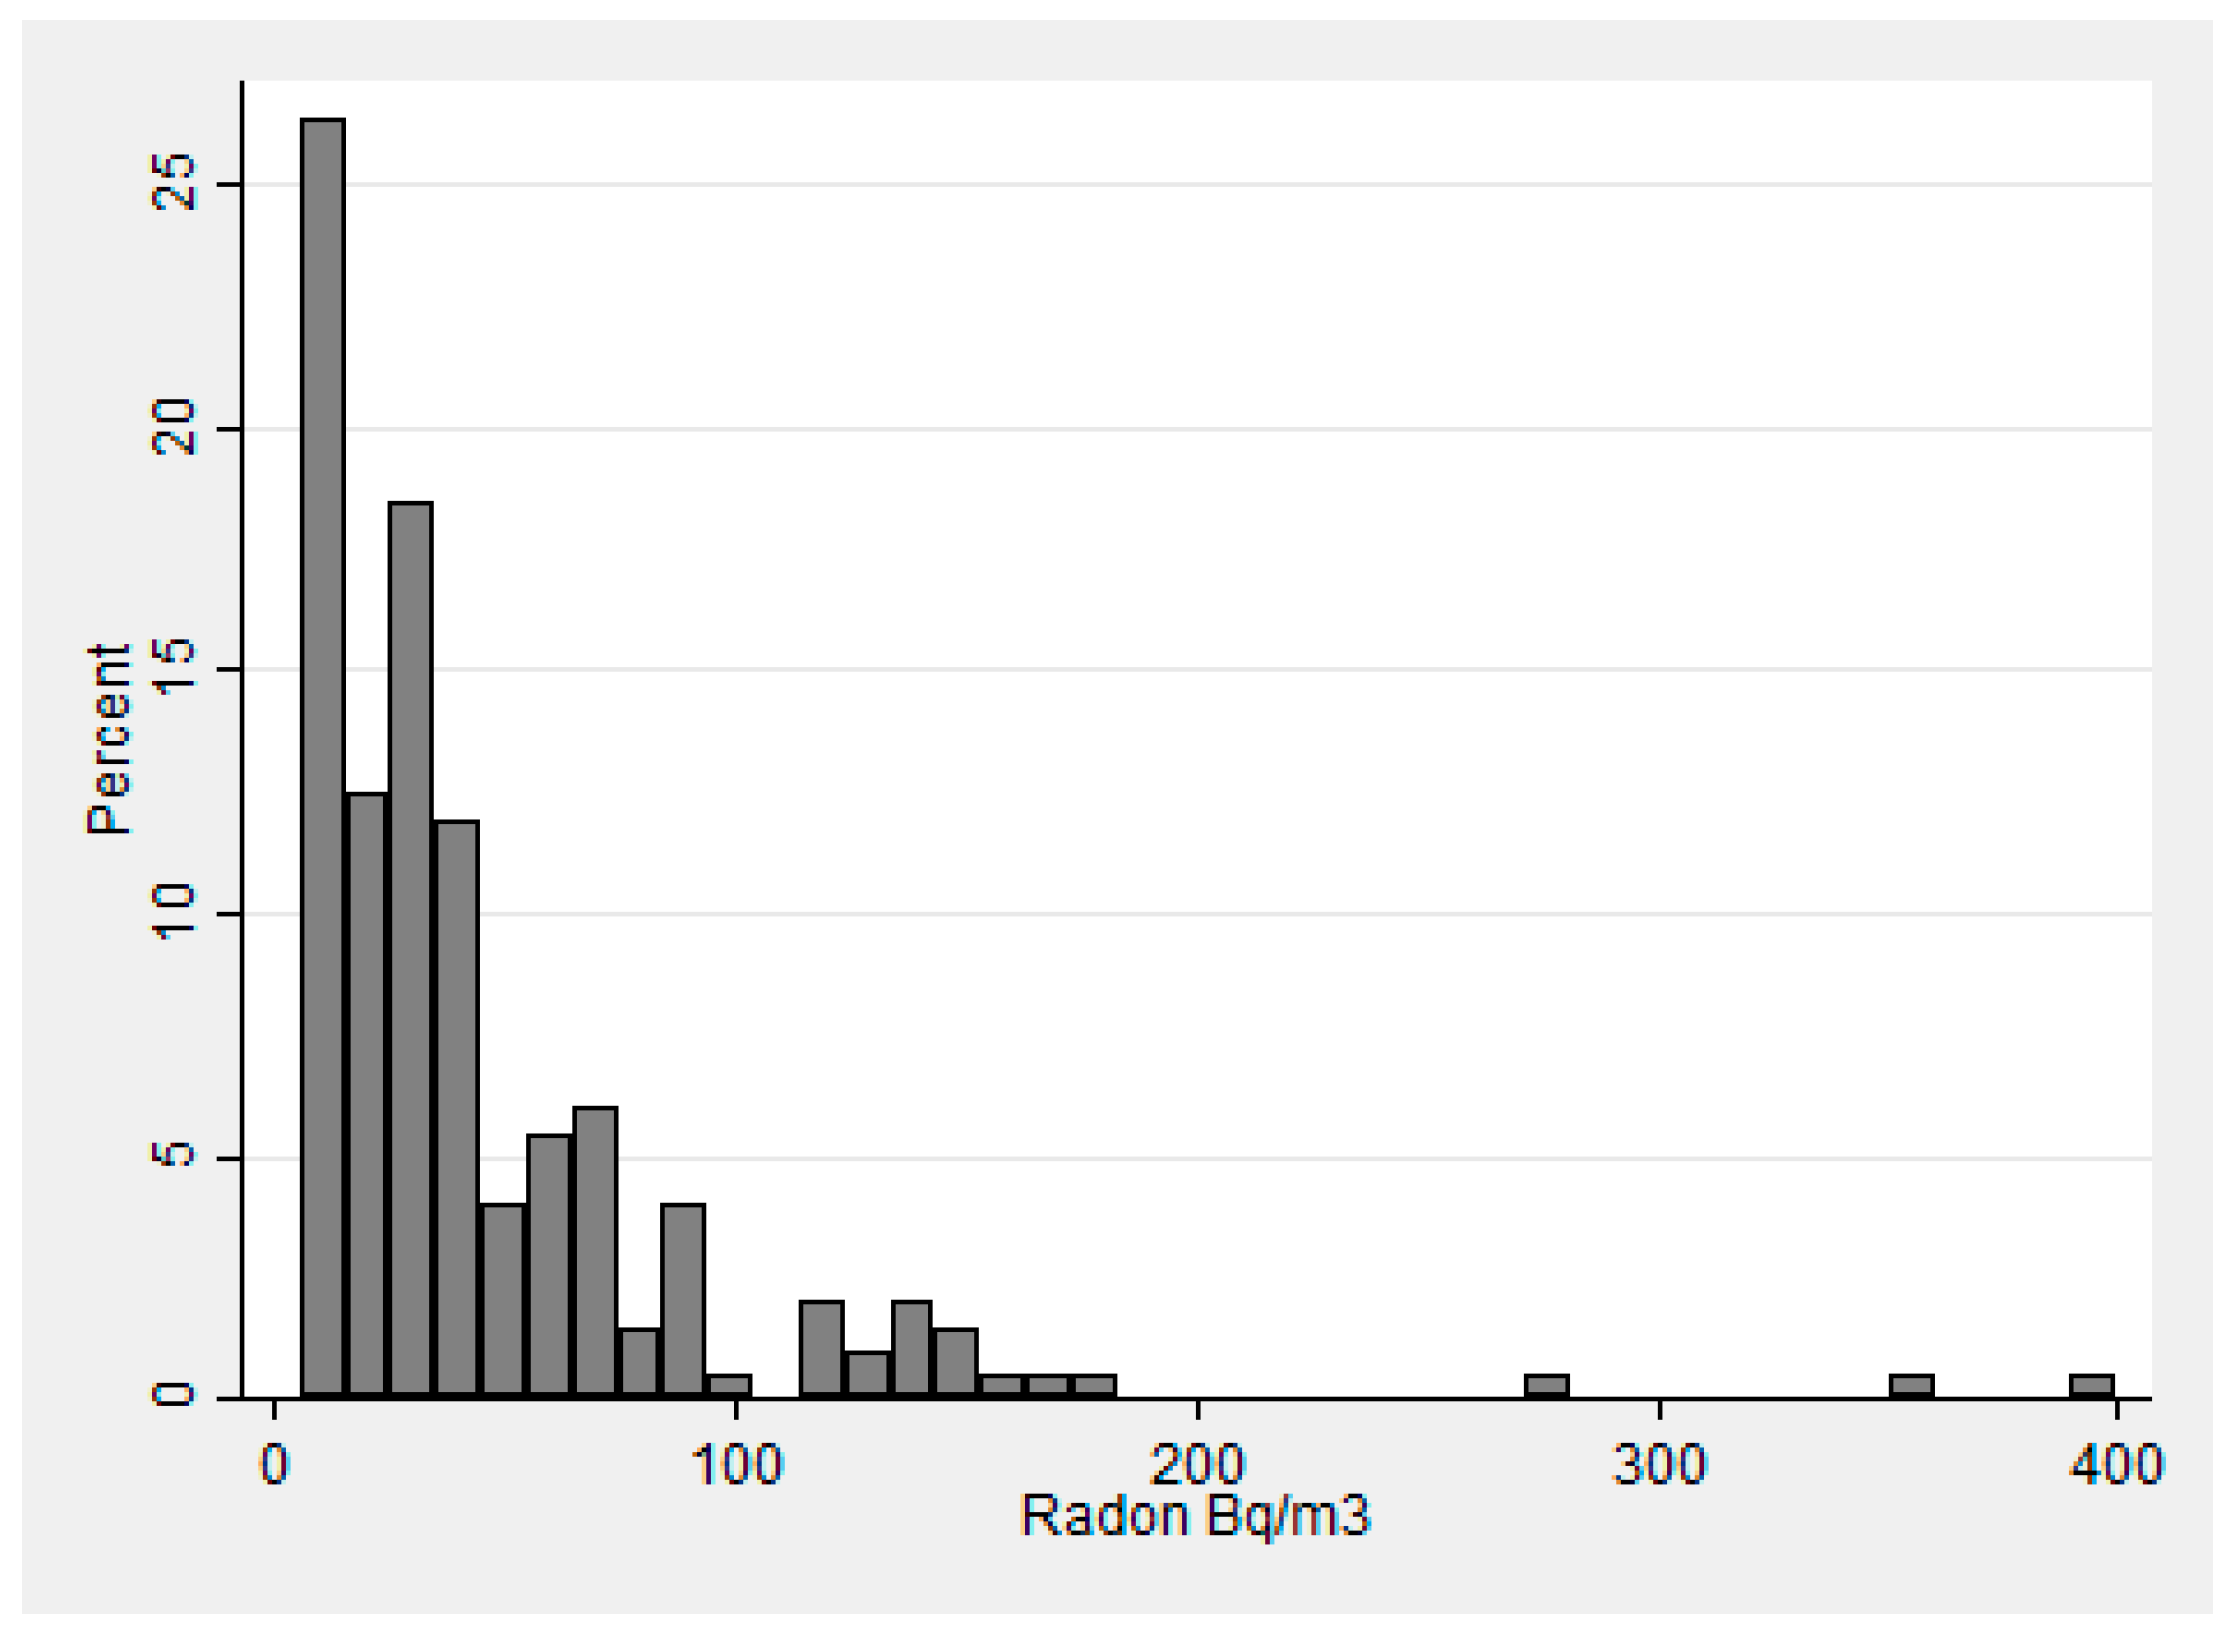
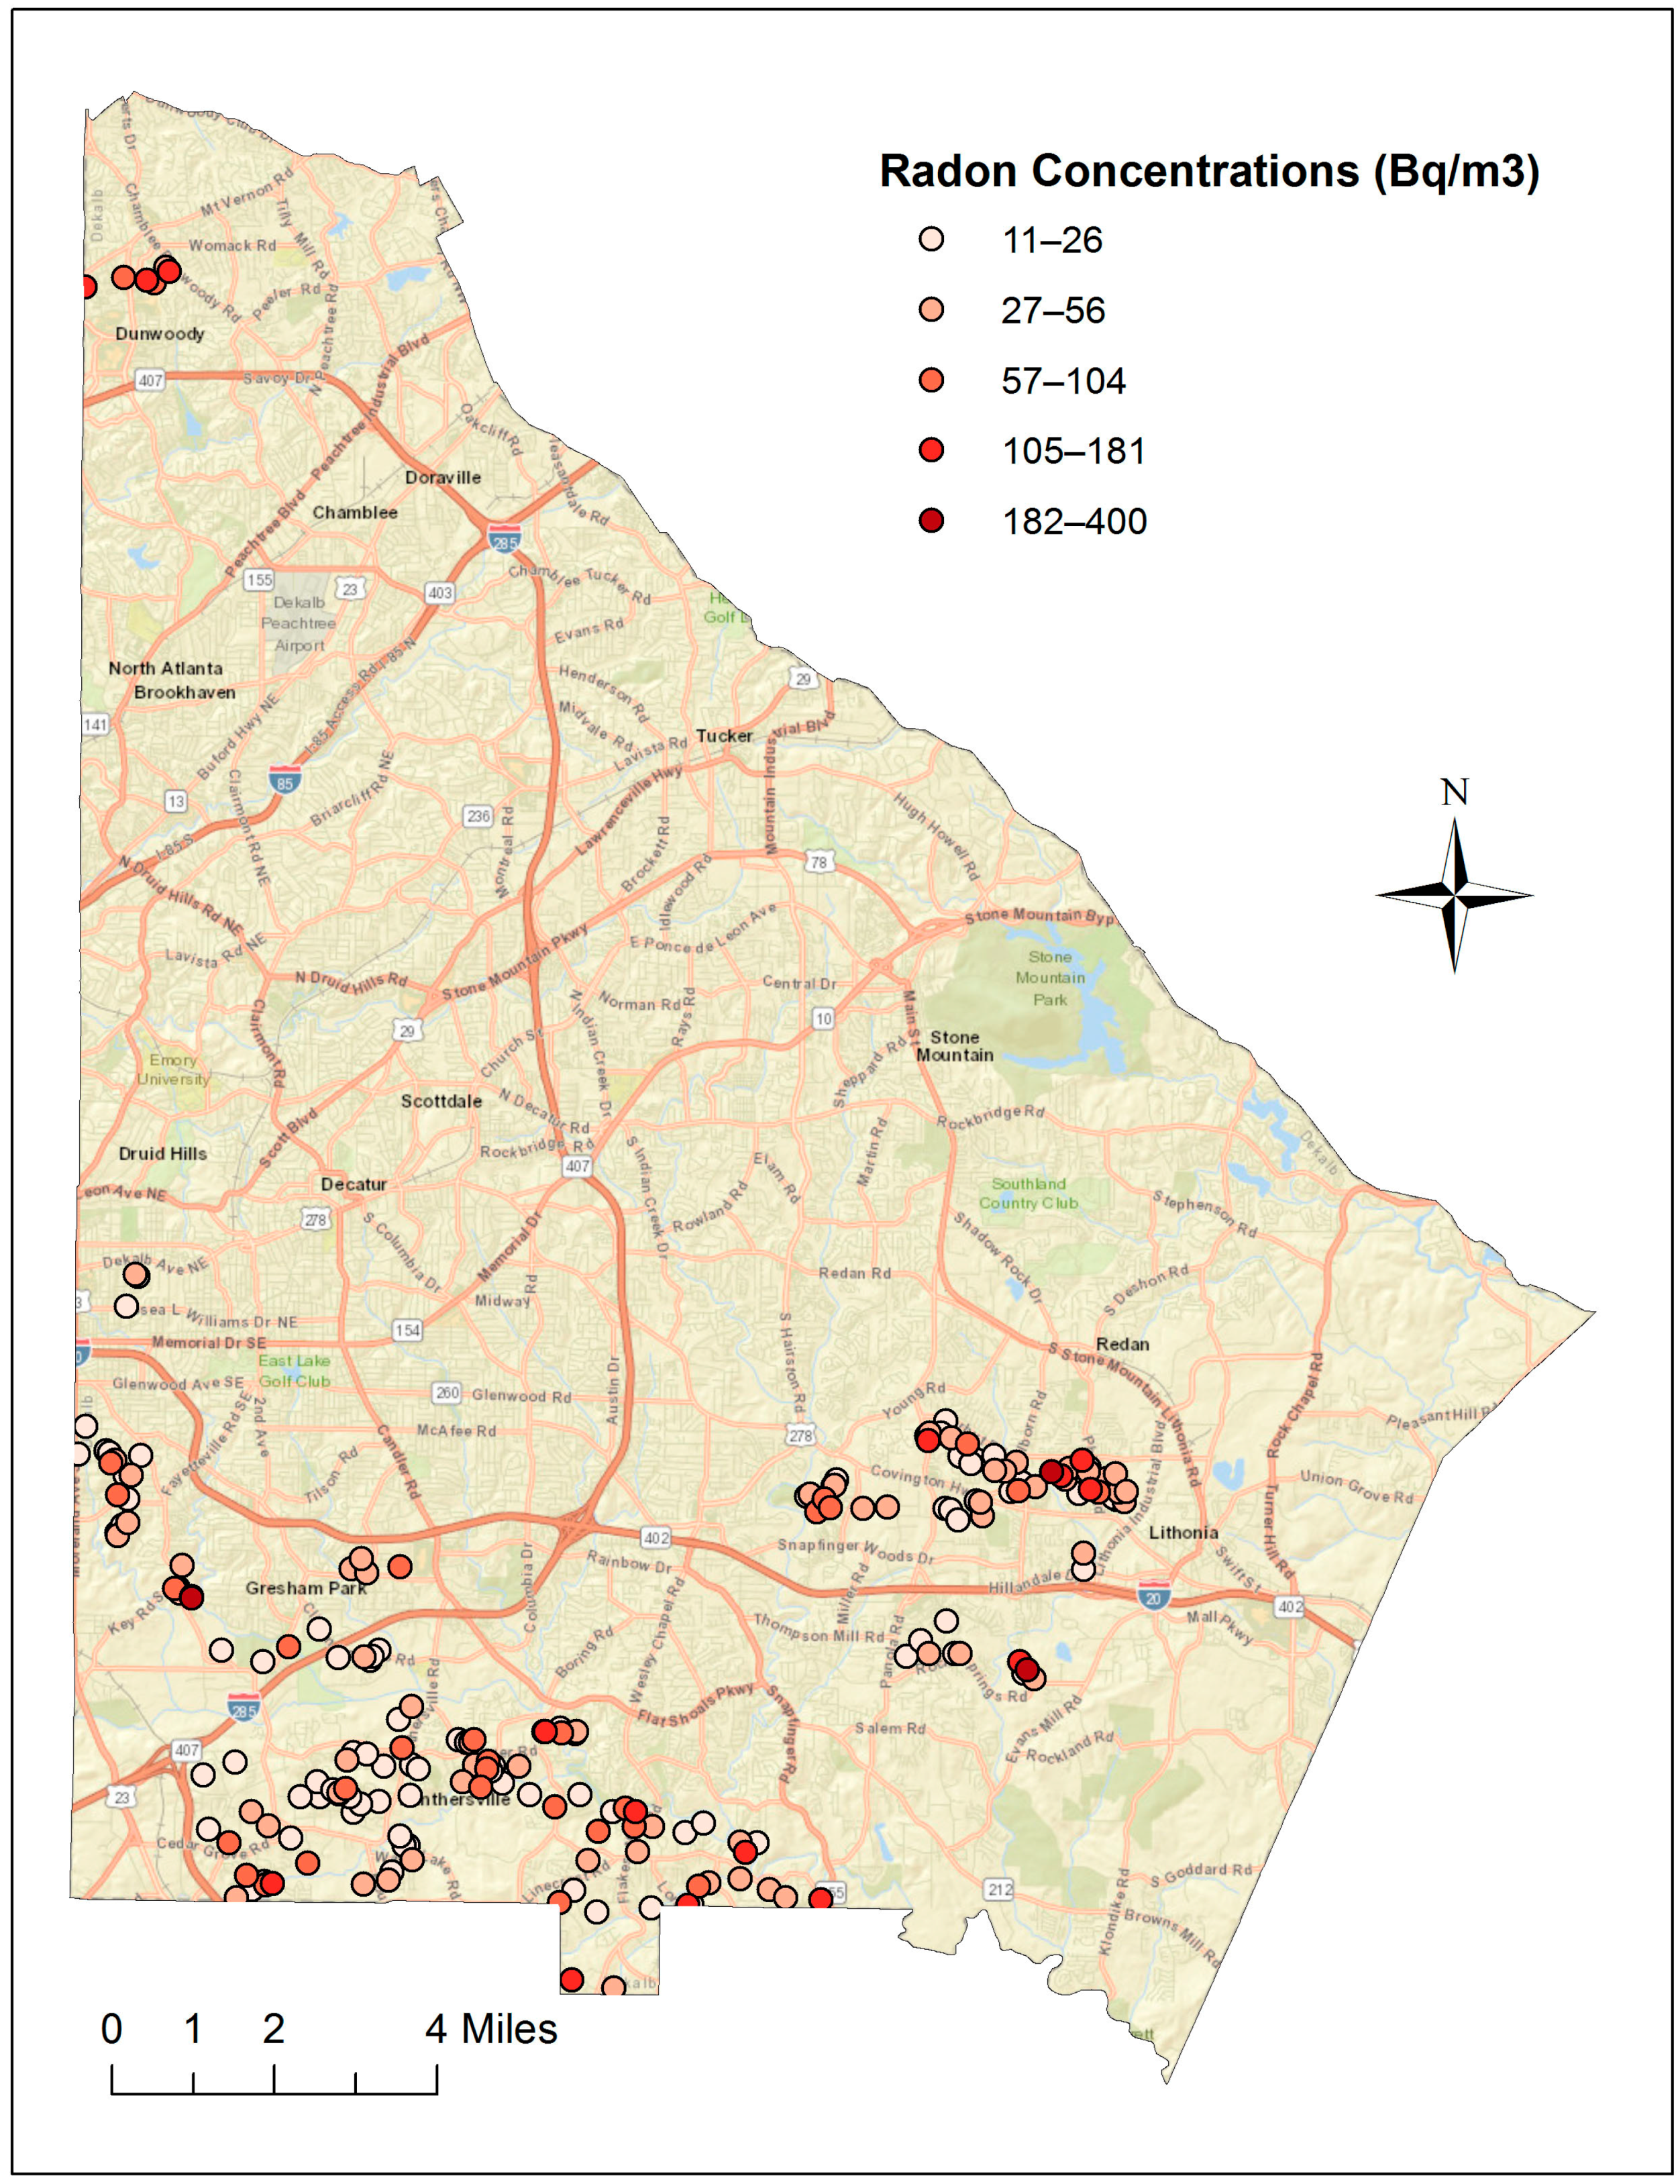
Recruitment logs of houses visited were kept in an attempt to assess response rate. Based on these recruitment logs, we estimated a response rate of 33%. A total of 217 homes were recruited during the March to May 2015 pilot study; however, 16 radon test results were not valid and therefore only 201 households could be included in the analysis of household characteristics. To assess the geographic distribution of our sampled households, we performed a nearest-neighbor analysis (α = 0.01; one-tailed) on the sampled locations at each census tract, respectively, based on their minimum bounding rectangles. The results suggest that they represent either random or dispersed distribution. The analysis, however, may be limited in three or four tracts because of their sparse locations.
As shown in Table 2, the homes were built over a broad time range as construction year of homes ranged from 1950 through 2014; the median year of home built was 1997. Approximately half of homes tested were multi-story homes (n = 113, 52%), 28% were split-level homes, and 20% were ranch-style homes. Homes were identified (by observation) to be mostly frame construction (64%), with the remaining homes either brick/block construction (20%) or some combination of frame, brick and/or block (15%). Household participants reported that the majority of foundations were slab (61%), with 27% with basements and 11% with crawl spaces. In terms of risk factor knowledge assessment, we found the following, that 49 respondents (23%) reported that someone smoked cigarettes in the house; more than half reported they had not heard of radon before (115 participants), and almost as many reported that children under 18 years of age resided in the home.

Radon Results

Of the 201 radon test kits that came back with a valid test result, 154 (78%) were collected from the 1st floor with the remaining collected from the basement (Table 2). The radon concentrations were positively skewed (Figure 1). Even after log transformation, the radon test results did not appear to be normally distributed (data not shown). Radon concentrations ranged from <5.5 Bq/m3 (<0.3 pCi/L) to 400 Bq/m3 (10.8 pCi/L), with a mean of 45.6 Bq/m3 (1.2 pCi/L) (Std. Dev. 53.3 Bq/m3) and a median of 29.6 Bq/m3 (0.8 pCi/L). Approximately 1/4th of the samples with a valid result found radon concentration below detectable levels of the test kit. In Figure 2, the results are provided via a map of DeKalb County and, as shown, the analysis does not suggest spatial trend for the 14 sampled census tracts. The northern-most census tract was on average higher (with fewer samples) but this was not statistically significant when examined with the Kruskal-Wallis test (p = 0.17).

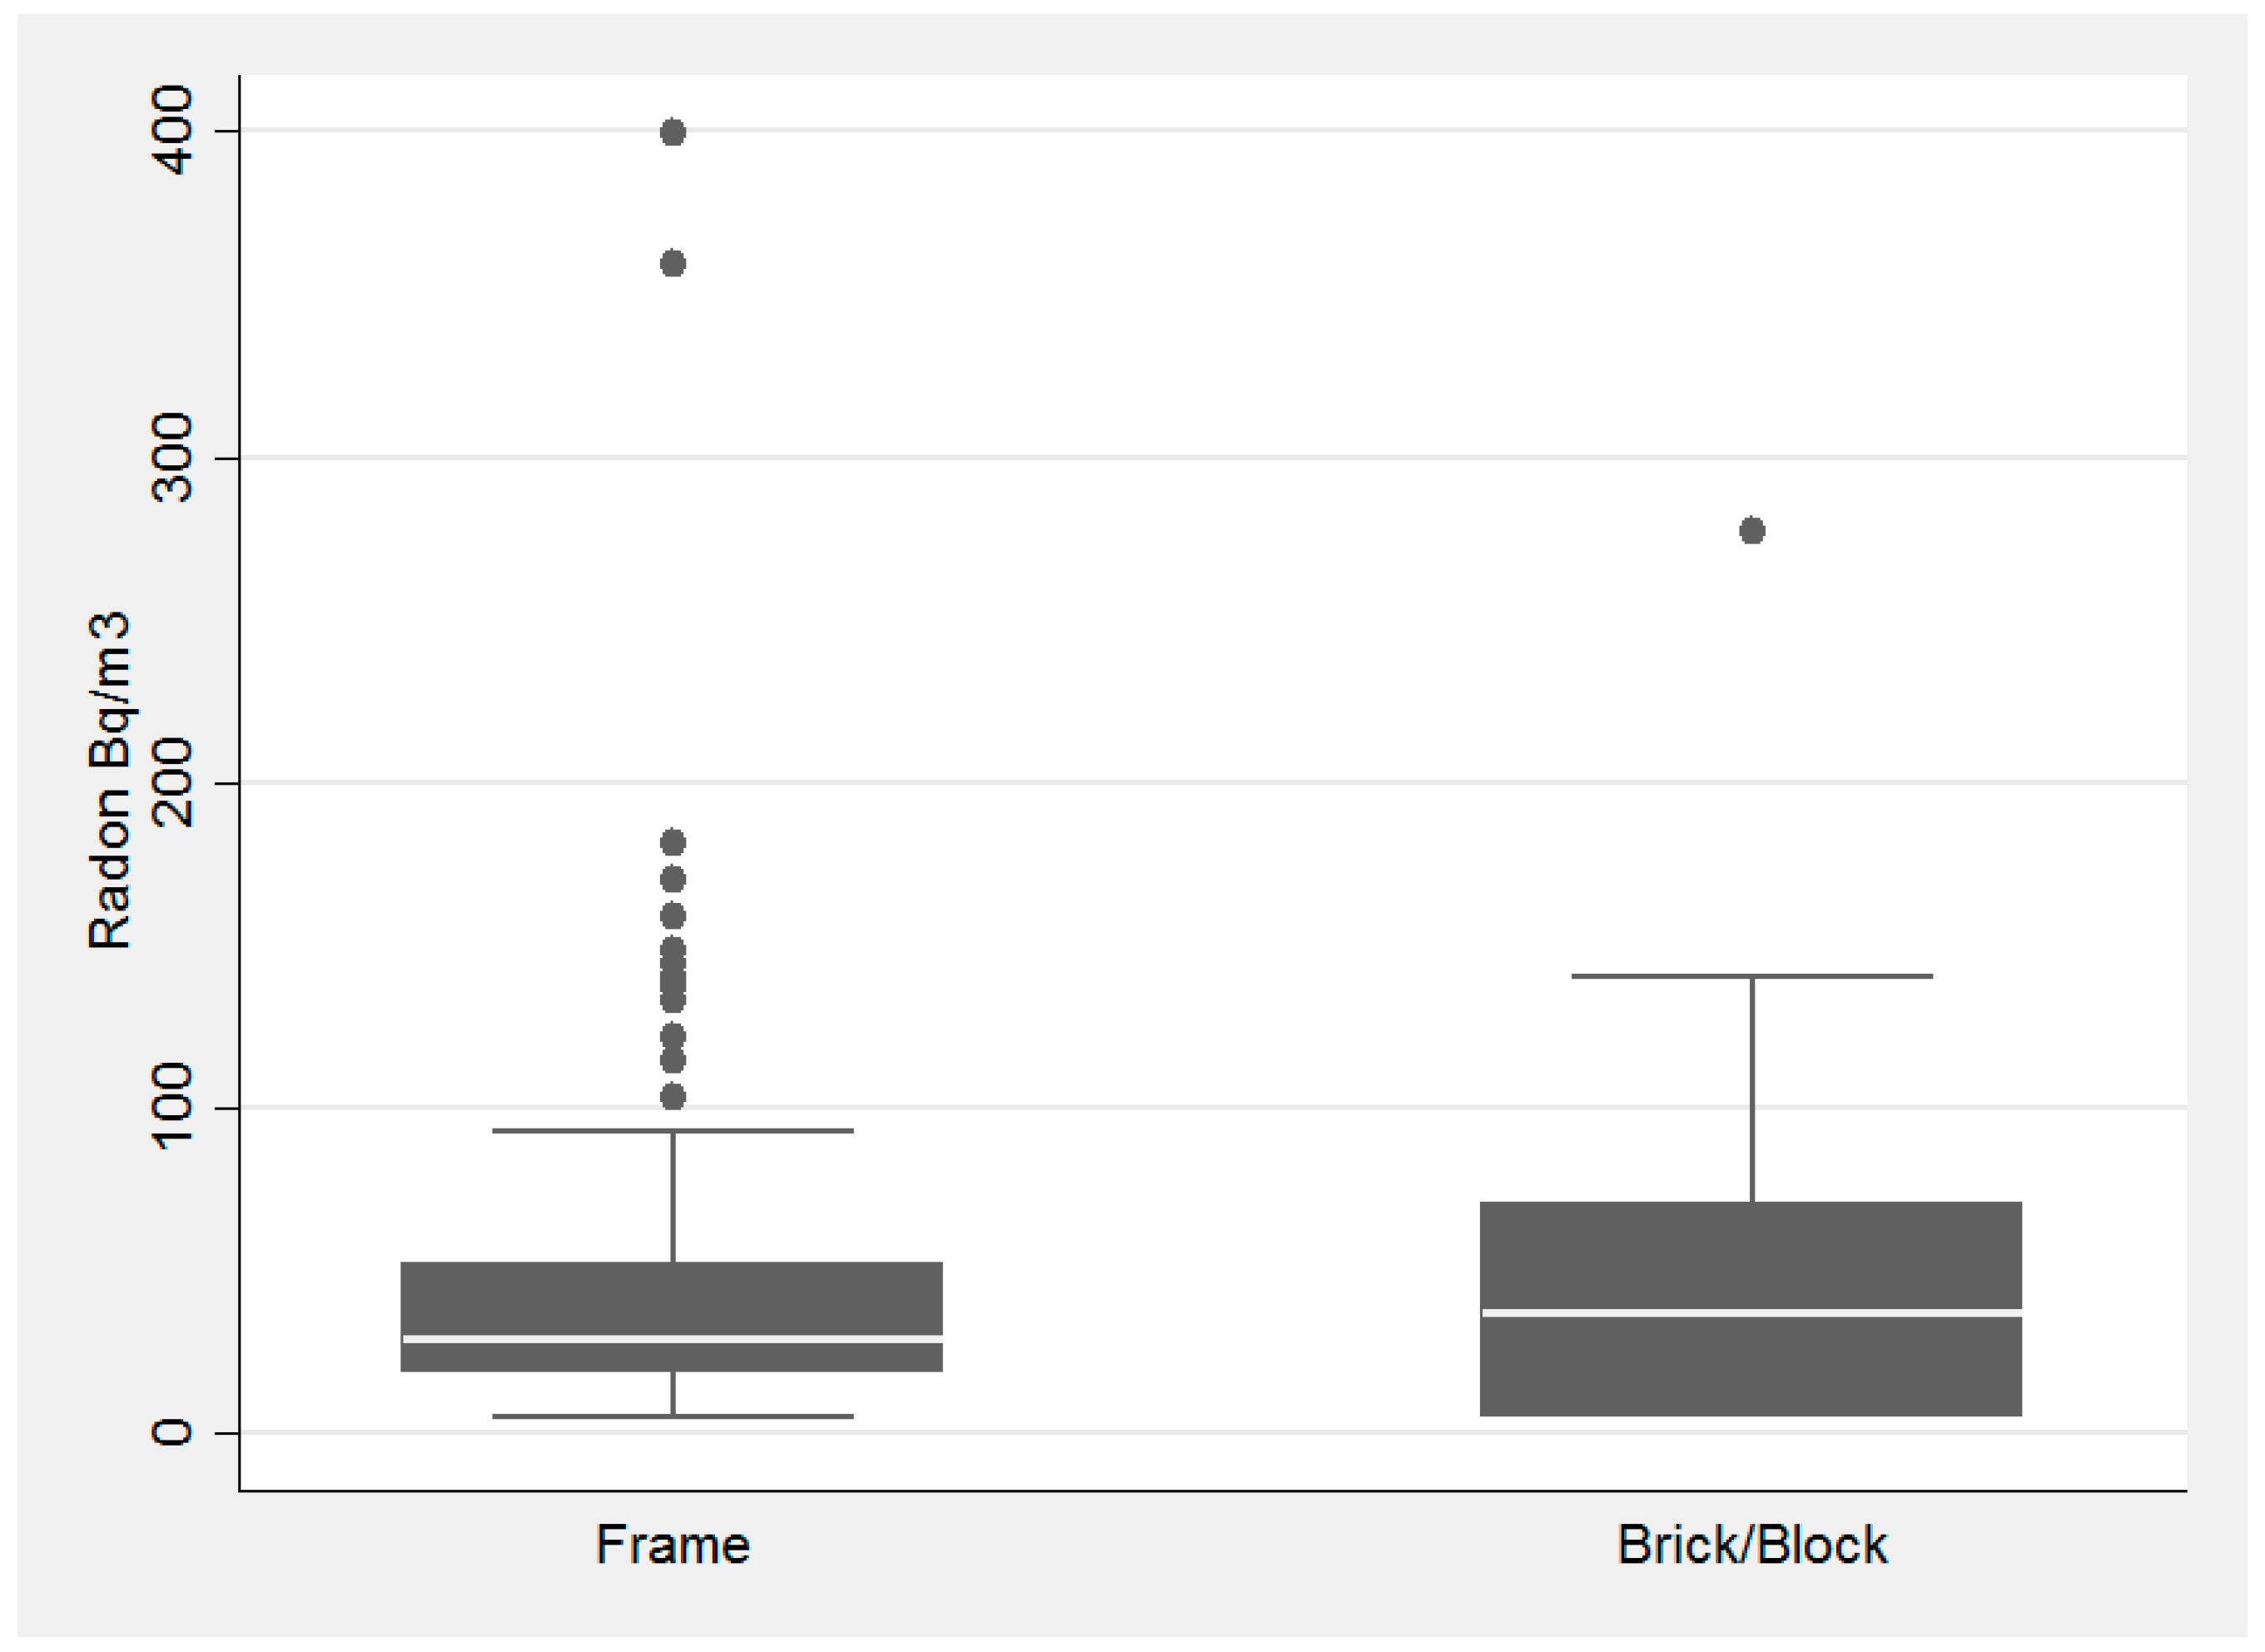
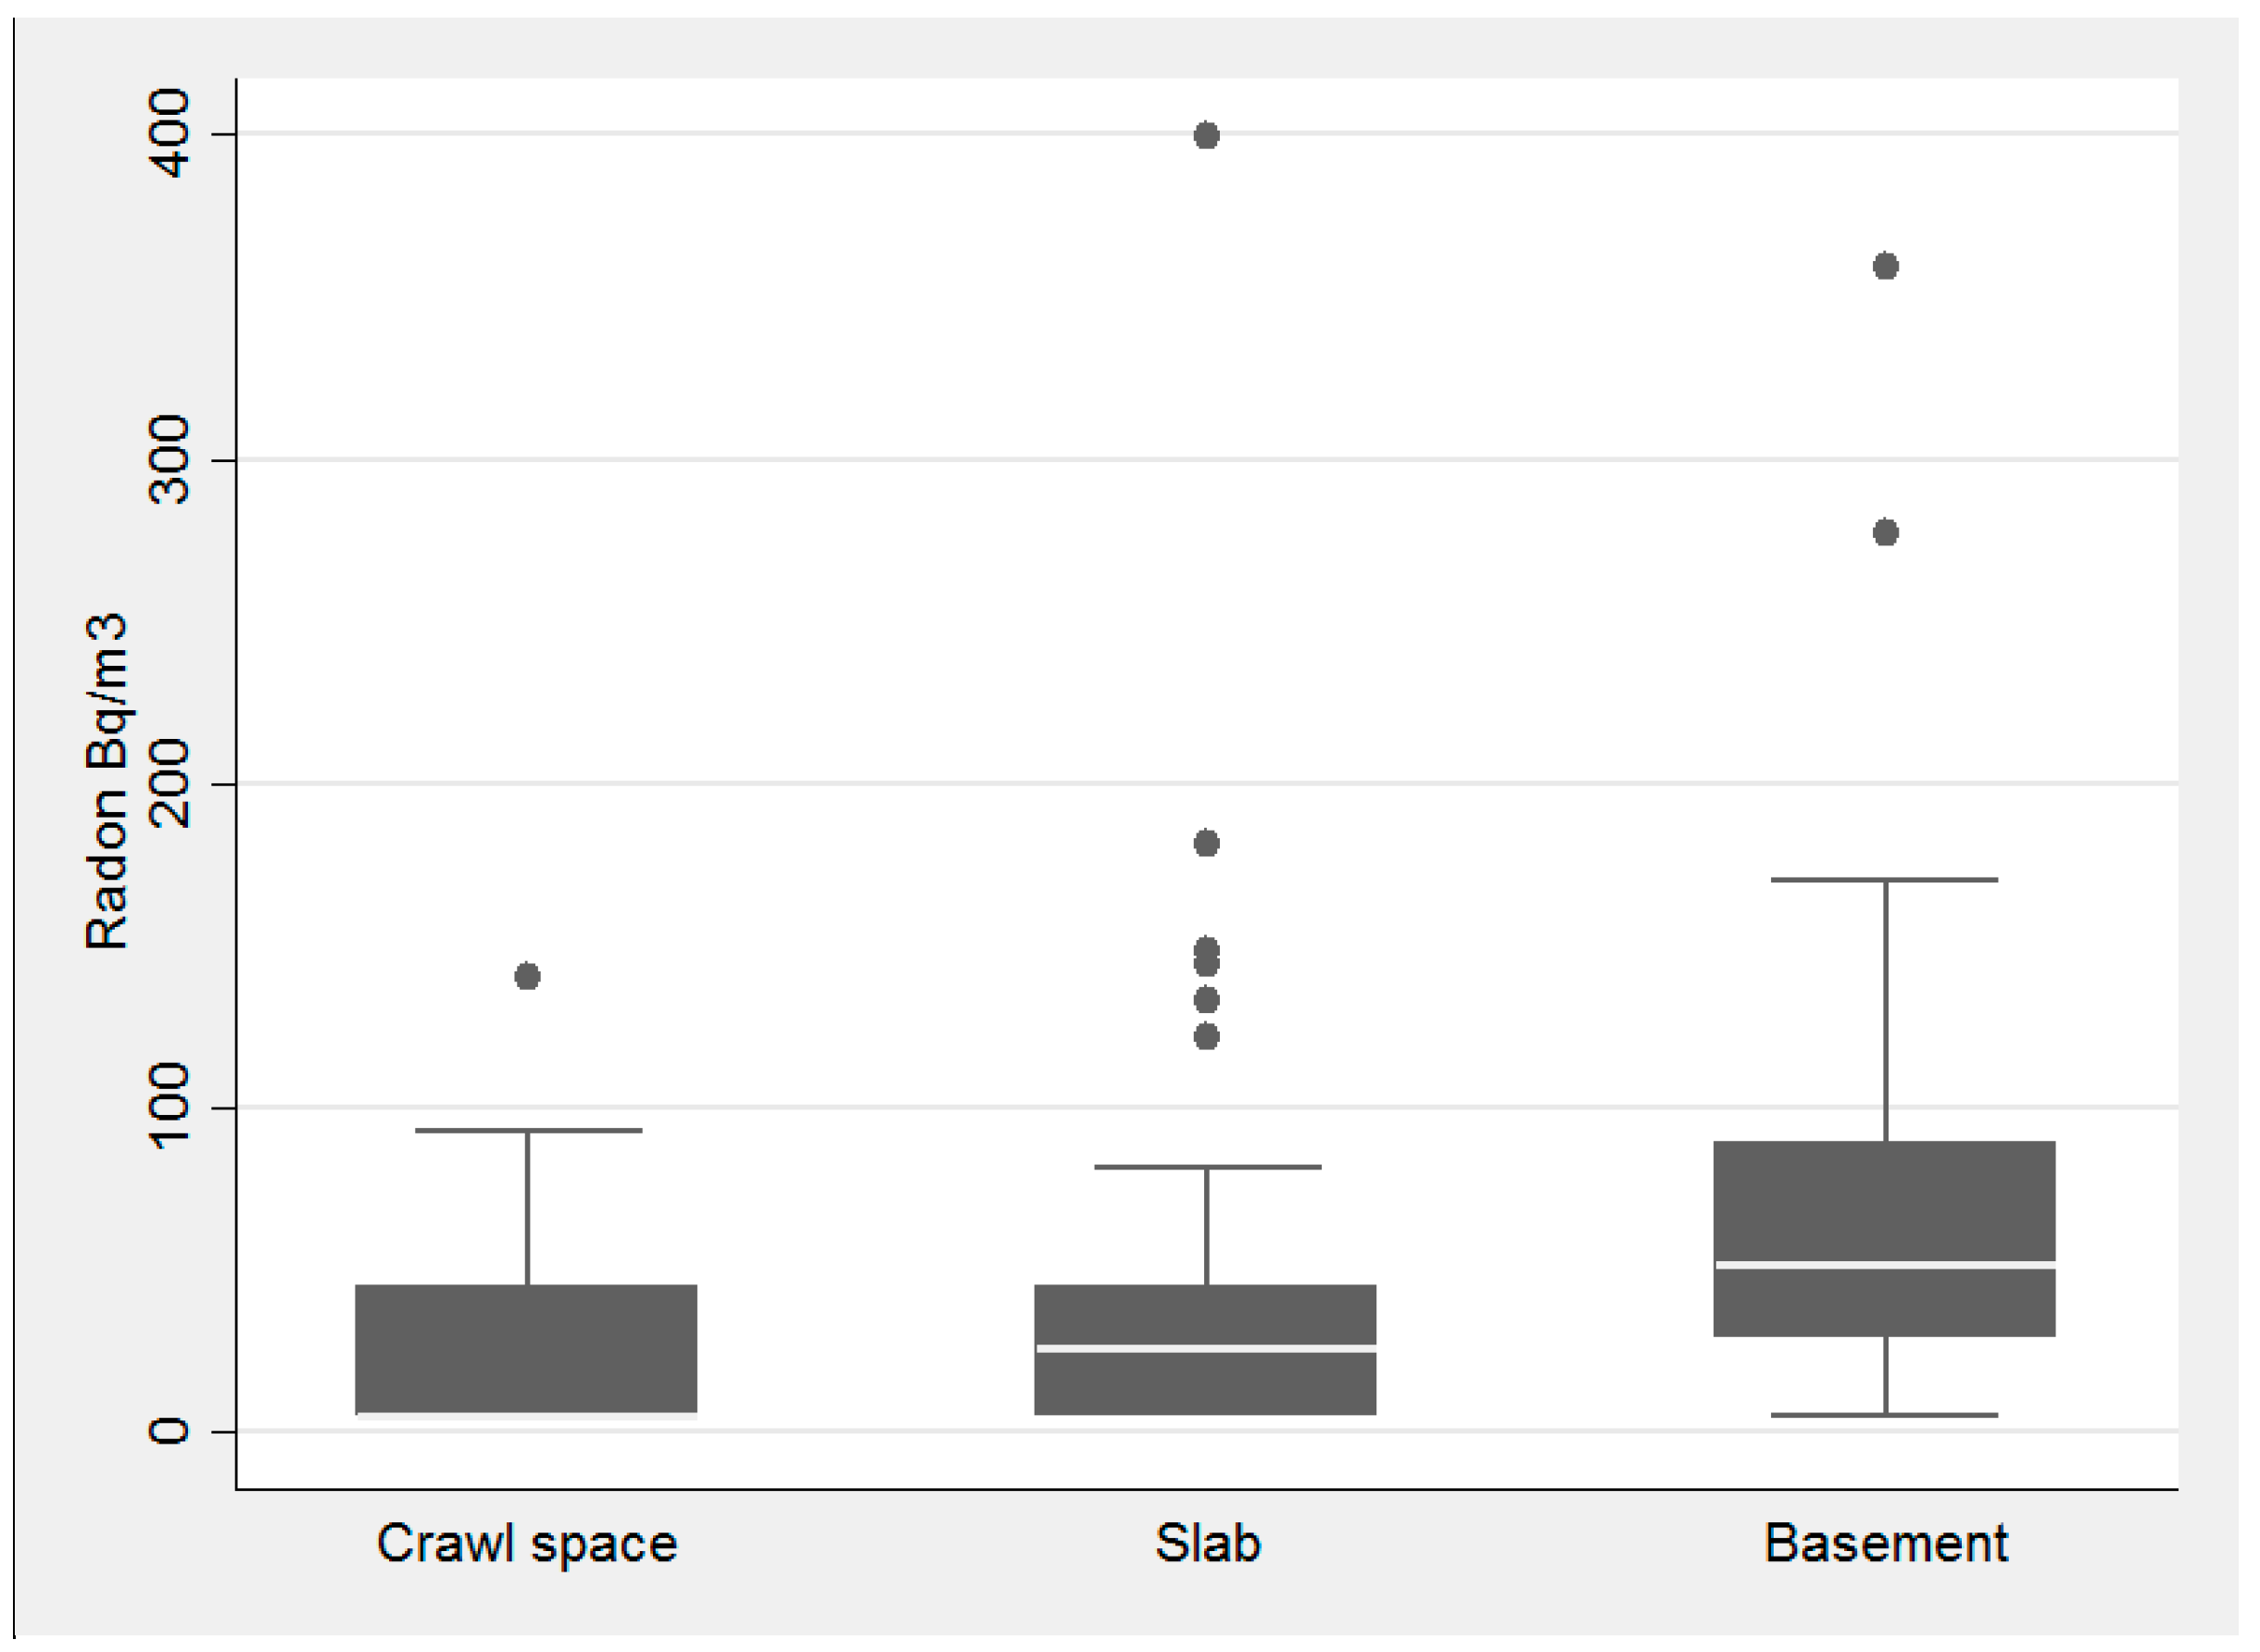
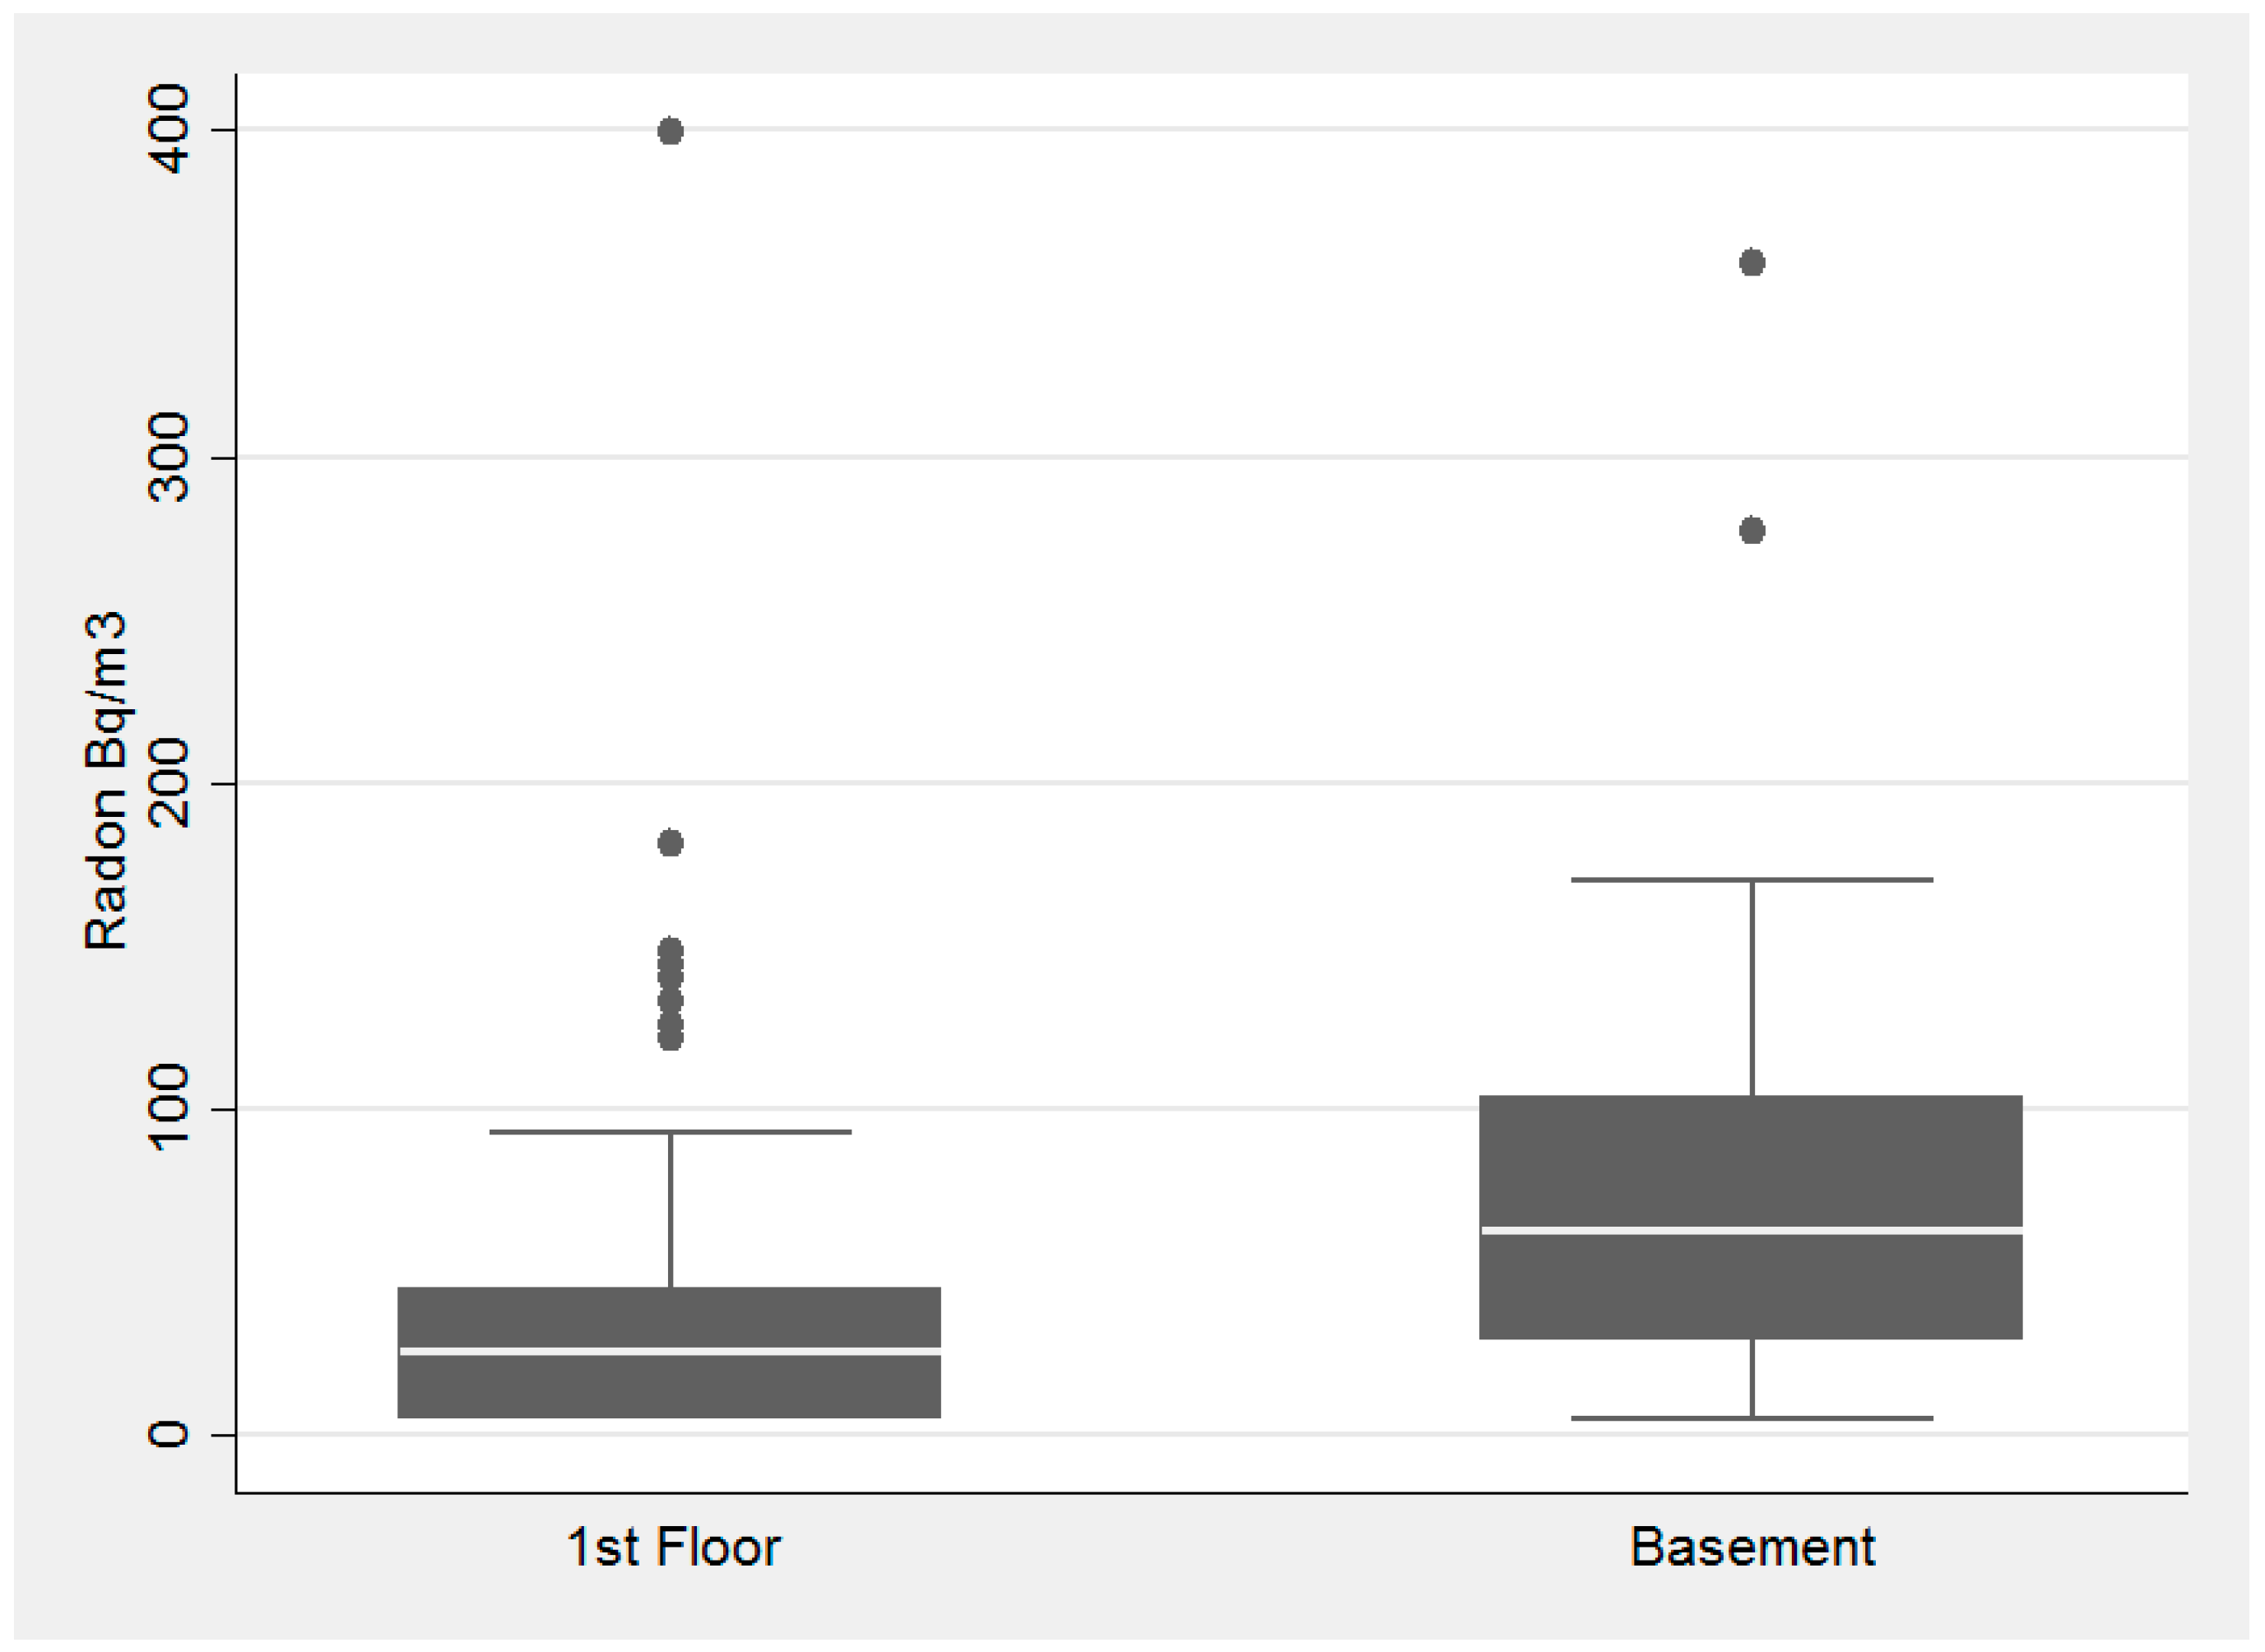
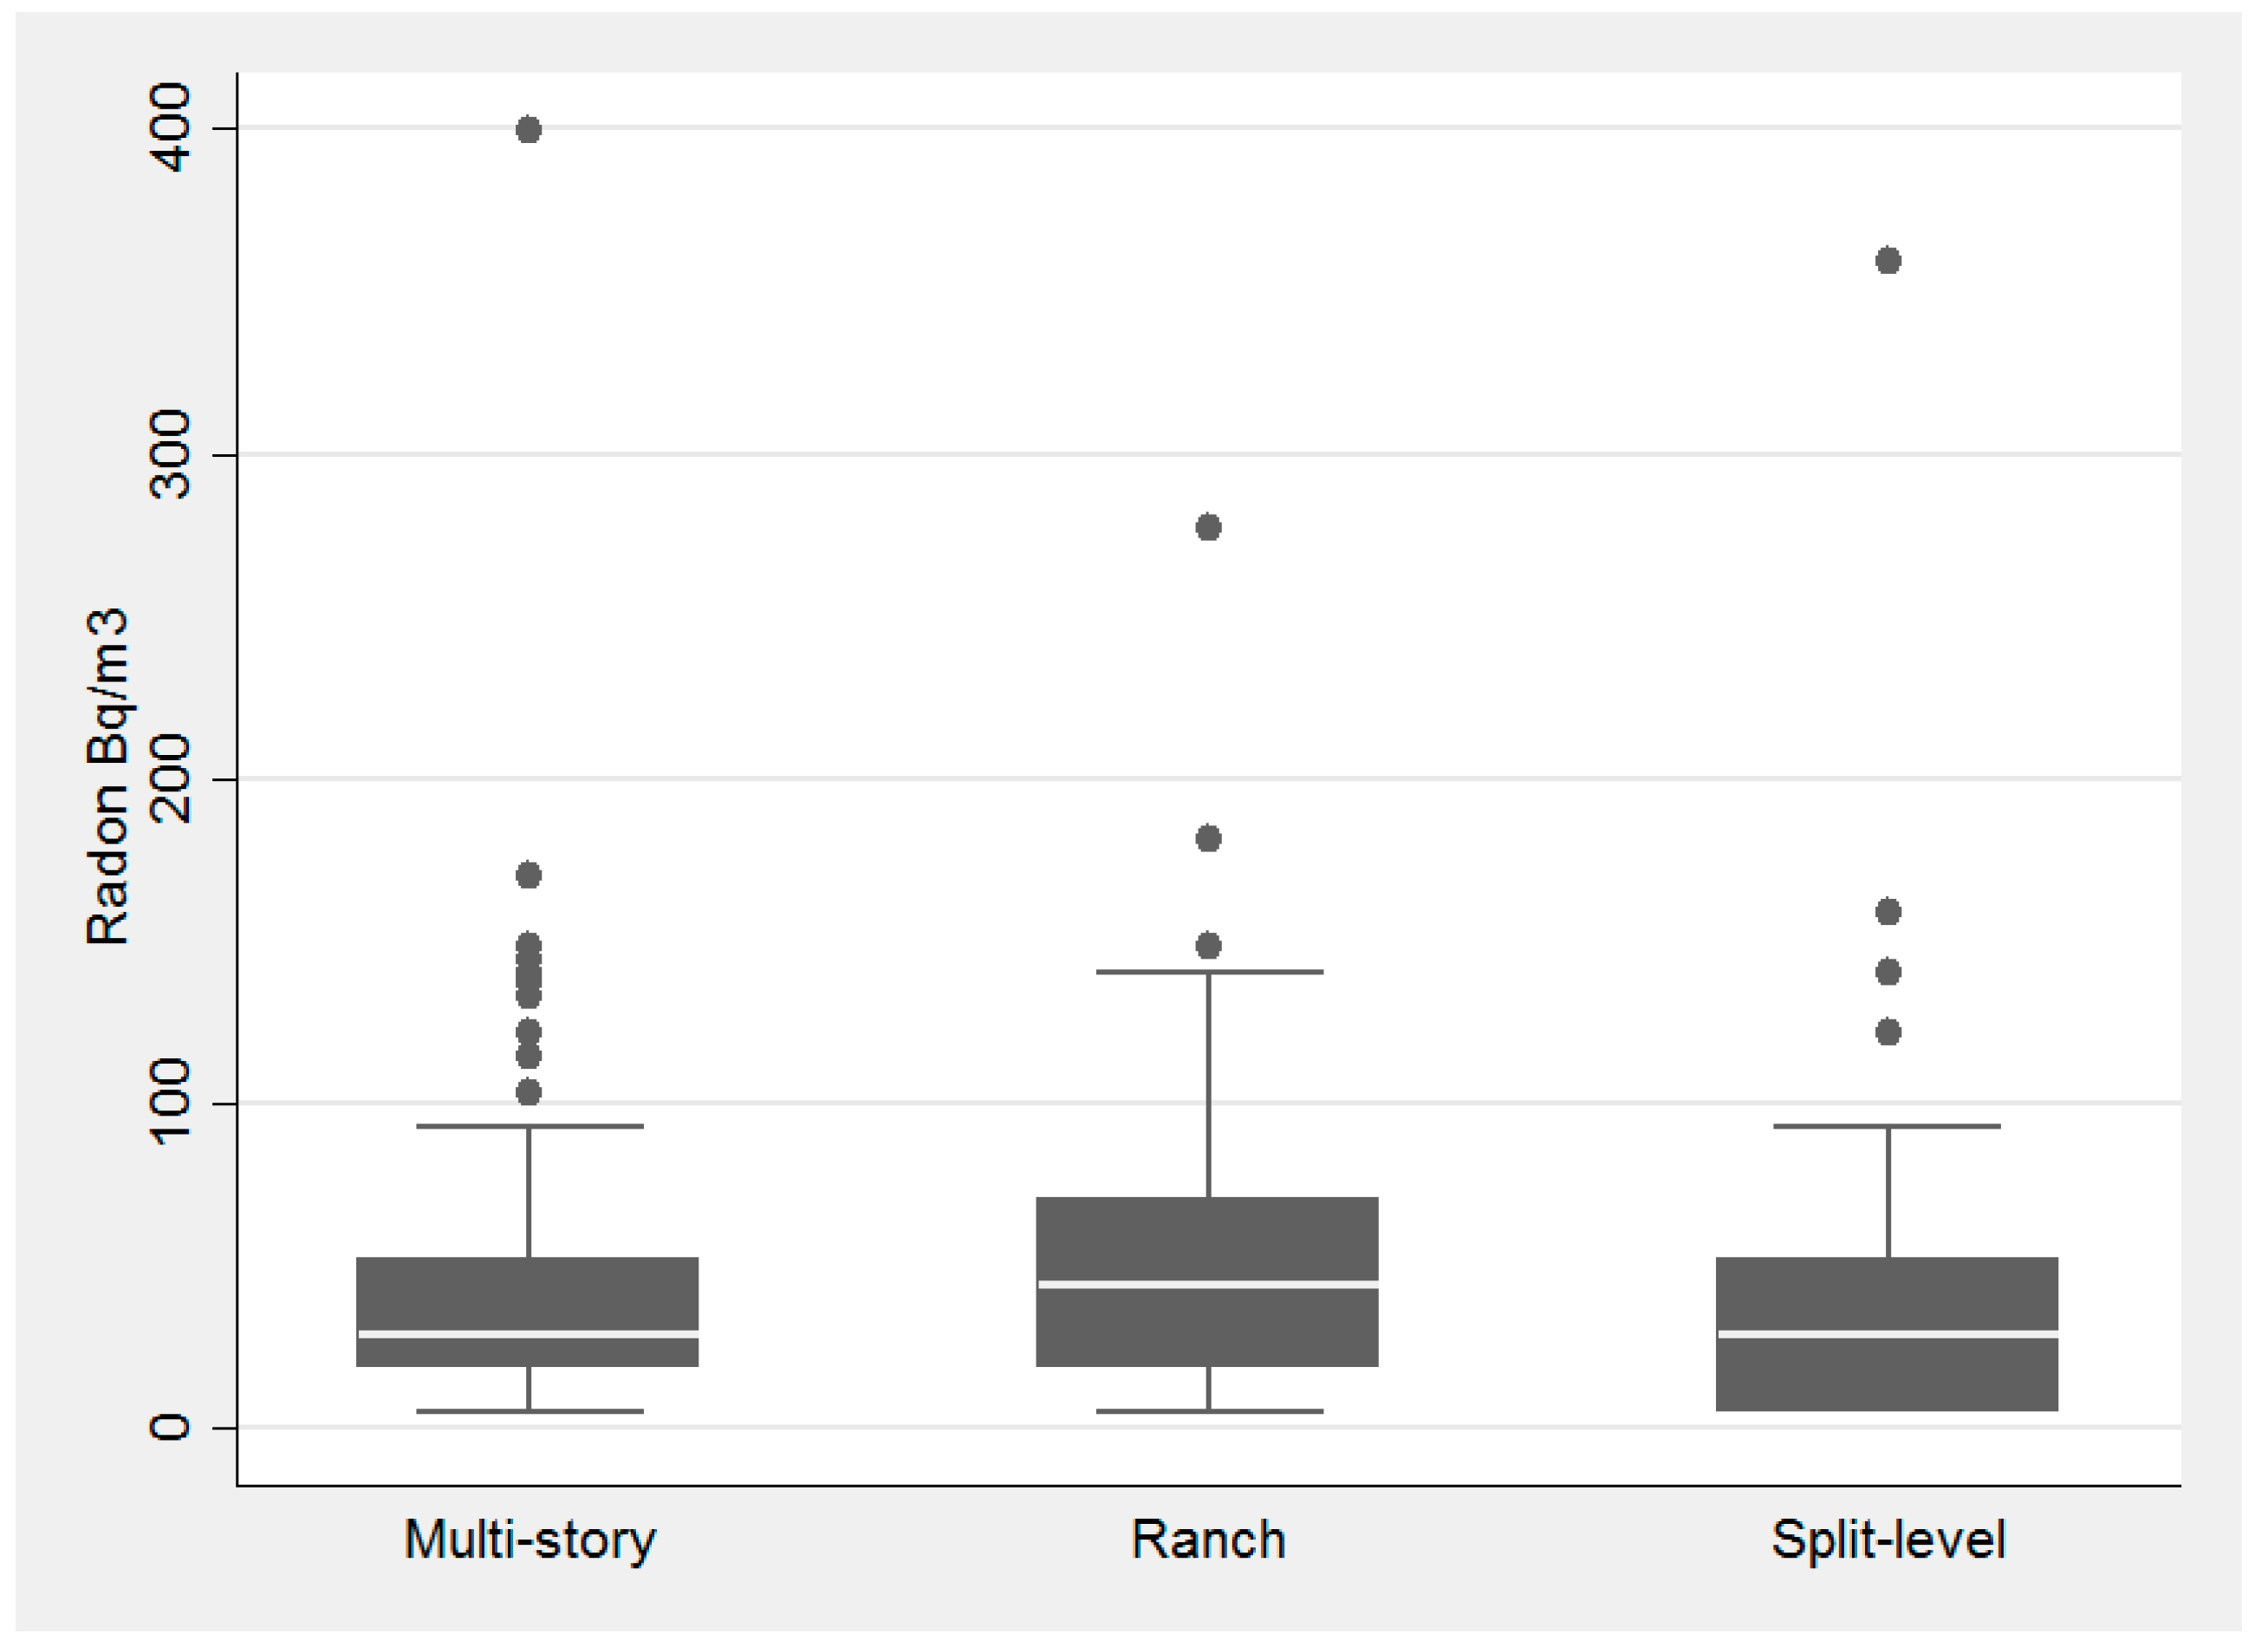
3.3. Examination of Radon and Housing Characteristics

Housing and building type had little influence on radon concentrations, while foundation type had a substantial influence (Figure 3, Figure 4 and Figure 5, respectively). Average radon concentrations were the highest for ranch homes at 56.6 Bq/m3 (1.53 pCi/L), with multi-story and split-level homes at 43.2 Bq/m3 (1.17 pCi/L) and 42.6 Bq/m3 (1.15 pCi/L), respectively (not statistically significant differences). Building type, Figure 4, was also not found to be significantly associated with radon concentrations (p = 0.52 via the Kruskal-Wallis test). With respect to foundation type, basement had the highest interquartile range and there was a statistically significant difference between the three foundation types, p-value = 0.0001 (via Kruskal-Wallis). Houses with basements as their foundation type had the highest average radon concentration of 71.2 Bq/m3 (1.92 pCi/L) with slab and crawl space average concentrations substantially lower at 36.5 Bq/m3 (0.98 pCi/L) and 29.8 Bq/m3 (0.81 pCi/L), respectively.
When examining the location of the radon test kit, there was a statistically significant difference between the basement and first floor as shown in the plot below and evidenced by the Kruskal-Wallis test (p value = 0.001), Figure 6.
The results from bivariate and multivariate logistic regression are shown in Table 3. We examined housing characteristics associated with detecting radon above the test kit limit and found that foundation type was statistically significantly associated with increased odds of detectable levels of radon in both bivariate and multivariate models. Households with a basement were found to have increased odds of detecting radon compared with slab foundations and crawl spaces (which had the lowest odds of detectable radon). We also analyzed factors associated with odds of detecting radon above EPA actionable levels (148 Bq/m3 or 4 pCi/L). In our analysis of housing characteristics that were associated with detection of hazardous levels of radon, both foundation type and location of sample were statistically associated with increased odds of detecting radon >148 Bq/m3 in bivariate analysis. However, when all three housing characteristics were included in the model, both remained positively associated with increased odds of detecting higher levels of radon, but neither remained statistically significant.

4. Discussion

In our pilot study in DeKalb County, GA, USA we successfully recruited 217 geographically random households in 10% of the under-sampled census tracts of the county to participate in radon screening. Based on our spatial analysis, we argue that the sampled locations were geographically representative in their tracts given their random or dispersed distribution. Our estimated response rate of 33% is very similar to Duckworth et al. (2002), which had a 29% response rate for randomly selected households they interviewed and screened for radon in DeKalb County, Illinois, USA [7].
In the pilot samples, we found that 74% of households had radon above 11.1 Bq/m3, with 18% above 74 Bq/m3 (2 pCi/L (EPA moderate risk level)) and 4% above 148 Bq/m3 (4 pCi/L (EPA high risk level)). Aggregate reports from DeKalb County, GA, suggest that approximately 26% of the county samples were found to have moderate levels (between 74 Bq/m3 and 144 Bq/m3) and 17% were found to have hazardous levels [8]. In a recent analysis of more than 3900 indoor samples from DBH and real estate transaction data from DeKalb County, GA over a 20-year period, Neal (2016) [9] found mean indoor concentrations of 70.3 Bq/m3 (1.9 pCi/L) (compared to 45.6 Bq/m3 (1.2 pCi/L) for our samples). In comparison to estimates from DeKalb County, our mean concentration and proportion of samples in the moderate-to-high range may be lower. However, it is difficult to compare our sample populations because of the difference in sample selection procedures. The DBH program is free to households that select the service. However, there is some evidence that awareness and radon tests may be affected by socio-demographic factors [10]. It is also possible that those who select the radon test do so because they are aware of high radon tests in the neighborhood, which might result in a selection of samples that are elevated on average. In our study, approximately half of our participants had not heard of radon before and this was not associated with radon detection in homes or with hazardous levels of radon (data not shown).
Whether or not the lower concentration of radon we found is more typical of the county when randomly sampled would be difficult to say without additional evidence. However, it is possible that these regions were not heavily sampled because they are not prone to high indoor radon measurements and the localized radon potential is low. A recent study conducted in DeKalb County, GA that measured gamma radiation as a potential radon predictor found that, from our pilot study areas, only areas of southeastern DeKalb County had higher radon potential [11]. While our samples suggested lower indoor concentrations (on average), there is still a potential for increased risk of cancer as a result of radon exposure even below EPA action levels. Darby et al., in their case control study on radon and lung cancer, found a linear dose-response relationship between radon concentration and lung cancer risk for households <200 Bq/m3 [3].
In terms of other differences between our sample and the rest of DeKalb County, GA when comparing our 14 census tracts to the rest of the county, we found a statistically significant difference in the proportion of African Americans compared to the rest of the county, 82% versus 46% respectively. Educational attainment, specifically attaining a Bachelor’s degree or higher, was statistically significantly lower in the pilot census tracts (via one-sided test). The other factors, including the proportion in poverty and income, were somewhat lower in our pilot study tracts but were not statistically significant in our analysis. Whether or not socio-economic and demographic differences can fully account for differences in radon screening in the pilot study census tracts is difficult to determine. In their analysis of radon risk perception and socio-demographic correlates using data from the National Health Interview Survey, Halpern and Warner found that minority respondents were less likely to be aware of the harmful effects of radon, yet apparently willing to test once made aware, suggesting that educational outreach programs were not effectively communicating [12]. A smaller, qualitative study in Michigan explored radon perceptions in African Americans and found some inaccurate beliefs regarding radon and concern about ability to avert the exposure [10]. Although we can compare ACS data regarding the census tracts in our study, we did not collect socio-economic or demographic data from our participants and cannot determine whether or not the participants in our random sample would be representative of these census tracts, although the geographic dispersion of the households does suggest a spatially representative sample. As one potential indicator of similarities with health indicators, approximately 20% of the homes in our study had at least one smoker in them, which is similar to data for DeKalb County adults (average 17% adult smokers) [13]. Ultimately, our results suggest that further investigation into socio-demographic and economic indicators for radon awareness and screening in DeKalb County need to be explored to understand how and why people participate in the program and how to maximize its impact as almost half of our participants had not heard of radon but were willing to participate.
In our study, we found that foundation type (i.e., having a basement) was a significant predictor of increased odds of detecting radon. We found that household foundation type was also predictive of odds of radon concentration above EPA action levels (148 Bq/m3 (≥4 pCi/L)) but not when controlling for other housing characteristics. However, it is likely that we were limited in analyzing factors associated with hazardous levels of radon as only 4% of samples (8/201) were found to have this level of radon in the sample. In a study from under-sampled areas in New York, researchers found that a higher proportion of samples from basements exceeded 148 Bq/m3 compared to measurements on other floors of the home [14]. Similarly, researchers in Minnesota also found that concentrations in basements were about twice as high as measurements made on other floors of the home [15]. Our study results are also supported by recent analysis of data from the county from the DBH screening program and real estate transactions in which foundation type was also statistically significantly predictive of hazardous levels of radon, but few other housing characteristics were associated with increased odds of hazardous indoor radon levels [10]. Overall, these data suggest that in DeKalb County, GA, household foundation type should be considered in new construction as a potential way to reduce exposure to radon.
Limitations. This pilot study aimed to understand the spatial distribution of radon within DeKalb County, GA in census tracts with low screening rates. While our sample was randomly assigned, we had difficulty reaching the initially identified household. We estimate our acceptance rate to be approximately 33% (based on recorded visitor logs and willingness to participate once approached). While this is low, it is similar to other studies that attempted to randomly recruit participants [7,14]. The difficulty to reach the desired pilot number of homes may have somewhat impacted the random selection of the households. However, it did not impact the random geographic distribution of the samples. For future work, we propose sharing the information about the study at community and neighborhood meetings prior to study recruitment and also contacting via mailers to further enhance outreach and enhance the ability to generalize results. Seasonal variation was also a limitation to this study. The screening and recruitment process was conducted during the spring months in Georgia in 2015. A requirement for accurate testing using the active-carbon detectors was that all windows and doors remain shut with no fans or air conditioning blowing on the tests, allowing maximum concentrations of radon to be observed. It is possible that households did not observe these conditions and that this reduced detection and diminished concentrations of radon in the home during screening tests. However, the agreement between short-term and long-term radon tests has been estimated to be approximately 90% [4]. Lastly, while our duplicate samples did not suggest any differences in average concentrations taken at the same time (data not shown), if time permitted, repetitive testing of participating homes as well as long-term testing should be examined to understand and identify seasonal variations of radon concentrations in the home as well as more thoroughly estimated exposure.

5. Conclusions

Radon is the second leading cause of lung cancer nationally and its concentration in the indoor environment remains unknown unless tested. Our pilot study of 201 households in 10% of the lowest screened census tracts in DeKalb County, GA, was designed to avoid the potential bias of self-selecting free screening programs. We found that radon exceeded EPA moderate risk levels in 18% of households and exceeded high risk in 4% of the homes tested. While this proportion is lower than other aggregate results from the county, it does suggest that households in under-sampled areas may also be at risk for potential health outcomes from exposure to residential radon. Foundation type—specifically owning a home with a basement—was the factor most likely to be associated with increased radon. Awareness of the dangers of radon is still a barrier that needs to be addressed as half of our study participants had not previously heard of radon but were willing to participate in our study, which suggests that more effective outreach and communication strategies may be successful at increasing screening in under-sampled areas. As the entire county is considered a high-risk zone by EPA, more needs to be done to understand the socio-economic and demographic factors that may be influencing screening prevalence in order to capitalize on the free radon screening resources available to all eligible county residents.

Supplementary Materials

The following are available online at www.mdpi.com/1660-4601/14/3/332/s1, Figure S1: Radon screening prevalence in DeKalb County, GA.

Acknowledgments

The study was supported in part by the National Institute of Minority Health and Health Disparities 1P20MD009572-01 grant. We would like to thank all of the participants who agreed to be in the study. We would also like to thank the two dozen students from Georgia State University School of Public Health and Department of Geosciences (graduate and undergraduate) who worked on the study. We also thank the reviewers for their helpful comments.

Author Contributions

Dajun Dai, Richard Rothenberg, Christine E. Stauber and Scott R. Weaver conceived and designed the experiments; Sydney Chan, Christine Stauber, Dajun Dai and Jeremy E. Diem. performed the experiments; Sydney R. Chan and Christine Stauber analyzed the data; Sydney R. Chan, Christine E. Stauber, Dajun Dai, Scott R. Weaver, Richard Rothenberg and Jeremy E. Diem wrote and edited the paper.

Conflicts of Interest

The authors declare no conflict of interest. The founding sponsors had no role in the design of the study; in the collection, analyses, or interpretation of data; in the writing of the manuscript, and in the decision to publish the results.

References

  1. National Cancer Institute. Available online: https://www.cancer.gov/about-cancer/causes-prevention/risk/substances/radon/radon-fact-sheet (accessed on 13 February 2016).
  2. Darby, S.; Hill, D.; Auvinen, A.; Barros-Dios, J.M.; Baysson, H.; Bochicchio, F.; Deo, H.; Falk, R.; Forastiere, F.; Hakama, M.; et al. Radon in homes and risk of lung cancer: Collaborative analysis of individual data from 13 European case-control studies. BMJ 2005, 330. [Google Scholar] [CrossRef] [PubMed]
  3. Krewski, D.; Lubin, J.H.; Zielinkski, J.M.; Alavanja, M.; Catalan, V.S.; Field, R.W.; Klotz, J.B.; Létourneau, E.G.; Lynch, C.F.; Lyon, J.I.; et al. Residential radon and risk of lung cancer: A combined analysis of 7 North American case-control studies. Epidemiology 2005, 16, 137–145. [Google Scholar] [CrossRef] [PubMed]
  4. George, A.C. The history, development and the present status of the radon measurement programme in the United States of America. Radiat. Prot. Dosim. 2015, 167, 8–14. [Google Scholar] [CrossRef] [PubMed]
  5. Environmental Protect Agency. Available online: https://www.epa.gov/radon/health-risk-radon (accessed on 10 April 2016).
  6. DeKalb County Board of Health. Available online: https://dekalbhealth.net/envhealth/radon/ (accessed on 21 December 2016).
  7. Duckworth, L.T.; Frank-Stromberg, M.; Oleckno, W.A.; Duffy, P.; Burns, K. Relationship of Perception of Radon as a Health Risk and Willingness to Engage in Radon Testing and Mitigation. Oncol. Nurs. Forum. 2002, 29, 1099–1107. [Google Scholar] [CrossRef] [PubMed]
  8. DeKalb County Radon Information. Available online: http://county-radon.info/GA/DeKalb.html (accessed on 20 March 2017).
  9. Neal, F. Geographic Variation of Radon Gas Concentrations in Relationship to Housing Characteristics in Dekalb County, Georgia. Master’s Thesis, Georgia State University, Atlanta, GA, USA, 2016. [Google Scholar]
  10. Wittle, K.; Berkowitz, J.M.; Lillie, J.M.; Cameron, K.A.; Kiu, W.Y. Radon awareness and reduction campaigns for African Americans: A theoretically based evaluation. Health Educ. Behav. 1998, 25, 284–303. [Google Scholar] [CrossRef] [PubMed]
  11. Berens, A. The Use of In Situ Gamma Radiation Measurements as a Method of Determining Radon Potential in Urban Environments. Master’s Thesis, Georgia State University, Atlanta, GA, USA, 2016. [Google Scholar]
  12. Halpern, M.T.; Warner, K.E. Radon risk perception and testing: Sociodemographic correlates. J. Environ. Health 1994, 56, 31–35. [Google Scholar]
  13. Georgia Department of Public Health. Available online: https://dph.georgia.gov/sites/dph.georgia.gov/files/2015%20Georgia%20Tobacco%20Use%20Surveillance%20Report.pdf (accessed on 29 December 2016).
  14. Kitto, M.E. Assessing radon concentrations in areas with few measurements. Environ. Monit. Assess. 2003, 83, 163–175. [Google Scholar] [CrossRef] [PubMed]
  15. Price, P.N.; Nero, A.V.; Gelman, A. Bayesian predictions of mean indoor radon concentrations for Minnesota counties. Health Phys. Soc. 1996, 71, 922–936. [Google Scholar] [CrossRef]
Figure 1. Histogram of radon results from homes tested in the DeKalb County pilot study in 2015.
Ijerph 14 00332 g001
Figure 2. Graduated colors representing radon concentrations for each sample location within the 14 sampled tracts of DeKalb County, GA, in 2015.
Ijerph 14 00332 g002
Figure 3. Association with housing type and radon concentration in the pilot study of homes tested in DeKalb County in 2015.
Ijerph 14 00332 g003
Figure 4. Association with building type and radon concentration in the pilot study of homes tested in DeKalb County in 2015.
Ijerph 14 00332 g004
Figure 5. Association with foundation type and radon concentration in the pilot study of homes tested in DeKalb County in 2015.
Ijerph 14 00332 g005
Figure 6. Association with sample location and radon concentration in the pilot study of homes tested in DeKalb County in 2015.
Ijerph 14 00332 g006
Table 1. American Community Survey data comparing the 14 selected tracts to the rest of DeKalb County.
Socio-Demographic Characteristics14 Sampled TractsRemaining 130 Census Tracts
Population
RaceWhite *12.0%41.6%
Black/African American *81.7%46.5%
American Indian/Alaska Native0.2%0.5%
Asian *3.6%6.0%
Native Hawaiian & Other Pacific Islander<0.1%<0.1%
Other *0.7%3.1%
Education (≥25 years)Less than Highschool (HS)10.2%12.7%
HS Graduate (includes equivalency) *27.4%20.2%
Some college *31.7%24.5%
Bachelor’s degree or higher **30.7%42.5%
Poverty StatusMean income at household level$60,789$77,244
Median income at household level$49,387$58,481
Below poverty level18%15.3%
* Comparisons indicated a statistically significant difference (p < 0.05) via a two-sided Wilcoxon rank-sum test; ** Comparison indicated a statistically significant difference via a one-sided Wilcoxon rank-sum test.
Table 2. Descriptive results of the homes tested in the DeKalb County pilot study in 2015.
Household CharacteristicsAll n (%)Valid Radon Test n (%)
Total households 217201
Smoking in homeYes49 (22.6)49 (24.3)
Children in homeYes109 (50.2)100 (49.8)
Heard of radonNo115 (53.0)106 (52.7)
Floor testedFirst171 (78.8)156 (77.6)
Basement45 (20.7)45 (22.4)
Missing1 (0.5)
Housing typeSplit-level61 (28.1)56 (27.8)
Ranch45 (20.7)41 (20.4)
Multi-story113 (52.1)103 (51.7)
Building typeBlock/Brick44 (20.3)43 (21.4)
Frame140 (64.5)127 (63.2)
Combination32 (14.8)30 (14.9)
Missing1 (0.5)1 (0.5)
Foundation typeBasement59 (27.2)57 (28.4)
Crawl Space25 (11.5)23 (11.4)
Slab133 (61.3)121 (60.2)
Table 3. Bivariate and multivariate logistic regression assessing housing characteristics and radon in homes in DeKalb County, 2015.
Housing Characteristic VariableBivariate Logistic Model (Outcome Radon above ≥11.1) OR (95% CI)Multivariate Model (Outcome Radon above ≥11.1) OR (95% CI)Bivariate Logistic Model (Outcome Radon above ≥148) OR (95% CI)Multivariate Model (Outcome Radon above ≥148) OR (95% CI)
Building type (dichotomous)0.76 (0.36, 1.61)0.56 (0.24, 1.32)0.51 (0.06, 4.26)0.27 (0.03, 2.44)
Foundation type (three-level ordinal)3.65 (1.99, 6.67)3.97 (1.96, 8.02)4.25 (1.07, 16.80)2.19 (0.31, 15.54)
Floor of sample (dichotomous)2.27 (0.94, 5.45)0.80 (0.26, 2.42)6.38 (1.46, 27.81)4.08 (0.47, 35.16)

