Article

The Relationships between PM2.5 and Meteorological Factors in China: Seasonal and Regional Variations

1
School of Geodesy and Geomatics, Wuhan University, Wuhan 430079, China
2
Collaborative Innovation Center of Geospatial Technology, Wuhan University, Wuhan 430079, China
3
School of Resource and Environmental Sciences, Wuhan University, Wuhan 430079, China
4
State Key Laboratory of Information Engineering, Survey Mapping and Remote Sensing, Wuhan University, Wuhan 430079, China
*
Author to whom correspondence should be addressed.
Int. J. Environ. Res. Public Health 2017, 14(12), 1510; https://doi.org/10.3390/ijerph14121510
Submission received: 27 October 2017 / Revised: 26 November 2017 / Accepted: 29 November 2017 / Published: 5 December 2017
(This article belongs to the Section Environmental Health)

Abstract

:
The interactions between PM2.5 and meteorological factors play a crucial role in air pollution analysis. However, previous studies that have researched the relationships between PM2.5 concentration and meteorological conditions have been mainly confined to a certain city or district, and the correlation over the whole of China remains unclear. Whether spatial and seasonal variations exist deserves further research. In this study, the relationships between PM2.5 concentration and meteorological factors were investigated in 68 major cities in China for a continuous period of 22 months from February 2013 to November 2014, at season, year, city, and regional scales, and the spatial and seasonal variations were analyzed. The meteorological factors were relative humidity (RH), temperature (TEM), wind speed (WS), and surface pressure (PS). We found that spatial and seasonal variations of their relationships with PM2.5 exist. Spatially, RH is positively correlated with PM2.5 concentration in north China and Urumqi, but the relationship turns to negative in other areas of China. WS is negatively correlated with PM2.5 everywhere except for Hainan Island. PS has a strong positive relationship with PM2.5 concentration in northeast China and mid-south China, and in other areas the correlation is weak. Seasonally, the positive correlation between PM2.5 concentration and RH is stronger in winter and spring. TEM has a negative relationship with PM2.5 in autumn and the opposite in winter. PS is more positively correlated with PM2.5 in autumn than in other seasons. Our study investigated the relationships between PM2.5 and meteorological factors in terms of spatial and seasonal variations, and the conclusions about the relationships between PM2.5 and meteorological factors are more comprehensive and precise than before. We suggest that the variations could be considered in PM2.5 concentration prediction and haze control to improve the prediction accuracy and policy efficiency.

1. Introduction

Clean air is a basic requirement of human comfort, health, and well-being [1]. However, in recent decades, with the rapid development of the economy, a series of environmental problems have been brought about, especially air pollution [2]. A study by the World Health Organization (WHO) showed that the premature deaths of more than two million people each year can be attributed to the effects of air pollution during the 21st century, and more than half of these deaths happened in developing countries, particularly in China and India [3]. The serious adverse effect of air pollution makes it a hotspot of public concern and scientific study. PM2.5 (particulate matter with an aerodynamic diameter of less than 2.5 µm) is one of the most harmful components in air pollutants [4]. A high concentration of PM2.5 can have an adverse impact on human health [5,6,7], climate change [8,9], local ecosystems [10], and economic development [11]. Besides, it has also been found that a high concentration of PM2.5 is associated with changes in the vertical structure of clouds [12,13], which leads to the delayed initiation of precipitation and lightning [14], and reduces occurrence of local-scale precipitation [15]. As former studies have showed, high PM2.5 concentrations can be attributed not only to increasing emissions [16,17], but also to many natural geographical factors, such as topography, vegetation, and climate [18,19,20,21]. Among these influencing factors, meteorological conditions are some of the most important factors [22]. The study of the relationships between meteorological conditions and PM2.5 concentration could help us to have a better understanding of the PM2.5 pollution problem, and could contribute to the adoption of more effective measures to reduce PM2.5 pollution.
To date, there have been many studies about the relationships between PM2.5 concentration and meteorological conditions. For example, Chen et al. studied the relationships between PM2.5 and meteorological factors in the Nanjing urban area from 2013 to 2015 [23], and found a negative correlation between PM2.5 concentration and wind speed, temperature, relative humidity, and precipitation. Li et al. conducted a similar analysis in the Sichuan Basin [24], and found that PM2.5 concentration was negatively correlated with wind speed and air temperature, positively correlated with air pressure, and weakly correlated with relative humidity. The relationships between PM2.5 concentration and meteorological factors have also been examined in many other cities such as Beijing, Shanghai, Guangzhou, and Wuhan, and areas such as Beijing-Tianjin-Hebei (BTH) [20,25,26,27,28]. Many studies have already proven that the correlations between PM2.5 concentration and meteorological factors vary with the seasons. For example, Chen et al. found that the correlation between PM2.5 and temperature (TEM) was negative in summer and autumn and then turned to positive in spring and winter [23]. Chen et al. found that wind was negatively correlated with PM2.5 in winter, but the correlation was weak in summer [28]. However, besides seasonal variations, it has also been found that the relationships between PM2.5 concentration and meteorological factors vary between regions. Taking the correlation between PM2.5 concentration and relative humidity as an example, Huang et al. found a positive correlation between PM2.5 concentration and relative humidity in Beijing [25], but Chen et al. reported a negative correlation in the Nanjing urban area [23]. As for Li et al., they came to the conclusion that PM2.5 concentration was weakly correlated with relative humidity in the Sichuan Basin [24]. PM2.5 concentration was also found to be negatively correlated with WS in Guangzhou in a study by Zhang et al. [27], but, in another analysis in Shijiazhuang, the result was a weak correlation [28]. The reason for the spatial variations is that meteorological factors affect PM2.5 concentration through a series of conflicting processes, and the final effect is a synthetic result depending on the local climate, terrain, and PM2.5 components. For example, on the one hand, high temperature can promote the formation of secondary aerosols [29] and increase PM2.5 concentration but, on the other hand, high temperature can also promote the convection of air [1], thus creating better diffusion conditions for particulate matter and decreasing PM2.5 concentration. Temperature can also influence PM2.5 concentration through promoting the volatilization of ammonium nitrate [30] and affect the emission rates from domestic heating and power production [31]. In China, the sources and components of PM2.5, the local climate, and terrain are very complicated [32,33], making the influencing degree of the different processes vary by region. As a result, the relationships between PM2.5 concentration and meteorological factors are spatially heterogeneous. Therefore, only through comparisons between different regions can we describe the relationships between PM2.5 concentration and meteorological factors more precisely and in more detail. Previous studies that were mainly confined to one city or district were not able to comprehensively investigate the relationships between PM2.5 and meteorological factors. Correspondingly, their conclusions can only be applied to local regions and cannot provide useful suggestions for governmental decisions at a national scale. There have been some studies at a national scale [1], but, in their analysis, China was regarded as one district, and the variations between the different regions were still ignored. At all events, the neglect of the regional variations makes the relationships between PM2.5 concentration and meteorological factors still unclear in China. What is required is analyses including a larger number of cities and areas, and the variations among different regions and seasons need to be examined and summarized.
The goal of our study was to comprehensively investigate the relationships between PM2.5 concentration and meteorological factors to obtain a clear picture of their relationships in China. In this study, we conducted a correlation analysis in 68 major cities and seven geographic regions in China based on a 22-month record of observations for 2013–2014. The correlation coefficient (r) values of the different cities and areas were then compared and the varying patterns summarized. The seasonal differences of the relationships were also analyzed. The conclusions of this study could be utilized to improve the understanding of the formation mechanisms of air pollution and the accuracy of PM2.5 forecasting, and could provide a reference for environmental management policy decision-making.

2. Materials and Methods

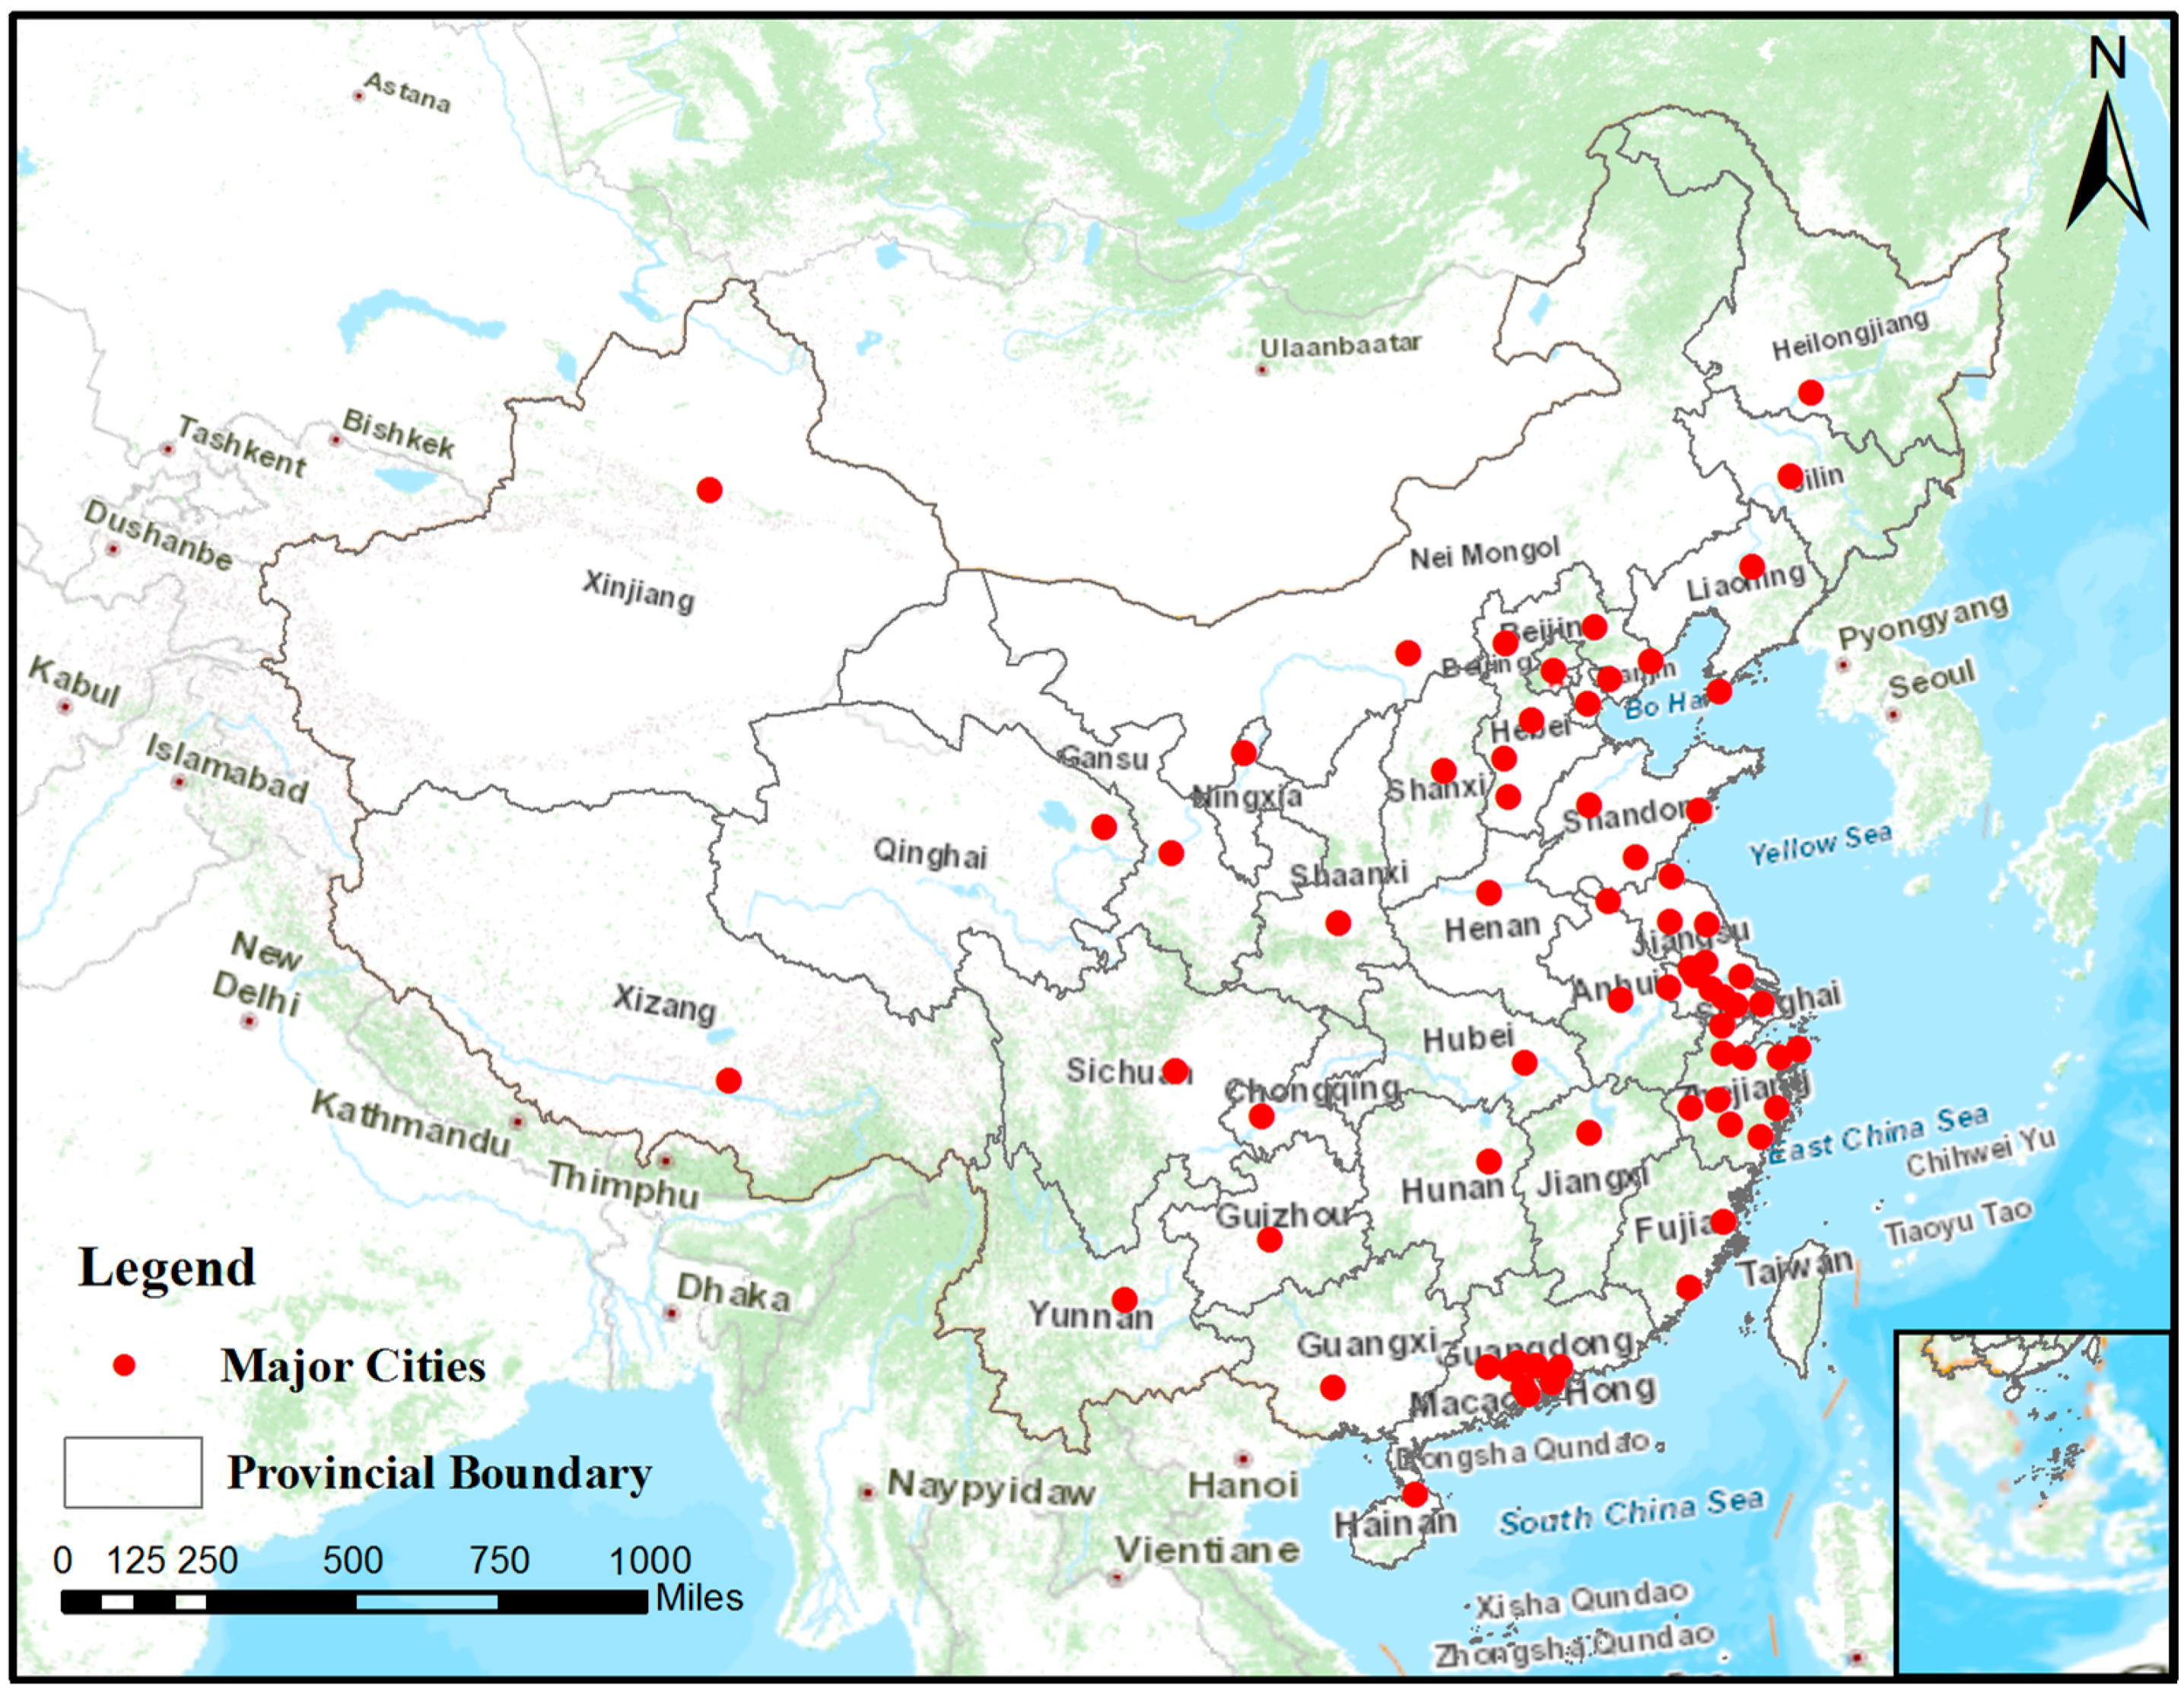
2.1. Study Area and Period

China is the third largest country in the world, and has the largest population of any country. In recent years, it has witnessed a great leap in the economy; however, the rapid growth of Chinese cities has also resulted in lots of pollution, and China has already become one of the most seriously polluted countries in the world. Our study concentrated on the 74 major cities in China, as defined by the China National Ambient Air Quality Standard (CNAAQS, GB3095-2012), including the BTH, Yangtze River Delta (YRD), and Pearl River Delta (PRD) regions and municipalities, capital cities of the first-level administrative divisions, and other cities listed in the State Economic Plan. Because of insufficient data, six cities (Handan, Langfang, Cangzhou, Hengshui, Jiaxing, and Jiangmen) were not included in the final correlation analysis. The locations of the other 68 cities are shown in Figure 1. Although most of the cities are located in the PRD, YRD, and BTH regions, the 68 cities are spread over all of China, making the analysis of regional variations feasible. The time range of our study was from 3 February 2013 to 30 November 2014, i.e., 22 months/666 days in total. Due to instrument measurement error, data transmission error, and other reasons, data for some days were missing, and thus the number of days of data actually used in the calculation was slightly less than 666 days. Four meteorological factors were studied in our research: relative humidity (RH), temperature (TEM), wind speed (WS), and surface pressure (PS).

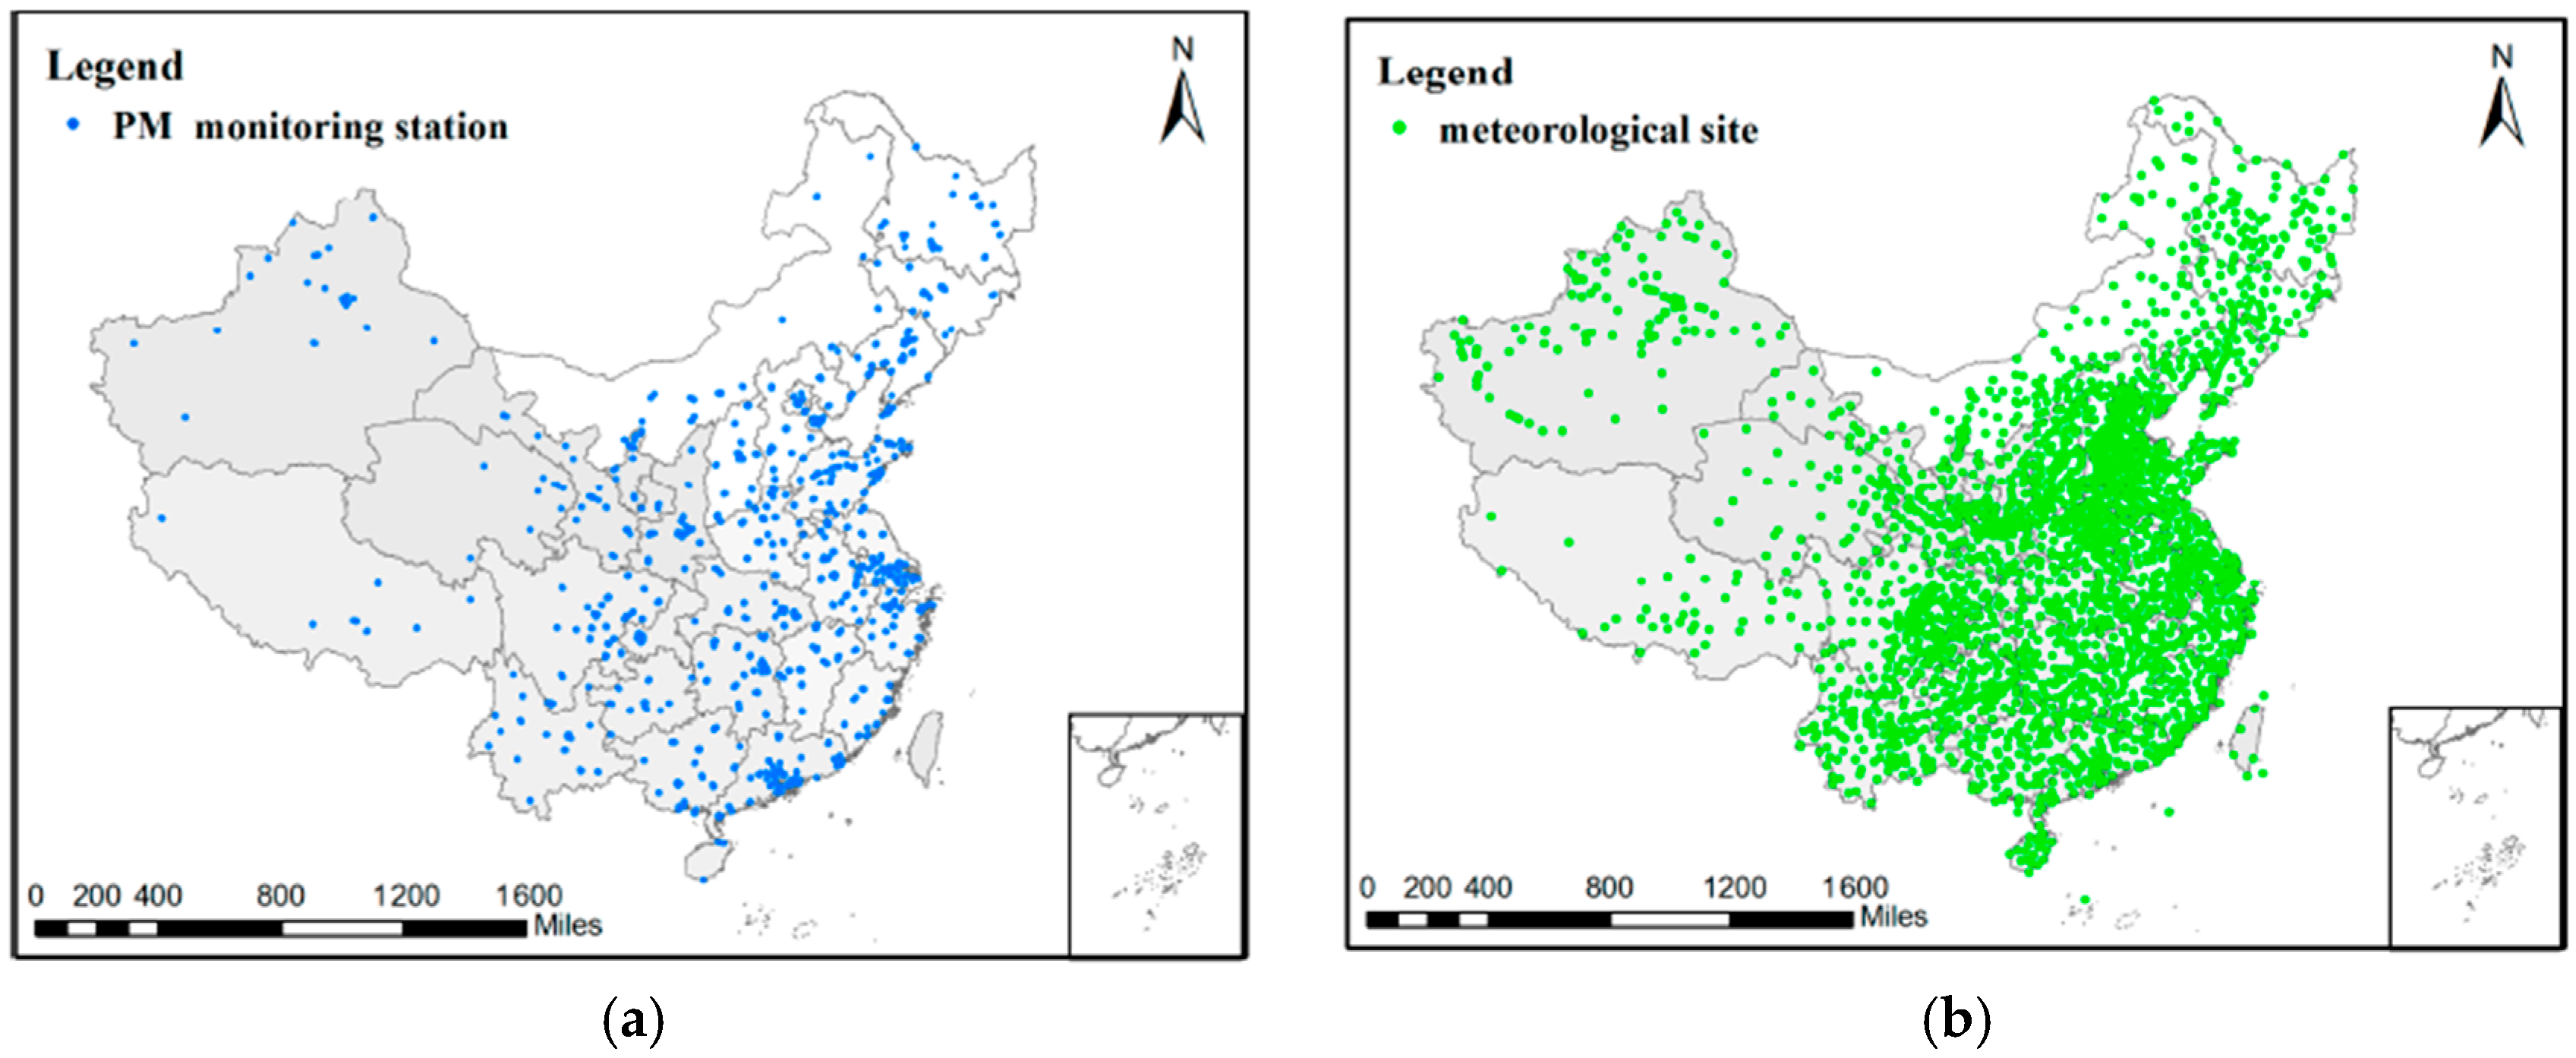
2.2. Data Collection

Since 2012, the 74 major cities in China have started building PM2.5 monitoring sites, and air quality data have been published online since January 2013. We downloaded the daily PM2.5 concentration data from the Data Center of the Ministry of Environmental Protection of the People’s Republic of China (http://datacenter.mep.gov.cn/index), from 2013 to 2015. By December 2015, the number of PM2.5 monitoring station exceeded 1440. The distribution of these monitoring sites in 2015 is shown in Figure 2a. The PM2.5 concentration is measured by Tapered Element Oscillating Microbalance (TEOM) or beta attenuation monitor.
Meteorological data were downloaded from the China Meteorological Data Network (http://data.cma.cn/site/index.html). Relative humidity data were obtained from China’s Ground Daily Climatological Data Collection, with the temporal resolution of one day and the time system of Beijing Time. Temperature, wind speed, and air pressure data were obtained from the Global Ground Meteorological Real-time Data Collection, with a temporal resolution of 3 h and the time system of Greenwich Mean Time. There are numerous meteorological sites in China, and most of them are distributed evenly, as shown in Figure 2b.

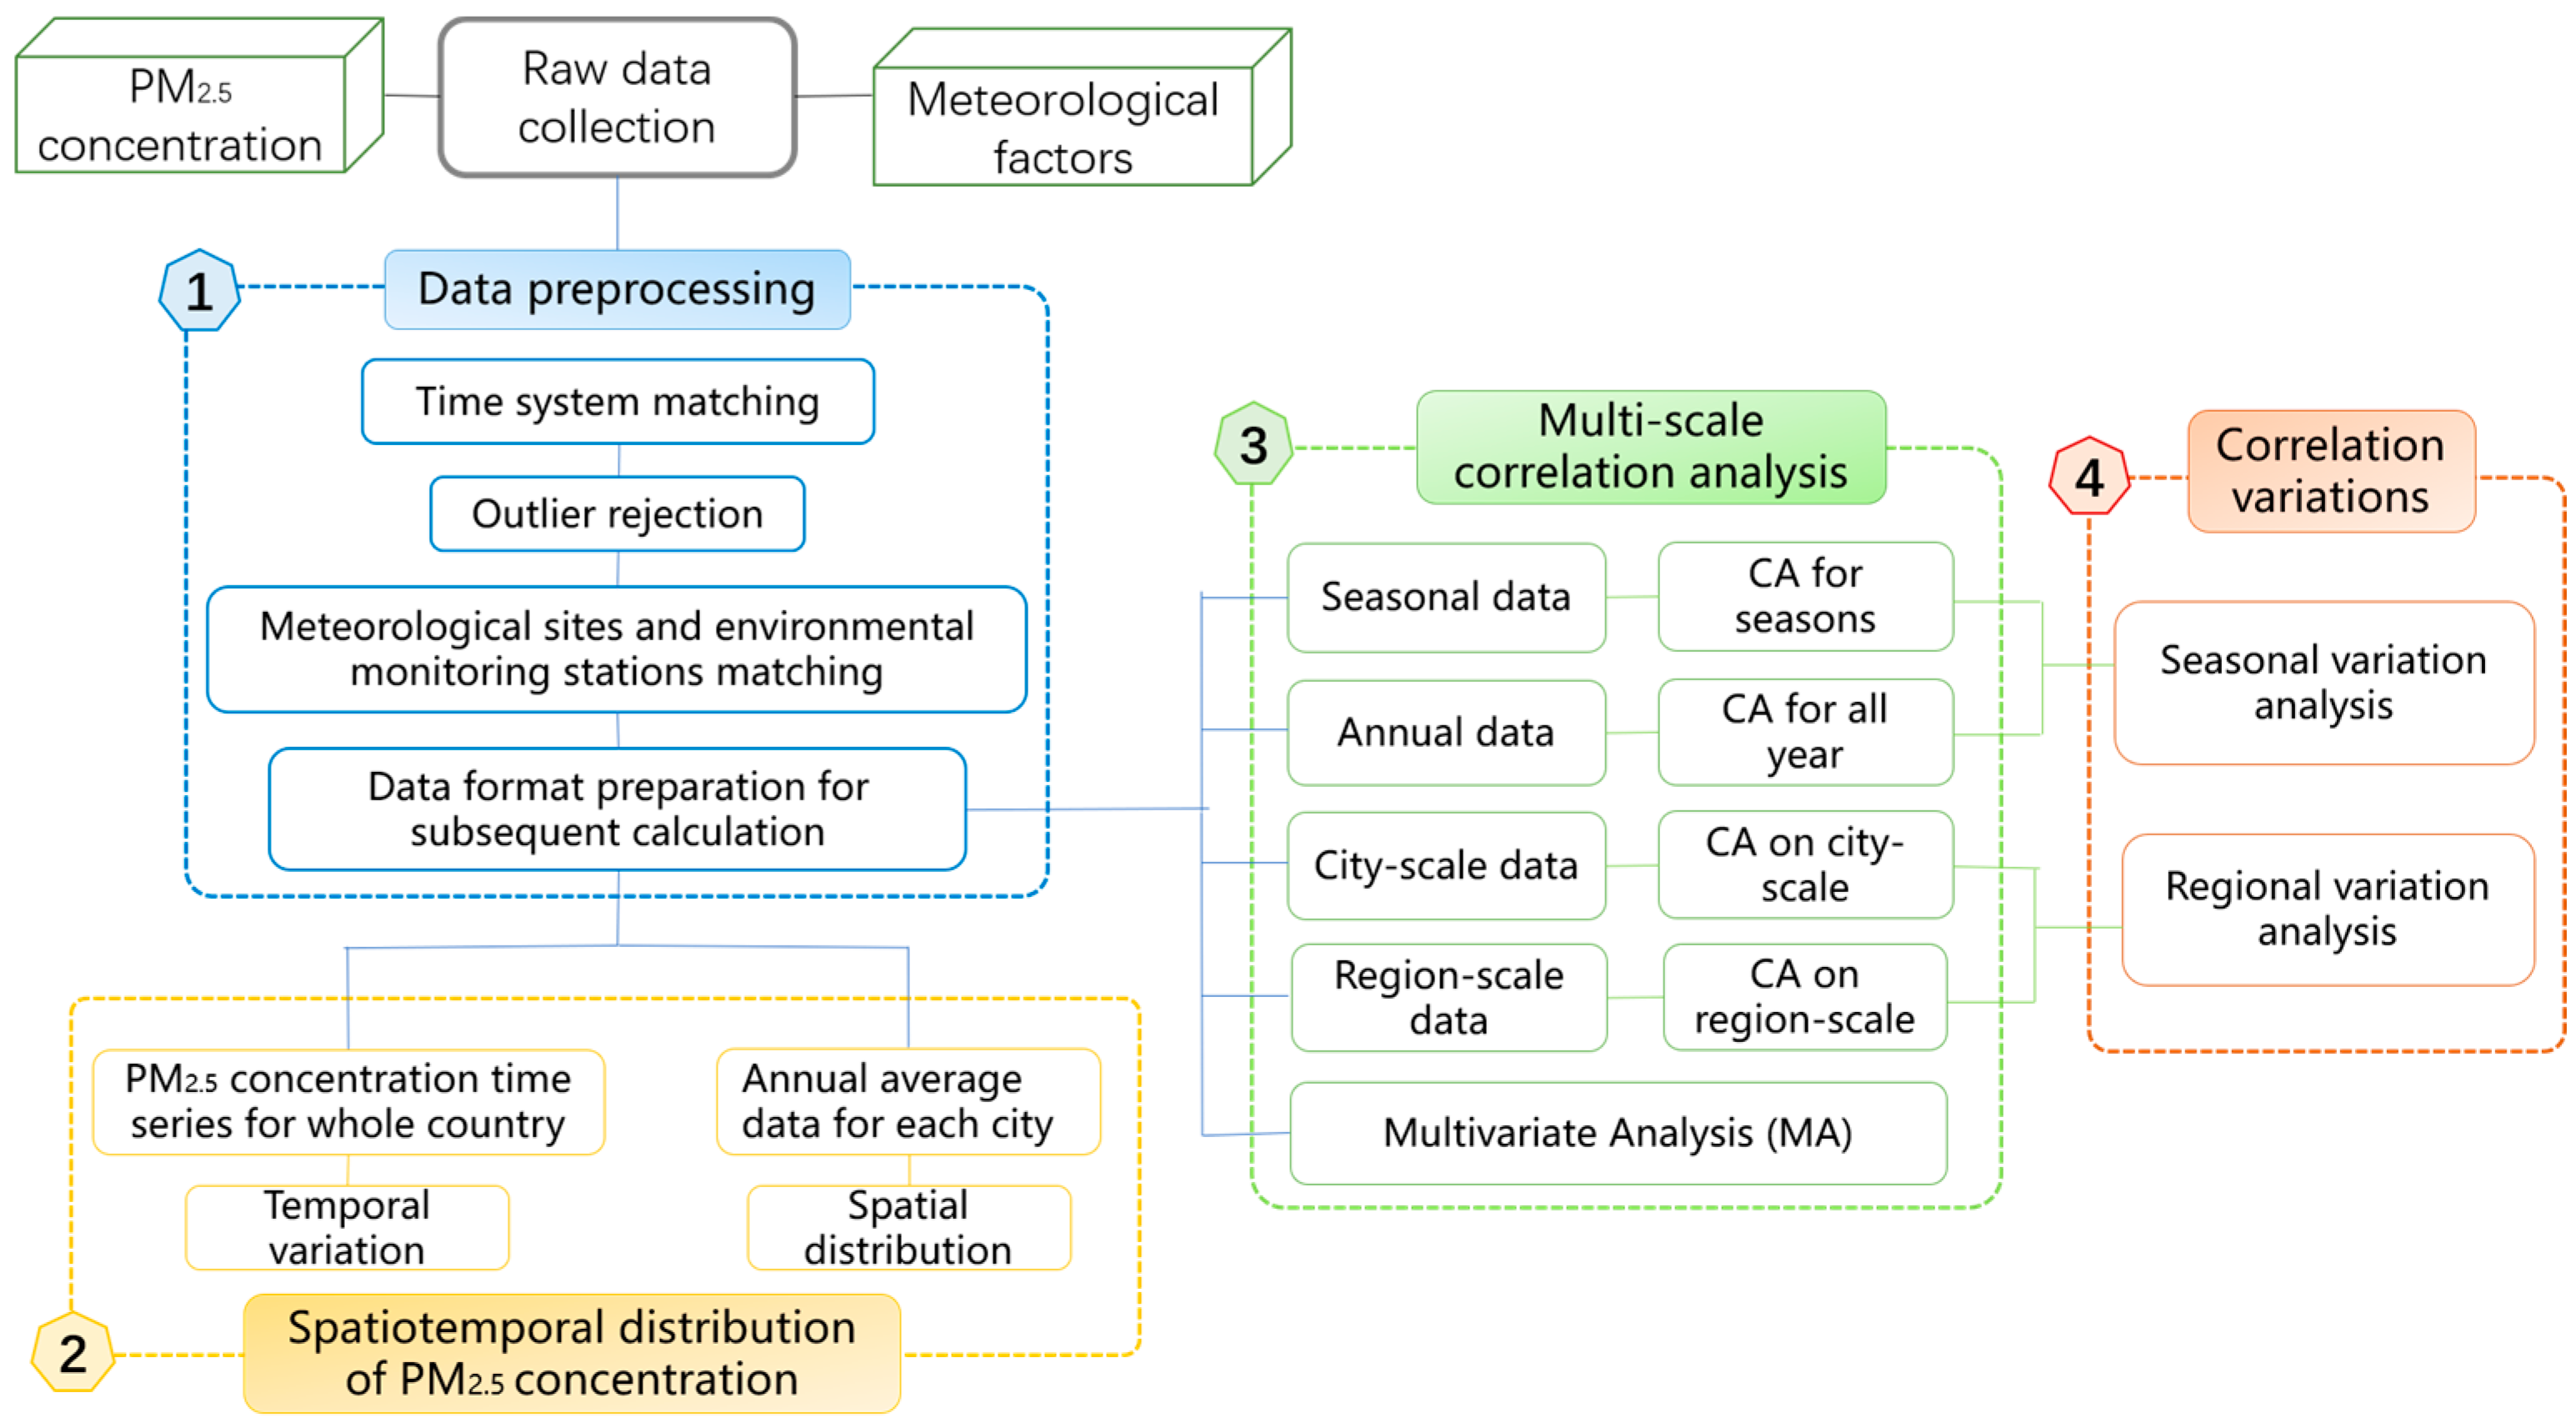
2.3. Data Preprocessing

As shown in Figure 2, PM2.5 concentration and meteorological parameters are not measured at the same sites, so we needed to match the two types of data to form data pairs for the correlation calculation task. As the correlation analysis was conducted at the basic unit of city, we first screened the PM2.5 monitoring sites for each city through setting longitude and latitude thresholds. We then set buffers centered on the PM2.5 monitoring stations, and the buffer radius was determined to be 0.3° after a parameter sensitivity test. The parameter sensitivity results are shown in Table S1. Meteorological sites located within the buffers were recorded. When the screening for one city was completed, we averaged the PM2.5 concentration data and meteorological data of all the monitoring sites in this city area as the city-level data. There were a few outliers in the raw data which may have introduced errors, so a validity check on the daily data was conducted to remove the problematic data. We set a normal value threshold for each parameter, including PM2.5 concentration, relative humidity, temperature, wind speed, and surface pressure, and the data falling outside of the thresholds were assigned as null. We then processed the data for correlation calculation at season, year, city, and regional scales.
According to topography and climate, the division of the seven regions in China is shown in Figure S1 and Table S2. Considering the climate characteristics of China, the four seasons are: spring (March, April, and May), summer (June, July, and August), autumn (September, October, and November), and winter (December, January, and February).

2.4. Methodology

The process of our study design can be divided into four parts. The first step was the data preprocessing, as mentioned before. We then conducted a simple analysis of the spatiotemporal distribution pattern of PM2.5 concentration. ArcGIS and the empirical Bayesian kriging (EBK) interpolation method [34] were used to acquire the spatial distribution map. Thirdly, we conducted the correlation analysis at multiple scales, i.e., city, region, season, and year. The correlations between daily PM2.5 concentration and daily meteorological factors were measured by the Spearman’s rank correlation coefficient. We first divided China into seven geographic regions and conducted the correlation analyses in both the 68 cities and seven geographic regions, to explore the spatial variations of the correlation at different spatial scales. The correlation analyses for the four seasons and whole year were then implemented. Then a multivariate analysis was conducted in addition. Finally, we analyzed the seasonal and regional variations of the relationships between PM2.5 concentration and the meteorological factors. We drew the correlation coefficient (r) distribution maps of the 68 cities and seven regions in the four seasons and at a yearly scale, and conducted clustering to help with the variation analysis. The major and minor influencing factors for each region and each season are summarized in the following, along with the variation patterns of RH–PM2.5 correlation, TEM–PM2.5 correlation, WS–PM2.5 correlation, and PS–PM2.5 correlation. Figure 3 shows the flow chart of the study design.

3. Results

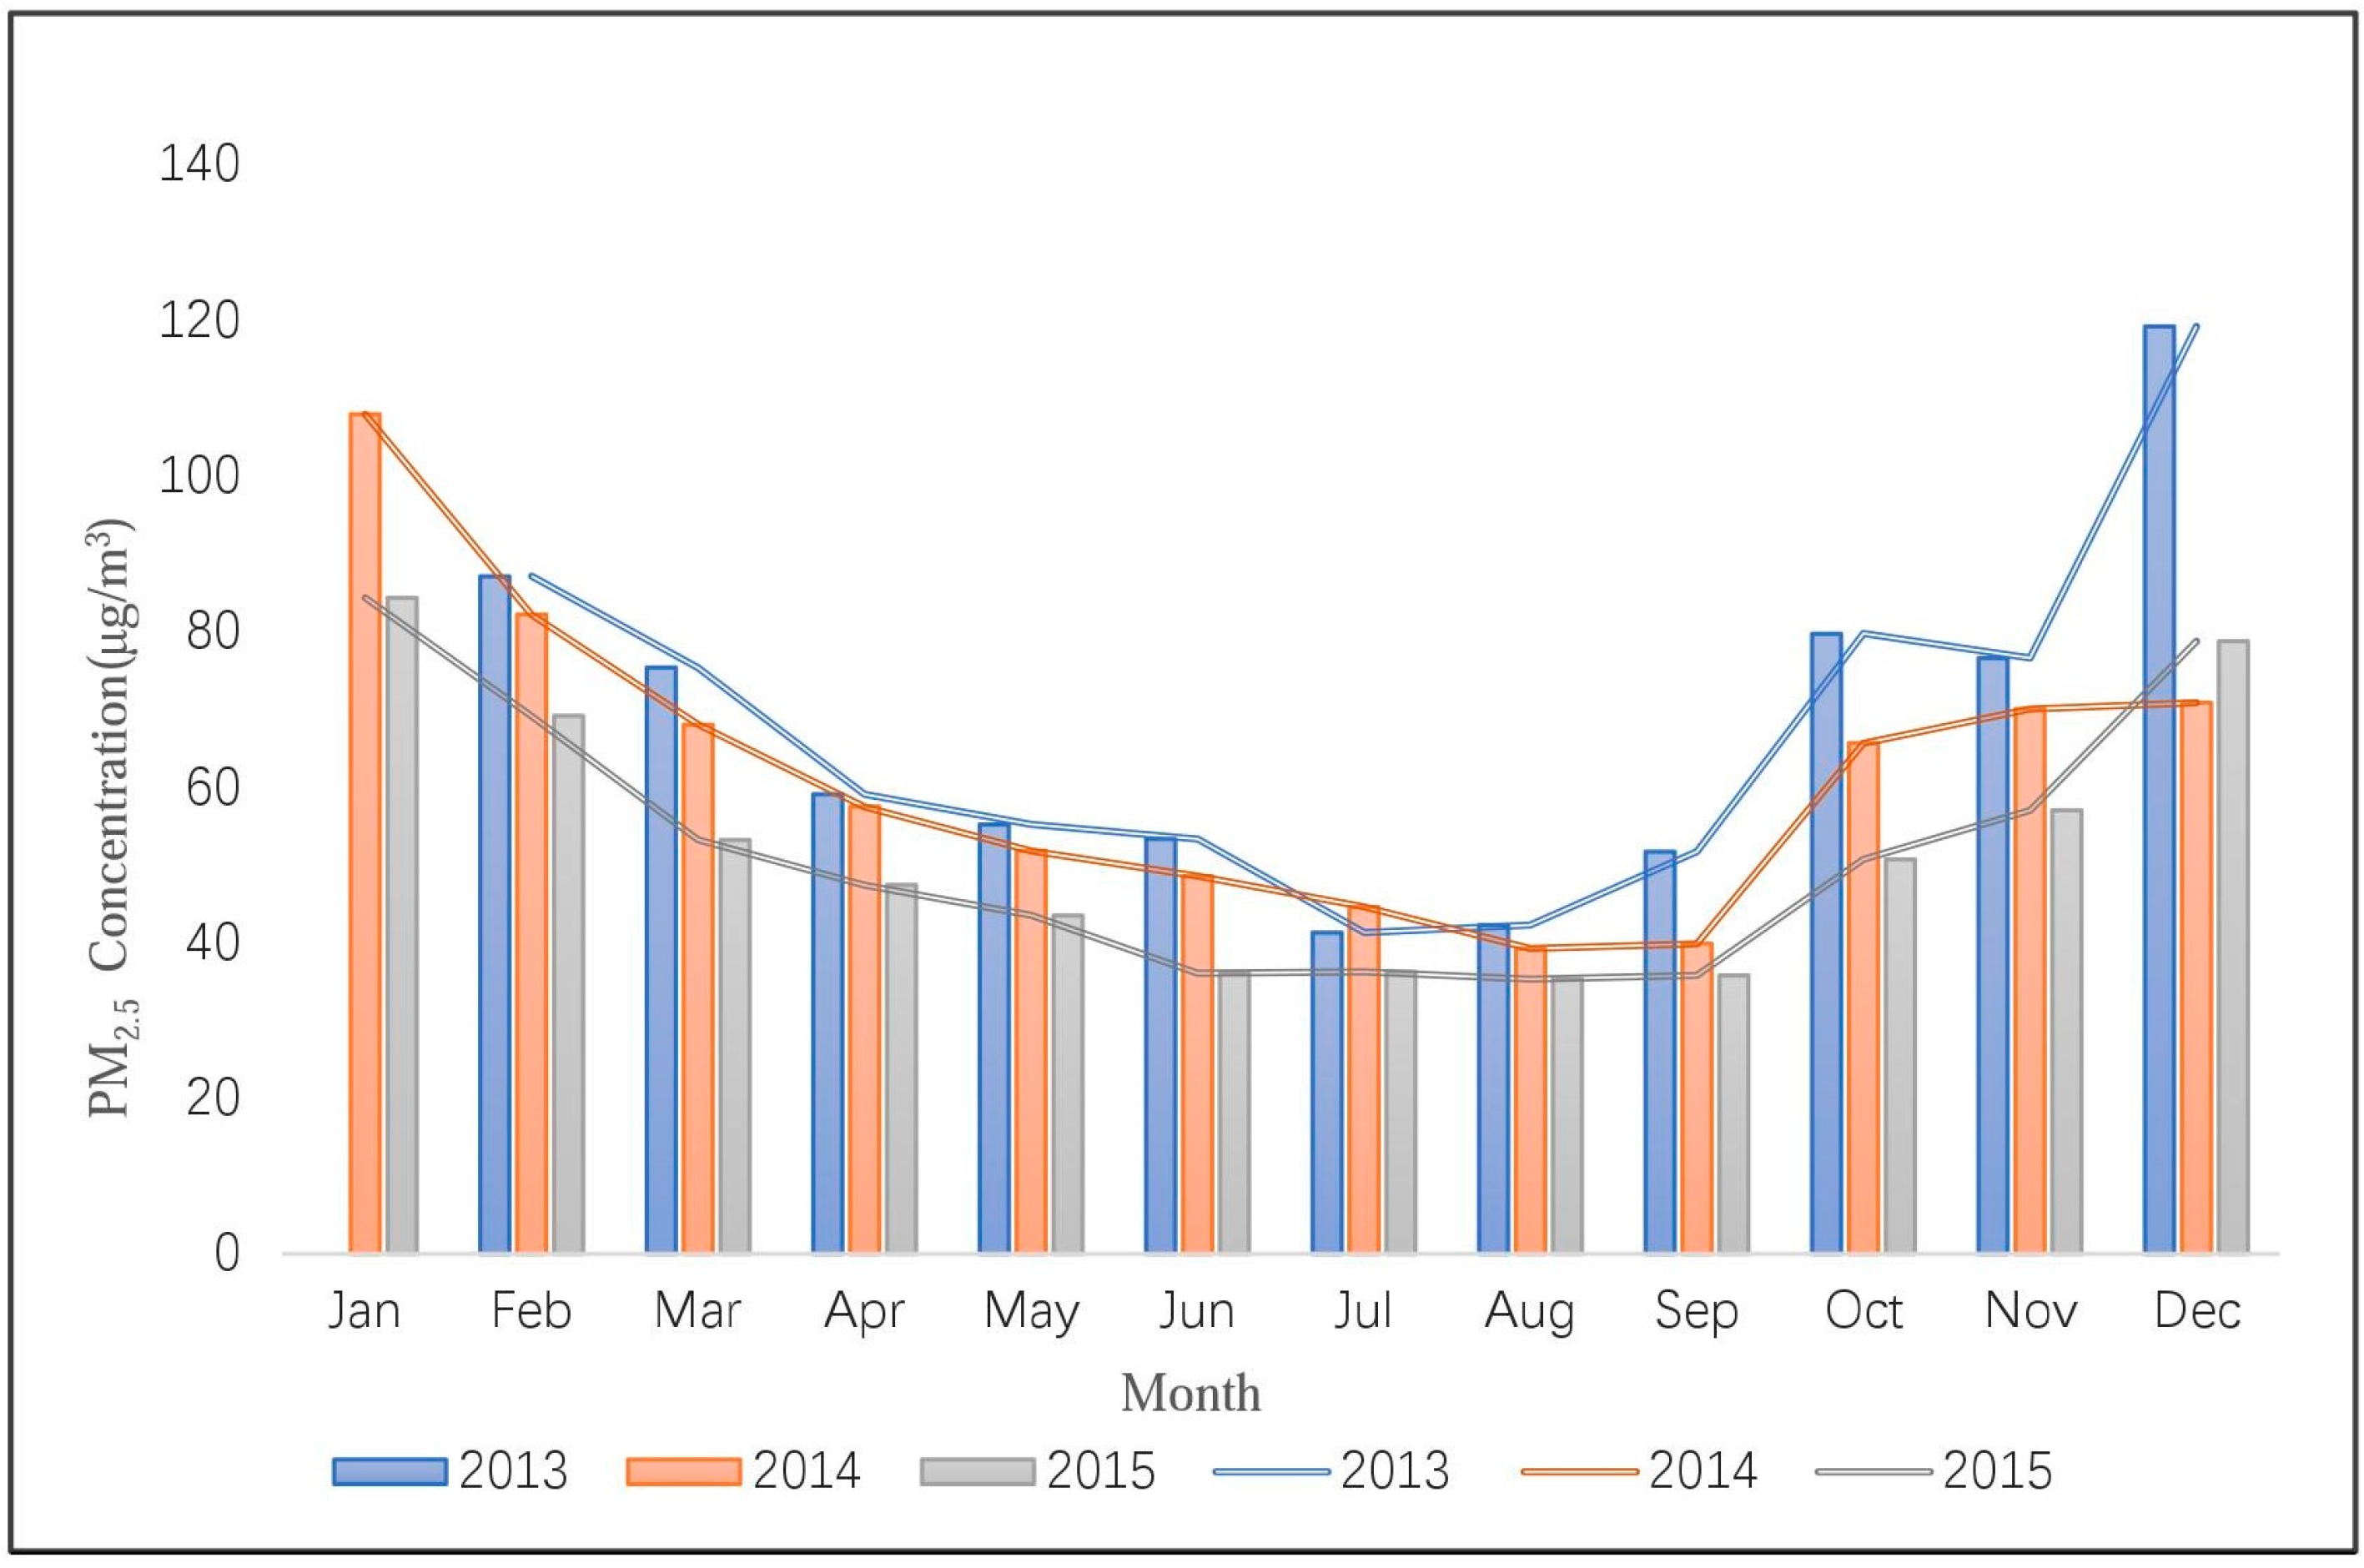
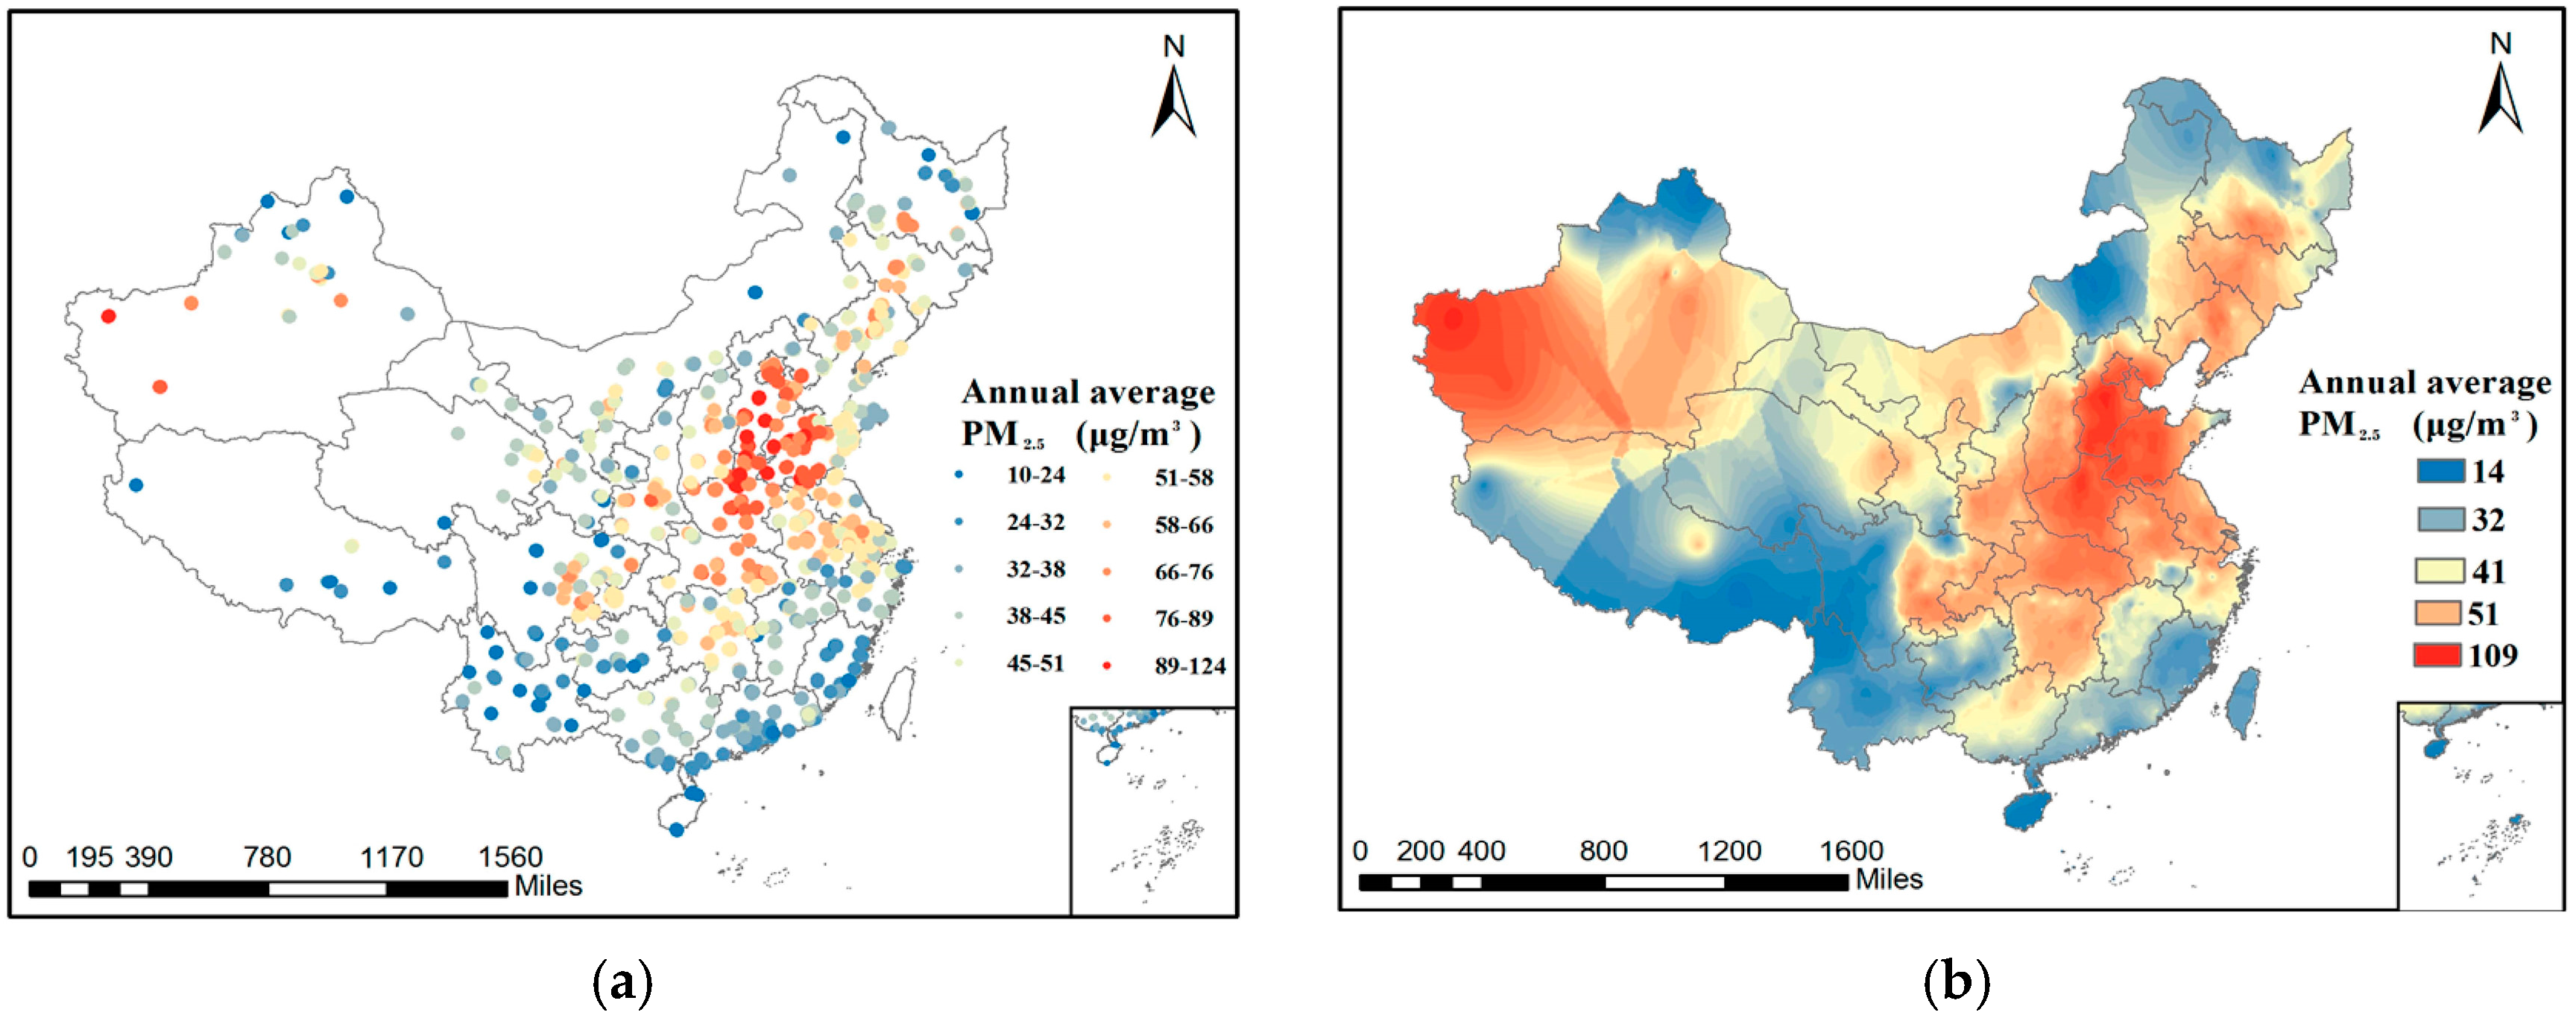
3.1. Spatiotemporal Variation of PM2.5 Concentration

Figure 4 shows the monthly variation of China’s average PM2.5 concentration from 2013 to 2015. As shown in the figure, the PM2.5 concentration in July and August is the lowest, and January and December have the highest concentrations. This means that the air pollution is much less serious in summer than in winter. This conclusion is similar to those of previous studies [35,36,37]. Another phenomenon worth noting in Figure 4 is that the position of the blue line is at the top overall, while the grey line is at the bottom, which suggests that the PM2.5 concentration of China has been decreasing from 2013 to 2015. This may indicate that the environmental protection policies and haze control measures in China have taken effect. Although the average air quality improved from 2013 to 2015, the number of cities that reached the Chinese Ambient Air Quality Standards (CAAQS) Grade II standard (35 µg/m3) is still small, corresponding to 5, 8, and 12, respectively, for 2013, 2014, and 2015.
We then analyzed the spatial distribution pattern of PM2.5 concentration in 2015. Figure 5a shows all of the sites and the corresponding PM2.5 concentration values we used to implement EBK, and Figure 5b is the final interpolation result. It can be seen that the BTH region and Urumqi suffer from serious PM2.5 pollution, but the air quality in Tibet, Yunnan Province, Hainan Island, and the PRD area is better. The interpolation result is consistent with the results of previous studies [38,39,40].

3.2. Regional Variation of the Correlation Relationship

3.2.1. Correlation Analysis at the City Scale

We calculated the Spearman’s rank correlation coefficients between PM2.5 concentration and RH, TEM, WS, and PS in the 68 cities. The result is provided in Table S3. The correlation coefficients and p-values in the cities of south China and north China are listed in Table 1. In the table, r-RH, r-TEM, r-WS, and r-PS stand for the correlation coefficients between PM2.5 concentration and RH, TEM, WS, and PS, respectively, and the corresponding P-RH, P-TEM, P-WS, and P-PS stand for the p-values in the hypothesis testing of the correlation between PM2.5 concentration and RH, TEM, WS, and PS. Most of the p-values in Table S3 and Table 1 are less than 0.05, which indicates that PM2.5 concentration is significantly correlated with meteorological factors, at a 95% confidence level. However, it is worth noting that the p-values in the last column are larger than the other columns, which indicates that the correlation between PM2.5 concentration and pressure is not very significant in some cities.
In Table 1 and Table S3, the regional variation can be clearly seen. For instance, PM2.5 is positively correlated with RH in Beijing, with the correlation coefficient (r) value reaching 0.48, but, in Shenzhen and Huizhou, PM2.5 is negatively correlated with RH, and the correlation coefficients are −0.50 and −0.59, respectively. Furthermore, the correlation coefficients between PM2.5 and PS are large in central China, but relatively small in northwest China. This result shows that spatial variations do exist in the relationships between PM2.5 and meteorological factors.
To describe the regional variation in a more intuitive way, we display the correlation coefficients of each city on the map in Figure 6, and represent the correlation coefficient (r) values with colored points. Green represents a negative correlation and red represents a positive correlation, with a deeper color indicating a more closely correlated relationship. The points with bigger size mean the correlation is significant at a 95% confidence level. On the contrary, points with smaller size represent an insignificant correlation.
Figure 6a shows the correlation coefficients between PM2.5 concentration and relative humidity in the 68 cities. The relationship is a positive correlation in north China and Urumqi, but is a negative correlation in other areas, especially south China. We infer that this variation may result from the type difference of the aerosol in north China and south China. Aerosol types have been defined in Barnaba’s article [38], in which aerosols are classified into three types according to their different optical and psychical properties. Besides, the fact that south China is usually wetter than north China may also contribute to the correlation difference.
Temperature has a strong negative correlation with PM2.5 concentration in nearly all the cities of China, as shown in Figure 6b and it can also reflect the seasonal variation in PM2.5 concentration. PM2.5 concentration is the lowest in summer and is the highest in winter, and temperature shows the opposite trend. The reason for the negative correlation may be that high temperature promotes the convection of air, and thus brings about the dilution and dispersion of air pollutants [1]. The low temperature can lead to increased emission rates from domestic heating and power production [31]. In addition, our results indicate that the correlation between PM2.5 concentration and TEM is weaker in north China than other areas.
In Figure 6c, wind speed is negatively correlated with PM2.5 concentration in most areas, which indicates that horizonal dispersion plays a significant role in China. Hainan Province is an exception, with a positive PM2.5–WS correlation, which is because the ambient air in Hainan Island is very clean [41,42,43] and the wind from the surrounding areas can bring pollutants to the island, thus increasing the PM2.5 concentration.
A positive correlation is found between PM2.5 concentration and surface pressure in northeast China, central China, and Hainan Province, as shown in Figure 6d. This is because high pressure is always accompanied with low atmospheric boundary layer height, and thus the vertical dispersion of air pollutants is hindered [44,45]. The correlation in other areas is relatively weak. The reason for this regional difference is still unclear and needs further research.
To understand the spatial variations more clearly, we also conducted a cluster analysis for the 68 cities. The ISODATA algorithm was used to implement the clustering. The clustering results are shown in Figure 7, where the 68 cities are clustered into four groups. The PRD region is clustered as the first group, although with individual exceptions. In this area, PM2.5 concentration is negatively correlated with RH and TEM, but weakly correlated with WS and PS. This cluster type is displayed by the orange points in Figure 7. The YRD region and some cities in west China are clustered as the second type, symbolized by the green points, where PM2.5 has a negative relationship with TEM and WS and a weak correlation with the other meteorological factors. The blue points represent the third type and mainly include cities in northeast China and central China, where PM2.5 concentration is negatively correlated with TEM and positively correlated with PS. Lastly, north China and Urumqi are grouped as the fourth type, as shown by the red points, where PM2.5 concentration in the cities of these regions is positively correlated with RH, negatively correlated with TEM and WS, and weakly correlated with PS.
The clustering result shows that there are both geographic dependencies and geographic differences in the relationships between PM2.5 concentration and meteorological factors.

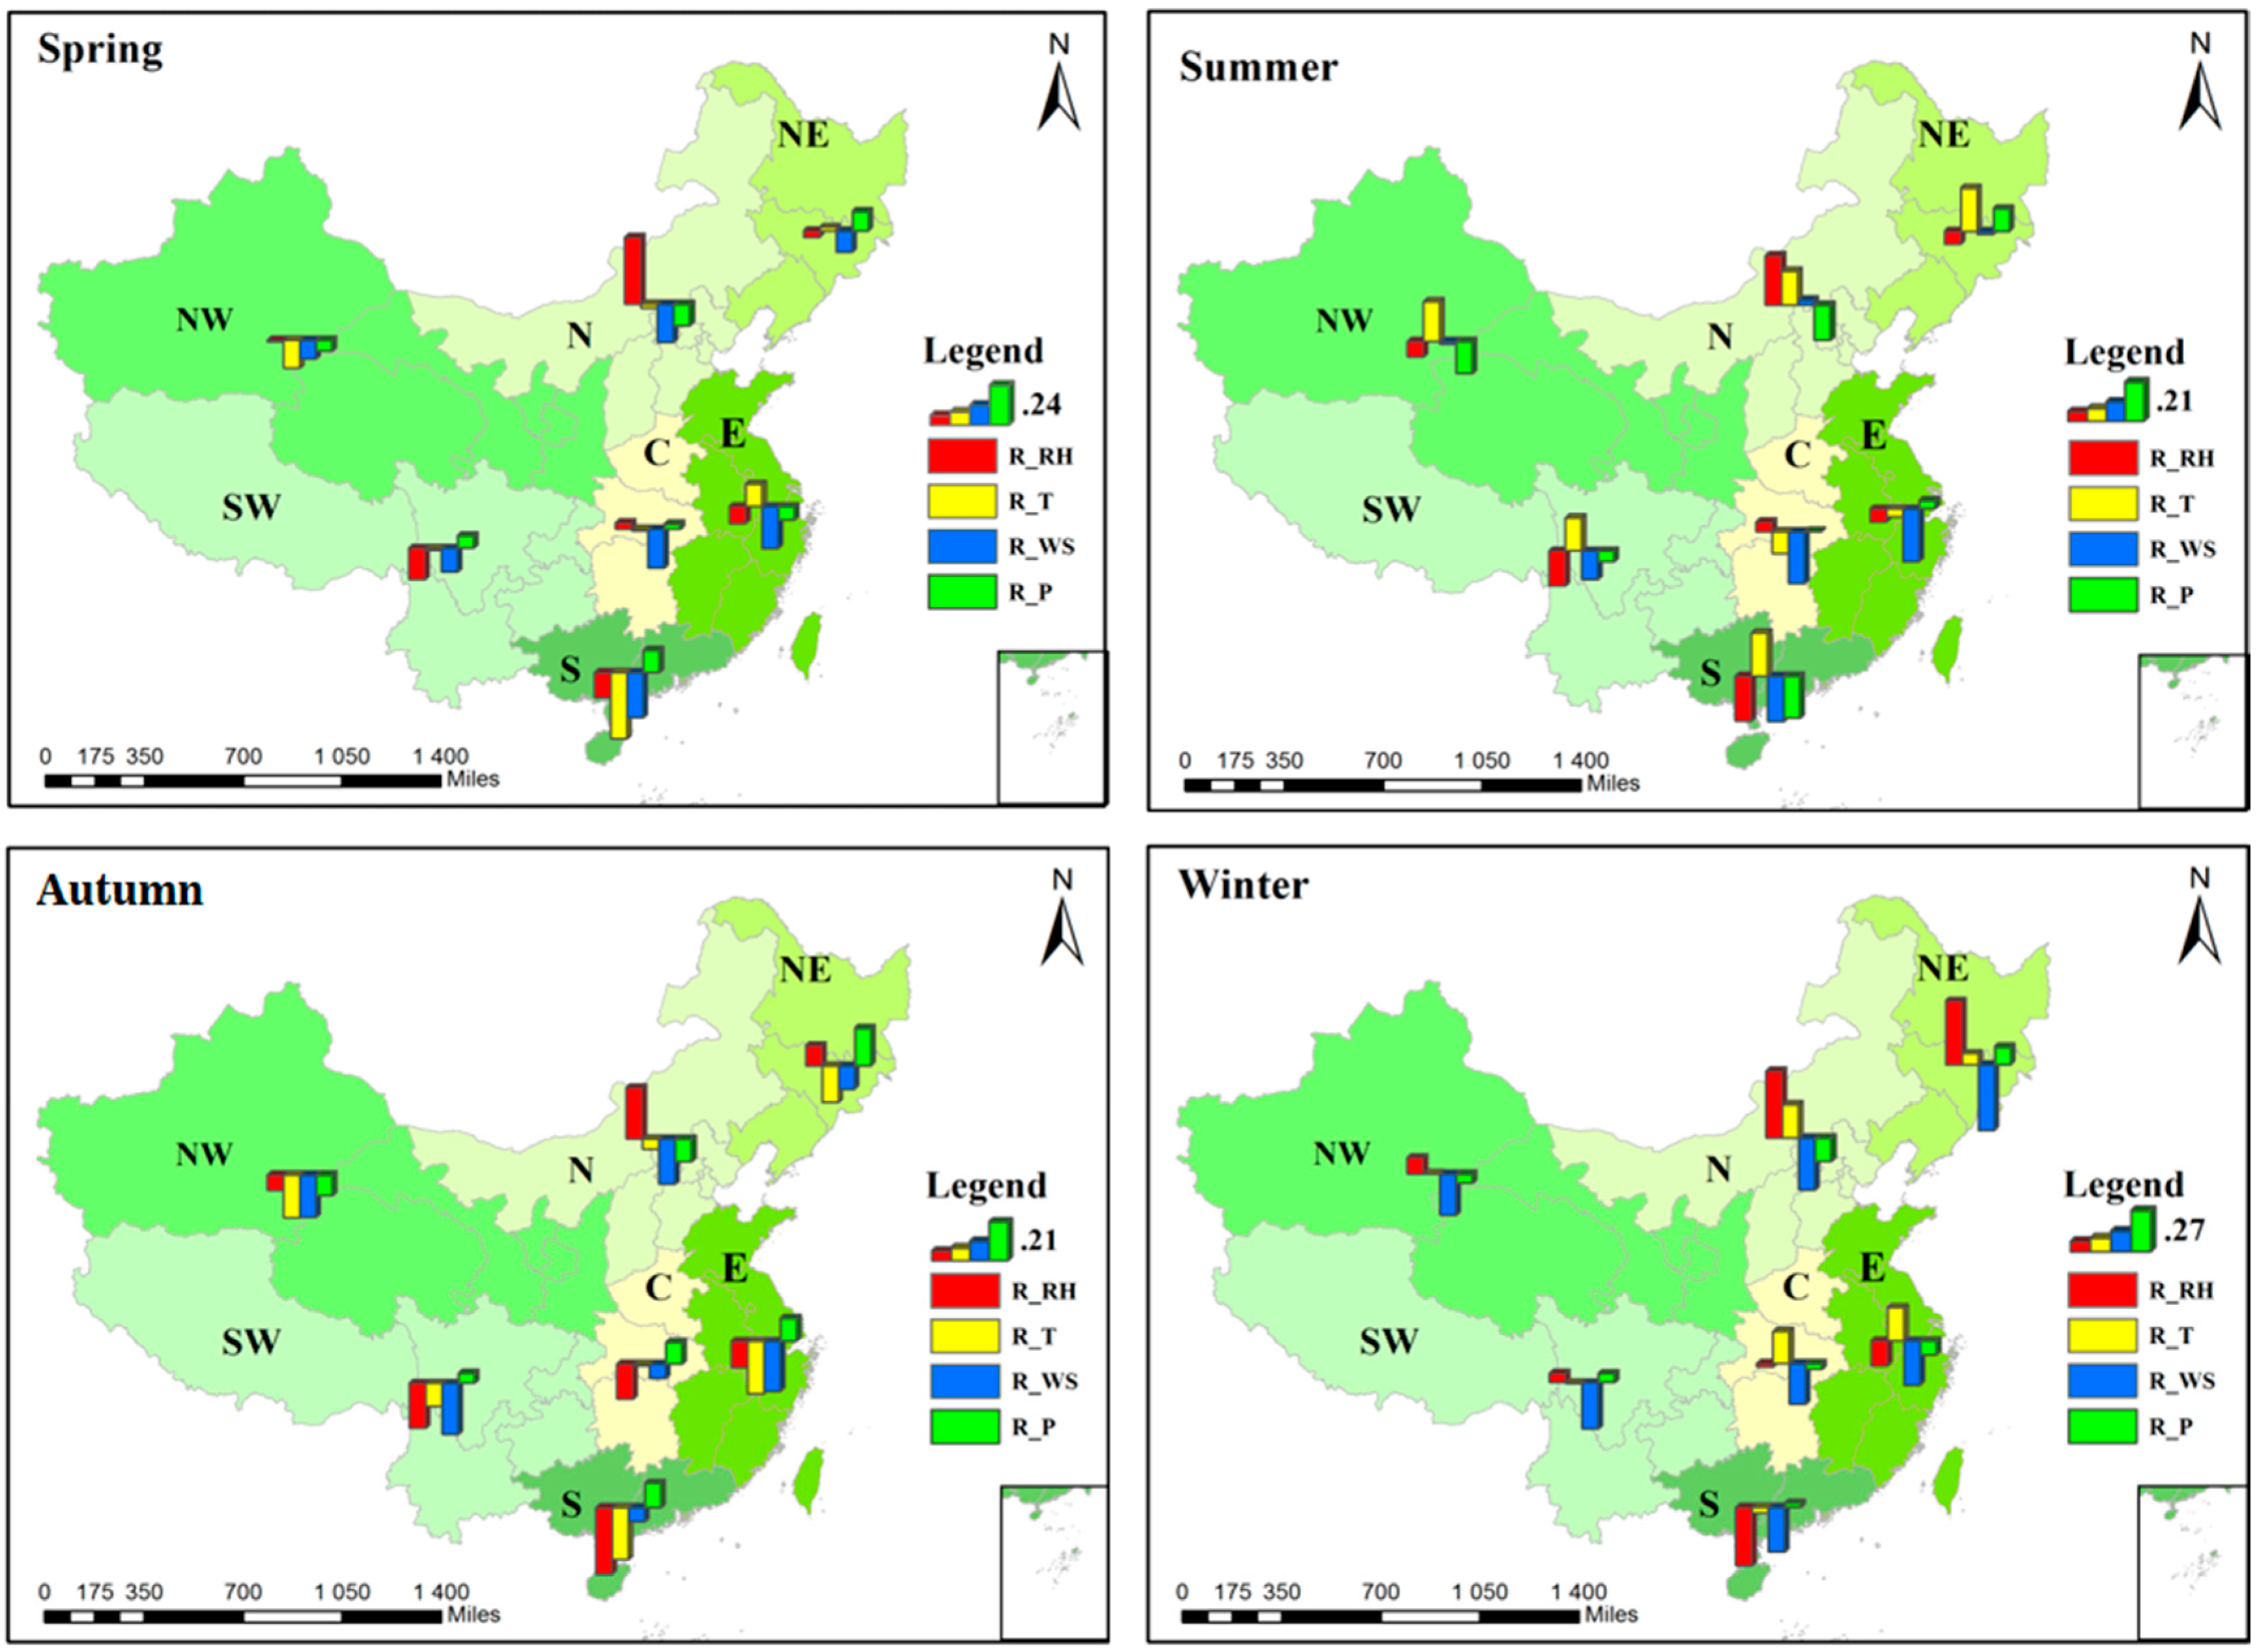
3.2.2. Correlation Analysis at the Regional Scale

To obtain an exact evaluation of the regional difference of the correlations between PM2.5 concentration and meteorological factors, we conducted a correlation analysis at a regional scale. As has been mentioned before, we divided Mainland China into seven regions. Figure 8 displays the regional correlation analysis results. In the figure, there is a histogram for each area, and the different colors of the bars represent the correlation coefficient (r) values of the different meteorological factors. An upward bar means a positive correlation and downward means negative. North China is the only area where PM2.5 concentration is positively correlated with RH but, overall, PM2.5 is only weakly correlated with meteorological factors in north China compared with the other areas. The most important influencing factors for PM2.5 in south China are temperature and relative humidity. Surface pressure plays an important role in central China and north China, in addition to temperature. As for east China, southwest China, and northwest China, temperature is the only factor that has correlation coefficients larger than 0.3 with PM2.5 concentration.
We summarize the major (|r| > 0.3) and minor (0.3 > |r| > 0.2) influencing factors of the seven regions in Table 2. The seven regions are classified into four types according to their major and minor influencing factors, and the type numbers are marked behind the region names in the parentheses. We can see that this classification result is similar to the ISODATA clustering result in Figure 7. As we can see, TEM is a major influencing factor for almost every region, but PS and RH mainly affect the PM2.5 concentration in certain regions only.

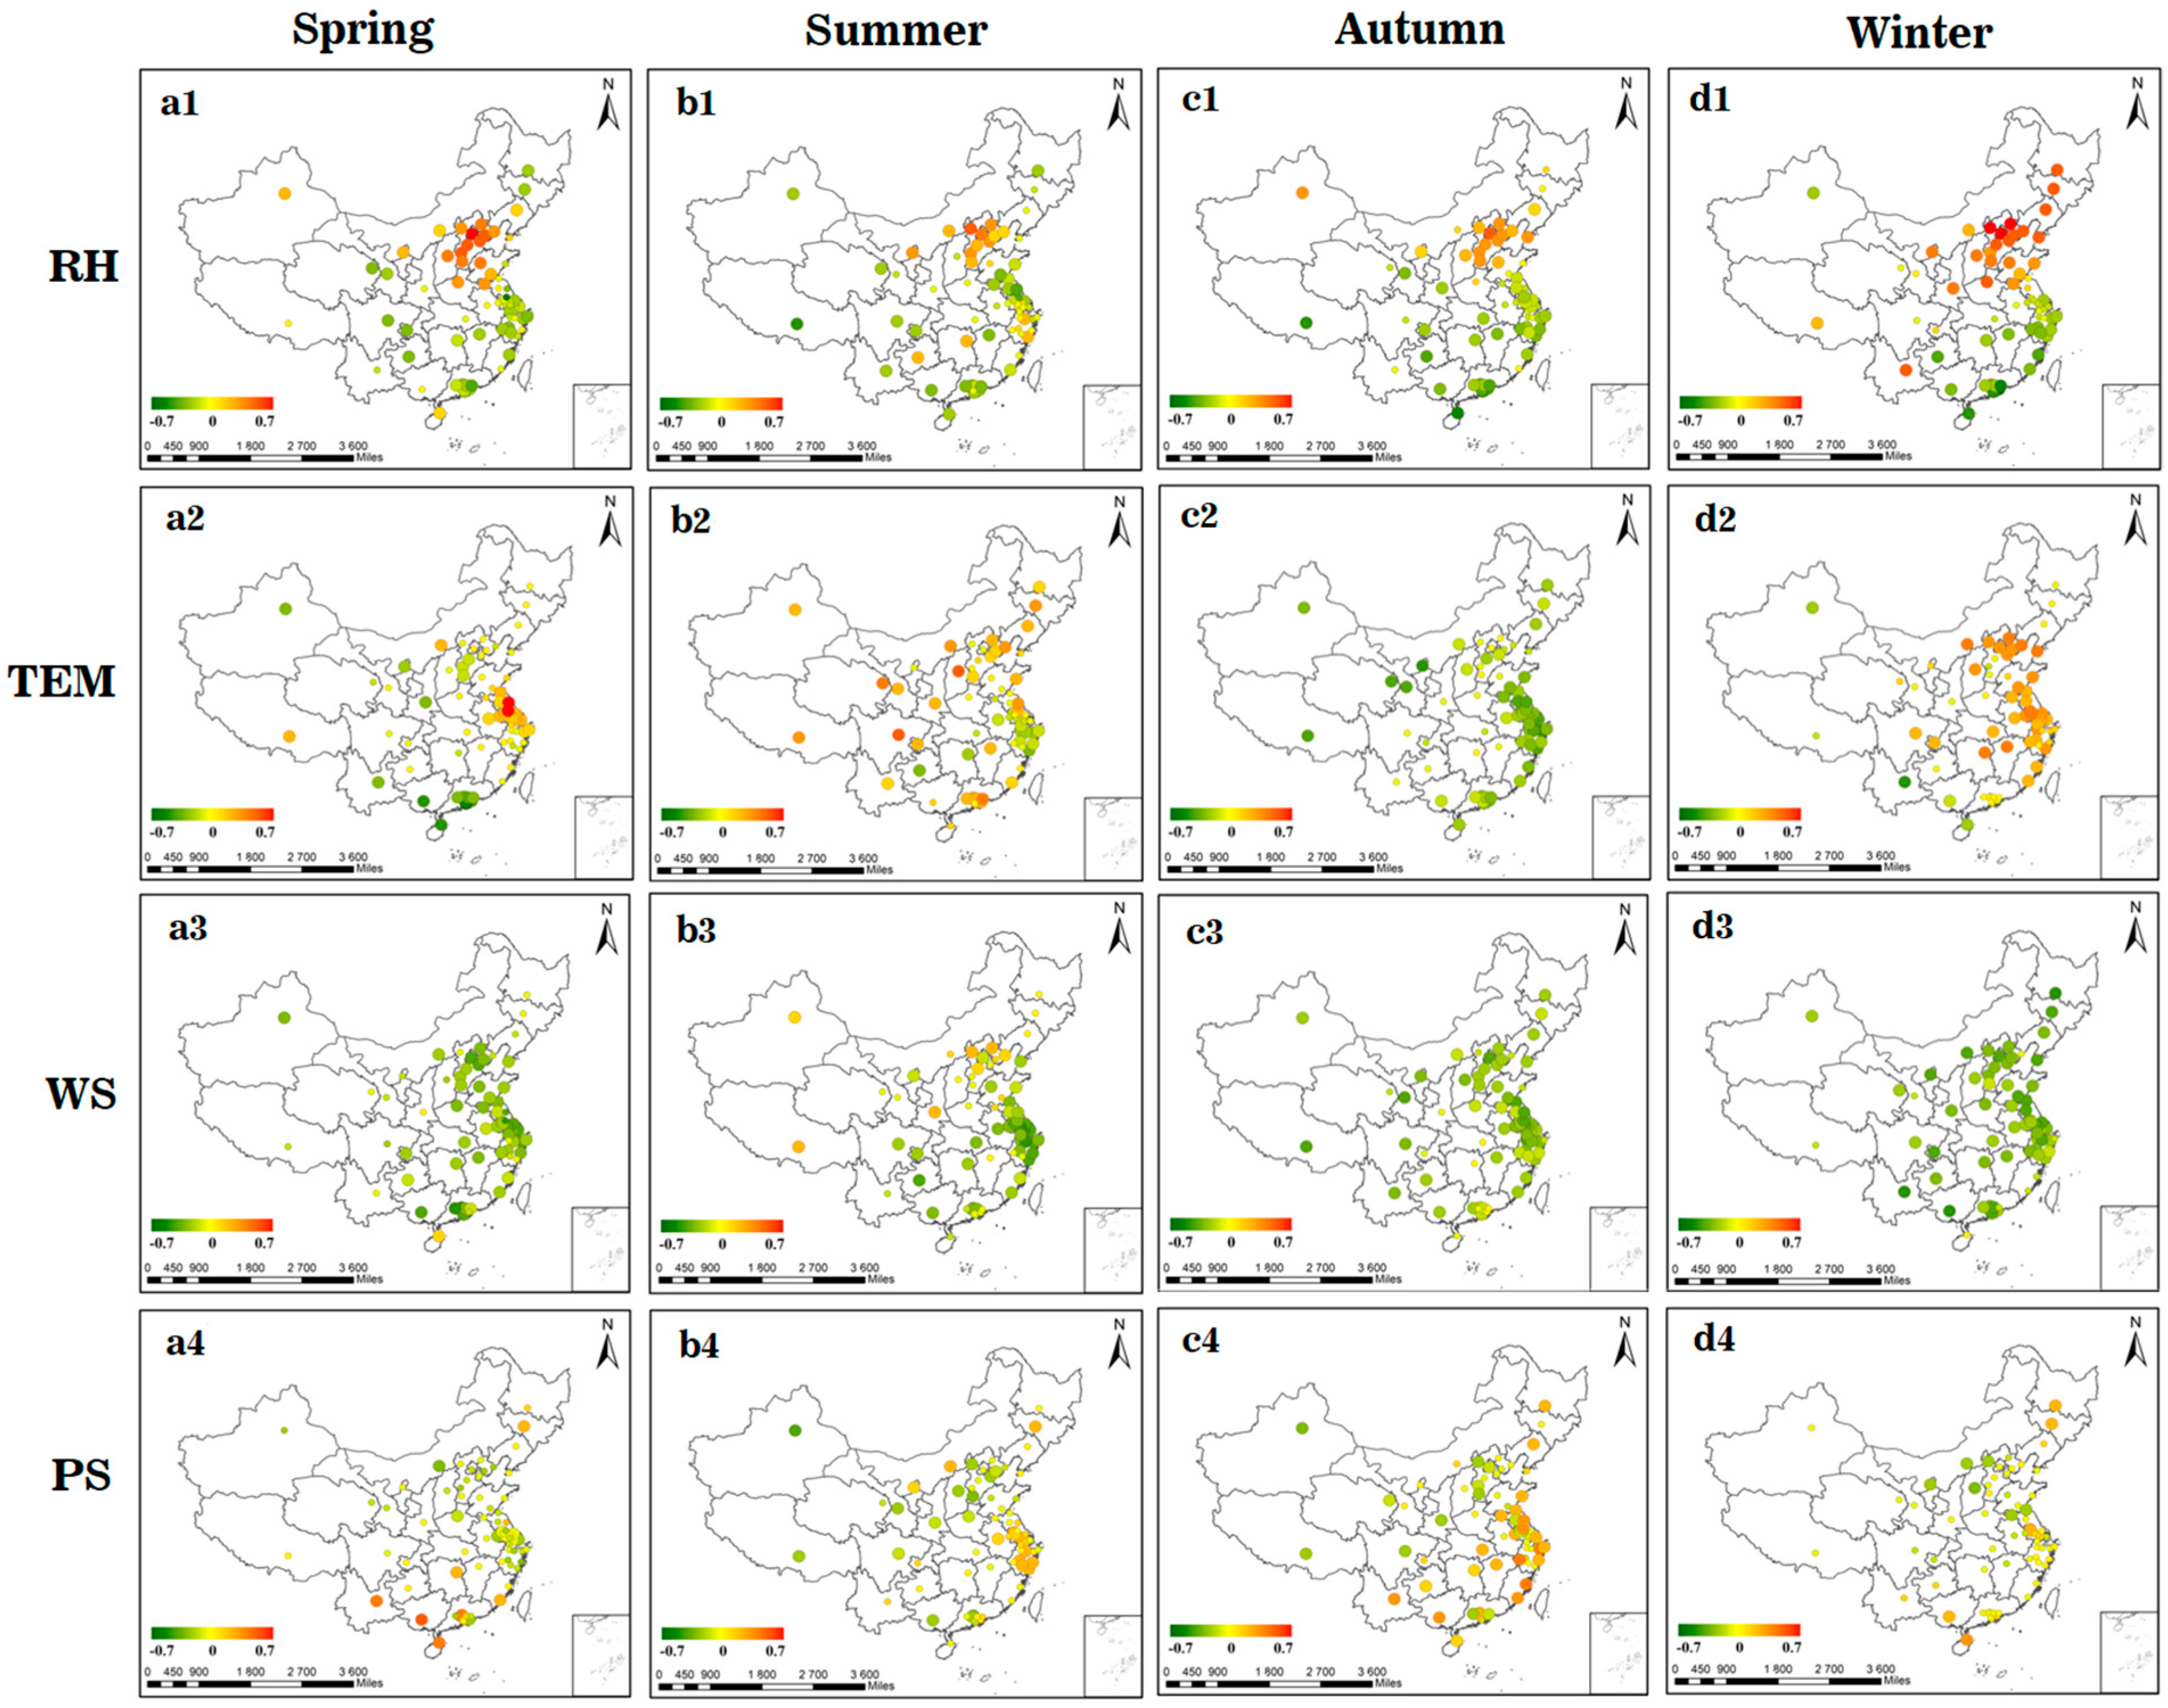
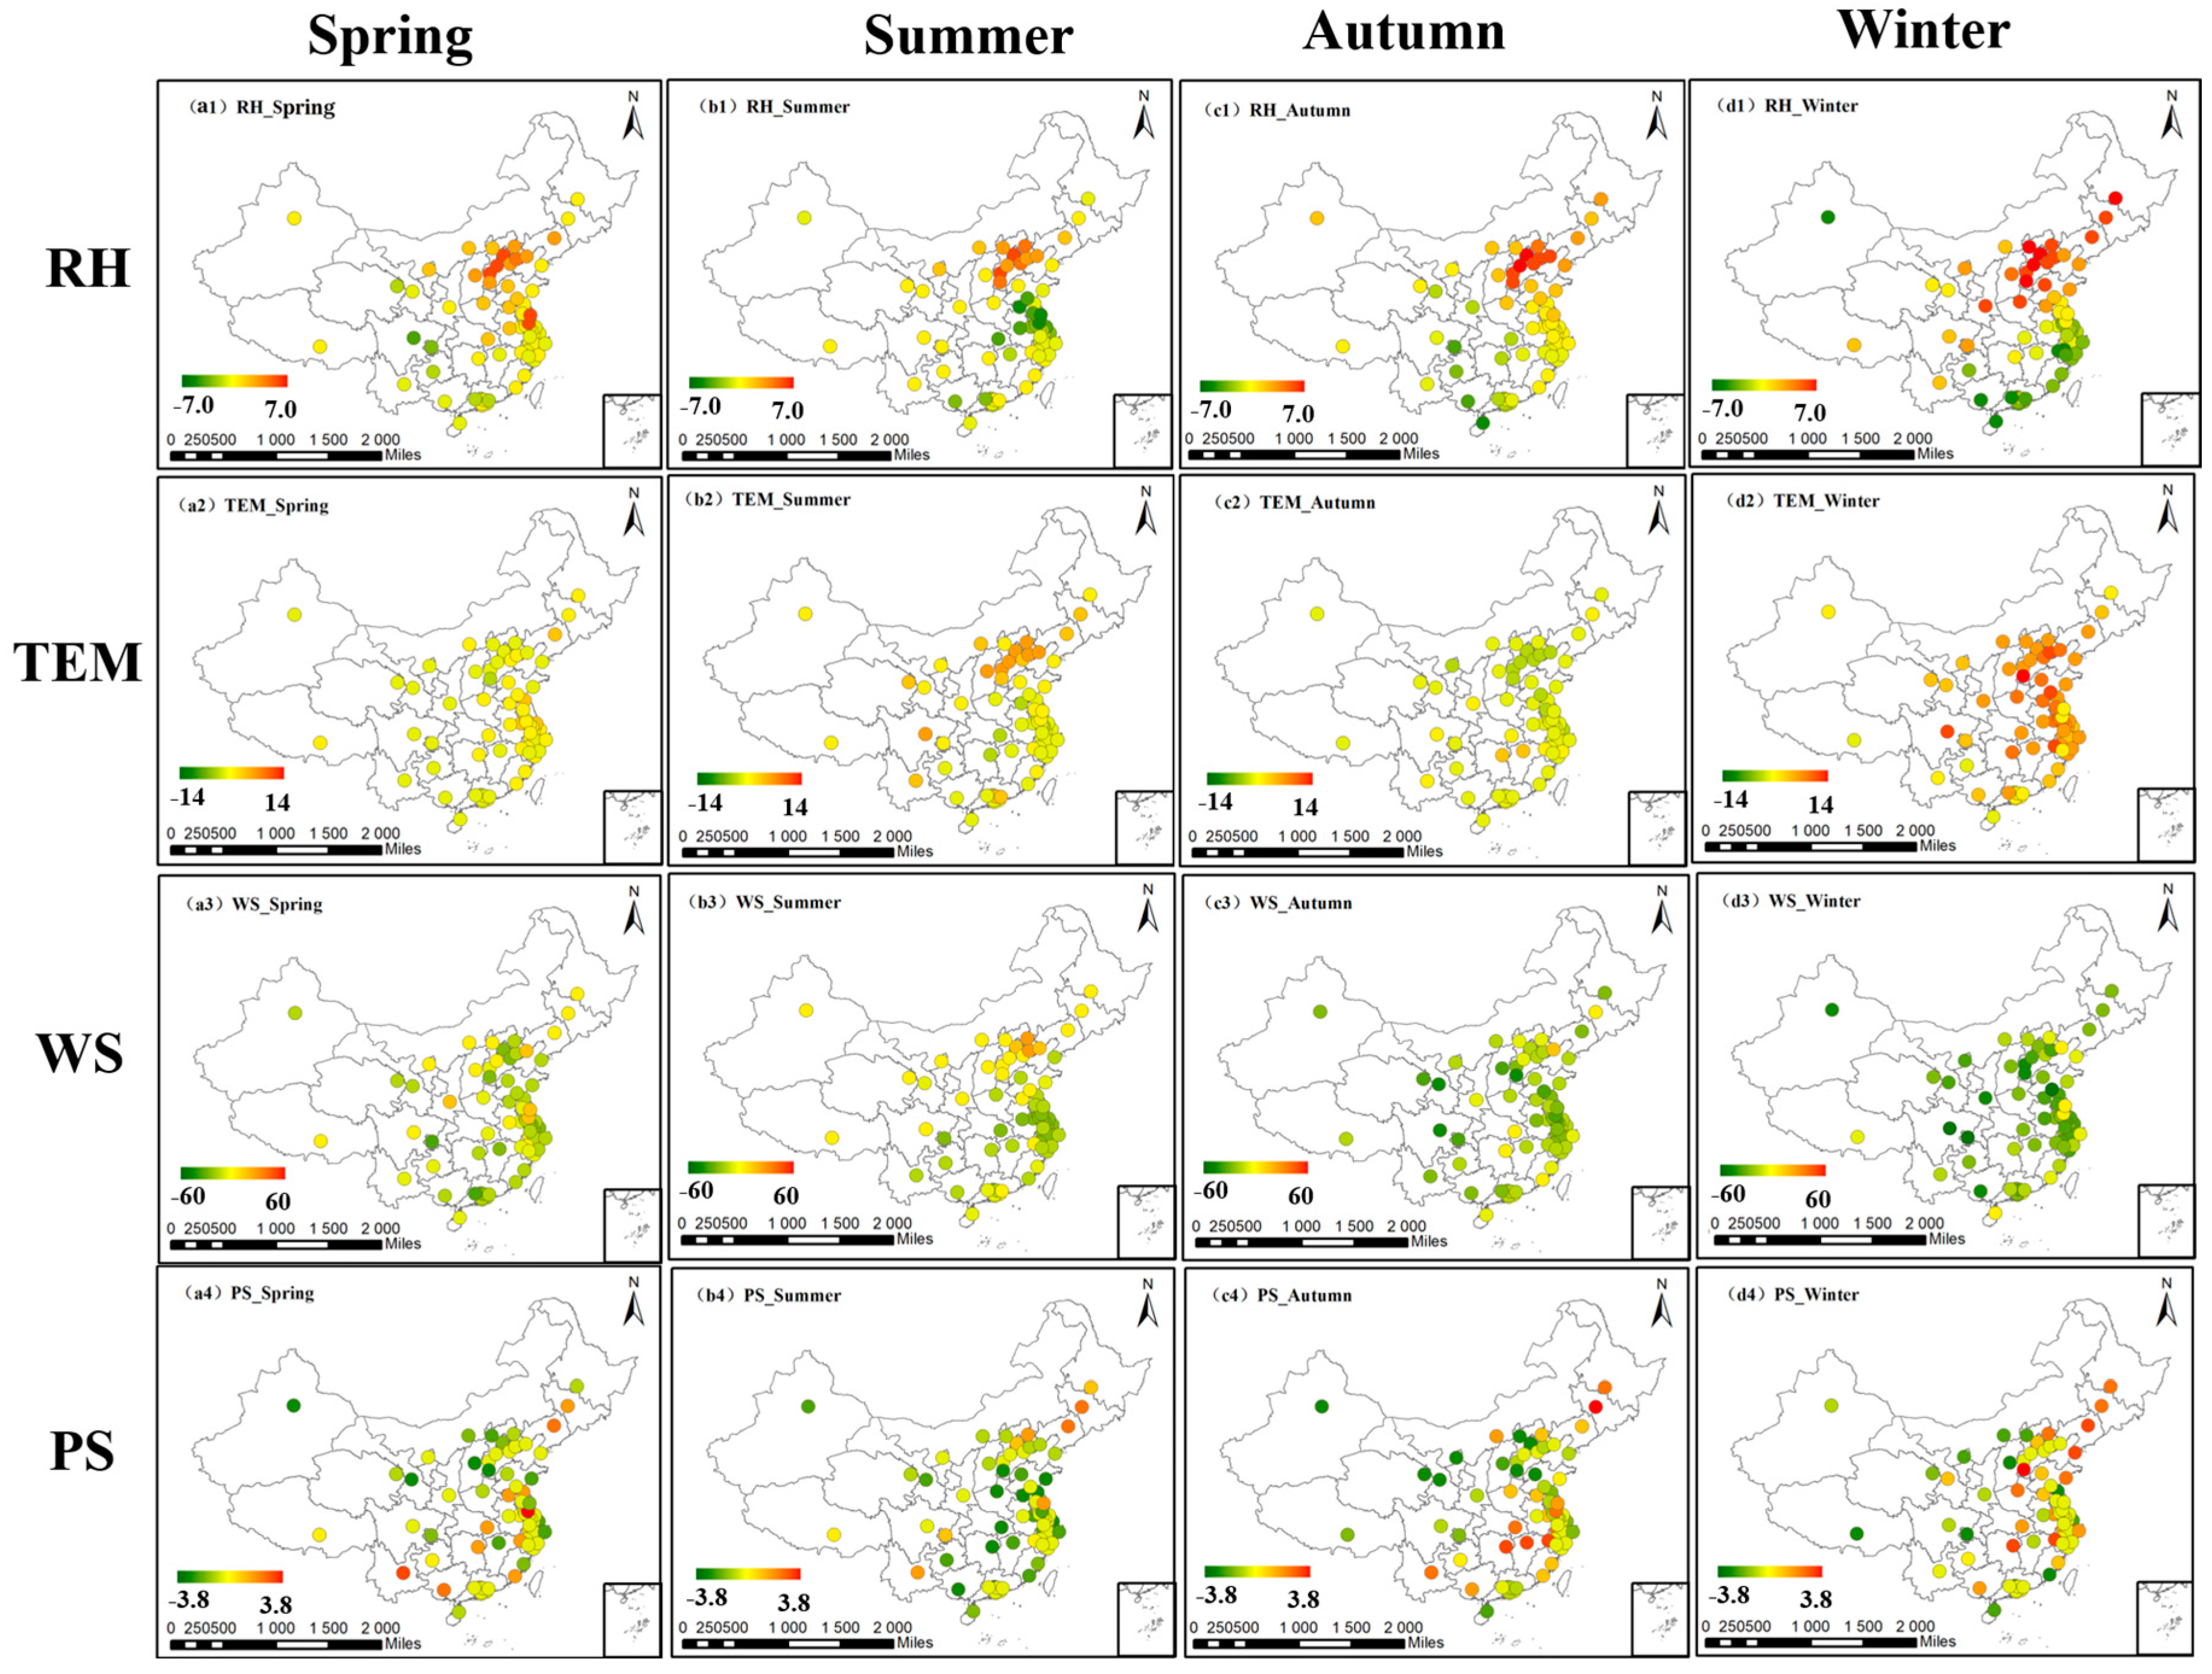
3.3. Seasonal Variation of the Correlation Relationships

The relationships between PM2.5 concentration and meteorological factors not only vary with the geographic locations, but also with the seasons. Thus, we separated our data into four parts according to the season and conducted a correlation analysis in each of the four seasons. The symbols in Figure 9 have the same meaning as in Figure 6.
Figure 9 shows the seasonal variations of the correlation coefficient (r) values of PM2.5 and four meteorological factors. As shown in first row of the figure, the relationship between PM2.5 and RH varies only slightly with the seasons, and the positive correlation in spring and winter is only slightly stronger than in summer and autumn. The number of cities with a positive correlation is also larger in spring and winter. We infer that this is the result of the increase of coal consumption in the cold season. Increased coal combustion can result in increased emission of SO2 and other air pollutants, which can promote the formation of sulfate, to a certain extent [46,47]. As mentioned before, the sulfate in PM2.5 is one of the most important components that results in the positive relationship between PM2.5 and RH. Therefore, the increase in the sulfate content makes the positive correlation stronger.
In the second row of Figure 9, the correlation between PM2.5 and TEM varies greatly with the seasons. Overall, PM2.5 is positively correlated with TEM in winter and negatively correlated in autumn. In spring, the PM2.5 concentration is negatively correlated with TEM in south China and Urumqi and is weakly correlated with TEM in the other cities. We can also see that there are two points in bright red color in east China in Figure 10, but these results are not accurate because the sample quantity is too small. Due to missing data in these two cities, the PM2.5 concentration data and corresponding meteorological parameters used in the correlation analysis in spring are less than 10 pairs. In summer, the situation is the opposite to that in spring. Weak positive correlation is found in south China, north China, northeast China, southwest China, and northwest China, and the correlation between PM2.5 and TEM is very weak in central China and east China.
In the third row of Figure 9, the relationship between WS and PM2.5 is stable, and negative correlation is detected in each season, but the correlation turns weak in summer in some cities. We infer that this is because the atmospheric boundary layer is high in summer and the air convection in the vertical direction is strong due to the elevated temperature [30]. Particles are mainly diffused and diluted vertically, so the correlation with the transport impact factor—wind speed—is reduced. The correlation in Hainan Island also turns to negative in summer, while the correlation coefficient (r) value is always positive in the other seasons. We speculate that this is because wind from sea to land prevails in summer [48], which promotes the diffusion and dilution of pollutants. In contrast, the wind of other seasons usually takes the opposite direction and thus promoting the transport of pollutants from inland to Hainan Island.
Lastly, the result for pressure is displayed in the last row of Figure 9. The seasonal variation of the relationship between PM2.5 concentration and pressure is extreme, but the variation pattern is not obvious. Overall, the positive correlation in autumn is stronger than the other seasons, and the correlation coefficient distributions are similar in spring and winter.
In addition to the analysis at the city scale, we also conducted a regional correlation analysis in the four seasons. Figure 10 shows the regional analysis result, and the correlation coefficient (r) values are displayed in Table 3 in detail. The color of each cell represents the sign and magnitude of the correlation coefficient (r) value. PM2.5 concentration has the strongest correlation with meteorological factors in winter, and the correlation is the weakest in summer. This result is similar to the conclusion of a previous study [28]. The major influencing factors of the four seasons are WS in spring, TEM in summer, TEM and WS in autumn, and WS in winter. The strong correlation between WS and PM2.5 in winter may be due to the low atmospheric boundary layer height and the dependence on horizonal diffusion.

3.4. Multivariate Linear Regression Results

In fact, many meteorological factors are highly correlated with each other, they influence the change of PM2.5 as a whole rather than as some isolated factors. Thus, in addition to univariate correlation analysis, we conduct a multivariate linear regression to see whether the impact of meteorological factors would change in a multivariate analysis. We conduct the experiments at year scale and season scale, respectively, and then draw the maps of the regression coefficients of four meteorological factors. As shown in Figure 11, the varying pattern is nearly the same as the univariate correlation analysis results. RH has a positive influence on PM2.5 concentration in north China and inversely in south China; TEM and WS have a negative influence on PM2.5 concentrations. However, it also cannot be denied that the difference between the results of pressure is a little larger, and further research is needed in the future.
Figure 12 shows the results of seasonal multivariate linear regression. As we can see in the figure, the relationship between PM2.5 and RH varies only slightly with the seasons and the positive relationship in north China is still the highest in winter. The relationship between PM2.5 and TEM varies greatly with the seasons and overall, TEM has a positive effect on PM2.5 in winter and has a negative effect in autumn. As for wind speed, the impact is almost always negative, expect that in summer the relationship is some cities in north China turns weak positive. The relationship between PM2.5 and PS varies largely with seasons and the variation pattern is still not obvious.
Overall, the results of univariate correlation analysis and multivariate linear regression are similar to each other, which can add some strength to the reliability of our conclusions about the relationships between meteorological factors and PM2.5 concentration.

4. Discussion

As the experiments results show, the correlation between RH and PM2.5 concentration is negative in south China but positive in north China, which is a very interesting phenomenon. As far as we are concerned, the main cause for this phenomenon is the aerosol type difference between south China and north China. North China is a region of heavy industry, and the common aerosol type of this region is the City-Industry type [49], in which nitrate and sulfate account for a large proportion of the PM2.5 [9,32]. However, in south China, the aerosol type is Clean-Ocean type [49], and NaCl is one of the main components in the PM2.5 of this region. According to related studies [50,51], NaCl is more likely to absorb large amounts of moisture and fall to the ground under the high humidity situation of southeast China, but the hygroscopicity of nitrate and sulfate is weak, and they just grow heavier rather than falling to the ground under the drier situation in north China. Furthermore, according to the study of Dawson et al., high humidity can benefit the formation of ammonium nitrate, further causing the positive correlation in north China [52].
Many scholars have worked on research into space-borne retrieval of PM2.5 [53,54,55,56]. Among all the existing methods, models that consider the spatiotemporal variations [56,57] usually obtain higher retrieval accuracies. Taking the geographically weighted regression (GWR) model [57] as an example, it considers the spatiotemporal variations through changing the coefficients of the auxiliary variables in different areas and seasons, rather than using one model for all circumstances. For this type of retrieval model, the results of our work could provide some suggestions for the selection of auxiliary variables in different regions and seasons. For example, the correlation coefficient (r) value between PM2.5 and PS is nearly zero in summer, so we can suggest that this factor could be excluded in the central China summer model. The change of auxiliary variable type in the retrieval model could improve the PM2.5 retrieval accuracy.
Another phenomenon worth noting is that PM2.5 concentration has a strong correlation with TEM in the analysis at a yearly scale (i.e., the analysis including the data of every season), but, in the seasonal analysis, the correlation coefficient (r) values change to small values. We call this phenomenon “scale variation”, which indicates that the correlation between PM2.5 and meteorological factors varies with the temporal scale. For instance, in most of the long-time series (more than 10 years) analyses, the correlation between PM2.5 and TEM is positive [30], but, in most of the 1–2 years analyses [24], the relationship turns to negative, and when it comes to the seasonal analysis, the result changes again [25,27]. We believe that this is because the long-time series analyses mainly reflect the year-to-year variation, and the yearly analyses mainly reflect the variation within the seasons. Therefore, the results of our analyses in the four seasons and over a whole year can be seen as evidence of the scale variation, which needs to be noted in future studies.
There are also some limitations and uncertainties in our study. First, the relationships between PM2.5 concentration and meteorological factors are very complex, and we cannot figure out the specific interaction process only through correlation analysis and multivariate linear regression. More multivariate analyses are needed. In addition, physical models such as Chemical Transport Model (CTM) can also simulate and describe the complex relationship better. In the future study, we will pay more attention to multivariate analysis and CTM, the combination of the two different methods would also be very interesting and worth further research. Second, PM2.5 concentration is measured mainly using TEOM or beta attenuation monitor; the monitoring results of these two methods may be susceptible to meteorological conditions, although we have conducted a sensitivity test to verify our results, which is provided in the Supplementary Materials in Table S4, more studies about the relationships between measuring accuracy and meteorological factors are needed in the future.

5. Conclusions

Spatial and temporal heterogeneity is one of the most important properties of PM2.5 pollution, but many studies have ignored this aspect. In this study, through analyses of 68 cities and seven regions in four seasons during a period of two years, we have proven the existence of regional and seasonal variations of the correlations between PM2.5 concentration and meteorological factors.
(a)
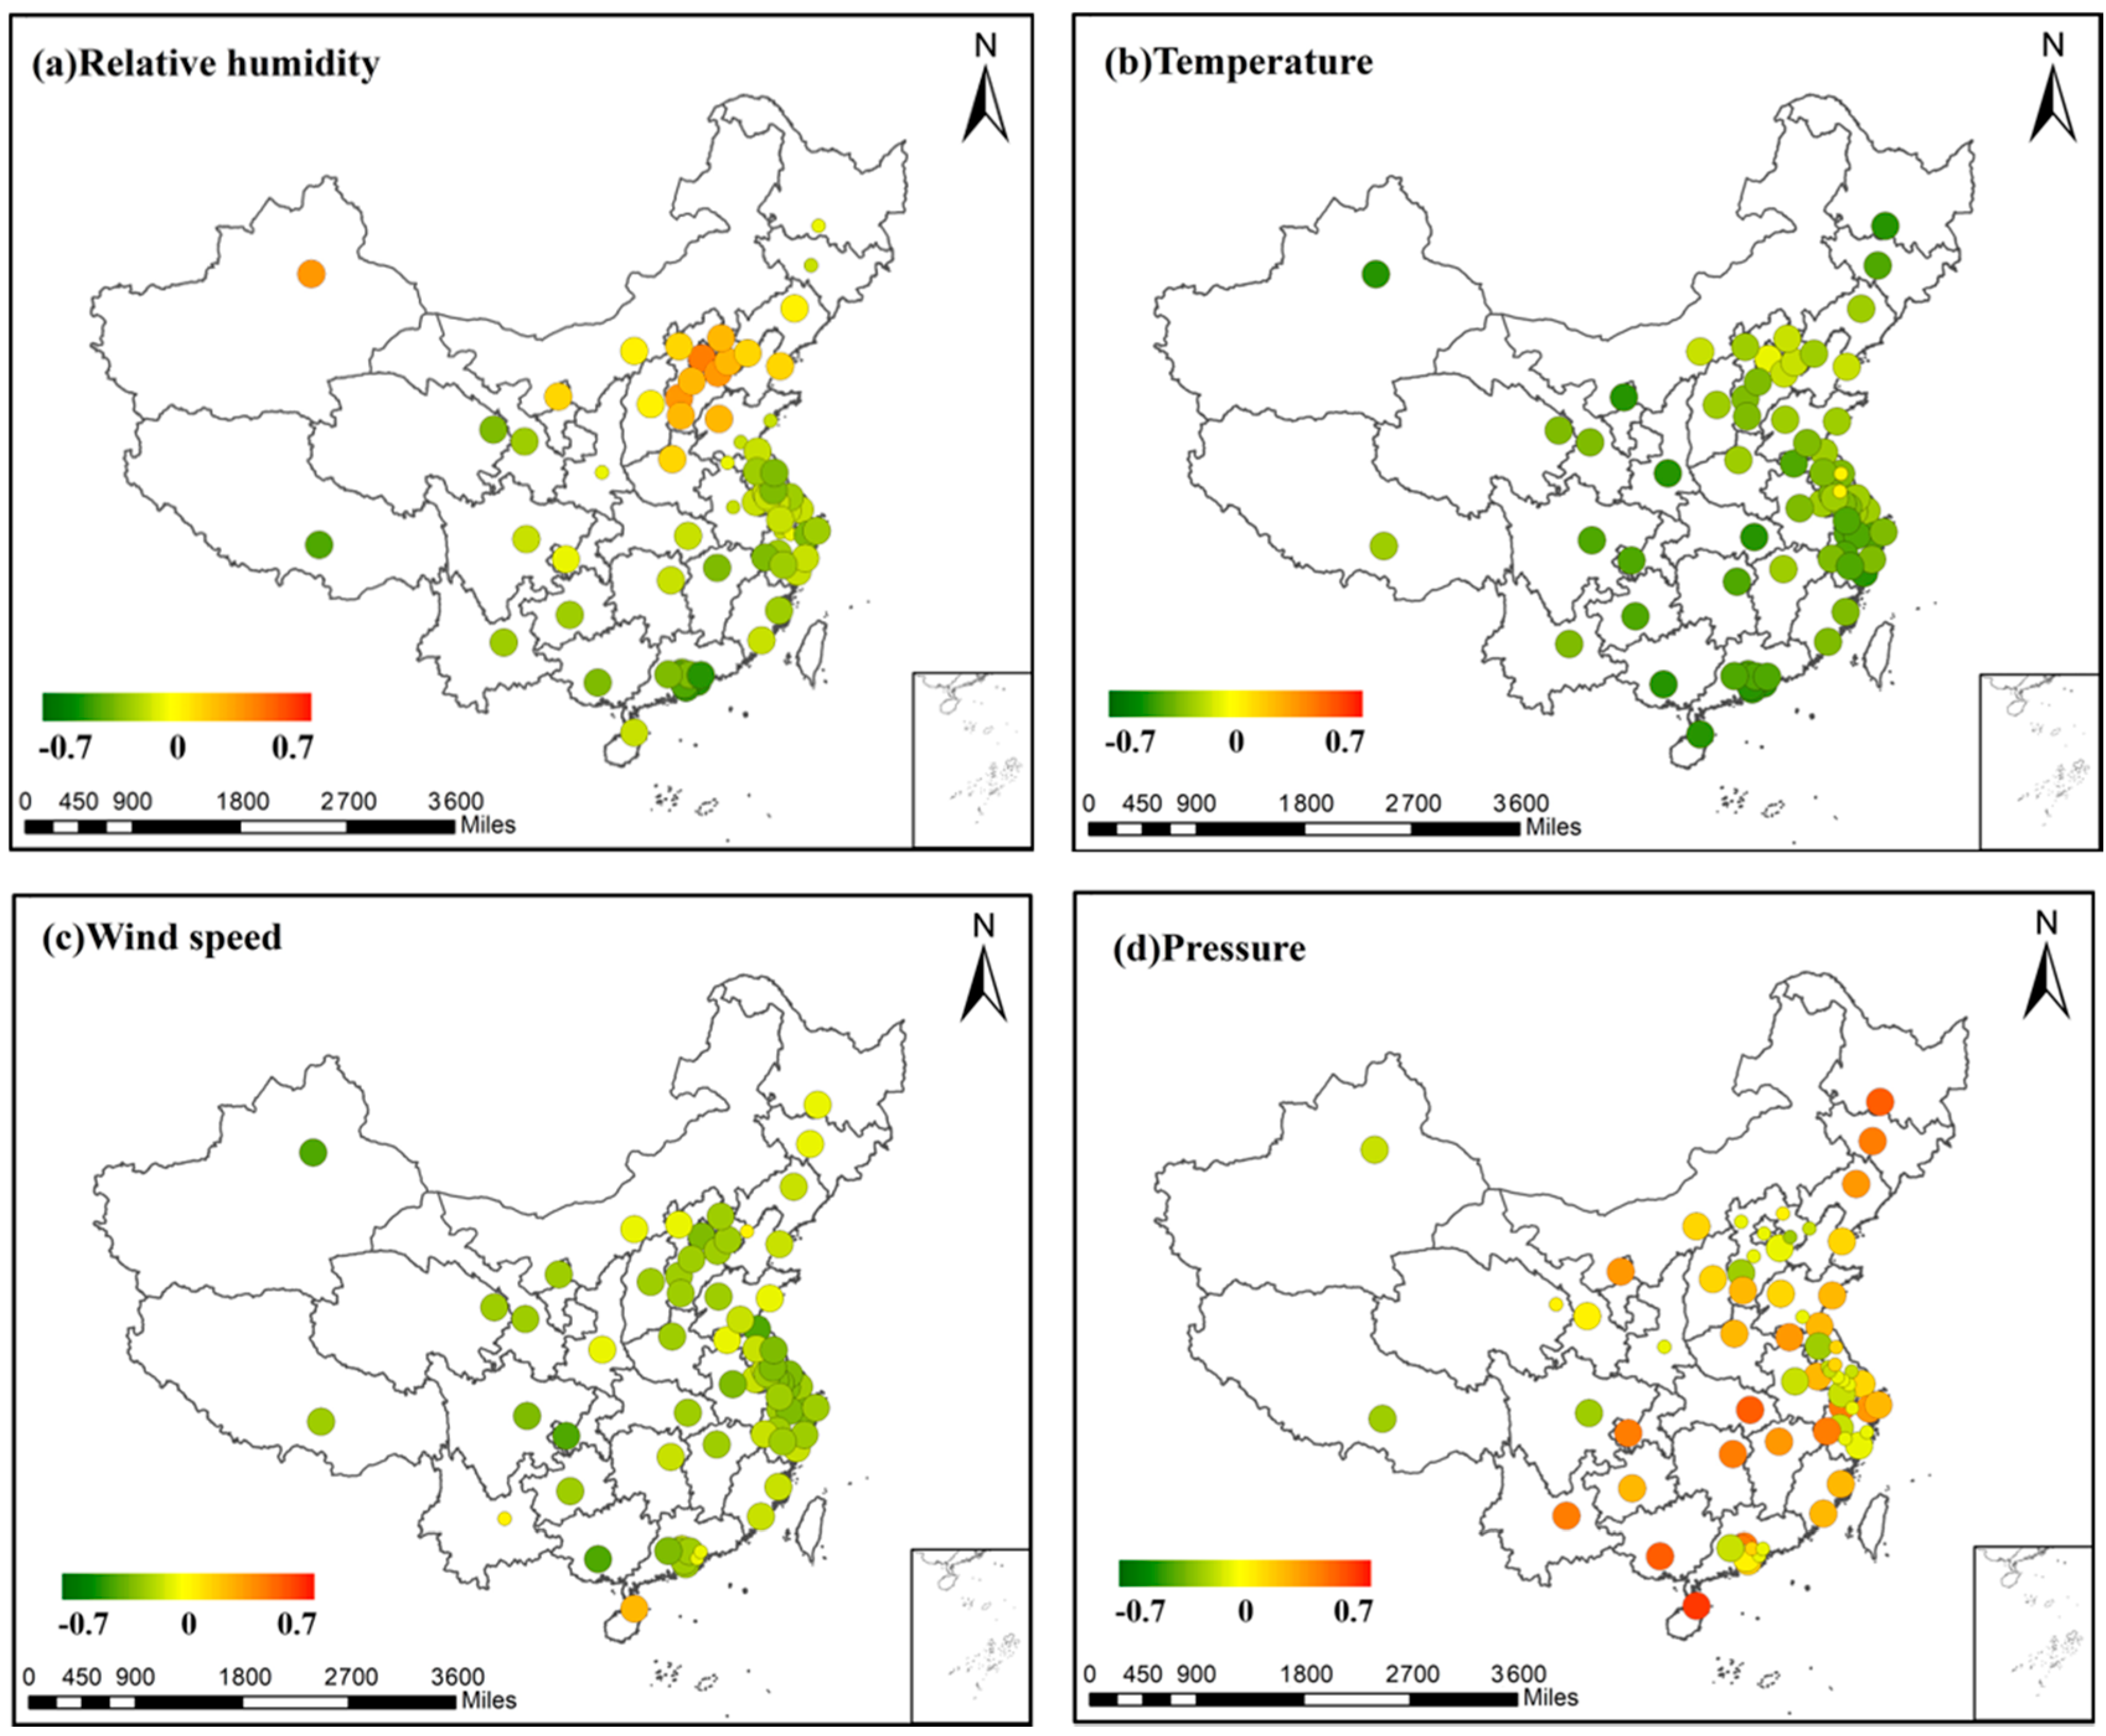
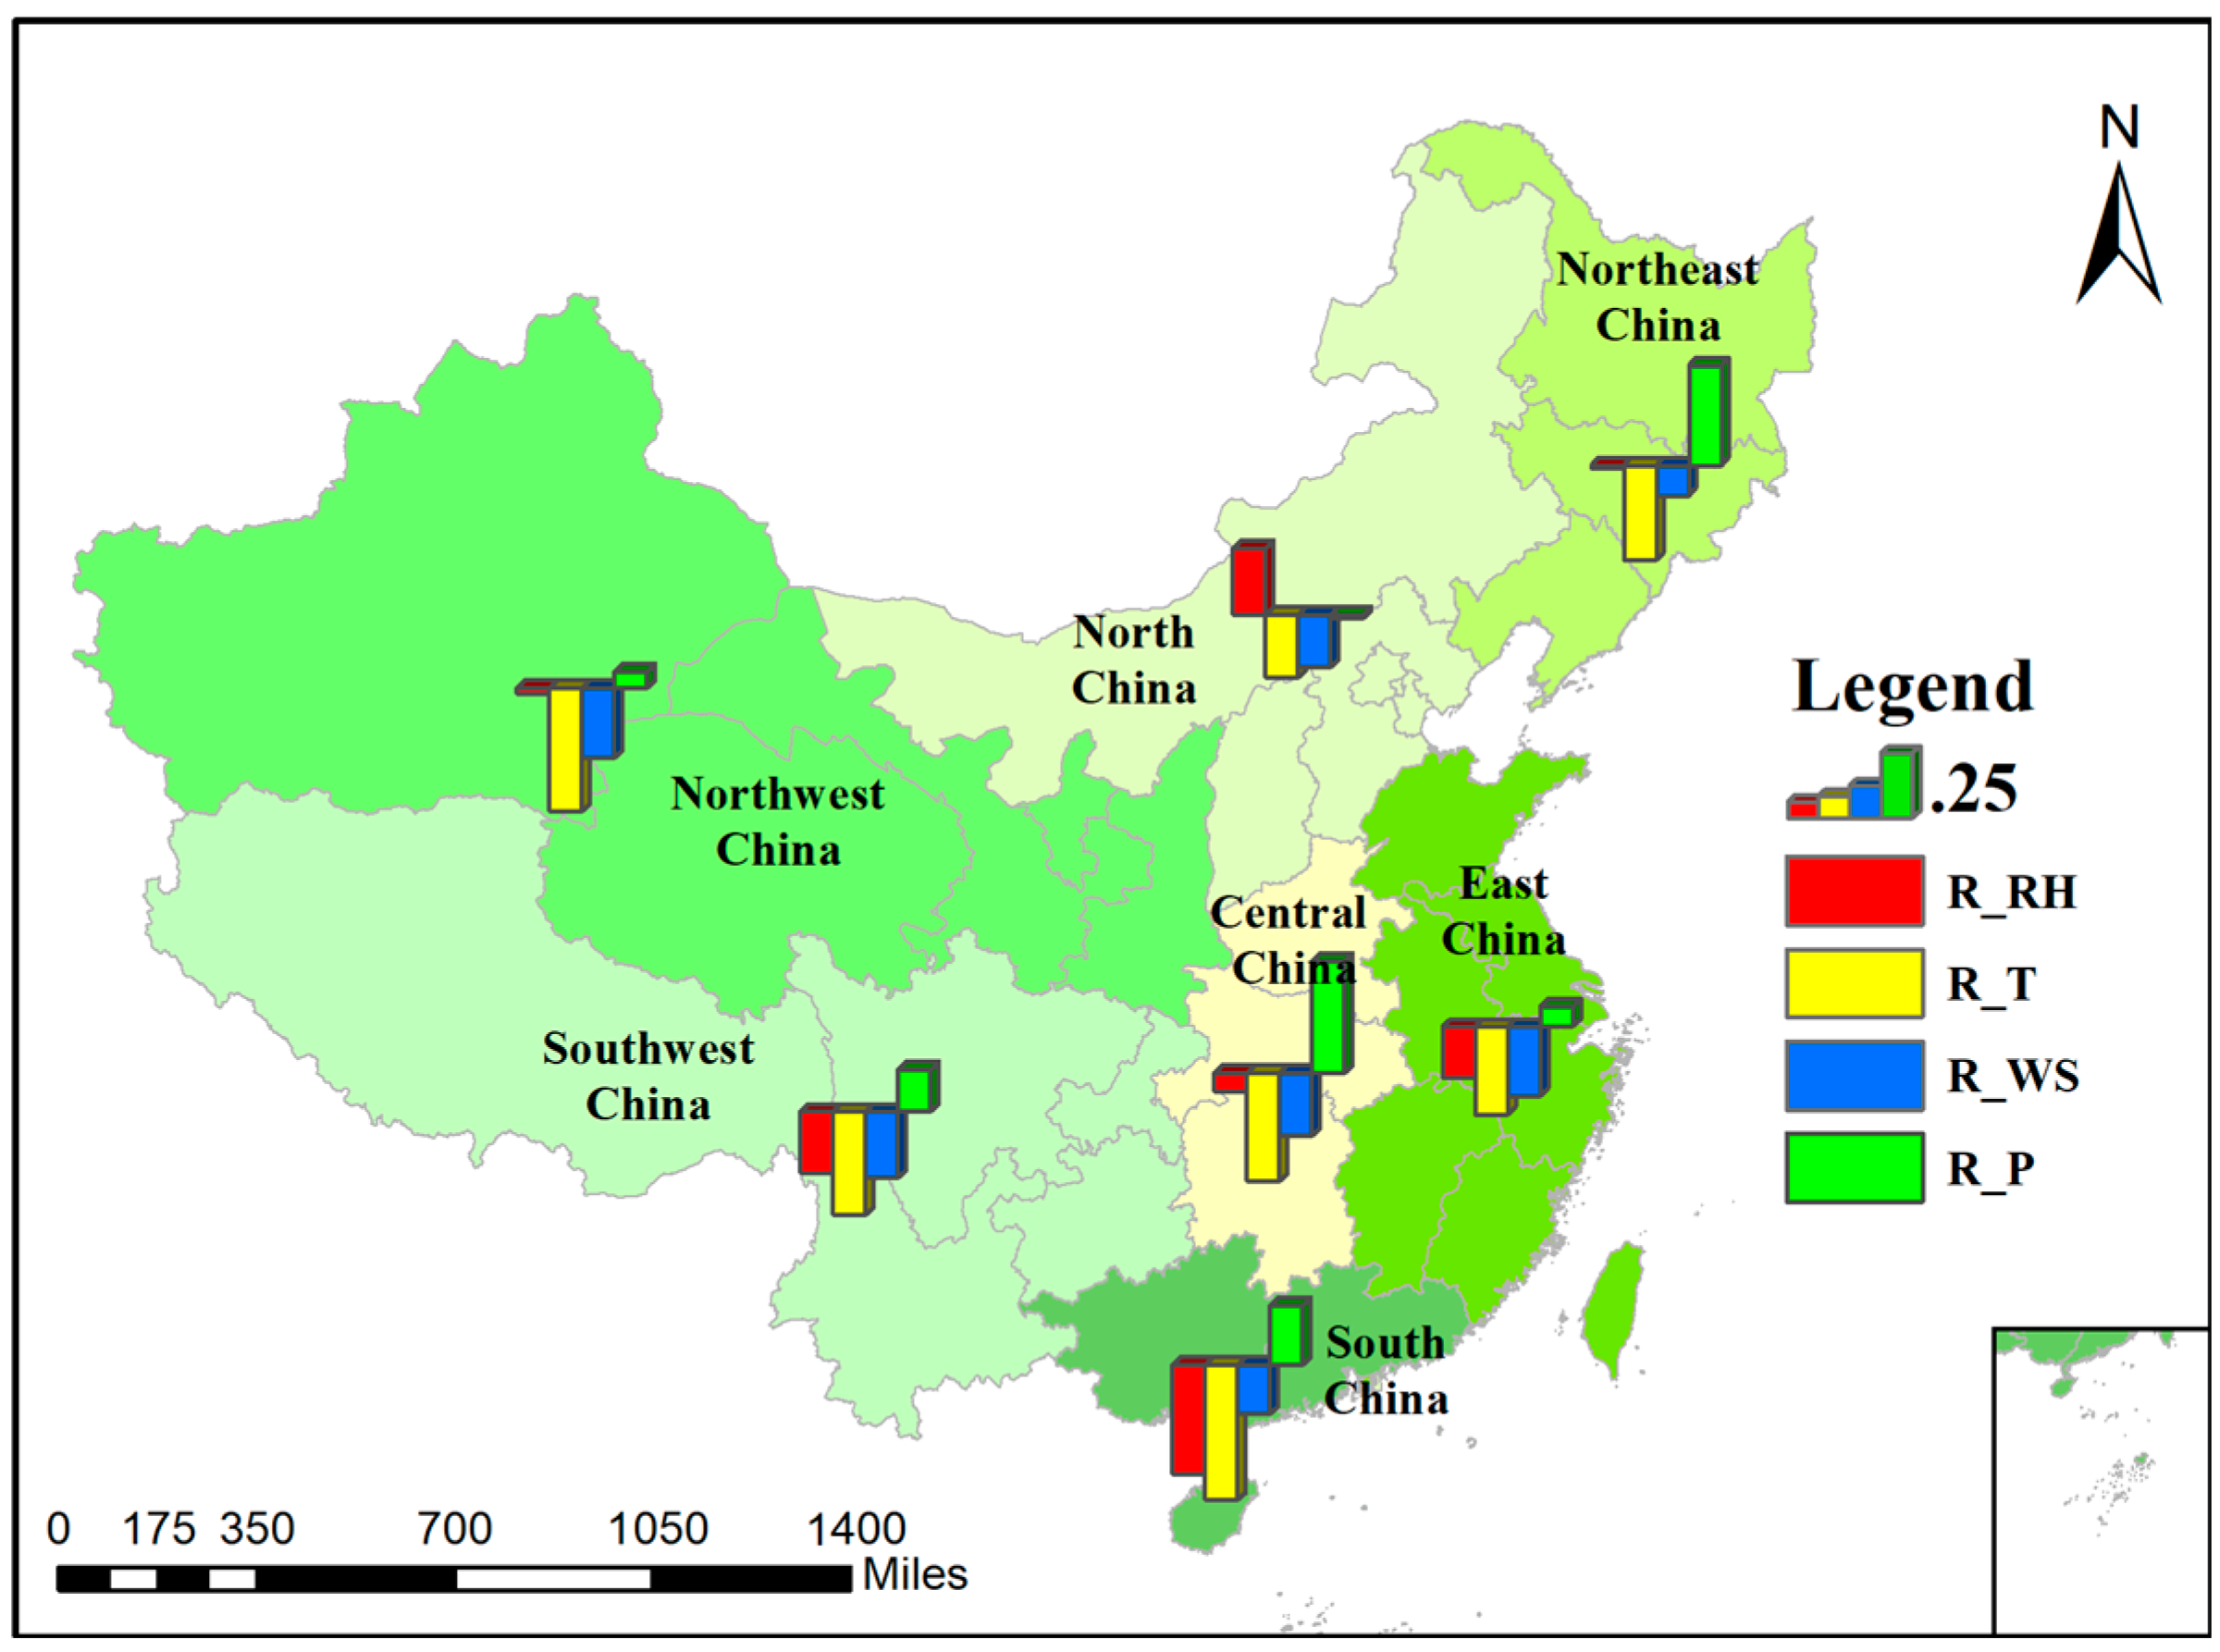
Spatially, the correlations between PM2.5 concentration and meteorological factors would vary with regions. The evidence is that RH is positively correlated with PM2.5 concentration in north China, but negatively correlated with PM2.5 in south China and other areas. The positive correlation between TEM and PM2.5 is weaker in north China than other areas. WS is negatively correlated with PM2.5 in almost every region, expect for Hainan Island. PS has a strong positive correlation with PM2.5 in northeast China and central China, but the correlation is weak in other places. The type of aerosol, the terrain, and the local climate can all be inducers of the regional variations.
(b)
Seasonally, there exists seasonal variations of the correlation between PM2.5 concentration and meteorological factors. The positive correlation between RH and PM2.5 is stronger in winter and spring; TEM is positively correlated with PM2.5 in winter and is negatively correlated with PM2.5 in autumn; and WS has the strongest correlation with PM2.5 in winter; and the correlation between PM2.5 and PS is the strongest in autumn. All anthropogenic and natural differences, such as the use of heating systems in the north China winter, and weather variations in the four seasons, may bring about seasonal variations.
In this study, we investigated the relationships between PM2.5 concentration and meteorological factors in terms of regional and seasonal variations, and we generated maps showing the varying patterns of the relationships. In this way, we could obtain a more comprehensive and precise understanding of how PM2.5 concentration is correlated with meteorological factors. This knowledge could provide a solid foundation for more accurate PM2.5 concentration retrieval, and for making more effective environmental protection policies for different regions. Although much work has been done in this area of research, there is still much room for improvement. Firstly, a global analysis with a longer time series and more factors, such as precipitation, sunlight duration, and terrain, would enable us to explain the variation more thoroughly. Secondly, there are still some phenomena that we cannot fully explain, and for which further research is needed, such as the regional variation of the PM2.5–PS correlation. The exploration of the cause of this regional and seasonal variation would help us to better understand the air pollution problem in China. Despite these limitations, our work could still provide a better chance for a more accurate forecast of PM2.5 concentration. Through considering the spatial and seasonal variations of the relationships between PM2.5 concentration and meteorological factors, the retrieval model of PM2.5 concentration could be more precise at a finer scale, and the concomitant improvement of haze forecast accuracy would be of great benefit.

Supplementary Materials

The following are available online at www.mdpi.com/1660-4601/14/12/1510/s1, Table S1: The result of the parameter sensitivity test in Beijing, Table S2: The corresponding relationships between cities, provinces, and regions, Table S3: The correlation coefficient (r) values and p-values between PM2.5 concentration and the four meteorological factors in the 68 cities, Table S4: The sensitivity test results. Figure S1: The seven regions in China.

Acknowledgments

This work was supported by the National Key R & D Program of China (No. 2016YFC0200900). We would also like to thank the data providers of the China National Environmental Monitoring Center (CNEMC) and the China Meteorological Data Service Center (CMDC).

Author Contributions

Qiangqiang Yuan conceived and designed the study; Qianqian Yang analyzed the data and wrote the paper; and Tongwen Li contributed data collection and experimental instructions. All the authors contribute to the editing and reviewing of the paper.

Conflicts of Interest

The authors declare no conflict of interest.

References

  1. Luo, J.; Du, P.; Samat, A.; Xia, J.; Che, M.; Xue, Z. Spatiotemporal Pattern of PM2.5 Concentrations in Mainland China and Analysis of Its Influencing Factors using Geographically Weighted Regression. Sci. Rep. 2017, 7, 40607. [Google Scholar] [CrossRef] [PubMed]
  2. Li, G.; Fang, C.; Wang, S.; Sun, S. The effect of economic growth, urbanization, and industrialization on fine particulate matter (PM2.5) concentrations in China. Environ. Sci. Technol. 2016, 50, 11452–11459. [Google Scholar] [CrossRef] [PubMed]
  3. World Health Organization; UNAIDS. Air Quality Guidelines: Global Update 2005; World Health Organization: Geneva, Switzerland, 2006. [Google Scholar]
  4. Zhang, F.; Cheng, H.R.; Wang, Z.W.; Lv, X.P.; Zhu, Z.M.; Zhang, G.; Wang, X.M. Fine particles (PM2.5) at a CAWNET background site in Central China: Chemical compositions, seasonal variations and regional pollution events. Atmos. Environ. 2014, 86, 193–202. [Google Scholar] [CrossRef]
  5. Wu, J.; Zhu, J.; Li, W.; Xu, D.; Liu, J. Estimation of the PM2.5 health effects in China during 2000–2011. Environ. Sci. Pollut. Res. 2017, 24, 10695–10707. [Google Scholar] [CrossRef] [PubMed]
  6. Guo, Y.; Zeng, H.; Zheng, R.; Li, S.; Barnett, A.G.; Zhang, S.; Zou, X.; Huxley, R.; Chen, W.; Williams, G. The association between lung cancer incidence and ambient air pollution in China: A spatiotemporal analysis. Environ. Res. 2016, 144, 60–65. [Google Scholar] [CrossRef] [PubMed]
  7. Lu, X.; Lin, C.; Li, Y.; Yao, T.; Fung, J.C.; Lau, A.K. Assessment of health burden caused by particulate matter in southern China using high-resolution satellite observation. Environ. Int. 2017, 98, 160–170. [Google Scholar] [CrossRef] [PubMed]
  8. Zhao, C.; Tie, X.; Lin, Y. A possible positive feedback of reduction of precipitation and increase in aerosols over eastern central China. Geophys. Res. Lett. 2006, 33. [Google Scholar] [CrossRef]
  9. Cao, J.J.; Shen, Z.X.; Chow, J.C.; Watson, J.G.; Lee, S.C.; Tie, X.X.; Ho, K.F.; Wang, G.H.; Han, Y.M. Winter and summer PM2.5 chemical compositions in fourteen Chinese cities. J. Air Waste Manag. 2012, 62, 1214–1226. [Google Scholar] [CrossRef]
  10. Liu, J.; Rühland, K.M.; Chen, J.; Xu, Y.; Chen, S.; Chen, Q.; Huang, W.; Xu, Q.; Chen, F.; Smol, J.P. Aerosol-weakened summer monsoons decrease lake fertilization on the Chinese Loess Plateau. Nat. Clim. Chang. 2017, 7, 190–194. [Google Scholar] [CrossRef]
  11. Xie, Y.; Dai, H.; Dong, H.; Hanaoka, T.; Masui, T. Economic impacts from PM2.5 pollution-related health effects in China: A provincial-Level analysis. Environ. Sci. Technol. 2016, 50, 4836–4843. [Google Scholar] [CrossRef] [PubMed]
  12. Chen, T.; Guo, J.; Li, Z.; Zhao, C.; Liu, H.; Cribb, M.; Wang, F.; He, J. A CloudSat perspective on the cloud climatology and its association with aerosol perturbation in the vertical over East China. J. Atmos. Sci. 2016, 73, 3599–3616. [Google Scholar] [CrossRef]
  13. Wall, C.; Zipser, E.; Liu, C. An Investigation of the Aerosol Indirect Effect on Convective Intensity Using Satellite Observations. J. Atmos. Sci. 2014, 71, 430–447. [Google Scholar] [CrossRef]
  14. Lee, S.-S.; Guo, J.P.; Li, Z. Delaying precipitation by air pollution over Pearl River Delta. Part 2: Model simulations. J. Geophys. Res. Atmos. 2016, 121, 11739–11760. [Google Scholar] [CrossRef]
  15. Guo, J.; Li, Z.; Miao, Y.; Li, J.; Liu, H.; Xu, H.; Cribb, M.; Zhai, P. Declining frequency of summertime local-scale precipitation over eastern China from 1970–2010 and its potential link to aerosols. Geophys. Res. Lett. 2017, 44, 5700–5708. [Google Scholar] [CrossRef]
  16. Dai, W.; Gao, J.; Cao, G.; Ouyang, F. Chemical composition and source identification of PM2.5 in the suburb of Shenzhen, China. Atmos. Res. 2013, 122, 391–400. [Google Scholar] [CrossRef]
  17. Lai, S.; Zhao, Y.; Ding, A.; Zhang, Y.; Song, T.; Zheng, J.; Song, T.; Zheng, J.; Lee, S.; Zhong, L. Characterization of PM2.5 and the major chemical components during a 1-year campaign in rural Guangzhou, southern China. Atmos. Res. 2016, 167, 208–215. [Google Scholar] [CrossRef]
  18. Cai, W.; Li, K.; Liao, H.; Wang, H.; Wu, L. Weather conditions conducive to Beijing severe haze more frequent under climate change. Nat. Clim. Chang. 2017, 7, 257–262. [Google Scholar] [CrossRef]
  19. Liu, Y.; Zhao, N.; Vanos, J.K.; Cao, G. Effects of synoptic weather on ground-level PM2.5 concentrations in the United States. Atmos. Environ. 2017, 148, 297–305. [Google Scholar] [CrossRef]
  20. Zhang, H.; Wang, Y.; Park, T.W.; Deng, Y. Quantifying the relationship between extreme air pollution events and extreme weather events. Atmos. Res. 2017, 188, 64–79. [Google Scholar] [CrossRef]
  21. Chang, W.; Zhan, J. The association of weather patterns with haze episodes: Recognition by PM2.5 oriented circulation classification applied in Xiamen, Southeastern China. Atmos. Res. 2017, 197, 425–436. [Google Scholar] [CrossRef]
  22. Jones, A.M.; Harrison, R.M.; Baker, J. The wind speed dependence of the concentrations of airborne particulate matter and NOx. Atmos. Environ. 2010, 44, 1682–1690. [Google Scholar] [CrossRef]
  23. Chen, T.; He, J.; Lu, X.; She, J.; Guan, Z. Spatial and Temporal Variations of PM2.5 and Its Relation to Meteorological Factors in the Urban Area of Nanjing, China. Int. J. Environ. Res. Public Health 2016, 13, 921. [Google Scholar] [CrossRef] [PubMed]
  24. Li, Y.; Chen, Q.; Zhao, H.; Wang, L.; Tao, R. Variations in PM10, PM2.5 and PM1.0 in an urban area of the Sichuan Basin and their relation to meteorological factors. Atmosphere 2015, 6, 150–163. [Google Scholar] [CrossRef]
  25. Huang, F.; Li, X.; Wang, C.; Xu, Q.; Wang, W.; Luo, Y.; Tao, L.; Gao, Q.; Guo, J.; Chen, S.; et al. PM2.5 spatiotemporal variations and the relationship with meteorological factors during 2013–2014 in Beijing, China. PLoS ONE 2015, 10, e0141642. [Google Scholar] [CrossRef] [PubMed]
  26. Xu, J.; Yan, F.; Xie, Y.; Wang, F.; Wu, J.; Fu, Q. Impact of meteorological conditions on a nine-day particulate matter pollution event observed in December 2013, Shanghai, China. Particuology 2015, 20, 69–79. [Google Scholar] [CrossRef]
  27. Zhang, H.; Wang, Y.; Hu, J.; Ying, Q.; Hu, X.M. Relationships between meteorological parameters and criteria air pollutants in three megacities in China. Environ. Res. 2015, 140, 242–254. [Google Scholar] [CrossRef] [PubMed]
  28. Chen, Z.; Cai, J.; Gao, B.; Xu, B.; Dai, S.; He, B.; Xie, X. Detecting the causality influence of individual meteorological factors on local PM2.5 concentration in the Jing-Jin-Ji region. Sci. Rep. 2017, 7, 40735. [Google Scholar] [CrossRef] [PubMed]
  29. Li, J.; Wang, G.; Wang, X.; Cao, J.; Sun, T.; Cheng, C.; Meng, J.; Hu, T.; Liu, S. Abundance, composition and source of atmospheric PM2.5 at a remote site in the Tibetan Plateau, China. Tellus B Chem. Phys. Meteorol. 2013, 65, 20281. [Google Scholar]
  30. Tai, A.P.; Mickley, L.J.; Jacob, D.J. Correlations between fine particulate matter, PM2.5 and meteorological variables in the United States: Implications for the sensitivity of PM2.5 to climate change. Atmos. Environ. 2010, 44, 3976–3984. [Google Scholar] [CrossRef]
  31. Tran, H.N.; Mölders, N. Investigations on meteorological conditions for elevated PM2.5 in Fairbanks, Alaska. Atmos. Res. 2011, 99, 39–49. [Google Scholar] [CrossRef]
  32. Wang, Y.; Ying, Q.; Hu, J.; Zhang, H. Spatial and temporal variations of six criteria air pollutants in 31 provincial capital cities in China during 2013–2014. Environ. Int. 2014, 73, 413–422. [Google Scholar] [CrossRef] [PubMed]
  33. Daly, C.; Gibson, W.P.; Taylor, G.H.; Johnson, G.L.; Pasteris, P. A knowledge-based approach to the statistical mapping of climate. Clim. Res. 2002, 22, 99–113. [Google Scholar] [CrossRef]
  34. Krivoruchko, K. Empirical Bayesian Kriging; ESRI: Redlands, CA, USA, 2012; Available online: www.esri.com/NEWS/ARCUSER/1012/files/ebk.pdf (accessed on 30 November 2017).
  35. Zhang, H.; Wang, Z.; Zhang, W. Exploring spatiotemporal patterns of PM2.5 in China based on ground-level observations for 190 cities. Environ. Pollut. 2016, 216, 559–567. [Google Scholar] [CrossRef] [PubMed]
  36. Yan, S.; Cao, H.; Chen, Y.; Wu, C.; Hong, T.; Fan, H. Spatial and temporal characteristics of air quality and air pollutants in 2013 in Beijing. Environ. Sci. Pollut. Res. 2016, 23, 13996–14007. [Google Scholar] [CrossRef] [PubMed]
  37. Kassomenos, P.A.; Vardoulakis, S.; Chaloulakou, A.; Paschalidou, A.K.; Grivas, G.; Borge, R.; Lumbreras, J. Study of PM10 and PM2.5 levels in three European cities: Analysis of intra and inter urban variations. Atmos. Environ. 2014, 87, 153–163. [Google Scholar] [CrossRef]
  38. Barnaba, F.; Gobbi, G.P. Aerosol seasonal variability over the Mediterranean region and relative impact of maritime, continental and Saharan dust particles over the basin from MODIS data in the year 2001. Atmos. Chem. Phys. 2004, 4, 2367–2391. [Google Scholar] [CrossRef]
  39. Ma, Z.; Hu, X.; Huang, L.; Bi, J.; Liu, Y. Estimating ground-level PM2.5 in China using satellite remote sensing. Environ. Sci. Technol. 2014, 48, 7436–7444. [Google Scholar] [CrossRef] [PubMed]
  40. Geng, G.; Zhang, Q.; Martin, R.V.; van Donkelaar, A.; Huo, H.; Che, H.; Lin, J.; He, K. Estimating long-term PM2.5 concentrations in China using satellite-based aerosol optical depth and a chemical transport model. Remote Sens. Environ. 2015, 166, 262–270. [Google Scholar] [CrossRef]
  41. Li, T.; Shen, H.; Zeng, C.; Yuan, Q.; Zhang, L. Point-surface fusion of station measurements and satellite observations for mapping PM2.5 distribution in China: Methods and assessment. Atmos. Environ. 2017, 152, 477–489. [Google Scholar] [CrossRef]
  42. Li, T.; Shen, H.; Yuan, Q.; Zhang, X.; Zhang, L. Estimating ground-level PM2.5 by fusing satellite and station observations: A geo-intelligent deep learning approach. Geophys. Res. Lett. 2017, 44. [Google Scholar] [CrossRef]
  43. Lu, D.; Xu, J.; Yang, D.; Zhao, J. Spatio-temporal variation and influence factors of PM2.5 concentrations in China from 1998 to 2014. Atmos. Pollut. Res. 2017, 8, 1151–1159. [Google Scholar] [CrossRef]
  44. Wu, P.; Ding, Y.; Liu, Y. Atmospheric circulation and dynamic mechanism for persistent haze events in the Beijing-Tianjin-Hebei region. Adv. Atmos. Sci. 2017, 34, 429–440. [Google Scholar] [CrossRef]
  45. Guo, J.; Miao, Y.; Zhang, Y.; Liu, H.; Li, Z.; Zhang, W.; He, J.; Lou, M.; Yan, Y.; Bian, L.; et al. The climatology of planetary boundary layer height in China derived from radiosonde and reanalysis data. Atmos. Chem. Phys. 2016, 16, 13309–13319. [Google Scholar] [CrossRef]
  46. Zheng, M.; Salmon, L.G.; Schauer, J.J.; Zeng, L.; Kiang, C.S.; Zhang, Y.; Cass, G.R. Seasonal trends in PM2.5 source contributions in Beijing, China. Atmos. Environ. 2005, 39, 3967–3976. [Google Scholar] [CrossRef]
  47. Dan, M.; Zhuang, G.; Li, X.; Tao, H.; Zhuang, Y. The characteristics of carbonaceous species and their sources in PM2.5 in Beijing. Atmos. Environ. 2004, 38, 3443–3452. [Google Scholar] [CrossRef]
  48. Wang, B.; Wu, R.; Lau, K.M. Interannual variability of the Asian summer monsoon: Contrasts between the Indian and the western North Pacific–East Asian monsoons. J. Clim. 2001, 14, 4073–4090. [Google Scholar] [CrossRef]
  49. Hu, D.; Qiao, L.; Chen, J.; Ye, X.; Yang, X.; Cheng, T.; Fang, W. Hygroscopicity of inorganic aerosols: Size and relative humidity effects on the growth factor. Aerosol. Air Qual. Res. 2010, 10, 255–264. [Google Scholar] [CrossRef]
  50. Ye, X.; Chen, J. Haze and hygroscopic growth. Chin. J. Nat. 2013, 35, 337–341. [Google Scholar]
  51. Dawson, J.P.; Adams, P.J.; Pandis, S.N. Sensitivity of PM2.5 to climate in the Eastern US: A modeling case study. Atmos. Chem. Phys. 2007, 7, 4295–4309. [Google Scholar] [CrossRef]
  52. Guo, J.P.; Zhang, X.Y.; Che, H.Z.; Gong, S.L.; An, X.Q.; Cao, C.X.; Guang, J.; Zhang, H.; Wang, Y.Q.; Zhang, X.C.; et al. Correlation between PM Concentrations and Aerosol Optical Depth in Eastern China. Atmos. Environ. 2009, 43, 5876–5886. [Google Scholar] [CrossRef]
  53. Wu, Y.R.; Guo, J.P.; Zhang, X.Y.; Tian, X.; Zhang, J.H.; Wang, Y.Q.; Duan, J.; Li, X.W. Synergy of satellite and ground based observations in estimation of particulate matter in eastern China. Sci. Total Environ. 2012, 433, 20–30. [Google Scholar] [CrossRef] [PubMed]
  54. Chu, Y.; Liu, Y.; Li, X.; Liu, Z.; Lu, H.; Lu, Y.; Mao, Z.; Chen, X.; Li, N.; Ren, M.; et al. A Review on Predicting Ground PM2.5 Concentration Using Satellite Aerosol Optical Depth. Atmosphere 2016, 7, 129. [Google Scholar] [CrossRef]
  55. Ma, X.; Wang, J.; Yu, F.; Jia, H.; Hu, Y. Can MODIS AOD be employed to derive PM2.5 in Beijing-Tianjin-Hebei over China? Atmos. Res. 2016, 181, 250–256. [Google Scholar] [CrossRef]
  56. Fang, X.; Zou, B.; Liu, X.; Sternberg, T.; Zhai, L. Satellite-based ground PM2.5 estimation using timely structure adaptive modeling. Remote Sens. Environ. 2016, 186, 152–163. [Google Scholar] [CrossRef]
  57. Hu, X.; Waller, L.A.; Al-Hamdan, M.Z.; Crosson, W.L.; Estes, M.G.; Estes, S.M.; Quattrochi, D.A.; Sarnat, J.A.; Liu, Y. Estimating ground-level PM2.5 concentrations in the southeastern US using geographically weighted regression. Environ. Res. 2013, 121, 1–10. [Google Scholar] [CrossRef] [PubMed]
Figure 1. Study area: 68 major cities in China.
Ijerph 14 01510 g001
Figure 2. The distribution of: (a) PM2.5 monitoring stations; and (b) meteorological stations in China in 2015.
Ijerph 14 01510 g002
Figure 3. Flow chart of the study design.
Ijerph 14 01510 g003
Figure 4. Temporal variation of PM2.5 concentration from 2013 to 2015.
Ijerph 14 01510 g004
Figure 5. (a) Annual PM2.5 concentration at the monitoring stations in 2015; and (b) the distribution of annual average PM2.5 concentration in China interpolated by EBK.
Ijerph 14 01510 g005
Figure 6. The correlation coefficient (r) values in the 68 major cities: (a) correlation between PM2.5 concentration and RH; (b) correlation between PM2.5 concentration and TEM; (c) correlation between PM2.5 concentration and WS; and (d) correlation between PM2.5 concentration and PS.
Ijerph 14 01510 g006
Figure 7. Clustering result of the 68 cities. (The letter “N” in the cluster name represents “Negative correlation” with r ≤ −0.2; “P” represents “Positive correlation” with r ≥ 0.2; “W” represents “Weak correlation” with −0.2 < r < 0.2. The four letters of each cluster name stand for the correlations between PM2.5 concentration and RH, TEM, WS, PS sequentially.)
Ijerph 14 01510 g007
Figure 8. Histograms of the correlation coefficient (r) values in the seven regions.
Ijerph 14 01510 g008
Figure 9. The distribution of the correlation coefficient (r) values in the four seasons.
Ijerph 14 01510 g009
Figure 10. Seasonal distribution of the correlation coefficient (r) value histograms in the seven regions.
Ijerph 14 01510 g010
Figure 11. The distribution of the regression coefficient of four factors at year scale.
Ijerph 14 01510 g011
Figure 12. The distribution of the regression coefficient of four factors in four seasons.
Ijerph 14 01510 g012
Table 1. The correlation coefficients and p-values of cities in south China and north China.
RegionCityCorrelation Coefficient (r)Significance p-Value
r-RHr-TEMr-WSr-PSP-RHP-TEMP-WSP-PS
North ChinaBeijing0.484−0.072−0.376−0.0040.00000.00090.00000.2176
Tianjin0.307−0.106−0.206−0.0750.00000.00000.00000.0405
Shijiazhuang0.331−0.368−0.291−0.2280.00000.00000.00000.0170
Tangshan0.294−0.149−0.202−0.2040.00000.00000.00000.3530
Qinhuangdao0.161−0.2020.022−0.1900.00000.00000.44430.1493
Baoding0.272−0.380−0.212−0.0670.00000.00000.00000.9763
Zhangjiakou0.166−0.300−0.030−0.0300.00000.00000.00740.8171
Chengde0.238−0.137−0.2210.0340.00000.00020.00000.0696
Xingtai0.274−0.370−0.2660.2430.00000.00000.00000.0000
Taiyuan0.062−0.287−0.2480.1920.01040.00000.00000.0433
Huhehaote0.091−0.174−0.0880.1530.04810.00000.01330.0000
South ChinaGuangzhou−0.376−0.427−0.1790.4440.00000.00000.00370.0000
Shenzhen−0.504−0.531−0.031−0.0610.00000.00000.31080.0637
Zhuhai−0.502−0.596−0.2330.1190.00000.00000.00000.0174
Foshan−0.423−0.440−0.2330.4710.00000.00000.00000.0000
Zhongshan−0.445−0.510−0.2740.0730.00000.00000.00000.0019
Dongguan−0.375−0.450−0.2730.1530.00000.00000.00000.2288
Huizhou−0.585−0.453−0.019−0.0270.00000.00000.70300.5015
Zhaoqing−0.322−0.453−0.356−0.1880.00000.00000.00000.0005
Nanning−0.324−0.534−0.4350.5920.00000.00000.00000.0000
Haikou−0.157−0.5900.2200.6060.00000.00000.00450.0000
Table 2. The major and minor influencing factors of the seven regions.
Region (Type Number)Major Factors (|r| > 0.3)Minor Factors (0.3 > |r| > 0.2)
North China (1)/RH, TEM
South China (2)TEM, RHPS
Central China (3)PS, TEMWS
Northeast China (3)PS, TEM\
Southwest China (4)TEMWS
Northwest China (4)TEMWS
East China (4)TEMWS
Table 3. The major and minor influencing factors of the seven regions (the color of each cell stands for the sign and magnitude of the correlation coefficient (r) value, where red stands for a positive correlation and blue stands for negative).
SpringSummer
RegionRHTEMWSPSRegionRHTEMWSPS
Central China0.04−0.01−0.280.04Central China0.06−0.13−0.320.00
North China0.48−0.03−0.28−0.16North China0.300.210.03−0.22
South China−0.18−0.48−0.330.16South China−0.270.26−0.28−0.26
Southwest China−0.22−0.02−0.170.09Southwest China−0.210.20−0.18−0.07
Northwest China−0.01−0.20−0.14−0.08Northwest China−0.100.24−0.02−0.20
Northeast China−0.050.03−0.150.14Northeast China−0.080.26−0.020.14
East China−0.120.16−0.30−0.10East China−0.08−0.05−0.320.05
Average−0.01−0.08−0.240.01Average−0.050.14−0.16−0.08
AutumnWinter
RegionRHTEMWSPSRegionRHTEMWSPS
Central China−0.23−0.01−0.100.14Central China−0.030.26−0.33−0.05
North China0.34−0.07−0.30−0.15North China0.540.27−0.43−0.19
South China−0.44−0.35−0.100.16South China−0.48−0.05−0.370.03
Southwest China−0.30−0.15−0.340.07Southwest China0.08−0.01−0.380.07
Northwest China−0.10−0.29−0.28−0.14Northwest China0.130.00−0.34−0.07
Northeast China0.13−0.25−0.160.25Northeast China0.520.09−0.540.14
East China−0.17−0.35−0.330.15East China−0.200.27−0.36−0.12
Average−0.11−0.21−0.230.07Average0.080.12−0.39−0.03

