Spatiotemporal Distribution of U5MR and Their Relationship with Geographic and Socioeconomic Factors in China

 , ,
, ,
Abstract
:1. Introduction
2. Data Acquisition
2.1. U5MR Data
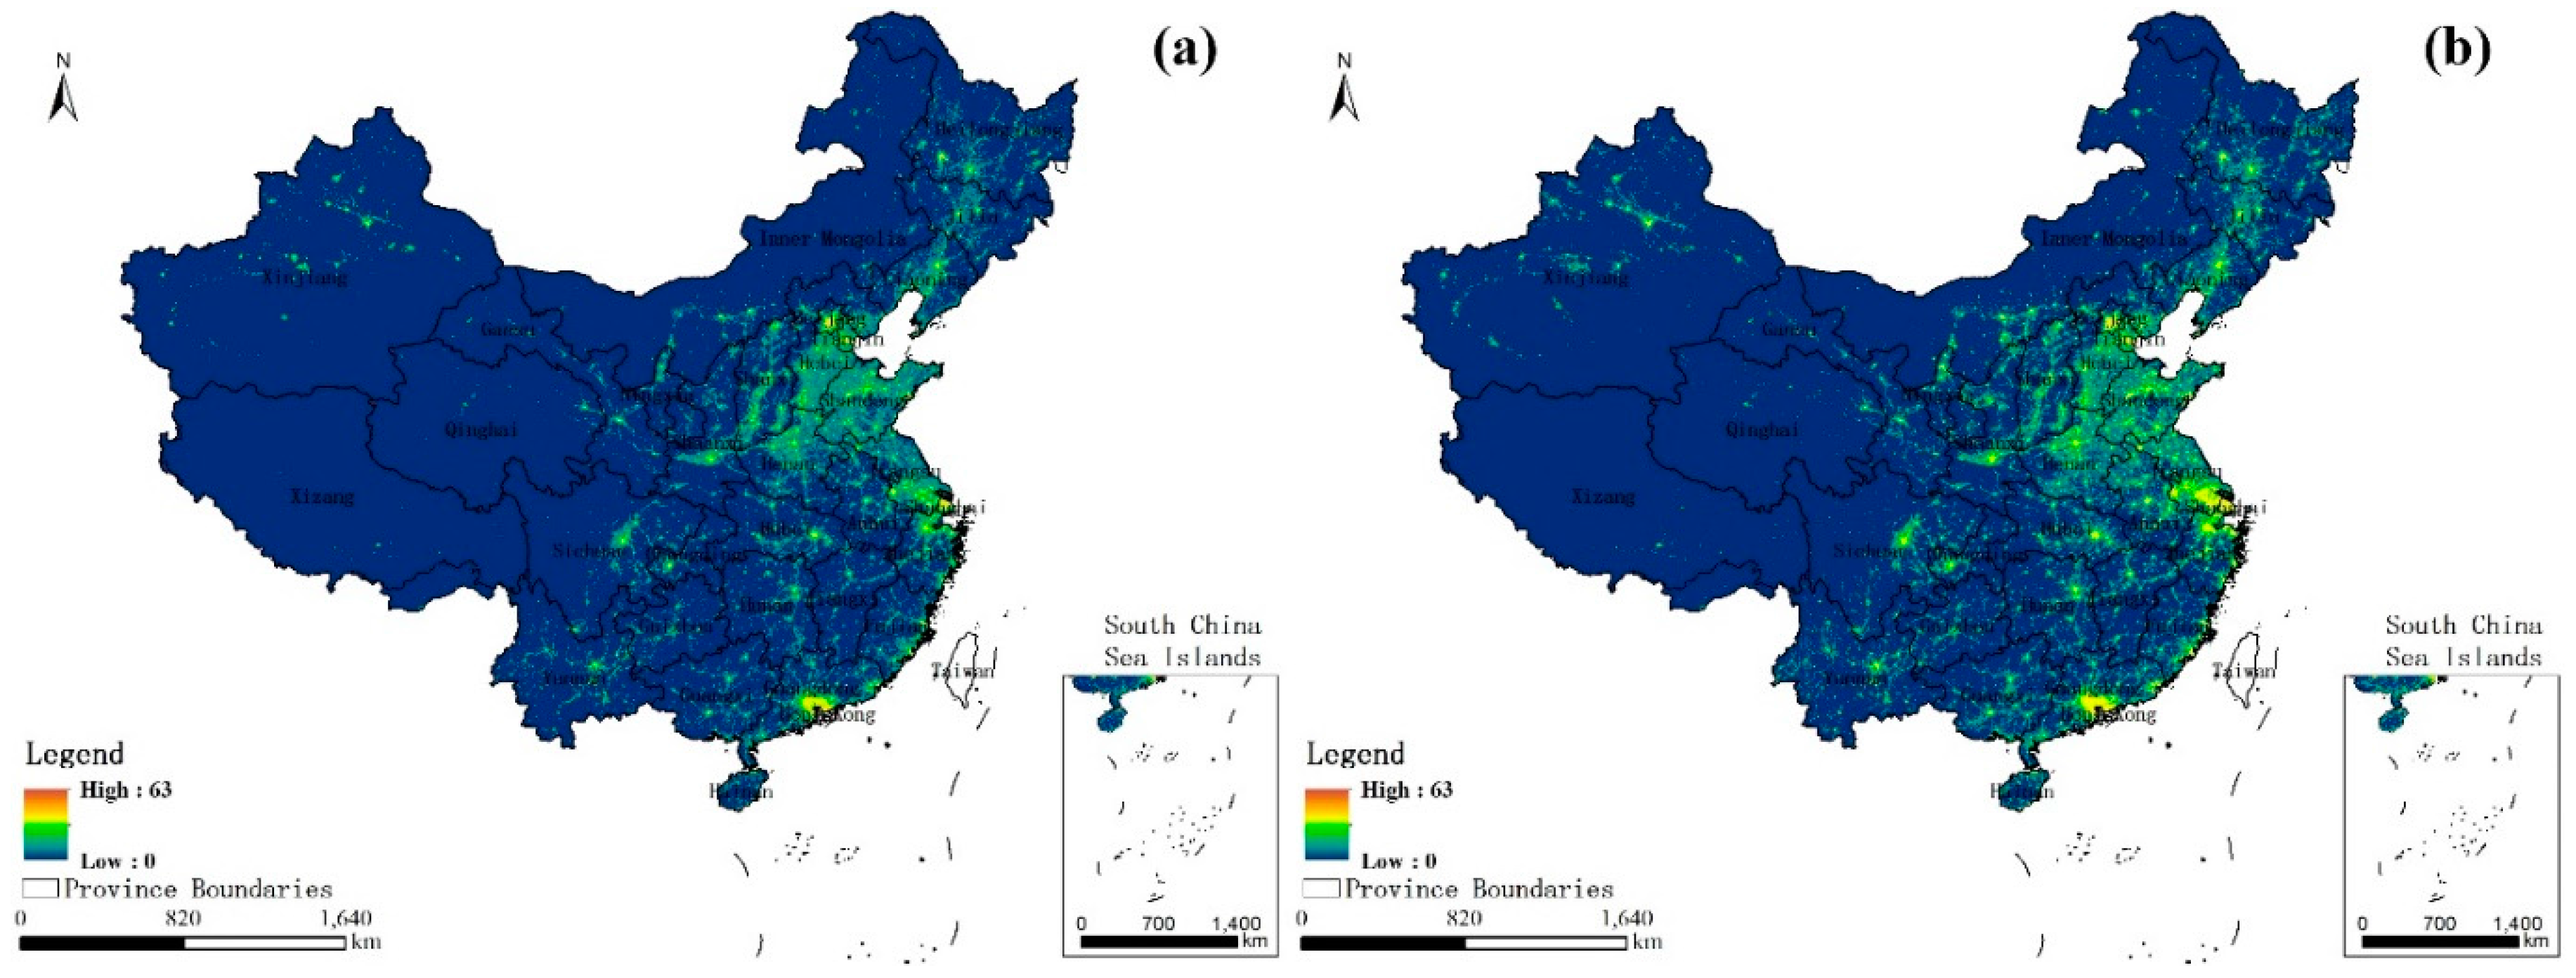
2.2. NL Data
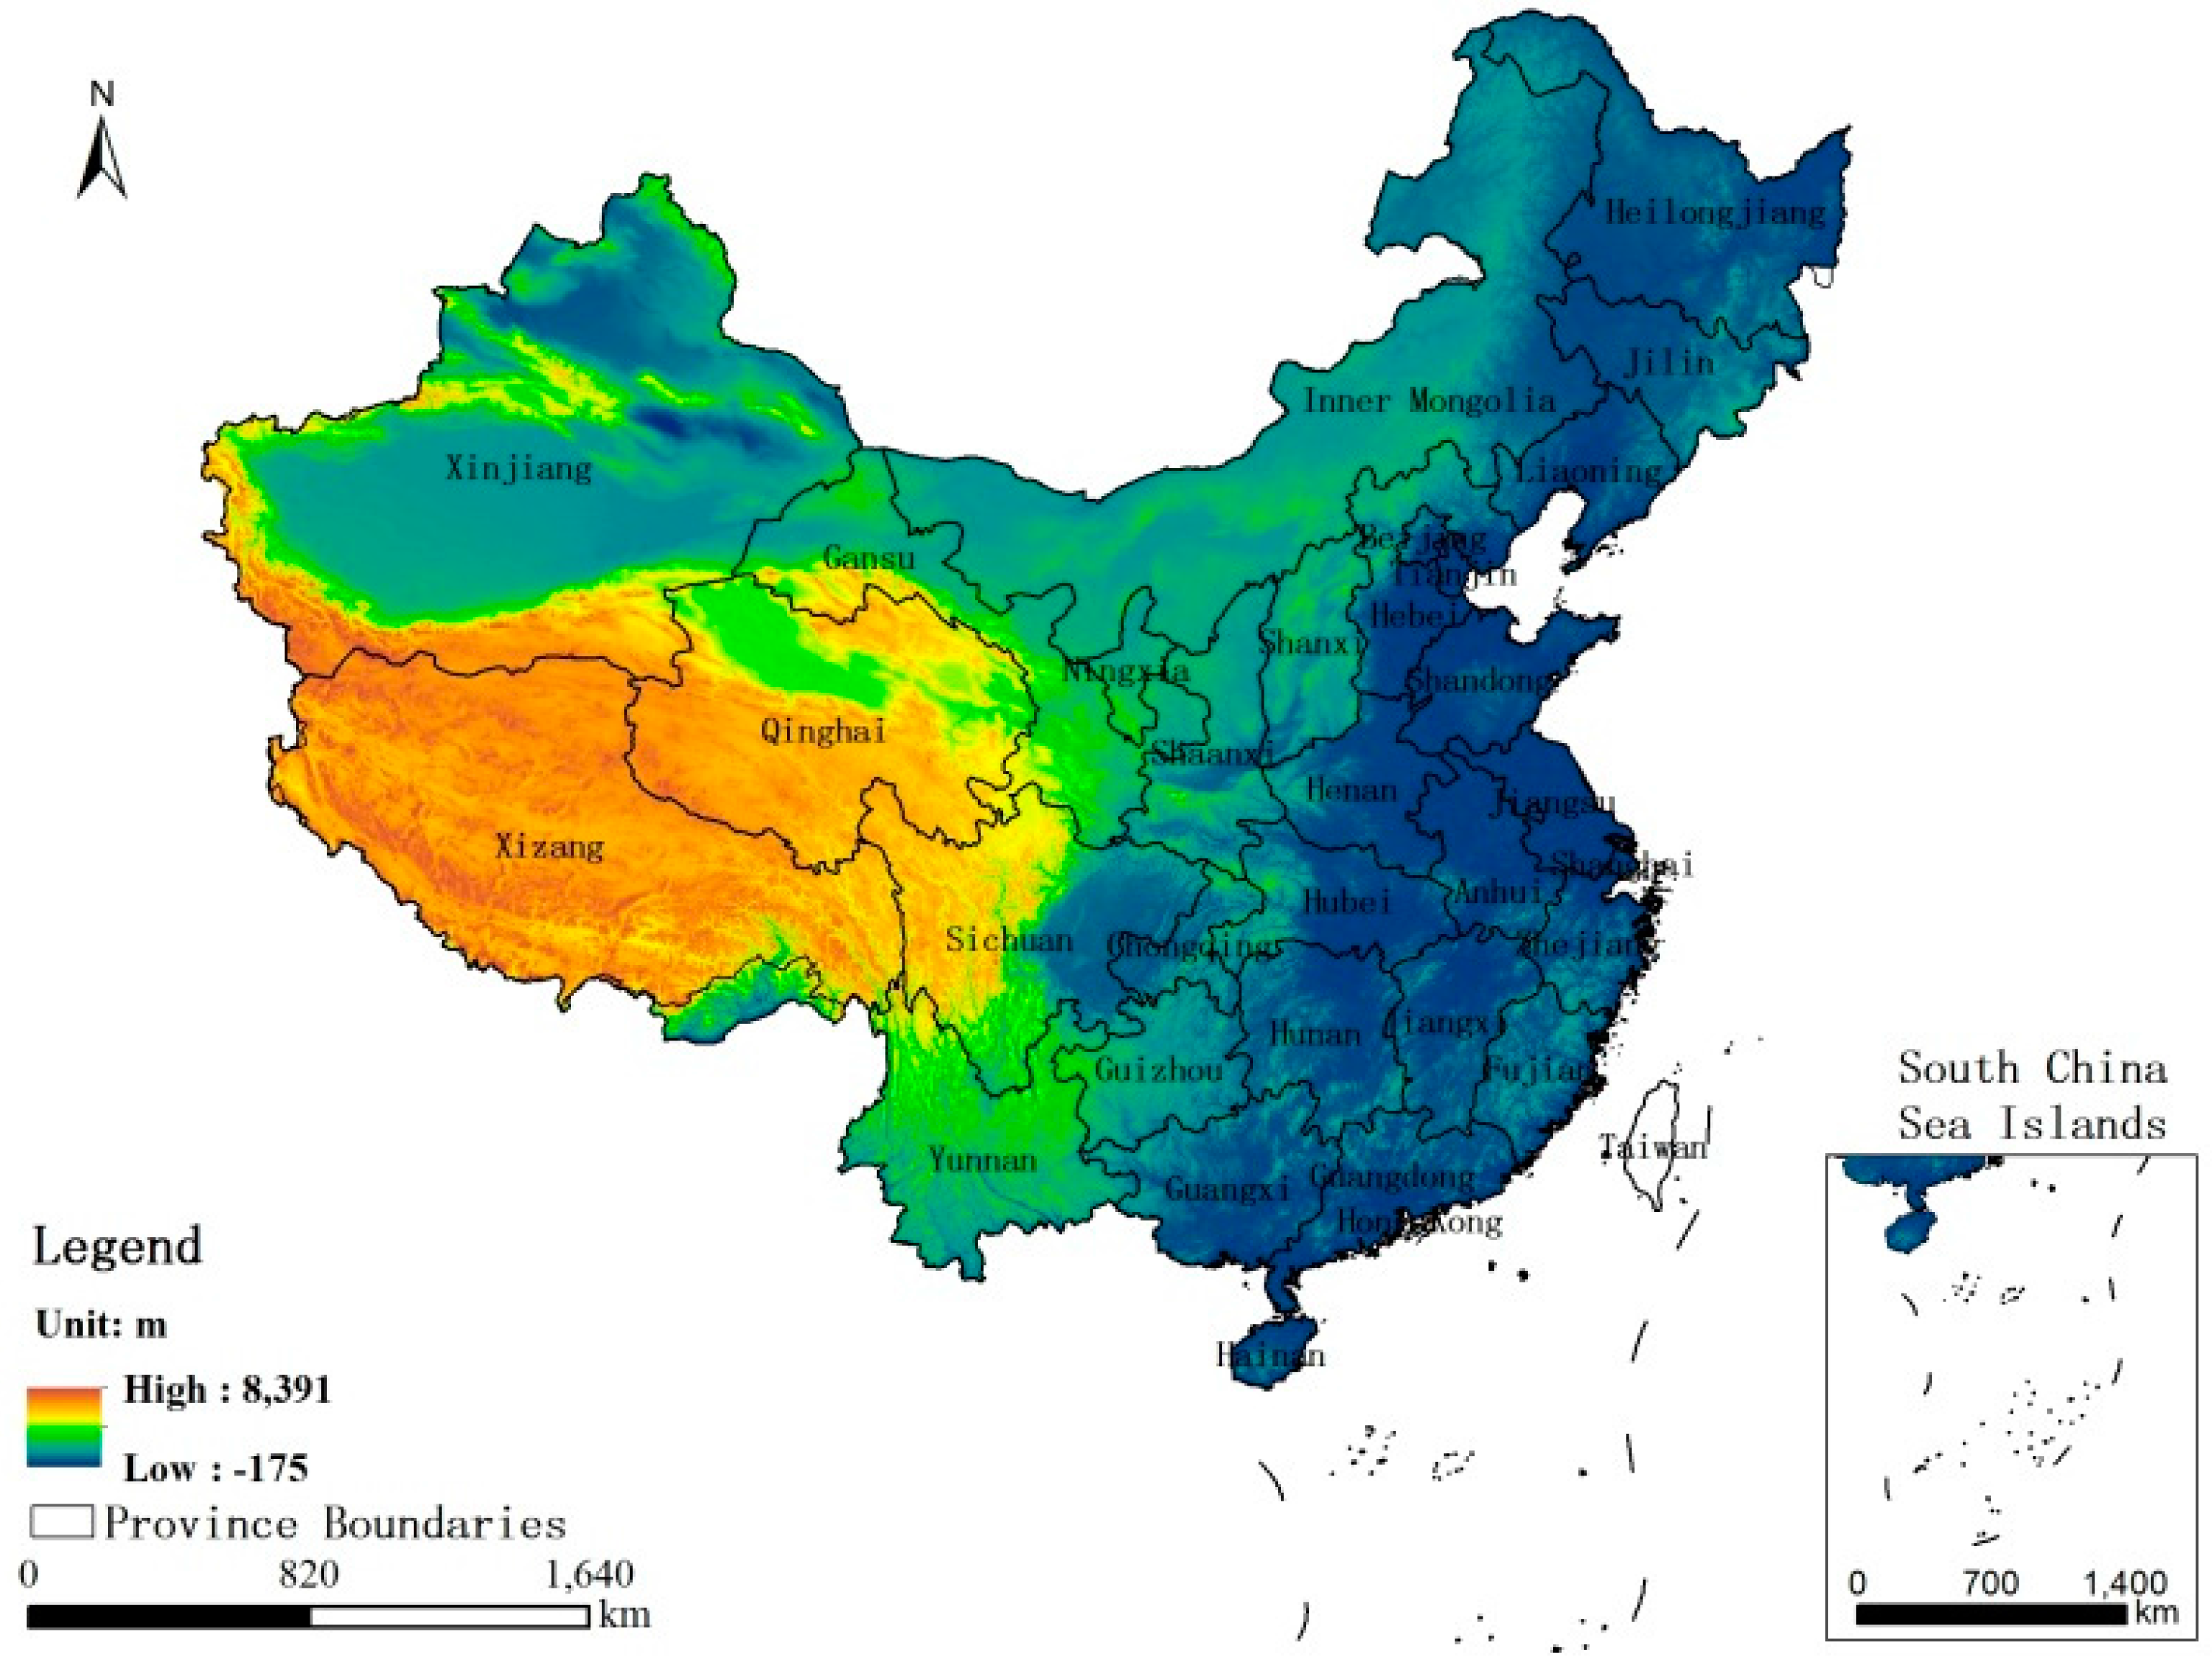
2.3. DEM Data
3. Methodology
3.1. Spatial Autocorrelation Model
3.2. GWR Model
4. Results and Analysis
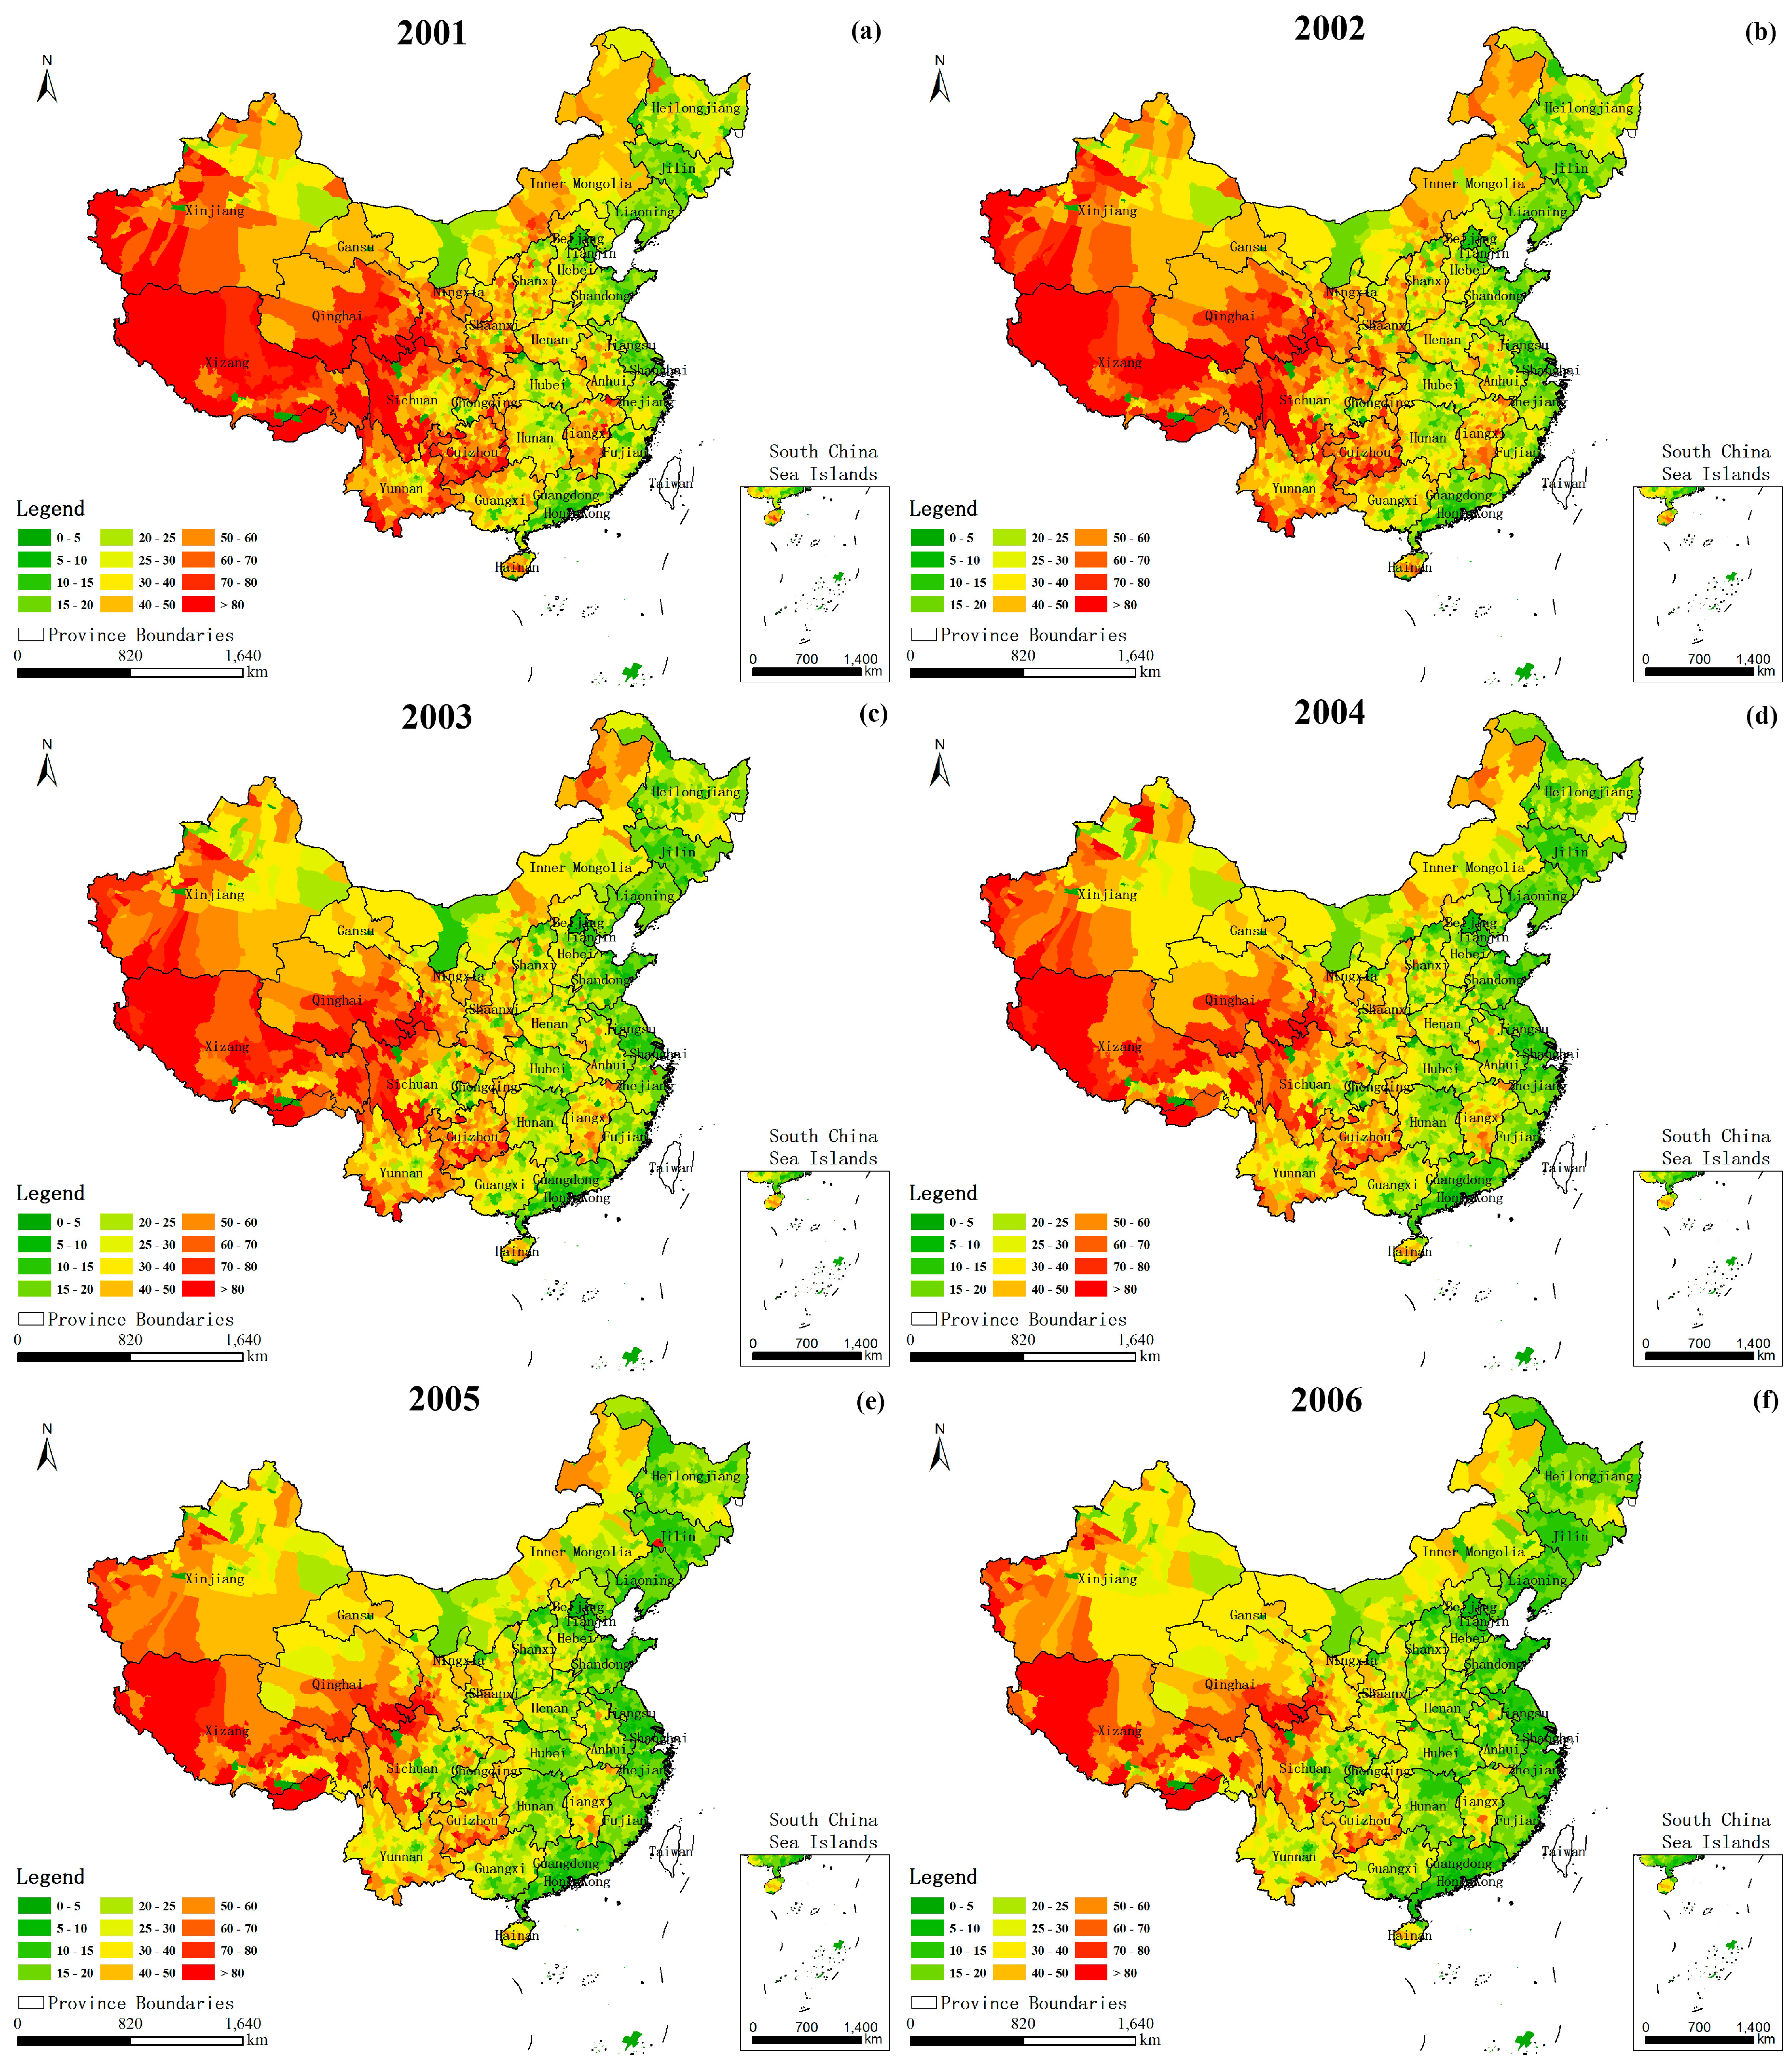
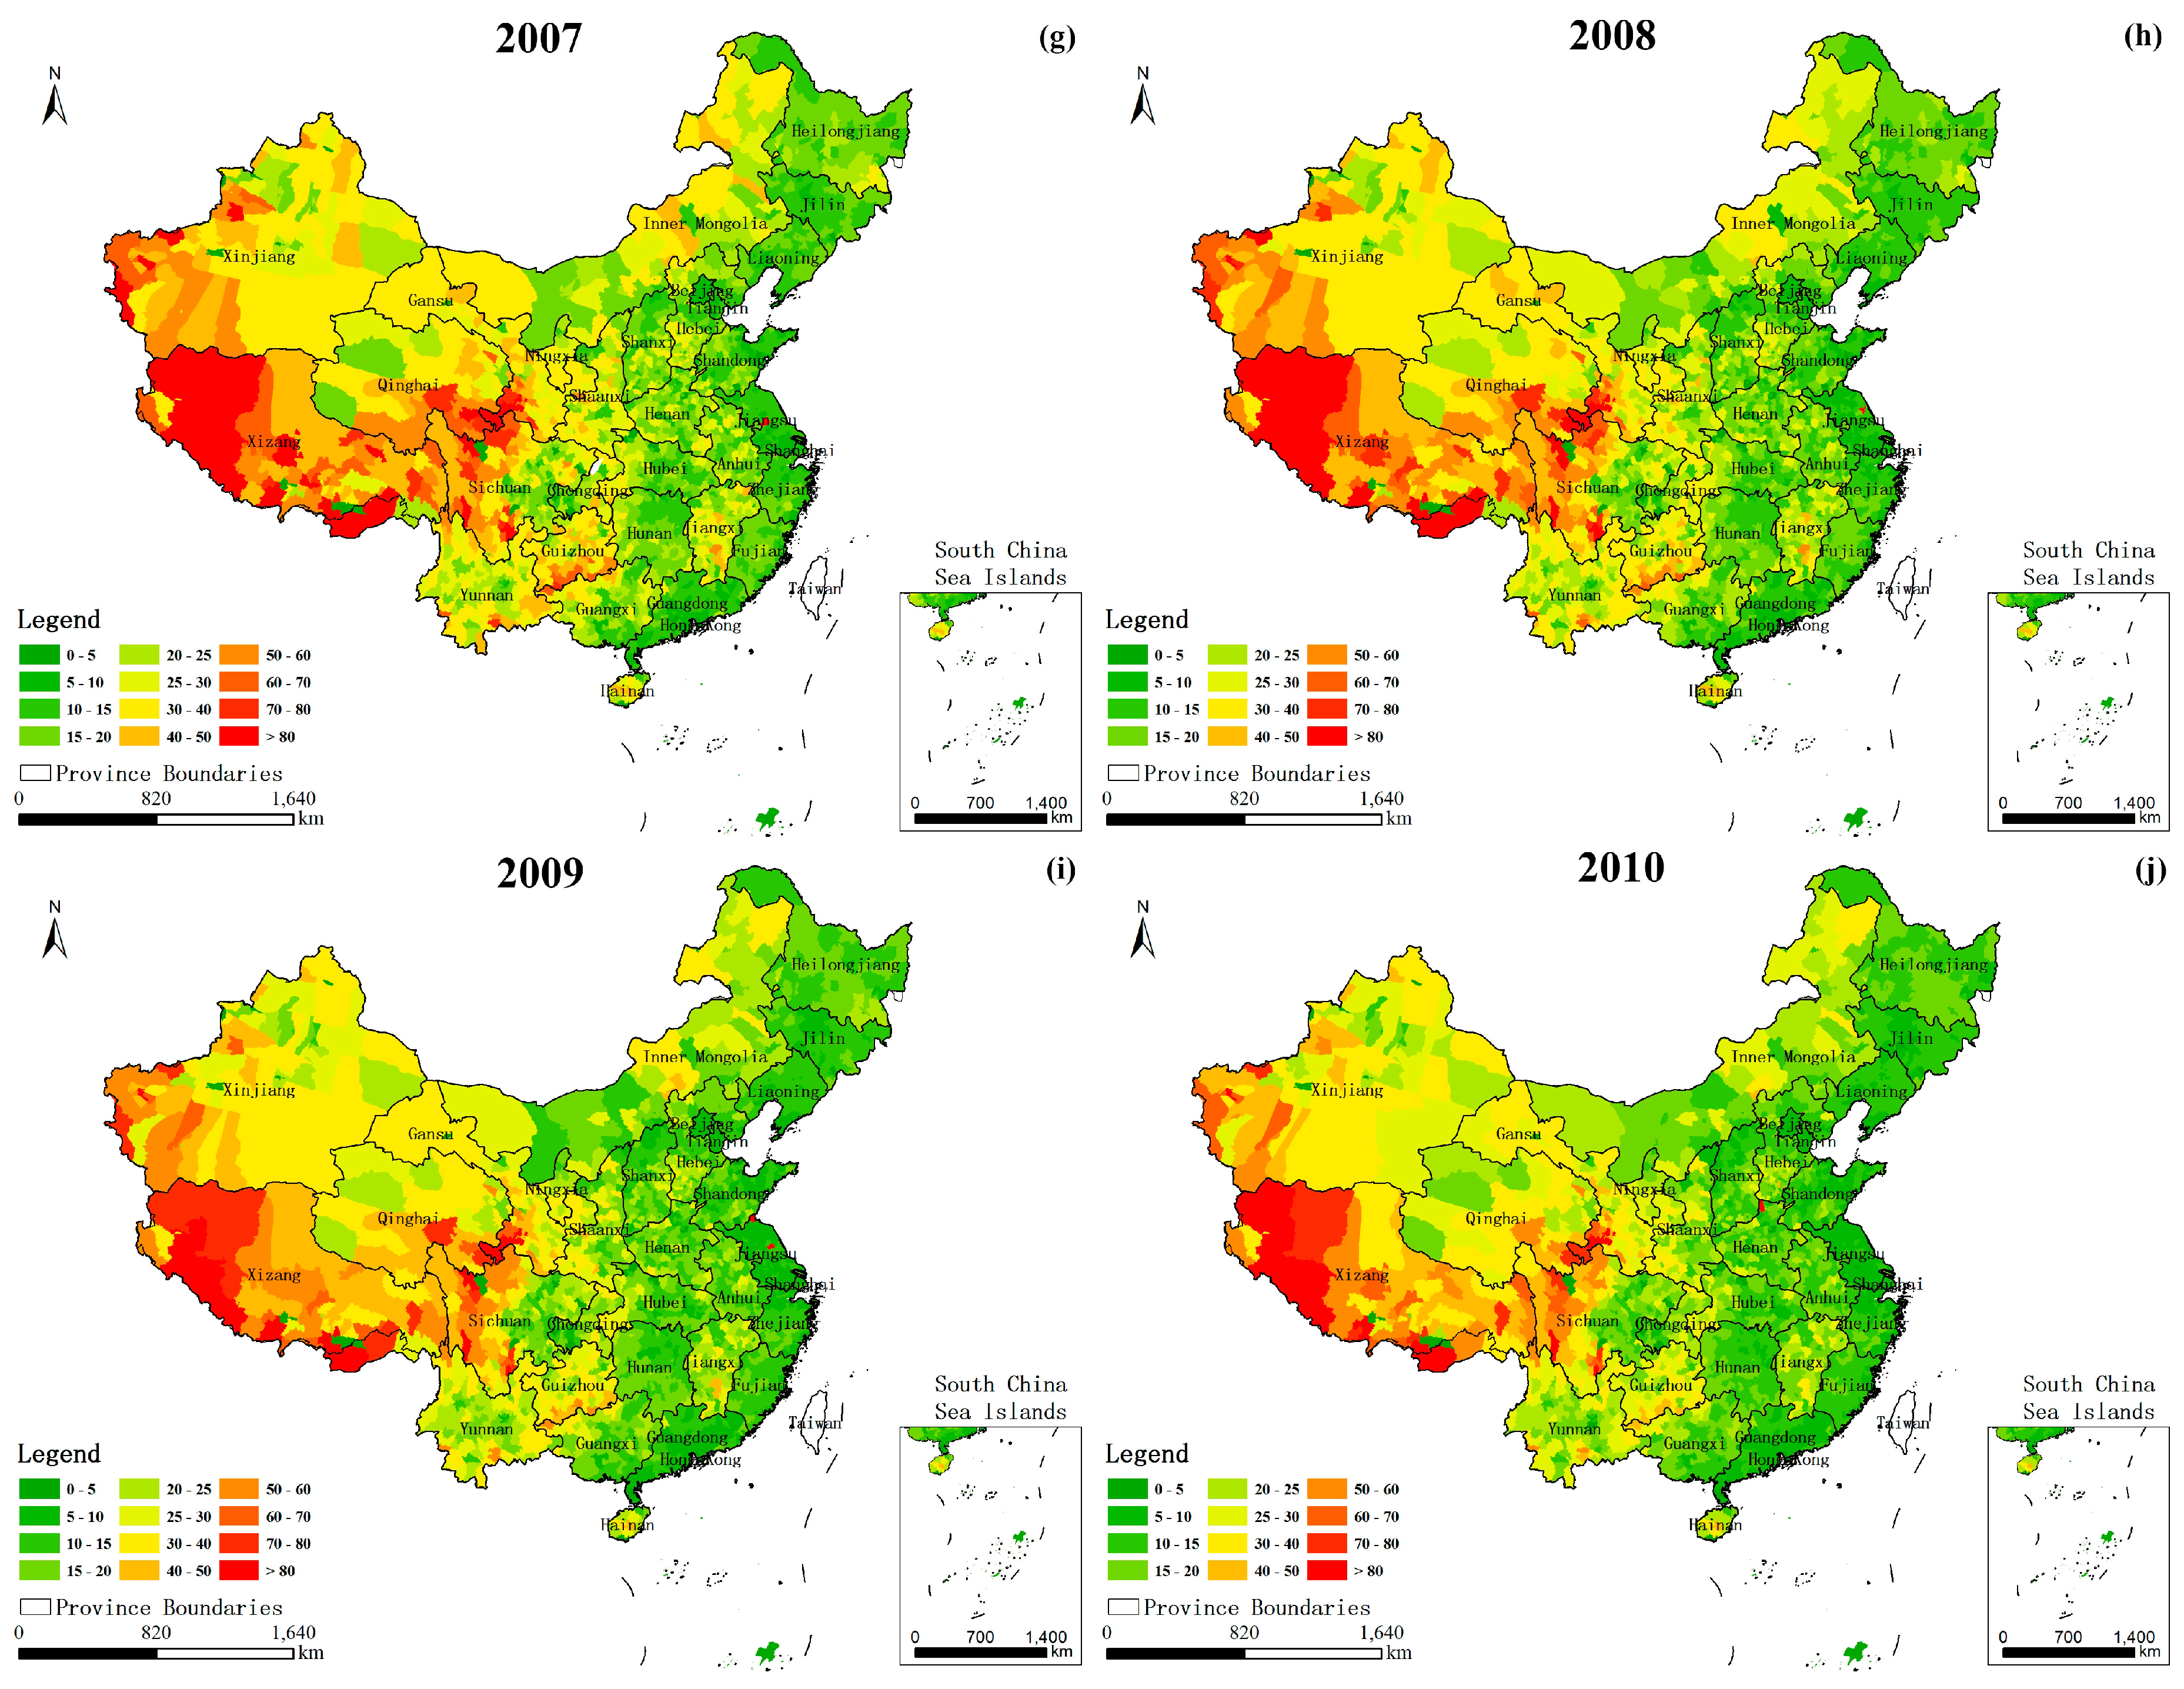
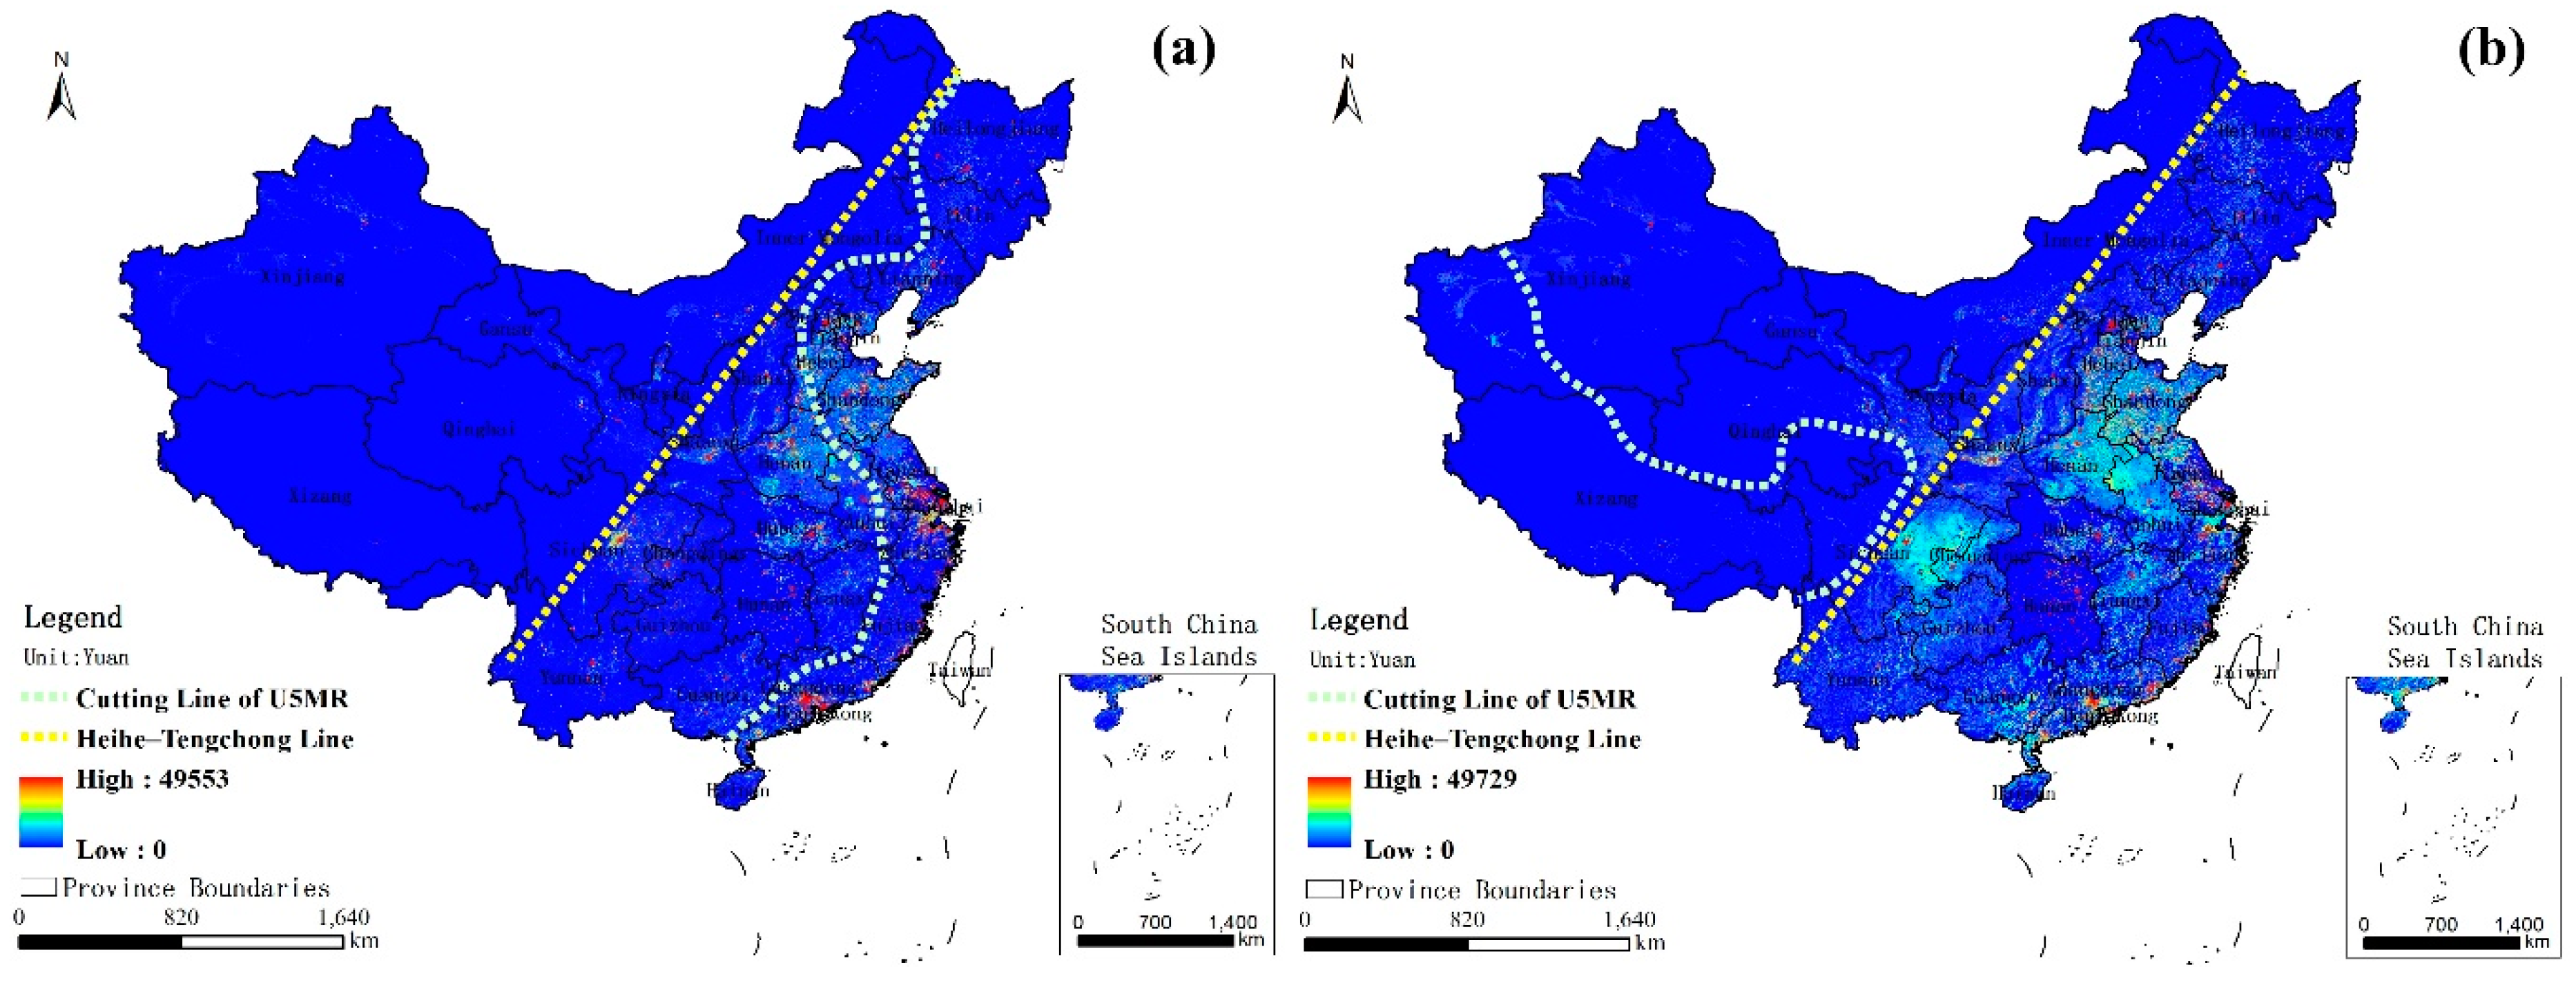
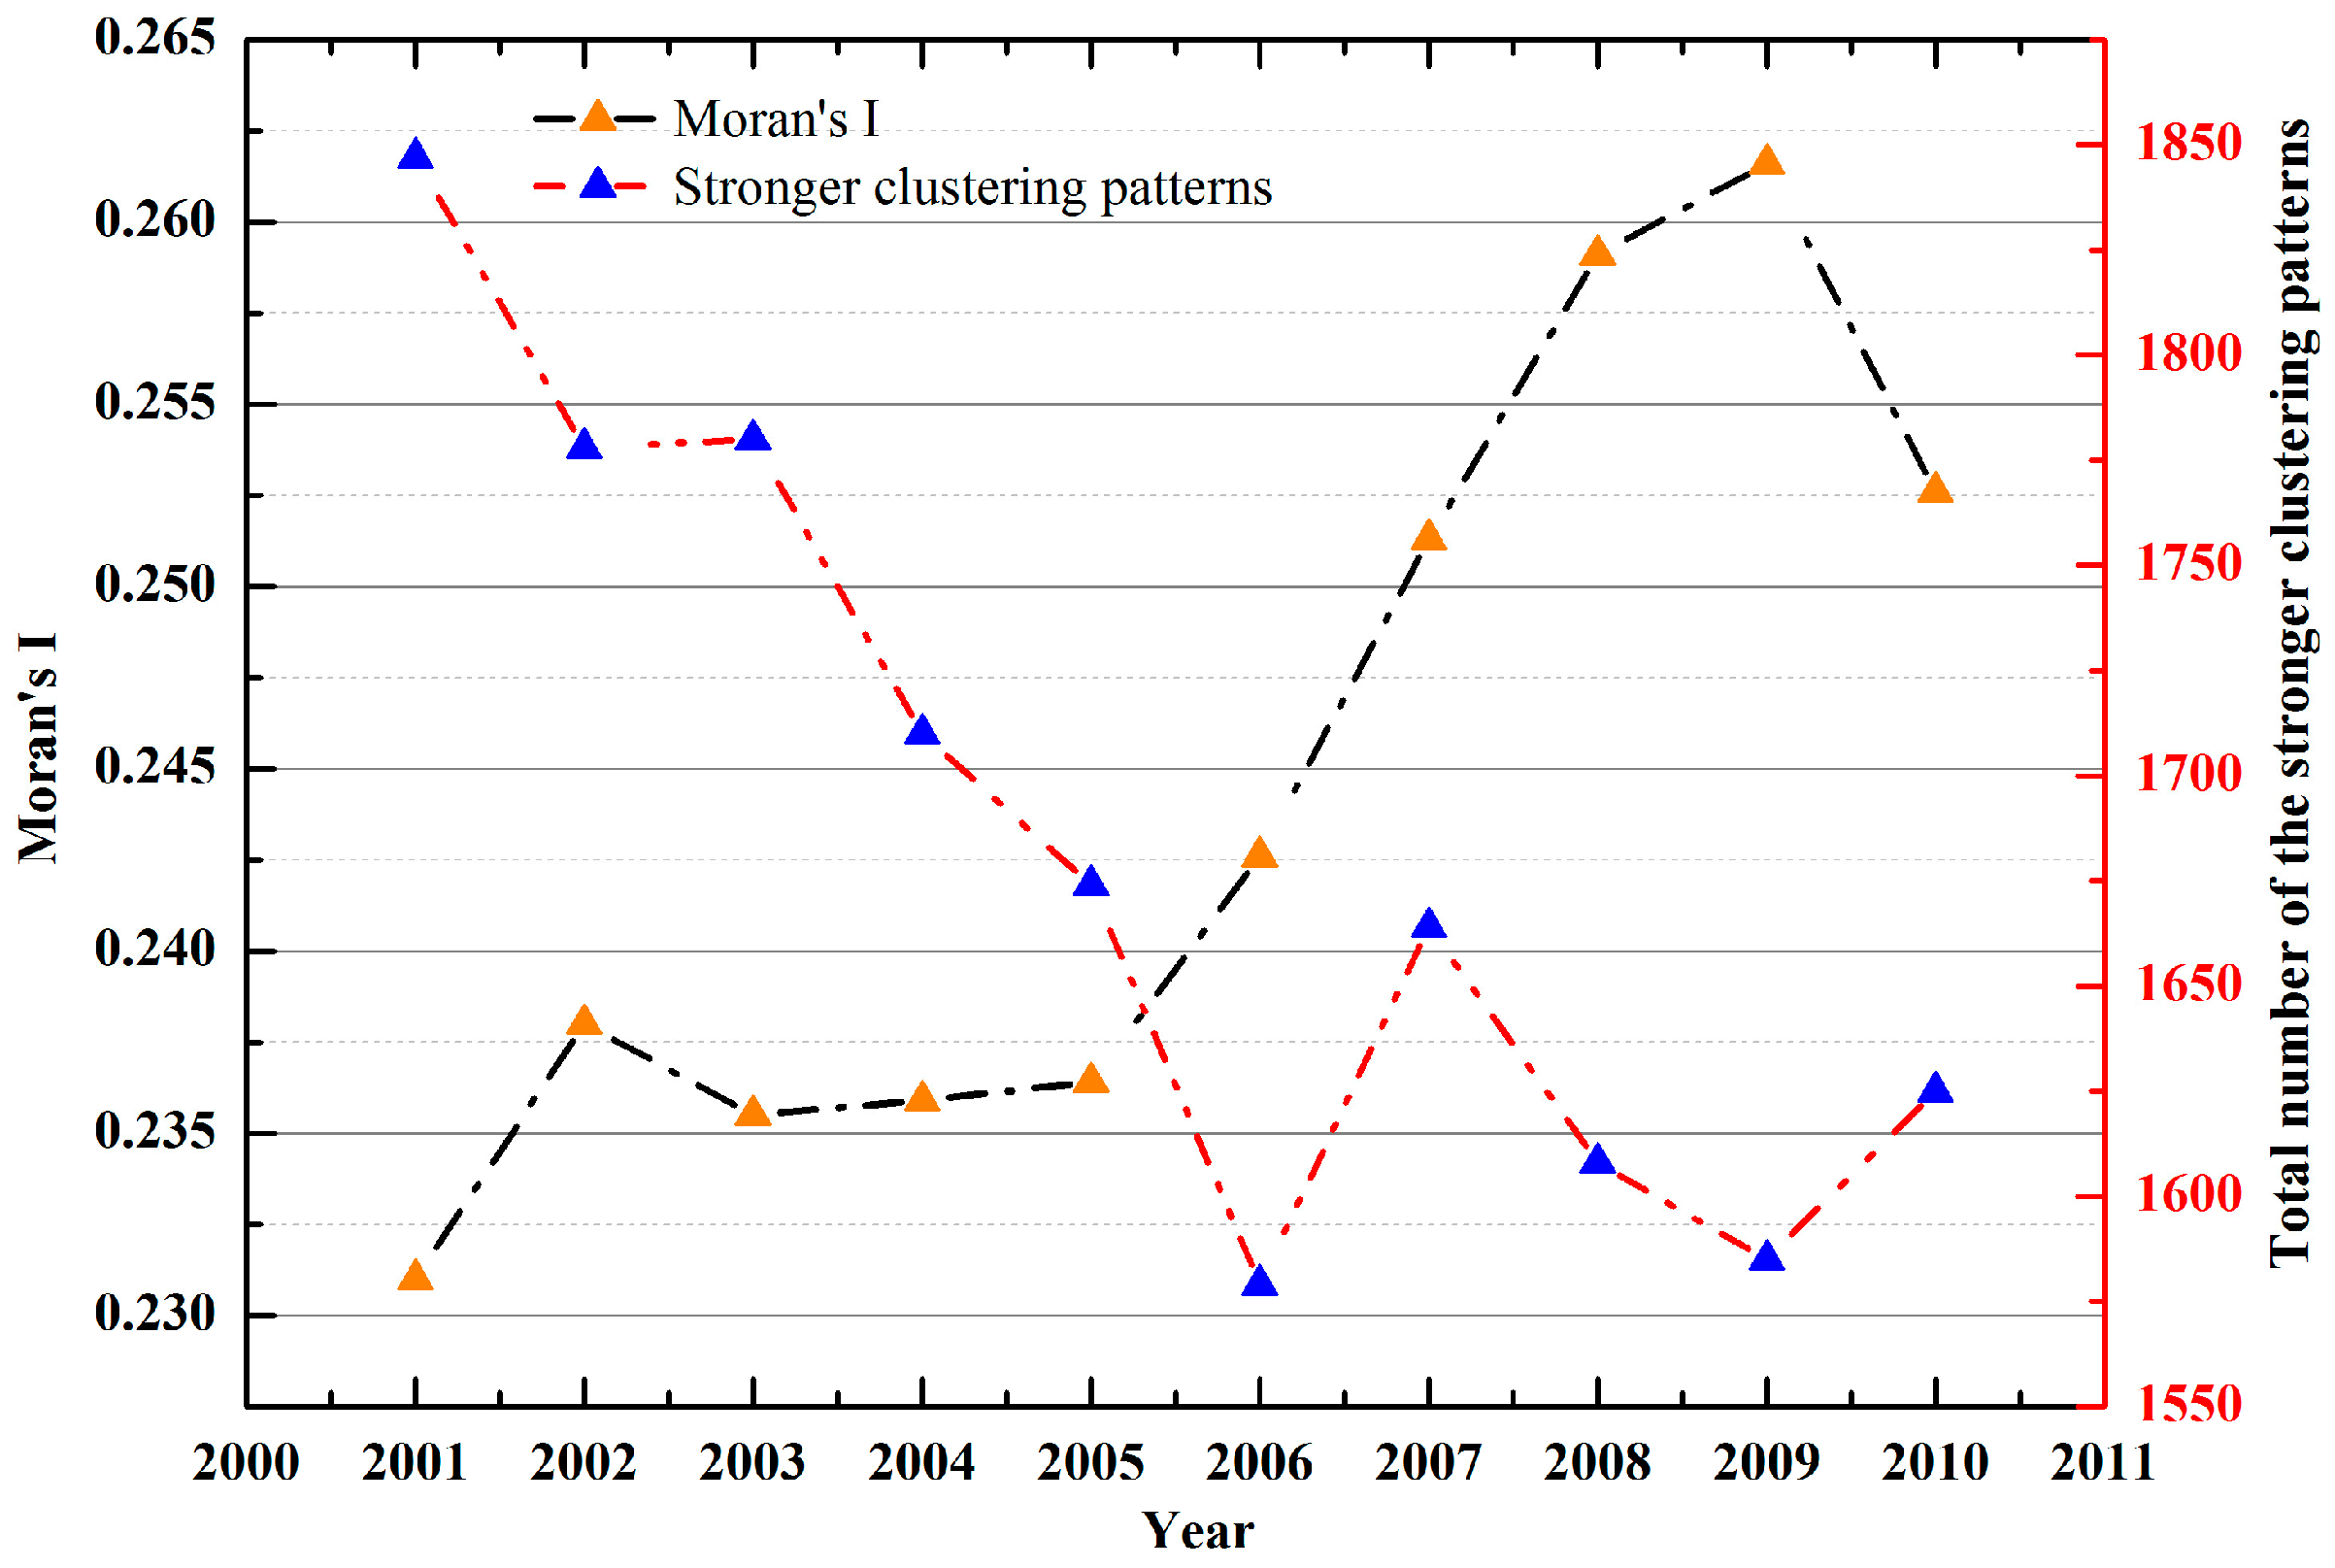
4.1. Spatiotemporal Pattern of U5MR Change Analysis
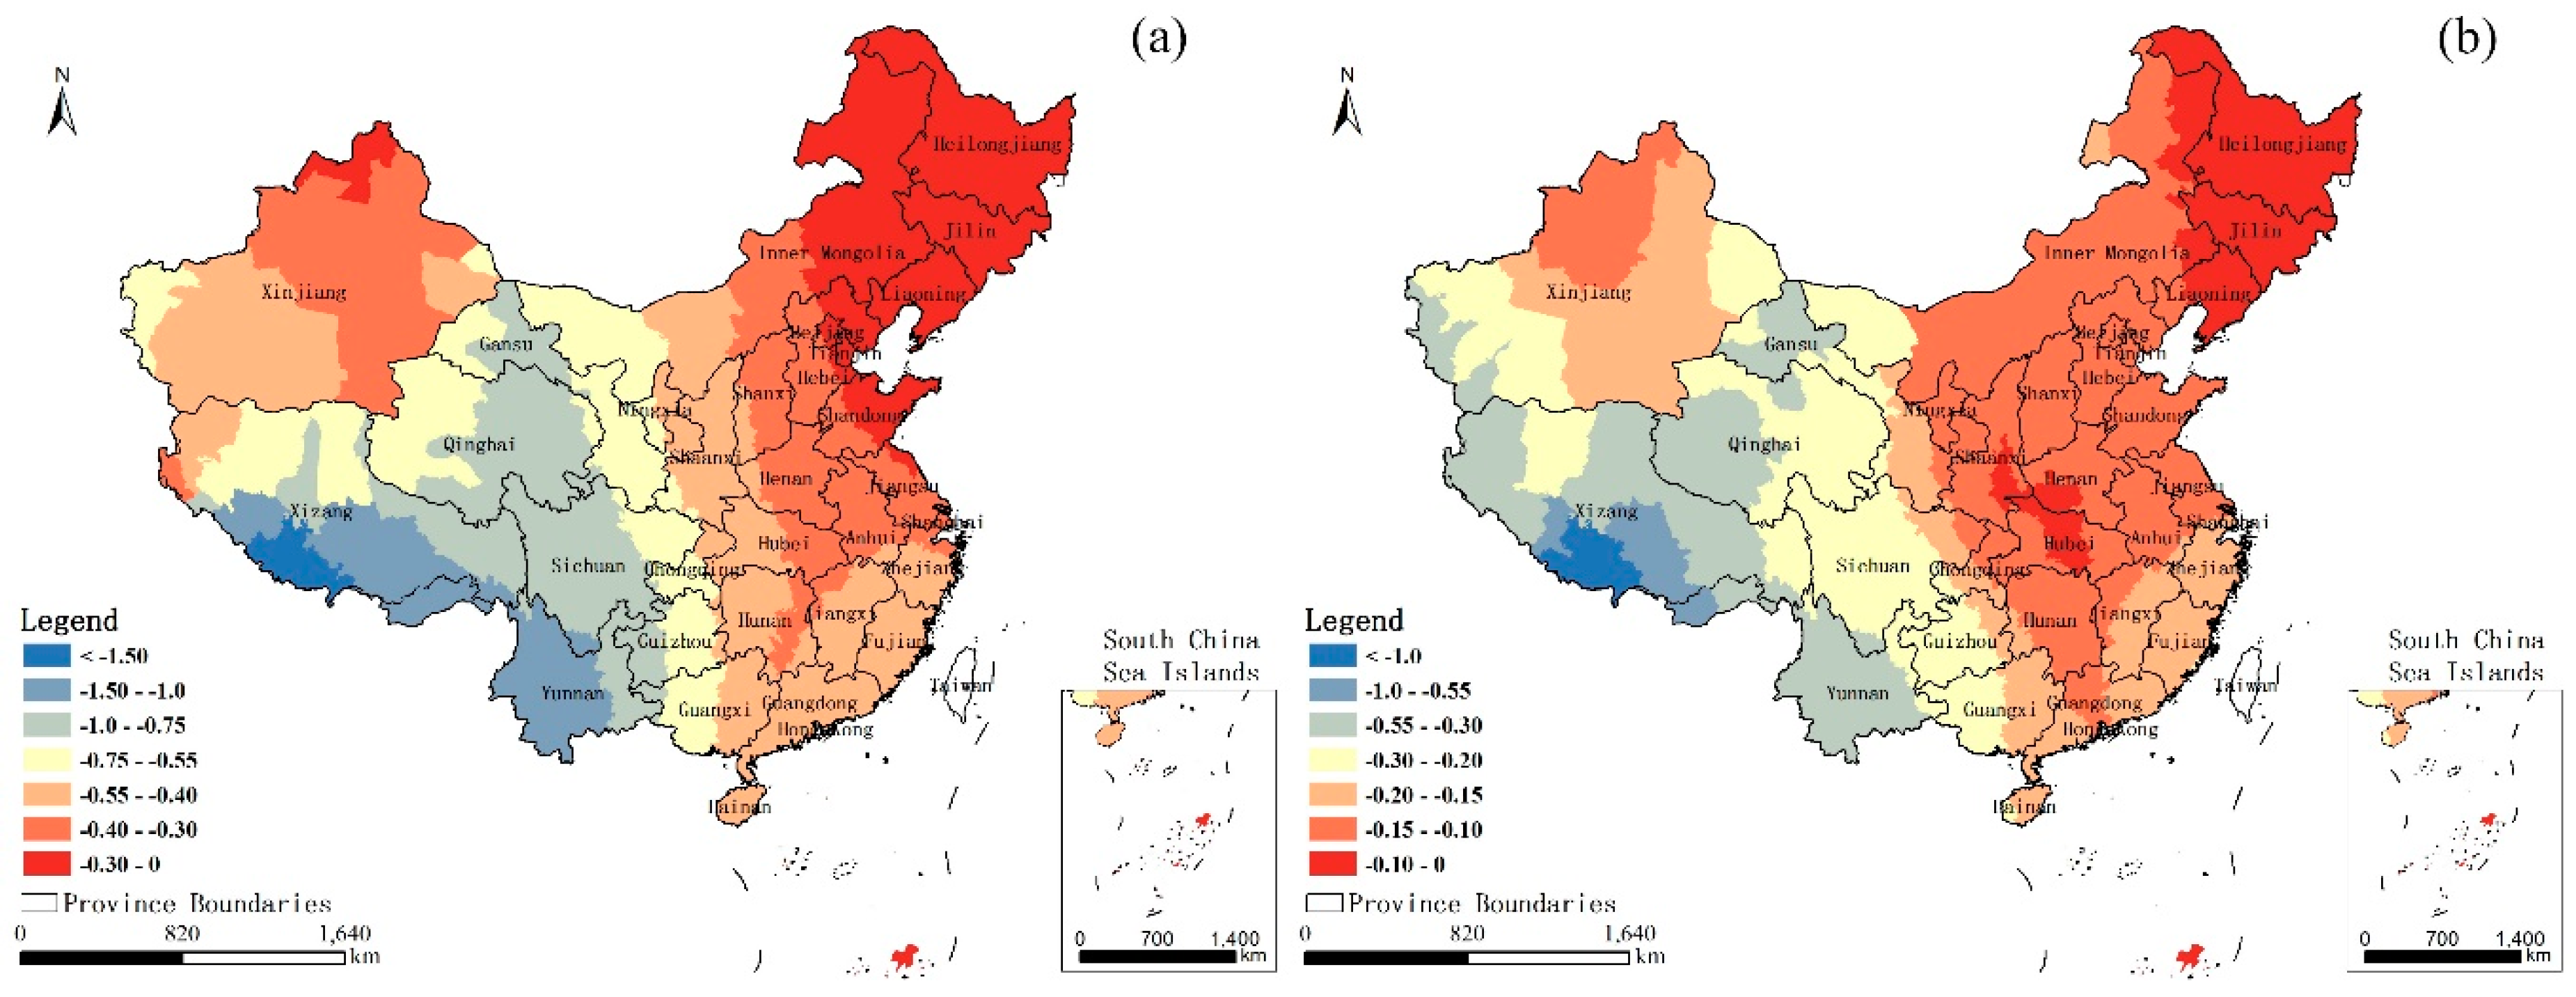
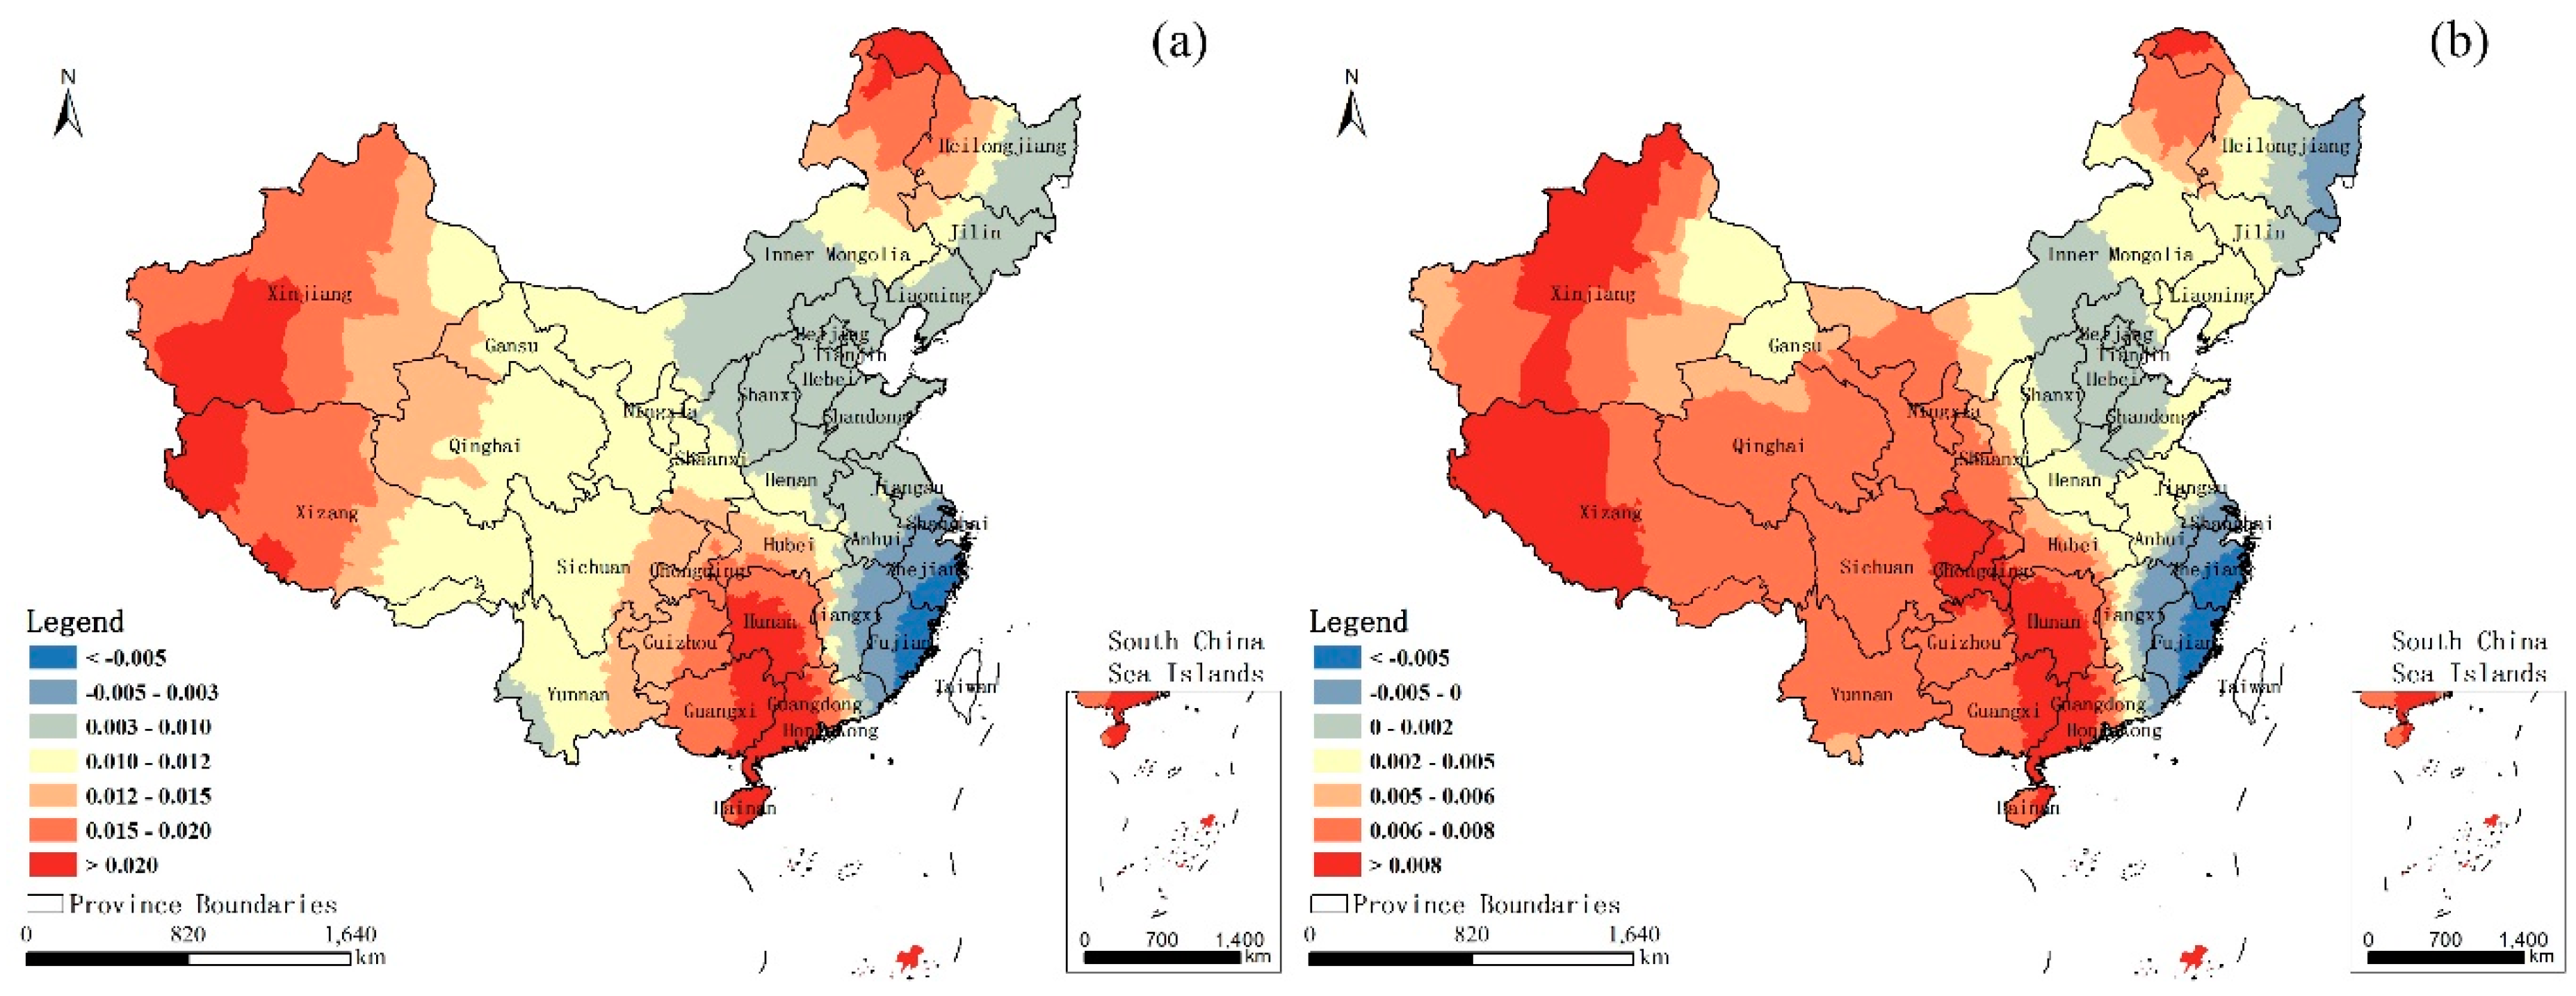
4.2. Spatial Variation of the Identified Relationship
5. Discussion
6. Conclusions
Acknowledgments
Author Contributions
Conflicts of Interest
References
- Maluleke, T.; Chola, L. Goal 4: Reduce Child Mortality. In Millennium Development; United Nations Publications: New York, NY, USA, 2015; pp. 26–28. [Google Scholar]
- Gortmaker, S.L.; Wise, P.H. The first injustice: Socioeconomic disparities, health services technology, and infant mortality. Annu. Rev. Sociol. 1997, 23, 147–170. [Google Scholar] [CrossRef] [PubMed]
- United Nations. Millennium Development Goals Report 2009 (Includes the 2009 Progress Chart); United Nations Publications: New York, NY, USA, 2009. [Google Scholar]
- Sachs, J.D. From millennium development goals to sustainable development goals. Lancet 2012, 379, 2206–2211. [Google Scholar] [CrossRef]
- Lu, Y.; Nakicenovic, N.; Visbeck, M.; Stevance, A. Policy: Five priorities for the UN sustainable development goals. Nature 2015, 520, 432–433. [Google Scholar] [CrossRef] [PubMed]
- You, D.; Hug, L.; Ejdemyr, S.; Beise, J. Levels and Trends in Child Mortality 2015; UN Inter-Agency Group for Child Mortality Estimation: Geneva, Switzerland, 2015. [Google Scholar]
- Corsi, D.J.; Subramanian, S. Association between Economic Growth, Coverage of Maternal and Child Health Interventions, and Under-five Mortality: A Repeated Cross-Sectional Analysis of 36 sub-Saharan African Countries; DHS Analytical Studies: Calverton, MA, USA, 2017. [Google Scholar]
- Wang, Y.; Li, X.; Zhou, M.; Luo, S.; Liang, J.; Liddell, C.A.; Coates, M.M.; Gao, Y.; Wang, L.; He, C. Under-5 mortality in 2851 Chinese counties, 1996–2012: A subnational assessment of achieving MDG 4 goals in China. Lancet 2016, 387, 273–283. [Google Scholar] [CrossRef]
- Wang, H.; Liddell, C.A.; Coates, M.M.; Mooney, M.D.; Levitz, C.E.; Schumacher, A.E.; Apfel, H.; Iannarone, M.; Phillips, B.; Lofgren, K.T. Global, regional, and national levels of neonatal, infant, and under-5 mortality during 1990–2013: A systematic analysis for the global burden of disease study 2013. Lancet 2014, 384, 957–979. [Google Scholar] [CrossRef]
- National Health and Family Planning Commission. China Health and Family Planning Statistics Yearbook; China Union Medical University Press: Beijing, China, 2015. [Google Scholar]
- Feng, X.L.; Theodoratou, E.; Liu, L.; Chan, K.Y.; Hipgrave, D.; Scherpbier, R.; Brixi, H.; Guo, S.; Chunmei, W.; Chopra, M. Social, economic, political and health system and program determinants of child mortality reduction in China between 1990 and 2006: A systematic analysis. J. Glob. Health 2012, 2, 010405. [Google Scholar] [PubMed]
- Wang, L. Determinants of child mortality in LDCS: Empirical findings from demographic and health surveys. Health Policy 2003, 65, 277–299. [Google Scholar] [CrossRef]
- Gakidou, E.; Cowling, K.; Lozano, R.; Murray, C.J. Increased educational attainment and its effect on child mortality in 175 countries between 1970 and 2009: A systematic analysis. Lancet 2010, 376, 959–974. [Google Scholar] [CrossRef]
- Wang, Y.P.; Miao, L.; Dai, L.; Zhou, G.X.; He, C.H.; Li, X.H.; Li, Q.; Li, M.R.; Zhu, J.; Liang, J. Mortality rate for children under 5 years of age in China from 1996 to 2006. Public Health 2011, 125, 301–307. [Google Scholar] [CrossRef] [PubMed]
- Andrews, K.M.; Brouillette, D.B.; Brouillette, R.T. Mortality, Infant. In Encyclopedia of Infant and Early Childhood Development; Benson, J.B., Ed.; Academic Press: San Diego, CA, USA, 2008; pp. 343–359. [Google Scholar]
- Jorgenson, A.K. Global inequality, water pollution, and infant mortality. Soc. Sci. J. 2004, 41, 279–288. [Google Scholar] [CrossRef]
- Fu, J.; Dong, J.; Lin, G.; Liu, K.; Wang, Q. An ecological analysis of PM2.5 concentrations and lung cancer mortality rates in China. BMJ Open 2015, 5, e009452. [Google Scholar] [CrossRef] [PubMed]
- World Health Organization. Air Quality Guidelines: Global Update 2005. Particulate Matter, Ozone, Nitrogen Dioxide and Sulfur Dioxide; World Health Organization: Geneva, Switzerland, 2006. [Google Scholar]
- Benjamin, D.K. Air pollution and infant mortality. Prop. Environ. Res. Center Rep. 2006, 24, 4. [Google Scholar]
- Yang, P.D.; Han, S.H.; Zhu, Y.L.; Dan, Y.P.; Ye, Z.Y.; Liu, F.; Sun, J.; Ji, H.X.; Han, J.; Zhu, C.S. Research on relationship between family geographic environment and the death of children of different gender under 5 years old. Chin. J. Child Health Care 2014, 22, 1337–1339. (In Chinese) [Google Scholar]
- Basihos, S. Nightlights as a Development Indicator: The Estimation of Gross Provincial Product (GPP) in Turkey. Available online: https://ssrn.com/abstract=2885518 (accessed on 9 November 2017).
- Townsend, A.C.; Bruce, D.A. The use of night-time lights satellite imagery as a measure of Australia’s regional electricity consumption and population distribution. Int. J. Remote Sens. 2010, 31, 4459–4480. [Google Scholar] [CrossRef]
- Zhuo, L.; Ichinose, T.; Zheng, J.; Chen, J.; Shi, P.; Li, X. Modelling the population density of China at the pixel level based on DMSP/OLS non-radiance-calibrated night-time light images. Int. J. Remote Sens. 2009, 30, 1003–1018. [Google Scholar] [CrossRef]
- Chand, T.K.; Badarinath, K.; Elvidge, C.; Tuttle, B. Spatial characterization of electrical power consumption patterns over India using temporal DMSP-OLS night-time satellite data. Int. J. Remote Sens. 2009, 30, 647–661. [Google Scholar] [CrossRef]
- Sutton, P.C. A scale-adjusted measure of “urban sprawl” using nighttime satellite imagery. Remote Sens. Environ. 2003, 86, 353–369. [Google Scholar] [CrossRef]
- Doll, C.H.; Muller, J.-P.; Elvidge, C.D. Night-time imagery as a tool for global mapping of socioeconomic parameters and greenhouse gas emissions. AMBIO: J. Hum. Environ. 2000, 29, 157–162. [Google Scholar] [CrossRef]
- Version 4 DMSP-OLS Nighttime Lights Time Series. Available online: https://ngdc.Noaa.Gov/eog/dmsp/downloadv4composites.Html (accessed on 9 November 2017).
- Clarke, K.C.; Hoppen, S.; Gaydos, L. A self-modifying cellular automaton model of historical urbanization in the San Francisco bay area. Environ. Plan. B: Plan. Des. 1997, 24, 247–261. [Google Scholar] [CrossRef]
- Khromykh, V.; Khromykh, O. Analysis of spatial structure and dynamics of Tom Valley Landscapes based on GIS, digital elevation model and remote sensing. Procedia-Soc. Behav. Sci. 2014, 120, 811–815. [Google Scholar] [CrossRef]
- Bhatt, G.; Sinha, K.; Deka, P.; Kumar, A. Flood hazard and risk assessment in Chamoli District, Uttarakhand using satellite remote sensing and GIS techniques. Int. J. Innov. Res. Sci. Eng. Technol. 2014, 3, 9. [Google Scholar] [CrossRef]
- Ding, F.; Ge, Q.; Jiang, D.; Fu, J.; Hao, M. Understanding the dynamics of terrorism events with multiple-discipline datasets and machine learning approach. PLoS ONE 2017, 12, e0179057. [Google Scholar] [CrossRef] [PubMed]
- Pérez-Cutillas, P.; Goyena, E.; Chitimia, L.; De la Rúa, P.; Bernal, L.; Fisa, R.; Riera, C.; Iborra, A.; Murcia, L.; Segovia, M. Spatial distribution of human asymptomatic Leishmania infantum infection in southeast Spain: A study of environmental, demographic and social risk factors. Acta Trop. 2015, 146, 127–134. [Google Scholar] [CrossRef] [PubMed]
- Legendre, P. Spatial autocorrelation: Trouble or new paradigm? Ecology 1993, 74, 1659–1673. [Google Scholar] [CrossRef]
- Liu, Y.; Lu, S.; Chen, Y. Spatio-temporal change of urban–rural equalized development patterns in China and its driving factors. J. Rural Study 2013, 32, 320–330. [Google Scholar] [CrossRef]
- Uthman, O.A. Spatial and temporal variations in incidence of tuberculosis in Africa, 1991 to 2005. World Health Popul. 2007, 10, 5–15. [Google Scholar] [CrossRef]
- Li, H.; Calder, C.A.; Cressie, N. Beyond Moran’s I: Testing for spatial dependence based on the spatial autoregressive model. Geogr. Anal. 2007, 39, 357–375. [Google Scholar] [CrossRef]
- Fotheringham, A.S.; Charlton, M.E.; Brunsdon, C. Geographically weighted regression: A natural evolution of the expansion method for spatial data analysis. Environ. Plan. A 1998, 30, 1905–1927. [Google Scholar] [CrossRef]
- Fotheringham, A.S.; Brunsdon, C.; Charlton, M. Geographically Weighted Regression; John Wiley & Sons Ltd.: Chichester, UK, 2003. [Google Scholar]
- Wheeler, D.C. Geographically Weighted Regression. In Handbook of Regional Science; Springer: Berlin, Germany, 2014; pp. 1435–1459. [Google Scholar]
- Lin, G.; Fu, J.; Jiang, D.; Hu, W.; Dong, D.; Huang, Y.; Zhao, M. Spatio-temporal variation of PM2.5 concentrations and their relationship with geographic and socioeconomic factors in China. Int. J. Environ. Res. Public Health 2013, 11, 173–186. [Google Scholar] [CrossRef] [PubMed]
- Wang, G.; Pan, Z. The robustness of China’s migration and “Heihe-Tengchong line”. Chin. J. Popul. Sci. 2016, 1, 7–15. [Google Scholar]
- Chen, M.; Li, Y.; Gong, Y.; Lu, D.; Zhang, H. The population distribution and trend of urbanization pattern on two sides of Hu Huanyong population line: A tentative response to Premier Li Keqiang. Acta Geogr. Sin. 2016, 71, 179–193. [Google Scholar]
- Leung, Y.; Mei, C.-L.; Zhang, W.-X. Statistical tests for spatial nonstationarity based on the geographically weighted regression model. Environ. Plan. A 2000, 32, 9–32. [Google Scholar] [CrossRef]
- Lin, G.; Fu, J.; Jiang, D.; Wang, J.; Wang, Q.; Dong, D. Spatial variation of the relationship between PM2.5 concentrations and meteorological parameters in China. BioMed Res. Int. 2015, 2015, 1–15. [Google Scholar]


| Items | Temperature | Precipitation | DEM | |||
|---|---|---|---|---|---|---|
| r | p-Value | r | p-Value | r | p-Value | |
| 2001 | 0.190 | 0.000 | 0.107 | 0.000 | 0.660 | 0.000 |
| 2002 | 0.004 | 0.416 | 0.012 | 0.063 | 0.629 | 0.000 |
| 2003 | 0.091 | 0.000 | 0.104 | 0.000 | 0.673 | 0.000 |
| 2004 | 0.091 | 0.000 | 0.070 | 0.000 | 0.568 | 0.000 |
| 2005 | 0.265 | 0.000 | 0.205 | 0.000 | 0.667 | 0.000 |
| 2006 | 0.283 | 0.000 | 0.208 | 0.000 | 0.677 | 0.000 |
| 2007 | 0.002 | 0.045 | 0.014 | 0.221 | 0.612 | 0.000 |
| 2008 | 0.184 | 0.000 | 0.123 | 0.000 | 0.406 | 0.000 |
| 2009 | 0.290 | 0.000 | 0.254 | 0.000 | 0.699 | 0.000 |
| 2010 | 0.280 | 0.000 | 0.222 | 0.000 | 0.688 | 0.000 |
© 2017 by the authors. Licensee MDPI, Basel, Switzerland. This article is an open access article distributed under the terms and conditions of the Creative Commons Attribution (CC BY) license (http://creativecommons.org/licenses/by/4.0/).
Share and Cite
Li, Z.; Fu, J.; Jiang, D.; Lin, G.; Dong, D.; Yan, X. Spatiotemporal Distribution of U5MR and Their Relationship with Geographic and Socioeconomic Factors in China. Int. J. Environ. Res. Public Health 2017, 14, 1428. https://doi.org/10.3390/ijerph14111428
Li Z, Fu J, Jiang D, Lin G, Dong D, Yan X. Spatiotemporal Distribution of U5MR and Their Relationship with Geographic and Socioeconomic Factors in China. International Journal of Environmental Research and Public Health. 2017; 14(11):1428. https://doi.org/10.3390/ijerph14111428
Chicago/Turabian StyleLi, Zeng, Jingying Fu, Dong Jiang, Gang Lin, Donglin Dong, and Xiaoxi Yan. 2017. "Spatiotemporal Distribution of U5MR and Their Relationship with Geographic and Socioeconomic Factors in China" International Journal of Environmental Research and Public Health 14, no. 11: 1428. https://doi.org/10.3390/ijerph14111428