Relationships between Vacant Homes and Food Swamps: A Longitudinal Study of an Urban Food Environment

Abstract
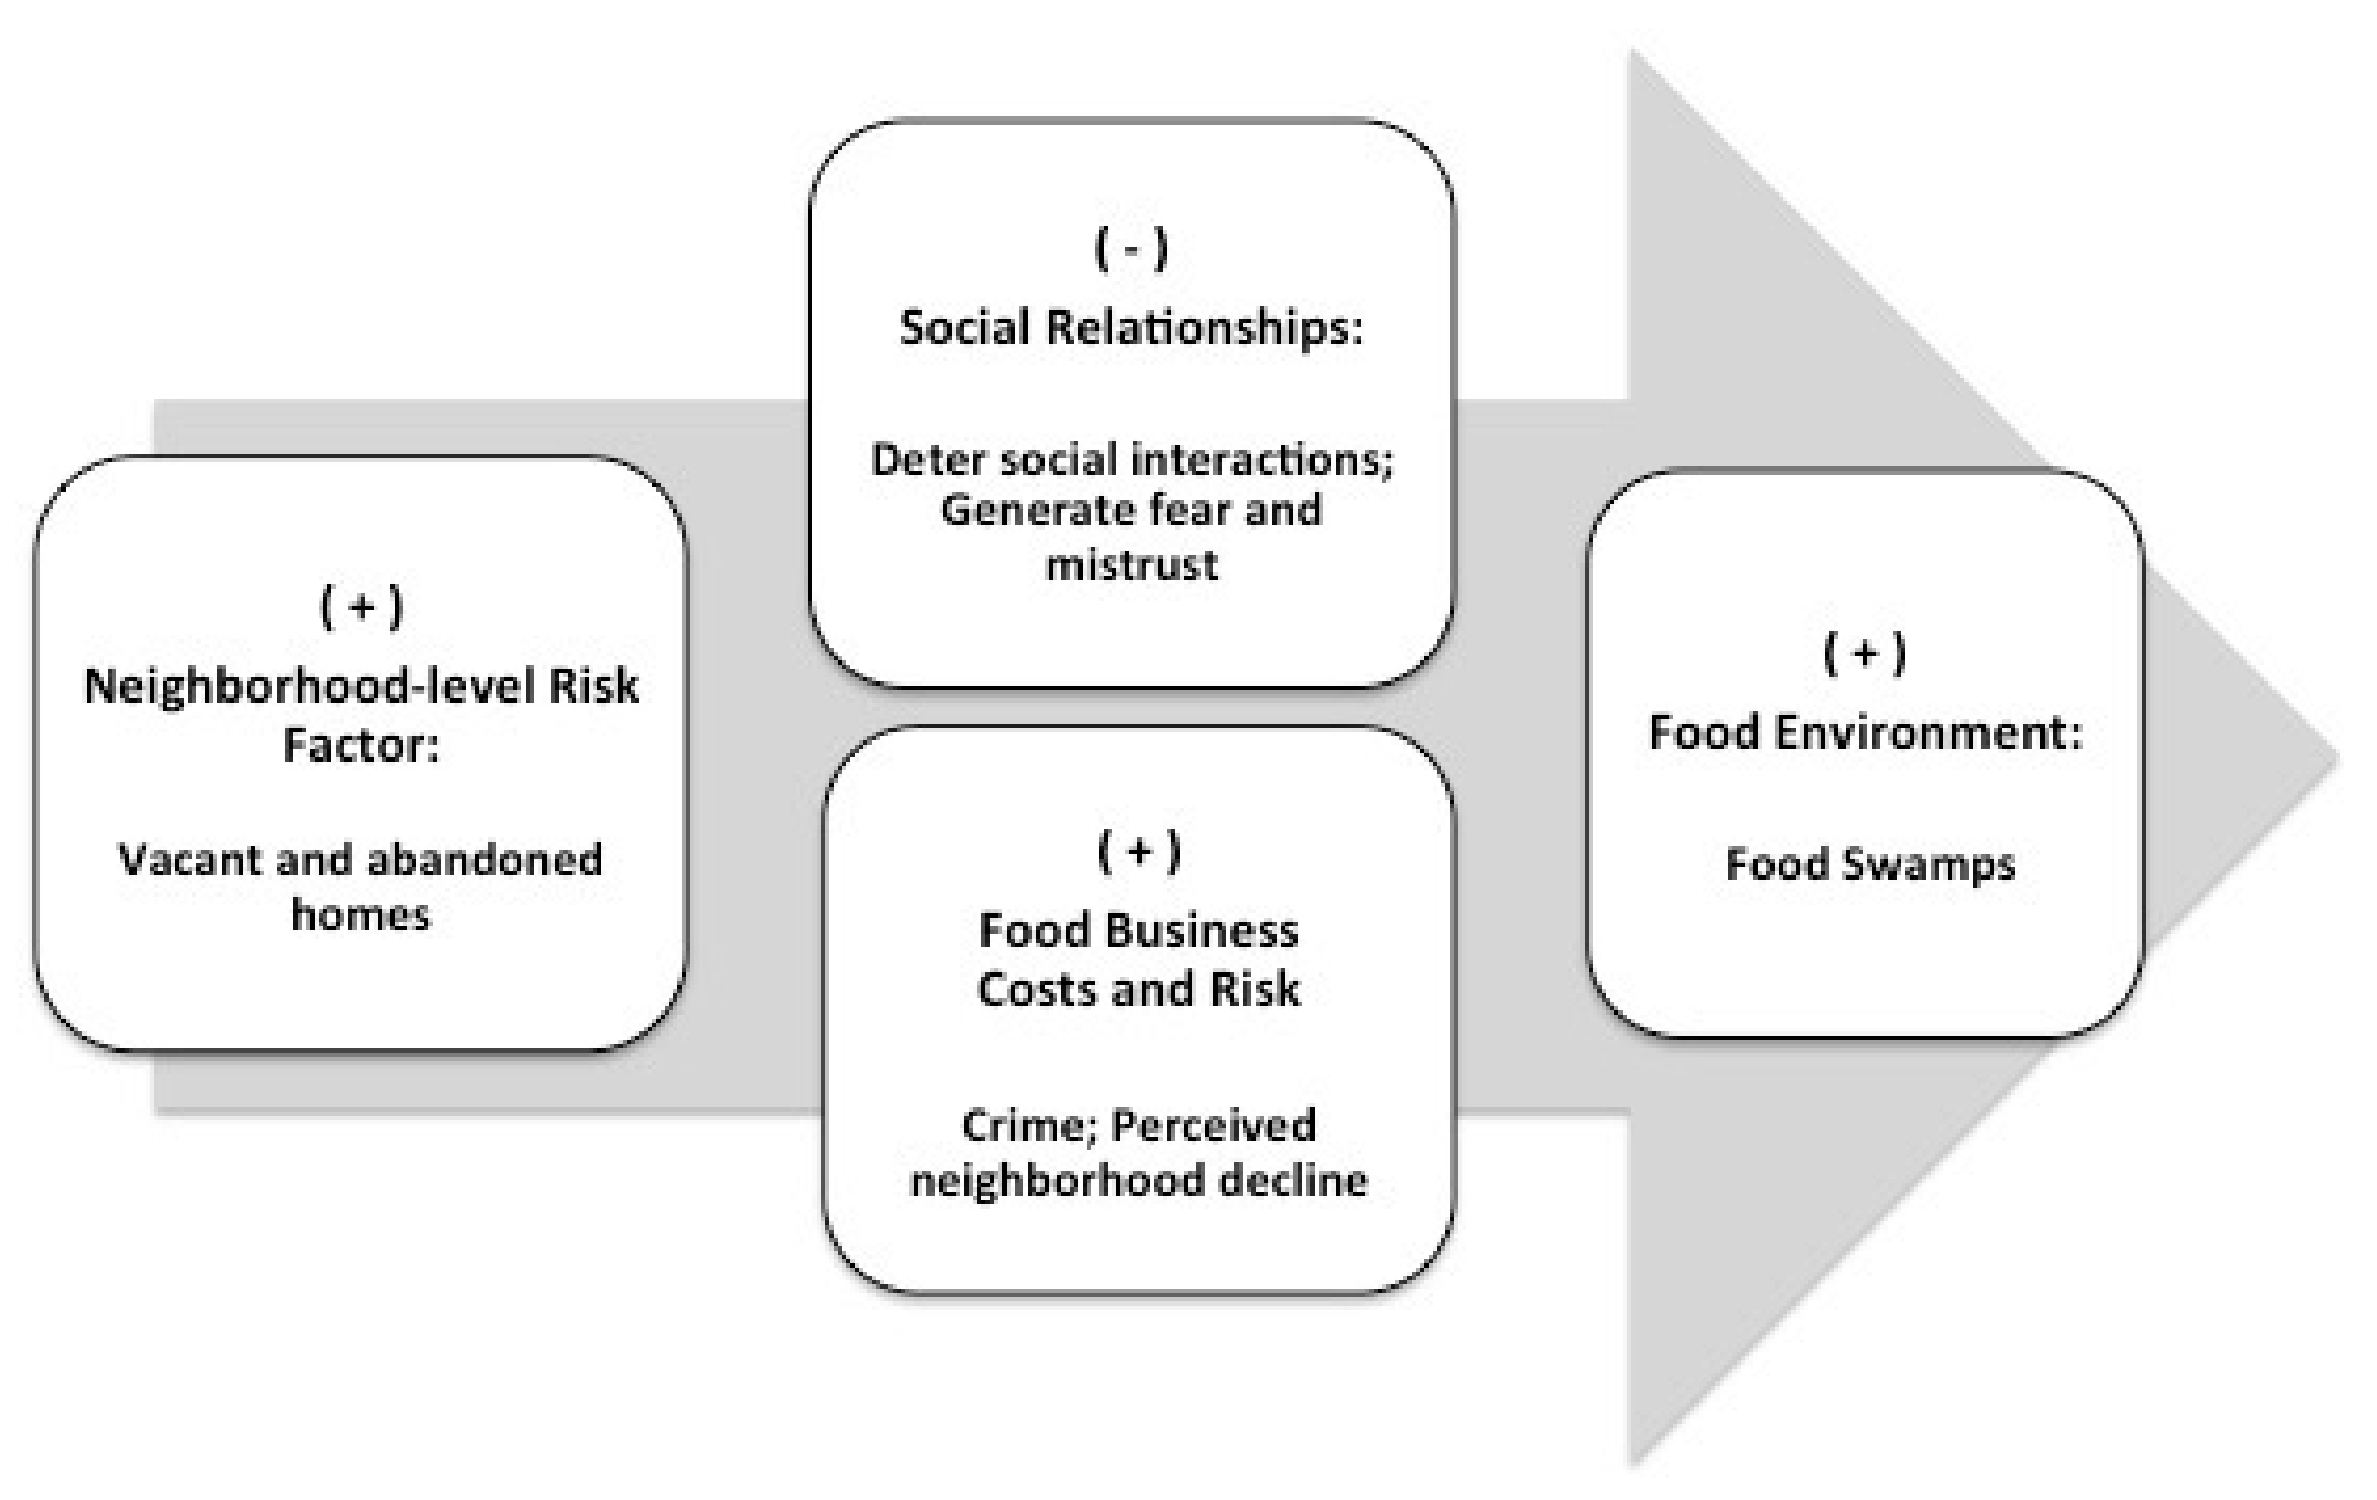
:1. Introduction
2. Materials and Methods
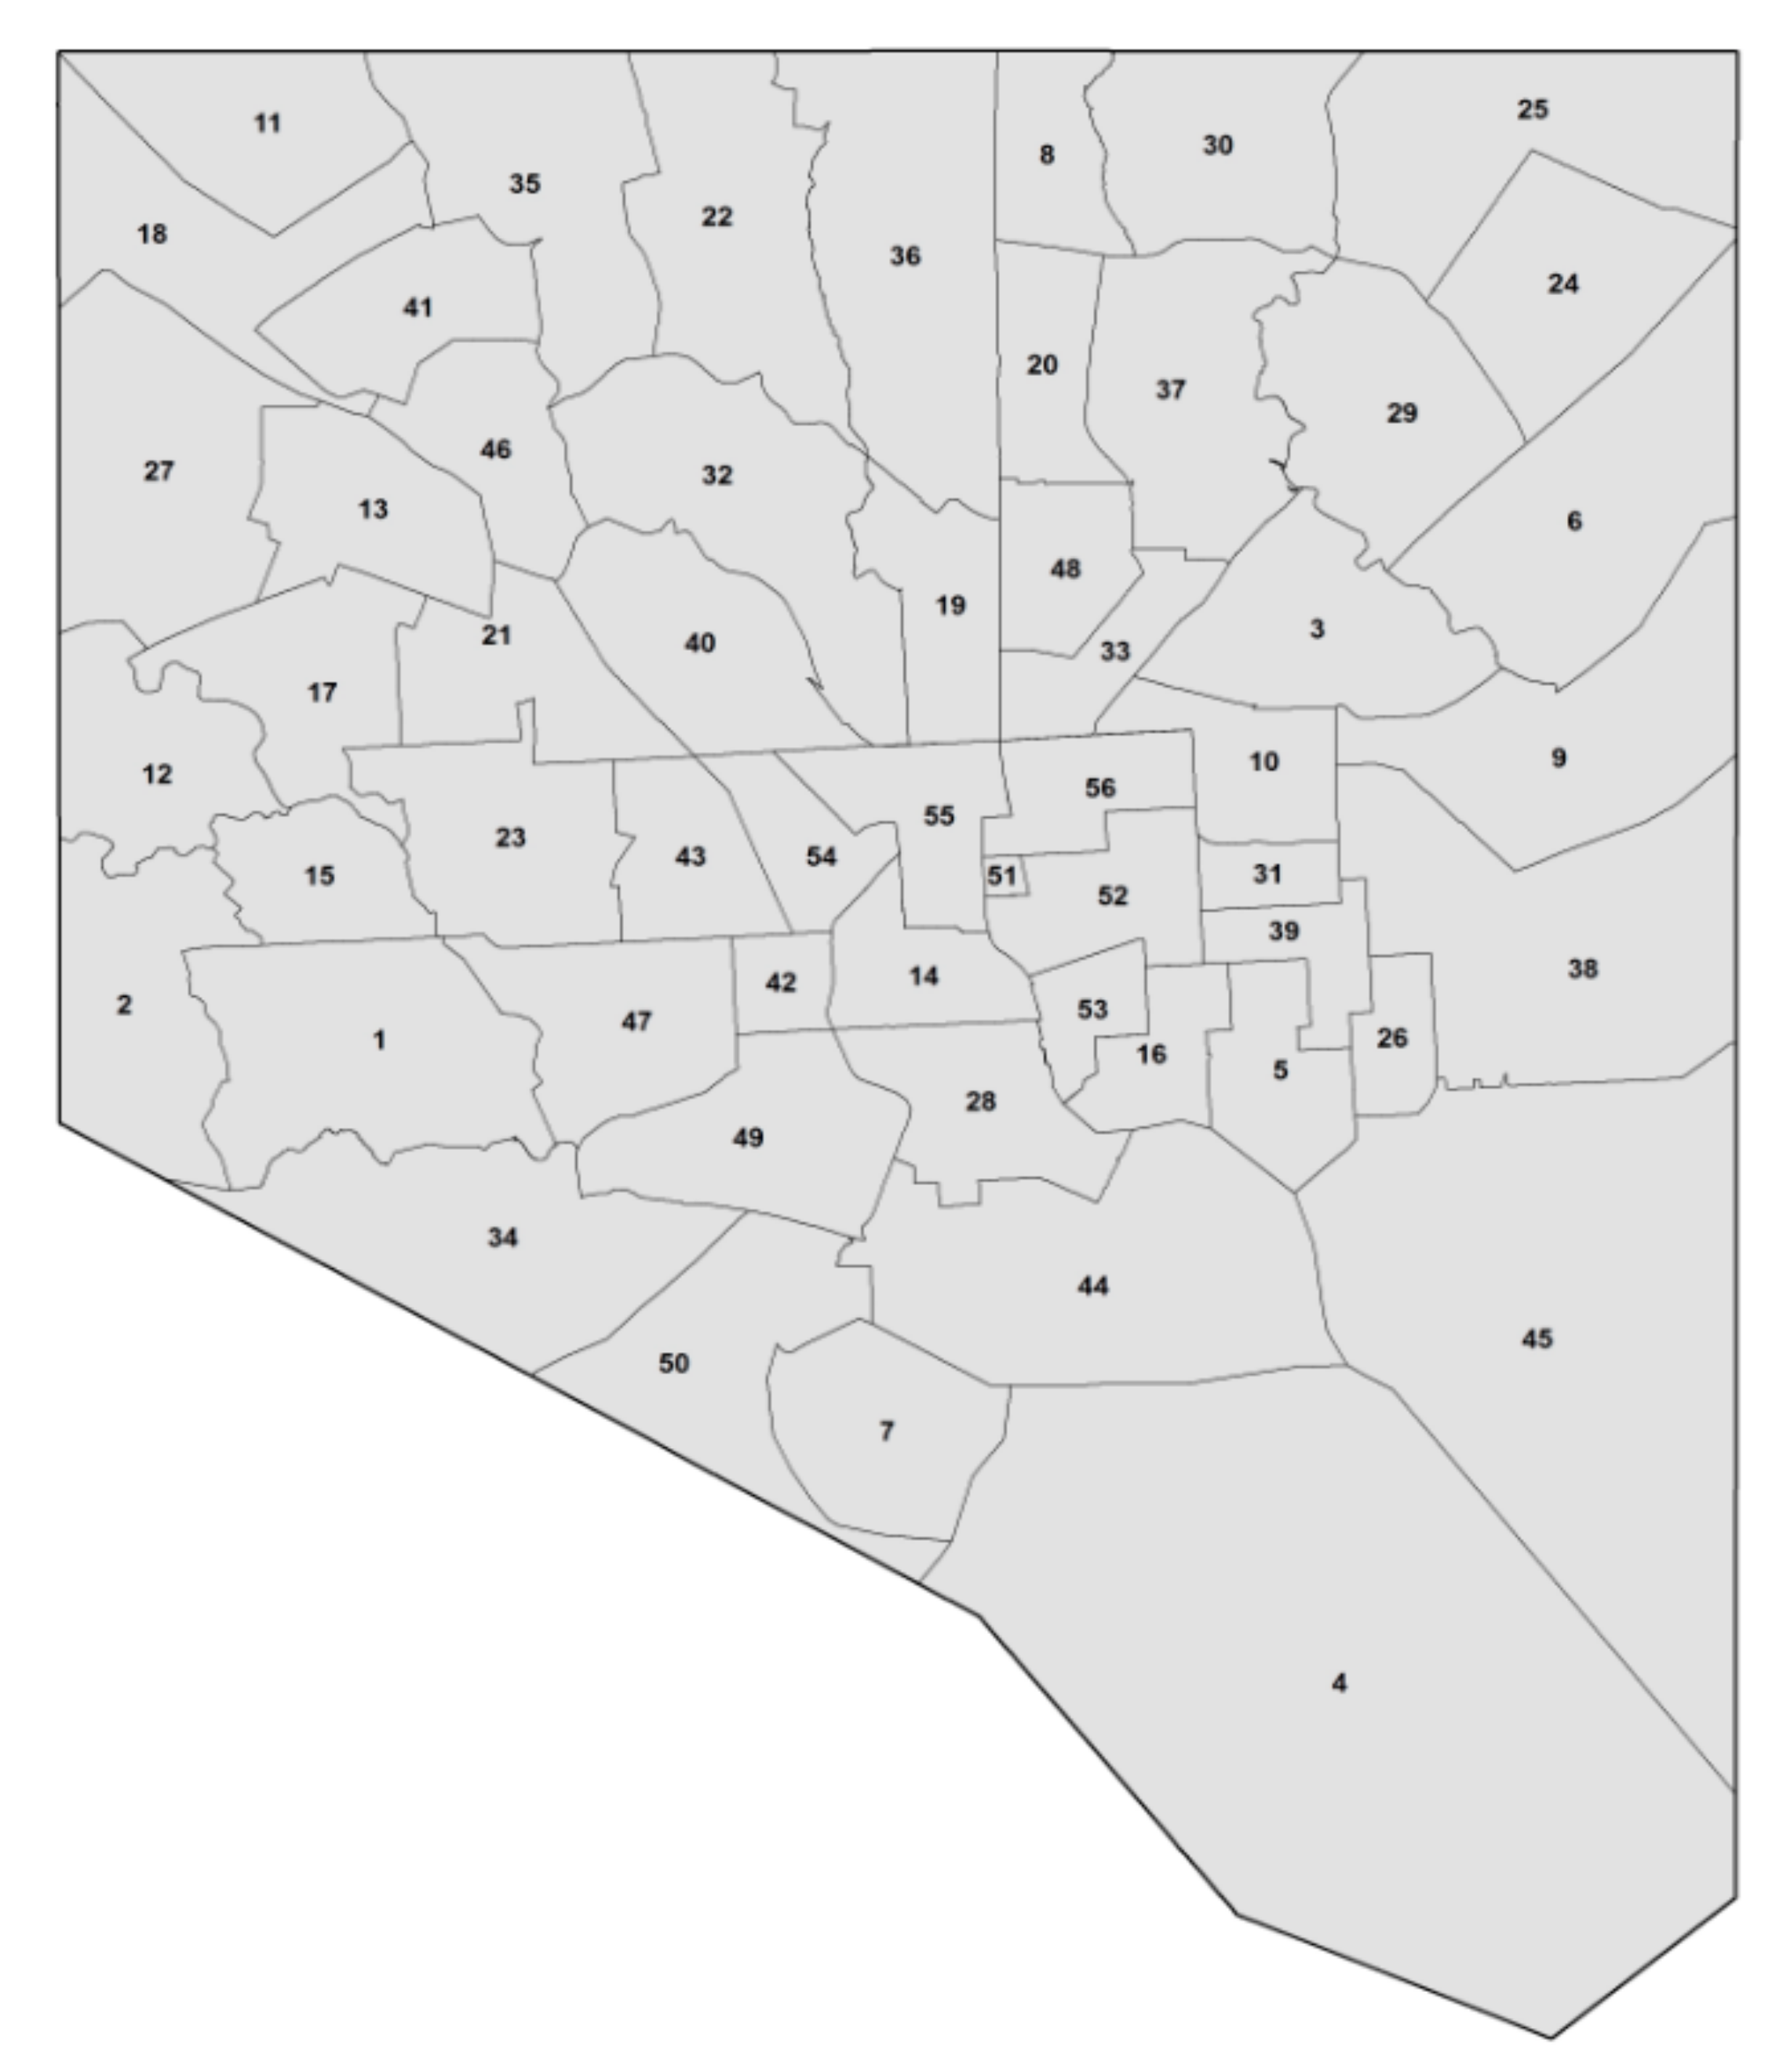
2.1. Study Region
2.2. Dependent Variables
2.3. Independent Variables
2.4. Confounders
2.5. Effect Measure Modifiers/Moderators
2.6. Statistical Analysis
2.7. Sensitivity Analyses
3. Results
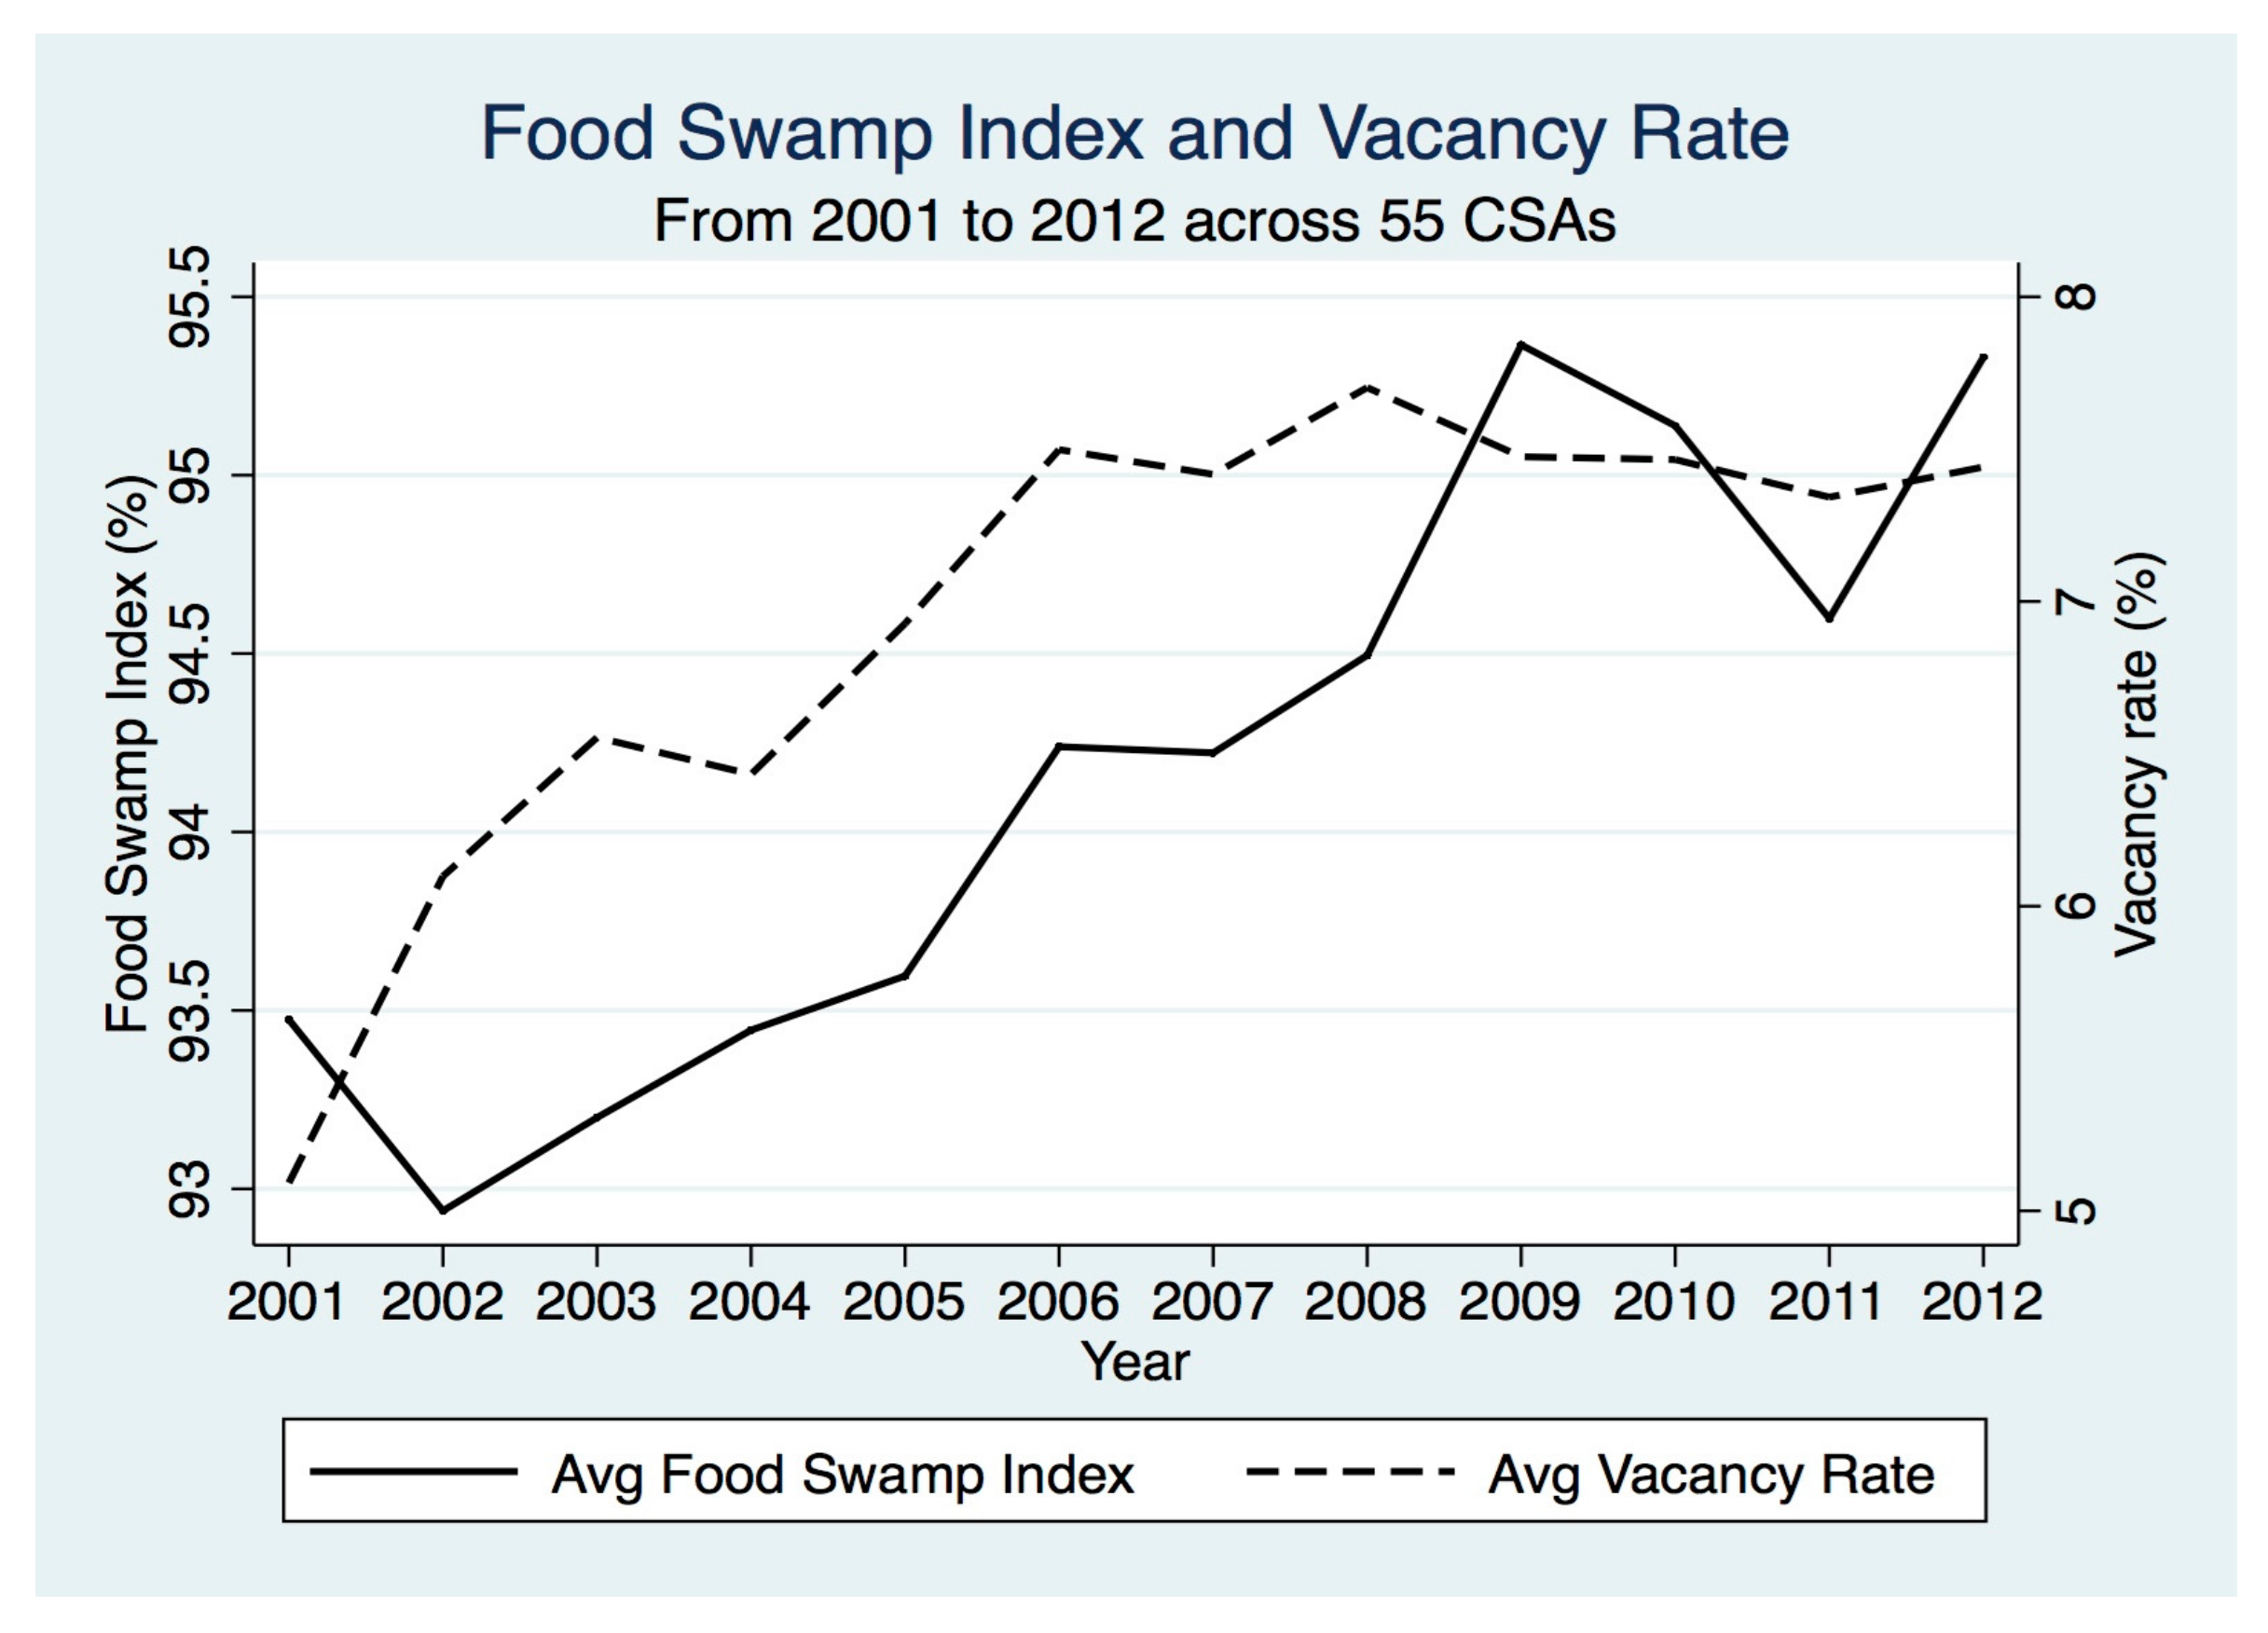
3.1. Association between Changes in Vacancy Rates and Changes in Food Swamps
3.2. Sensitivity Analyses
4. Discussion
5. Conclusions
Supplementary Materials
Acknowledgments
Author Contributions
Conflicts of Interest
References
- Ford, P.B.; Dzewaltowski, D.A. Disparities in obesity prevalence due to variation in the retail food environment: Three testable hypotheses. Nutr. Rev. 2008, 66, 216–228. [Google Scholar] [CrossRef] [PubMed]
- Yan, R.; Bastian, N.D.; Griffin, P.M. Association of food environment and food retailers with obesity in US adults. Health Place 2015, 33, 19–24. [Google Scholar] [CrossRef] [PubMed]
- Cobb, L.K.; Appel, L.J.; Franco, M.; Jones-Smith, J.C.; Nur, A.; Anderson, C.A.M. The relationship of the local food environment with obesity: A systematic review of methods, study quality, and results. Obesity 2015, 23, 1331–1344. [Google Scholar] [CrossRef] [PubMed]
- Stark, J.H.; Neckerman, K.; Lovasi, G.S.; Konty, K.; Quinn, J.; Arno, P.; Viola, D.; Harris, T.G.; Weiss, C.C.; Bader, M.D.M.; et al. Neighbourhood food environments and body mass index among New York City adults. J. Epidemiol. Community Health 2013, 67, 736–742. [Google Scholar] [CrossRef] [PubMed]
- Hilmers, A.; Hilmers, D.C.; Dave, J. Neighborhood disparities in access to healthy foods and their effects on environmental justice. Am. J. Public Health 2012, 102, 1644–1654. [Google Scholar] [CrossRef] [PubMed]
- Larson, N.I.; Story, M.T.; Nelson, M.C. Neighborhood environments: Disparities in access to healthy foods in the US. Am. J. Prev. Med. 2009, 36, 74–81. [Google Scholar] [CrossRef] [PubMed]
- Moore, L.V.; Diez Roux, A.V. Associations of neighborhood characteristics with the location and type of food stores. Am. J. Public Health 2006, 96, 325–331. [Google Scholar] [CrossRef] [PubMed]
- Bridle-Fitzpatrick, S. Food deserts or food swamps? A mixed-methods study of local food environments in a Mexican city. Soc. Sci. Med. 2015, 142, 202–213. [Google Scholar] [CrossRef] [PubMed]
- Dannenberg, A.L.; Jackson, R.J.; Frumkin, H.; Schieber, R.A.; Pratt, M.; Kochtitzky, C.S.; Tilson, H.H. The impact of community design and land-use choices on public health: A scientific research agenda. Am. J. Public Health 2003, 93, 1500–1508. [Google Scholar] [CrossRef] [PubMed]
- Botchwey, N.D.; Falkenstein, R.; Levin, J.; Fisher, T.; Trowbridge, M. The built environment and actual causes of death: Promoting an ecological approach to planning and public health. J. Plan. Lit. 2015, 30, 261–281. [Google Scholar] [CrossRef]
- Cohen, D.A.; Mason, K.; Bedimo, A.; Scribner, R.; Basolo, V.; Farley, T.A. Neighborhood physical conditions and health. Am. J. Public Health 2003, 93, 467–471. [Google Scholar] [CrossRef] [PubMed]
- Arcaya, M.; Glymour, M.M.; Chakrabarti, P.; Christakis, N.A.; Kawachi, I.; Subramanian, S.V. Effects of proximate foreclosed properties on individuals’ weight gain in Massachusetts, 1987–2008. Am. J. Public Health 2013, 103, e50–e56. [Google Scholar] [CrossRef] [PubMed]
- Cohen, D.; Spear, S.; Scribner, R.; Kissinger, P.; Mason, K.; Wildgen, J. ‘Broken windows’ and the risk of gonorrhea. Am. J. Public Health 2000, 90, 230–236. [Google Scholar] [PubMed]
- Garvin, E.; Branas, C.; Keddem, S.; Sellman, J.; Cannuscio, C. More than just an eyesore: Local insights and solutions on vacant land and urban health. J. Urban Health 2013, 90, 412–426. [Google Scholar] [CrossRef] [PubMed]
- Walton, E. Vital places: Facilitators of behavioral and social health mechanisms in low-income neighborhoods. Soc. Sci. Med. 2014, 122, 1–12. [Google Scholar] [CrossRef] [PubMed]
- Fullilove, M.T.; Héon, V.; Jimenez, W. Injury and anomie: Effects of violence on an inner-city community. Am. J. Public Health 1998. [Google Scholar] [CrossRef]
- Mui, Y.; Gittelsohn, J.; Jones-Smith, J.C. Longitudinal associations between change in neighborhood social disorder and change in food swamps in an urban setting. J. Urban Health 2017, 94, 75–86. [Google Scholar] [CrossRef] [PubMed]
- Baxter, V.; Lauria, M. Residential mortgage foreclosure and neighborhood change. Hous. Policy Debate 2000, 11, 675–699. [Google Scholar] [CrossRef]
- Martinez-Fernandez, C.; Audirac, I.; Fol, S.; Cunningham-Sabot, E. Shrinking cities: Urban challenges of globalization. Int. J. Urban Reg. Res. 2012, 36, 213–225. [Google Scholar] [CrossRef] [PubMed]
- Maryland Poverty Profiles 2016. Maryland Alliance for the Poor. Available online: http://familyleague.org (accessed on 26 June 2017).
- The Jacob France Institute. Baltimore Neighborhood Indicators Alliance Website. 2014. Available online: http://bniajfi.org (accessed on 12 December 2016).
- Sentementes, G.G. Super Pride Reaches the End. Baltimore Sun. 2000. Available online: http://articles.baltimoresun.com (accessed on 12 December 2016).
- Franco, M.; Diez Roux, A.V.; Glass, T.A.; Caballero, B.; Brancati, F.L. Neighborhood Characteristics and Availability of Healthy Foods in Baltimore. Am. J. Prev. Med. 2008, 35, 561–567. [Google Scholar] [CrossRef] [PubMed]
- Franco, M.; Diez Roux, A.V.; Nettleton, J.A.; Lazo, M.; Brancati, F.; Caballero, B.; Glass, T.; Moore, L.V. Availability of healthy foods and dietary patterns: The multi-ethnic study of atherosclerosis. Am. J. Clin. Nutr. 2009, 89, 897–904. [Google Scholar] [CrossRef] [PubMed]
- Dennisuk, L.A.; Coutinho, A.J.; Suratkar, S.; Surkan, P.J.; Christiansen, K.; Riley, M.; Anliker, J.A.; Sharma, S.; Gittelsohn, J. Food expenditures and food purchasing among low-income, urban, African-American youth. Am. J. Prev. Med. 2011, 40, 625–628. [Google Scholar] [CrossRef] [PubMed]
- Gittelsohn, J.; Anderson Steeves, E.; Mui, Y.; Kharmats, A.Y.; Hopkins, L.C.; Dennis, D. B’More healthy communities for kids: Design of a multi-level intervention for obesity prevention for low-income African American children. BMC Public Health 2014, 14, 942. [Google Scholar] [CrossRef] [PubMed]
- Jeffries, J.K.; Lee, S.H.; Frick, K.D.; Gittelsohn, J. Preferences for healthy carryout meals in low-income neighborhoods of Baltimore city. Health Promot. Pract. 2013, 14, 293–300. [Google Scholar] [CrossRef] [PubMed]
- Centers for Disease and Control and Prevention. Census Tract Level State Maps of the Modified Retail Food Environment Index (mRFEI); Centers for Disease and Control and Prevention: Atlanta, GA, USA, 2016; pp. 1–6. [Google Scholar]
- Truong, K.; Fernandes, M.; An, R.; Shier, V.; Sturm, R. Measuring the physical food environment and its relationship with obesity: Evidence from California. Public Health 2010, 124, 115–118. [Google Scholar] [CrossRef] [PubMed]
- An, R. Fast-food and full-service restaurant consumption and daily energy and nutrient intakes in US adults. Eur. J. Clin. Nutr. 2016, 70, 97–103. [Google Scholar] [CrossRef] [PubMed]
- Guthrie, J.F.; Lin, B.-H.; Frazao, E. Role of food prepared away from home in the american diet, 1977–1978 versus 1994–1996: Changes and consequences. J. Nutr. Educ. Behav. 2002, 34, 140–150. [Google Scholar] [CrossRef]
- Liese, A.D.; Barnes, T.L.; Lamichhane, A.P.; Hibbert, J.D.; Colabianchi, N.; Lawson, A.B. Characterizing the food retail environment: Impact of count, type, and geospatial error in 2 secondary data sources. J. Nutr. Educ. Behav. 2013, 45, 435–442. [Google Scholar] [CrossRef] [PubMed]
- Liese, A.D.; Colabianchi, N.; Lamichhane, A.P.; Barnes, T.L.; Hibbert, J.D.; Porter, D.E.; Nichols, M.D.; Lawson, A.B. Validation of 3 food outlet databases: Completeness and geospatial accuracy in rural and urban food environments. Am. J. Epidemiol. 2010, 172, 1324–1333. [Google Scholar] [CrossRef] [PubMed]
- Powell, L.M.; Han, E.; Zenk, S.N.; Khan, T.; Quinn, C.M.; Gibbs, K.P.; Pugach, O.; Barker, D.C.; Resnick, E.A.; Myllyluoma, J.; et al. Field validation of secondary commercial data sources on the retail food outlet environment in the U.S. Health Place 2011, 17, 1122–1131. [Google Scholar] [CrossRef] [PubMed]
- Fleischhacker, S.E.; Rodriguez, D.A. Evidence for validity of five secondary data sources for enumerating retail food outlets in seven American Indian communities in North Carolina. Int. J. Behav. Nutr. Phys. Act. 2012, 9, 1–14. [Google Scholar] [CrossRef] [PubMed]
- Rundle, A.; Neckerman, K.M.; Freeman, L.; Lovasi, G.S.; Purciel, M.; Quinn, J.; Richards, C.; Sircar, N.; Weiss, C. Neighborhood food environment and walkability predict obesity in New York City. Environ. Health Perspect. 2009, 117, 442–447. [Google Scholar] [CrossRef] [PubMed]
- Schachtel, M.R.B. CitiStat and the Baltimore neighborhood indicators alliance: Using information to improve communication and community. Natl. Civ. Rev. 2001, 90, 253–266. [Google Scholar] [CrossRef]
- Vernez Moudon, A.; Cook, A.J.; Ulmer, J.; Hurvitz, P.M.; Drewnowski, A. A neighborhood wealth metric for use in health studies. Am. J. Prev. Med. 2011, 41, 88–97. [Google Scholar] [CrossRef] [PubMed]
- Reese-Cassal, K. 2014/2019 Esri Diversity Index: An Esri White Paper; Esri: Redlands, CA, USA, 2014; pp. 1–9. [Google Scholar]
- Altschuler, A.; Somkin, C.P.; Adler, N.E. Local services and amenities, neighborhood social capital, and health. Soc. Sci. Med. 2004, 59, 1219–1229. [Google Scholar] [CrossRef] [PubMed]
- Kwate, N.O.A. Fried chicken and fresh apples: Racial segregation as a fundamental cause of fast food density in black neighborhoods. Health Place 2008, 14, 32–44. [Google Scholar] [CrossRef] [PubMed]
- Raleigh, E.; Galster, G. Neighborhood disinvestment, abandonment, and crime dynamics. J. Urban Aff. 2015, 37, 367–396. [Google Scholar] [CrossRef]
- Cui, L.; Walsh, R. Foreclosure, vacancy and crime. J. Urban Econ. 2015, 87, 72–84. [Google Scholar] [CrossRef]
- Allison, P.D. Fixed Effects Regression Models; SAGE Publications, Inc.: Thousand Oaks, CA, USA, 2009. [Google Scholar]
- Greenland, S.; Senn, S.J.; Rothman, K.J.; Carlin, J.B.; Poole, C.; Goodman, S.N.; Altman, D.G. Statistical tests, P values, confidence intervals, and power: A guide to misinterpretations. Eur. J. Epidemiol. 2016, 31, 337–350. [Google Scholar] [CrossRef] [PubMed]
- Jewell, N.P. Statistics for Epidemiology; CRC Press: Boca Raton, FL, USA, 2003. [Google Scholar]
- Arcaya, M.; Brewster, M.; Zigler, C.M.; Subramanian, S.V. Area variations in health: A spatial multilevel modeling approach. Health Place 2012, 18, 824–831. [Google Scholar] [CrossRef] [PubMed]
- Anselin, L.; Syabri, I.; Kho, Y. GeoDa: An introduction to spatial data analysis. Geogr. Anal. 2006, 38, 5–22. [Google Scholar] [CrossRef]
- Bower, K.M.; Thorpe, R.J., Jr.; Rohde, C.; Gaskin, D.J. The intersection of neighborhood racial segregation, poverty, and urbanicity and its impact on food store availability in the United States. Prev. Med. 2014, 58, 33–39. [Google Scholar] [CrossRef] [PubMed]
- Hall, M.; Crowder, K.; Spring, A. Neighborhood foreclosures, racial/ethnic transitions, and residential segregation. Am. Sociol. Rev. 2015, 80, 526–549. [Google Scholar] [CrossRef] [PubMed]
- Rummo, P.E.; Guilkey, D.K.; Ng, S.W.; Popkin, B.M.; Evenson, K.R.; Gordon-Larsen, P. Beyond supermarkets: Food outlet location selection in four U.S. cities over time. Am. J. Prev. Med. 2017, 52, 300–310. [Google Scholar] [CrossRef] [PubMed]
- Luan, H.; Minaker, L.M.; Law, J. Do marginalized neighbourhoods have less healthy retail food environments? An analysis using Bayesian spatial latent factor and hurdle models. Int. J. Health Geogr. 2016, 15, 1–16. [Google Scholar] [CrossRef] [PubMed]
- Sadler, R.C. Strengthening the core, improving access: Bringing healthy food downtown via a farmers’ market move. Appl. Geogr. 2016, 67, 119–128. [Google Scholar] [CrossRef]
- Krusky, A.M.; Heinze, J.E.; Reischl, T.M.; Aiyer, S.M. The effects of produce gardens on neighborhoods: A test of the greening hypothesis in a post-industrial city. Landsc. Urban Plan. 2015, 136, 68–75. [Google Scholar] [CrossRef]
- Dimitri, C.; Oberholtzer, L.; Zive, M.; Sandolo, C. Enhancing food security of low-income consumers: An investigation of financial incentives for use at farmers markets. Food Policy 2015, 52, 64–70. [Google Scholar] [CrossRef]
- Pothukuchi, K. Attracting supermarkets to inner-city neighborhoods: Economic development outside the box. Econ. Dev. Q. 2005, 19, 232–244. [Google Scholar] [CrossRef]
- Evans, G.W.; Kantrowitz, E. Socioeconomic status and health: The potential role of environmental risk exposure. Ann. Rev. Public Health 2002, 23, 303–331. [Google Scholar] [CrossRef] [PubMed]
- Sutton, S.A. Rethinking commercial revitalization: A neighborhood small business perspective. Econ. Dev. Q. 2010, 24, 352–371. [Google Scholar] [CrossRef]
- Chen, X.; Kwan, M.-P. Contextual uncertainties, human mobility, and perceived food environment: The uncertain geographic context problem in food access research. Am. J. Public Health 2015, 105, 1734–1737. [Google Scholar] [CrossRef] [PubMed]
- HUD Aggregated USPS Administrative Data on Address Vacancies. Office of Policy Development and Research, U.S. Department of Housing and Urban Development. Available online: https://www.huduser.gov/portal/datasets/usps.html (accessed on 10 September 2017).
- Capps, K. USPS Mail Carriers Are also Collecting Crucial Housing Data. CityLab. 20 May 2014. Available online: https://www.citylab.com/equity/2014/05/usps-mail-carriers-are-also-collecting-crucial-housing-data/371089/ (accessed on 10 September 2017).
- Gase, L.N.; Schooley, T.; Lee, M.; Rotakhina, S.; Vick, J.; Caplan, J. A practice-grounded approach for evaluating health in all policies initiatives in the United States. J. Public Health Manag. Pract. 2017, 23, 339–347. [Google Scholar] [CrossRef] [PubMed]
- Baltimore Housing. Vacants to Value Website. Available online: http://www.vacantstovalue.org (accessed on 7 April 2015).
- Branas, C.C.; Cheney, R.A.; MacDonald, J.M.; Tam, V.W.; Jackson, T.D.; Ten Have, T.R. A difference-in-differences analysis of health, safety, and greening vacant urban space. Am. J. Epidemiol. 2011, 174, 1296–1306. [Google Scholar] [CrossRef] [PubMed]
- National League of Cities Website. Available online: http://www.nlc.org (accessed on 12 December 2016).


| 2001 Mean (SD) | 2012 Mean (SD) | |
|---|---|---|
| Median sales price of homes ($) | 76,462 (40,894) | 114,812 (86,652) |
| Racial diversity index (%) | 28.7 (18.8) | 38.1 (23.3) |
| Total population (n) | 11,675 (4560) | 11,314 (4435) |
| Vacancy rate (%) | 5.1 (6.9) | 7.7 (10.1) |
| Food swamp index (%) | 93.5 (6.1) | 95.3 (4.6) |
| BMI-unhealthy outlet density (outlets/sq. mile) | 39.7 (47.5) | 45.0 (53.3) |
| BMI-intermediate outlet density (outlets/sq. mile) | 14.1 (26.5) | 21.5 (38.4) |
| BMI-healthy outlet density (outlets/sq. mile) | 4.0 (7.0) | 3.2 (6.4) |
| Food Swamp Index | ||||||||||
|---|---|---|---|---|---|---|---|---|---|---|
| Pooled Model (n = 55) | Stratified Models (by Predominantly African American 4) | Stratified Models (by Neighborhood SES 5) | ||||||||
| Non-African American ≤ 62% (n = 24) | African American > 62% (n = 31) | High-SES > $98,000 (n = 27) | Low-SES ≤ $98,000 (n = 28) | |||||||
| b (90% CI) | p-value | b (90% CI) | p-value | b (90% CI) | p-value | b (90% CI) | p-value | b (90% CI) | p-value | |
| Vacancy rate | 0.041 (−0.095, 0.18) | 0.62 | −0.38 * (−0.64, −0.12) | 0.015 | 0.078 (−0.11, 0.27) | 0.50 | −0.23 (−0.57, 0.11) | 0.26 | 0.15 (0.037, 0.27) | 0.031 |
| Vacancy rate, 1-year lag | −0.024 (−0.17, 0.12) | 0.79 | - | - | ||||||
| Food Swamp Index 5 | ||||||||||
|---|---|---|---|---|---|---|---|---|---|---|
| Pooled Model (n = 55) | Stratified Models (by Predominantly African American) | Stratified Models (by Neighborhood SES) | ||||||||
| Non-African American ≤ 93% (n = 41) | African American > 93% (n = 14) | High-SES > $162,000 (n = 13) | Low-SES ≤ $162,000 (n = 42) | |||||||
| b (90% CI) | p-value | b (90% CI) | p-value | b (90% CI) | p-value | b (90% CI) | p-value | b (90% CI) | p-value | |
| Vacancy rate | 0.041 (−0.095, 0.18) | 0.62 | 0.040 (−0.17, 0.25) | 0.75 | 0.16 (0.0052, 0.31) | 0.089 | −0.33 (−0.82, 0.16) | 0.27 | 0.13 (0.012, 0.24) | 0.069 |
© 2017 by the authors. Licensee MDPI, Basel, Switzerland. This article is an open access article distributed under the terms and conditions of the Creative Commons Attribution (CC BY) license (http://creativecommons.org/licenses/by/4.0/).
Share and Cite
Mui, Y.; Jones-Smith, J.C.; Thornton, R.L.J.; Pollack Porter, K.; Gittelsohn, J. Relationships between Vacant Homes and Food Swamps: A Longitudinal Study of an Urban Food Environment. Int. J. Environ. Res. Public Health 2017, 14, 1426. https://doi.org/10.3390/ijerph14111426
Mui Y, Jones-Smith JC, Thornton RLJ, Pollack Porter K, Gittelsohn J. Relationships between Vacant Homes and Food Swamps: A Longitudinal Study of an Urban Food Environment. International Journal of Environmental Research and Public Health. 2017; 14(11):1426. https://doi.org/10.3390/ijerph14111426
Chicago/Turabian StyleMui, Yeeli, Jessica C. Jones-Smith, Rachel L. J. Thornton, Keshia Pollack Porter, and Joel Gittelsohn. 2017. "Relationships between Vacant Homes and Food Swamps: A Longitudinal Study of an Urban Food Environment" International Journal of Environmental Research and Public Health 14, no. 11: 1426. https://doi.org/10.3390/ijerph14111426