OMI and Ground-Based In-Situ Tropospheric Nitrogen Dioxide Observations over Several Important European Cities during 2005–2014

 , , and
Abstract
:1. Introduction
2. Data and Methodology
3. Results and Discussion
4. Conclusions
Acknowledgments
Author Contributions
Conflicts of Interest
References
- World Health Organization. Global Health Risks: Mortality and Burden of Disease Attributable to Selected Major Risks; WHO Press: Geneva, Switzerland, 2009. [Google Scholar]
- Martin, B.; Martin, L. Association between unemployment, income, education level, population size and air pollution in Czech cities: Evidence for environmental inequality? A pilot national scale analysis. Health Place 2012, 18, 1110–1114. [Google Scholar]
- Susannah, G.; John, S.; Andrew, K.; Melanie, H.; John, N.; John, A.; Sally, C. Recent trends and projections of primary NO2 emissions in Europe. Atmos. Environ. 2009, 43, 2154–2167. [Google Scholar]
- European Environment Agency. Air Quality in Europe—2015 Report; EEA Report No. 5/2015; European Environment Agency: Copenhagen, Denmark, 2015. [Google Scholar]
- European Environment Agency. Air Quality in Europe—2016 Report; EEA Report No. 28/2016; European Environment Agency: Copenhagen, Denmark, 2016. [Google Scholar]
- World Health Organization. WHO Air Quality Guidelines for Particulate Matter, Ozone, Nitrogen Dioxide and Sulfur Dioxide; Global Update 2005; Summary of Risk Assessment; World Health Organization: Geneva, Switzerland, 2006. [Google Scholar]
- Song, X.; Liu, Y.; Hu, Y.; Zhao, X.; Tian, J.; Ding, G.; Wang, S. Short-Term Exposure to Air Pollution and Cardiac Arrhythmia: A Meta-Analysis and Systematic Review. Int. J. Environ. Res. Public Health 2016, 13, 642. [Google Scholar] [CrossRef] [PubMed]
- Latza, U.; Gerdes, S.; Baur, X. Effects of nitrogen dioxide on human health: Systematic review of experimental and epidemiological studies conducted between 2002 and 2006. Int. J. Hyg. Environ. Health 2009, 212, 271–287. [Google Scholar] [CrossRef] [PubMed]
- Berezin, E.V.; Konovalov, I.B.; Romanova, Y.Y. Inverse Modeling of Nitrogen Oxides Emissions from the 2010 Russian Wildfires by Using Satellite Measurements of Nitrogen Dioxide. Atmosphere 2016, 7, 132. [Google Scholar] [CrossRef]
- Zhou, Y.; Dominik, B.; Christoph, H.; Stephan, H.; Johannes, S. Changes in OMI tropospheric NO2 columns over Europe from 2004 to 2009, and the influence of meteorological variability. Atmos. Environ. 2012, 46, 482–495. [Google Scholar] [CrossRef]
- Qi, Y. Spatio-temporal distributions of tropospheric NO2 over oases in Taklimakan Desert, China. Chin. Geogr. Sci. 2015, 25, 561–568. [Google Scholar] [CrossRef]
- Zhang, L.; Lee, C.S.; Zhang, R.; Chen, L. Spatial and temporal evaluation of long term trend (2005–2014) of OMI retrieved NO2 and SO2 concentrations in Henan Province, China. Atmos. Environ. 2017, 154, 151–166. [Google Scholar] [CrossRef]
- Levelt, P.; van den Oord, G.; Dobber, M.; Malkki, A.; Visser, H.; de Vries, J.; Stammes, P.; Lundell, J.; Saari, H. The ozone monitoring instrument. IEEE Trans. Geosci. Remote 2006, 44, 1093–1101. [Google Scholar] [CrossRef]
- Munro, R.; Eisinger, M.; Anderson, C.; Callies, J.; Corpaccioli, E.; Lang, R.; Lefebvre, A.; Livschitz, Y.; Albinana, A.P. GOME-2 on MetOp. In Proceedings of the 2006 EUMETSAT Meteorological Satellite Conference, Helsinki, Finland, 12–16 June 2006; p. 48. [Google Scholar]
- Schaap, M.; Kranenburg, R.; Curier, L.; Jozwicka, M.; Dammers, E.; Timmermans, R. Assessing the Sensitivity of the OMI-NO2 Product to Emission Changes across Europe. Remote Sens. 2013, 5, 4187–4208. [Google Scholar] [CrossRef]
- Szymankiewicz, K.; Kaminski, J.W.; Struzewska, J. Interannual variability of tropospheric NO2 column over Central Europe—Observations from SCIAMACHY and GEM-AQ model simulations. Acta Geophys. 2014, 62, 915–929. [Google Scholar] [CrossRef]
- Miranda, A.; Silveira, C.; Ferreira, J.; Monteiro, A.; Lopes, D.; Relvas, H.; Borrego, C.; Roebeling, P. Current air quality plans in Europe designed to support air quality management policies. Atmos. Pollut. Res. 2015, 6, 434–443. [Google Scholar] [CrossRef]
- Constantin, D.E.; Voiculescu, M.; Georgescu, L. Satellite Observations of NO2 Trend over Romania. Sci. World J. 2013. [Google Scholar] [CrossRef] [PubMed]
- Zyrichidou, I.; Koukouli, M.E.; Balis, D.S.; Katragkou, E.; Melas, D.; Poupkou, A.; Kioutsioukis, I.; van der A., R.; Boersma, F.K.; van Roozendael, M.; et al. Satellite observations and model simulations of tropospheric NO2 columns over South-Eastern Europe. Atmos. Chem. Phys. 2009, 9, 6119–6134. [Google Scholar] [CrossRef]
- Schneider, P.; Lahoz, W.A.; van der A, R. Recent satellite-based trends of tropospheric nitrogen dioxide over large urban agglomerations worldwide. Atmos. Chem. Phys. 2015, 15, 1205–1220. [Google Scholar] [CrossRef] [Green Version]
- Castellanos, P.; Boersma, K.F. Reductions in nitrogen oxides over Europe driven by environmental policy and economic recession. Sci. Rep. 2012, 2. [Google Scholar] [CrossRef] [PubMed]
- Guerreiro, C.B.; Foltescu, V.; de Leeuw, F. Air quality status and trends in Europe. Atmos. Environ. 2014, 98, 376–384. [Google Scholar] [CrossRef] [Green Version]
- Boersma, K.F.; Eskes, H.J.; Dirksen, R.J.; van der A, R.J.J.; Veefkind, P.; Stammes, P.; Huijnen, V.; Kleipool, Q.L.; Sneep, M.; Claas, J.; et al. An improved retrieval of tropospheric NO2 columns from the Ozone Monitoring Instrument. Atmos. Meas. Tech. 2011, 4, 1905–1928. [Google Scholar] [CrossRef]
- Varotsos, C.; Christodoulakis, J.; Tzanis, C.; Cracknell, A.P. Signature of tropospheric ozone and nitrogen dioxide from space: A case study for Athens, Greece. Atmos. Environ. 2014, 89, 721–730. [Google Scholar] [CrossRef]
- Tzanis, C.; Varotsos, C.; Ferm, M.; Christodoulakis, J.; Assimakopoulos, M.N.; Efthymiou, C. Nitric acid and particulate matter measurements at Athens, Greece, in connection with corrosion studies. Atmos. Chem. Phys. 2009, 9, 8309–8316. [Google Scholar] [CrossRef]
- Sidiropoulou, T.; Ioannis, P. Austerity and Fuel Consumption in Greece: An Empirical Investigation. Int. J. Econ. Bus. Adm. 2015, III, 58–65. [Google Scholar]
- Constantin, D.-E.; Voiculescu, M.; Georgescu, L.; Trif, C.; Karakolios, E.; Mamoukaris, A.; Xipolitos, K. Imprint of Road Vehicle Dynamics on Atmospheric Pollution. Case Study: Bucharest City 2007–2010. J. Environ. Prot. Ecol. 2012, 13, 837–843. [Google Scholar]


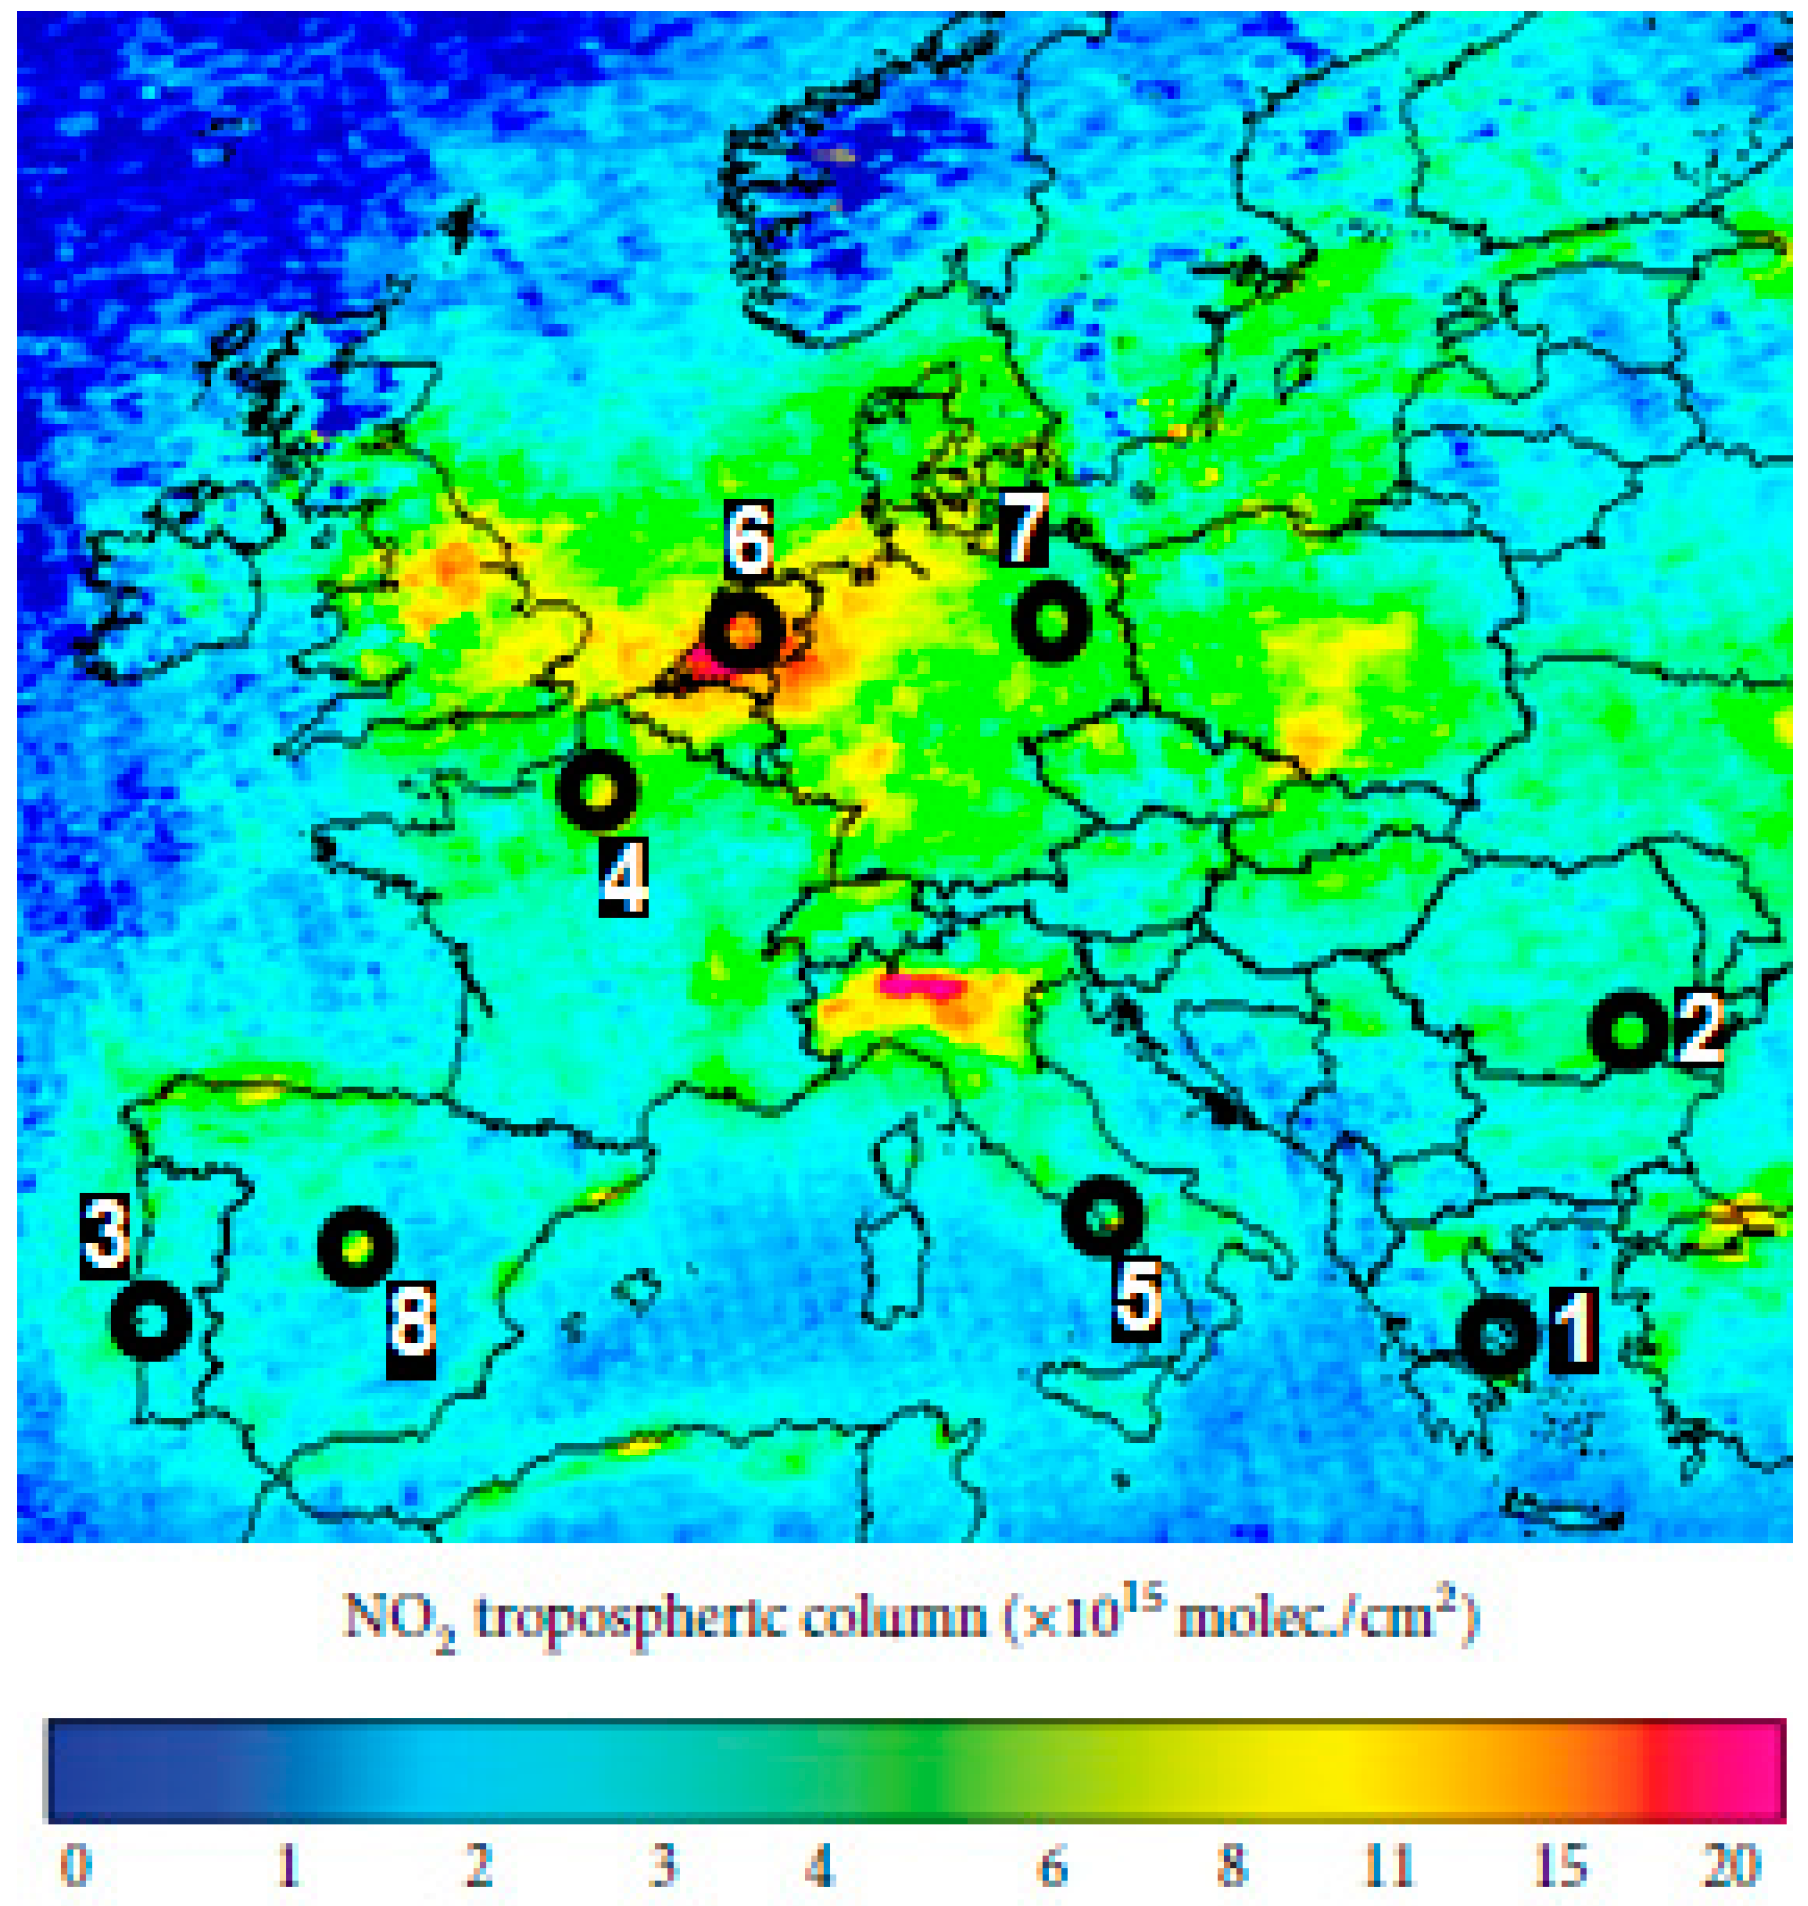
| City | Country | Location | Area |
|---|---|---|---|
| Athens | Greece | 37.98° N, 23.72° E | 412 km2 |
| Berlin | Germany | 52.51° N, 13.41° E | 892 km2 |
| Bucharest | Romania | 44.43° N, 26.10° E | 228 km2 |
| Lisbon | Portugal | 38.71° N, 9.13° W | 958 km2 |
| Madrid | Spain | 40.38° N, 3.71° W | 604 km2 |
| Paris | France | 48.85° N, 2.35° E | 2845 km2 |
| Rome | Italy | 41.9° N, 12.50° E | 1285 km2 |
| Rotterdam | The Netherlands | 51.91° N, 4.46° E | 326 km2 |
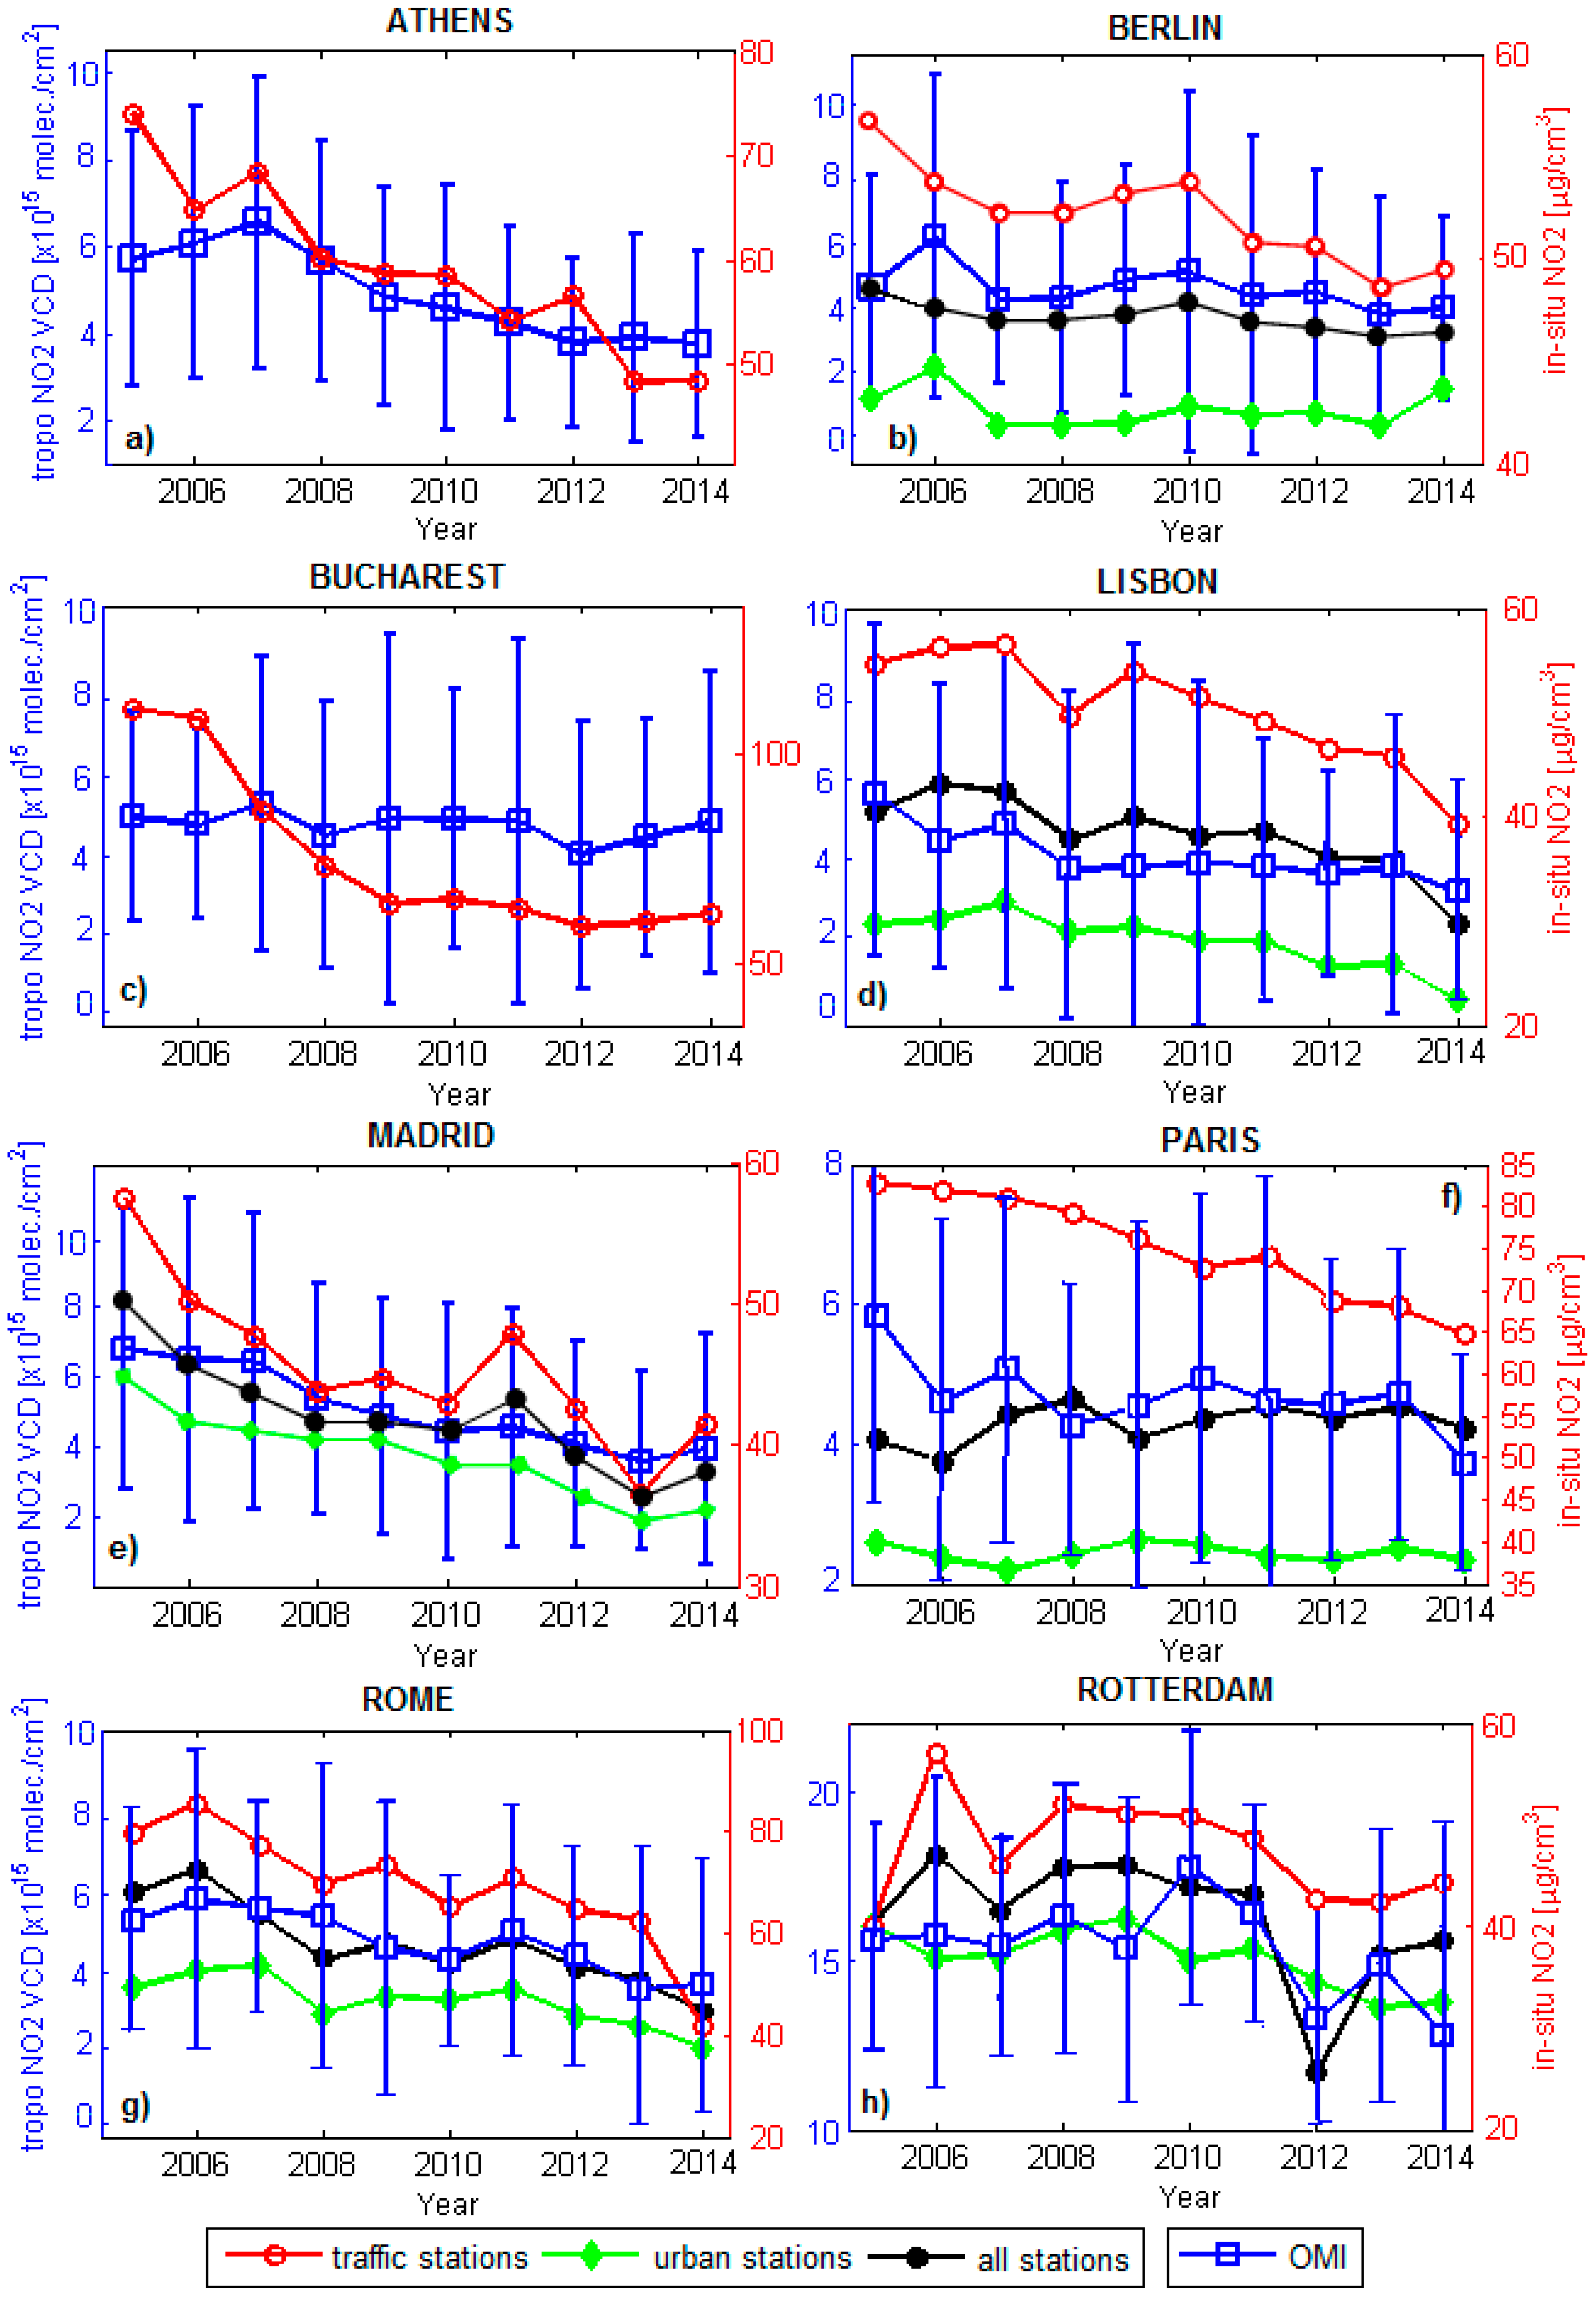
| Location | Athens | Bucharest | Berlin | Lisbon | Madrid | Paris | Rome | Rotterdam |
|---|---|---|---|---|---|---|---|---|
| Number of available traffic stations | 4 | 2 | 4 | 4 | 6 | 7 | 5 | 2 |
| Number of available urban stations | 0 | 0 | 4 | 4 | 5 | 9 | 7 | 0 |
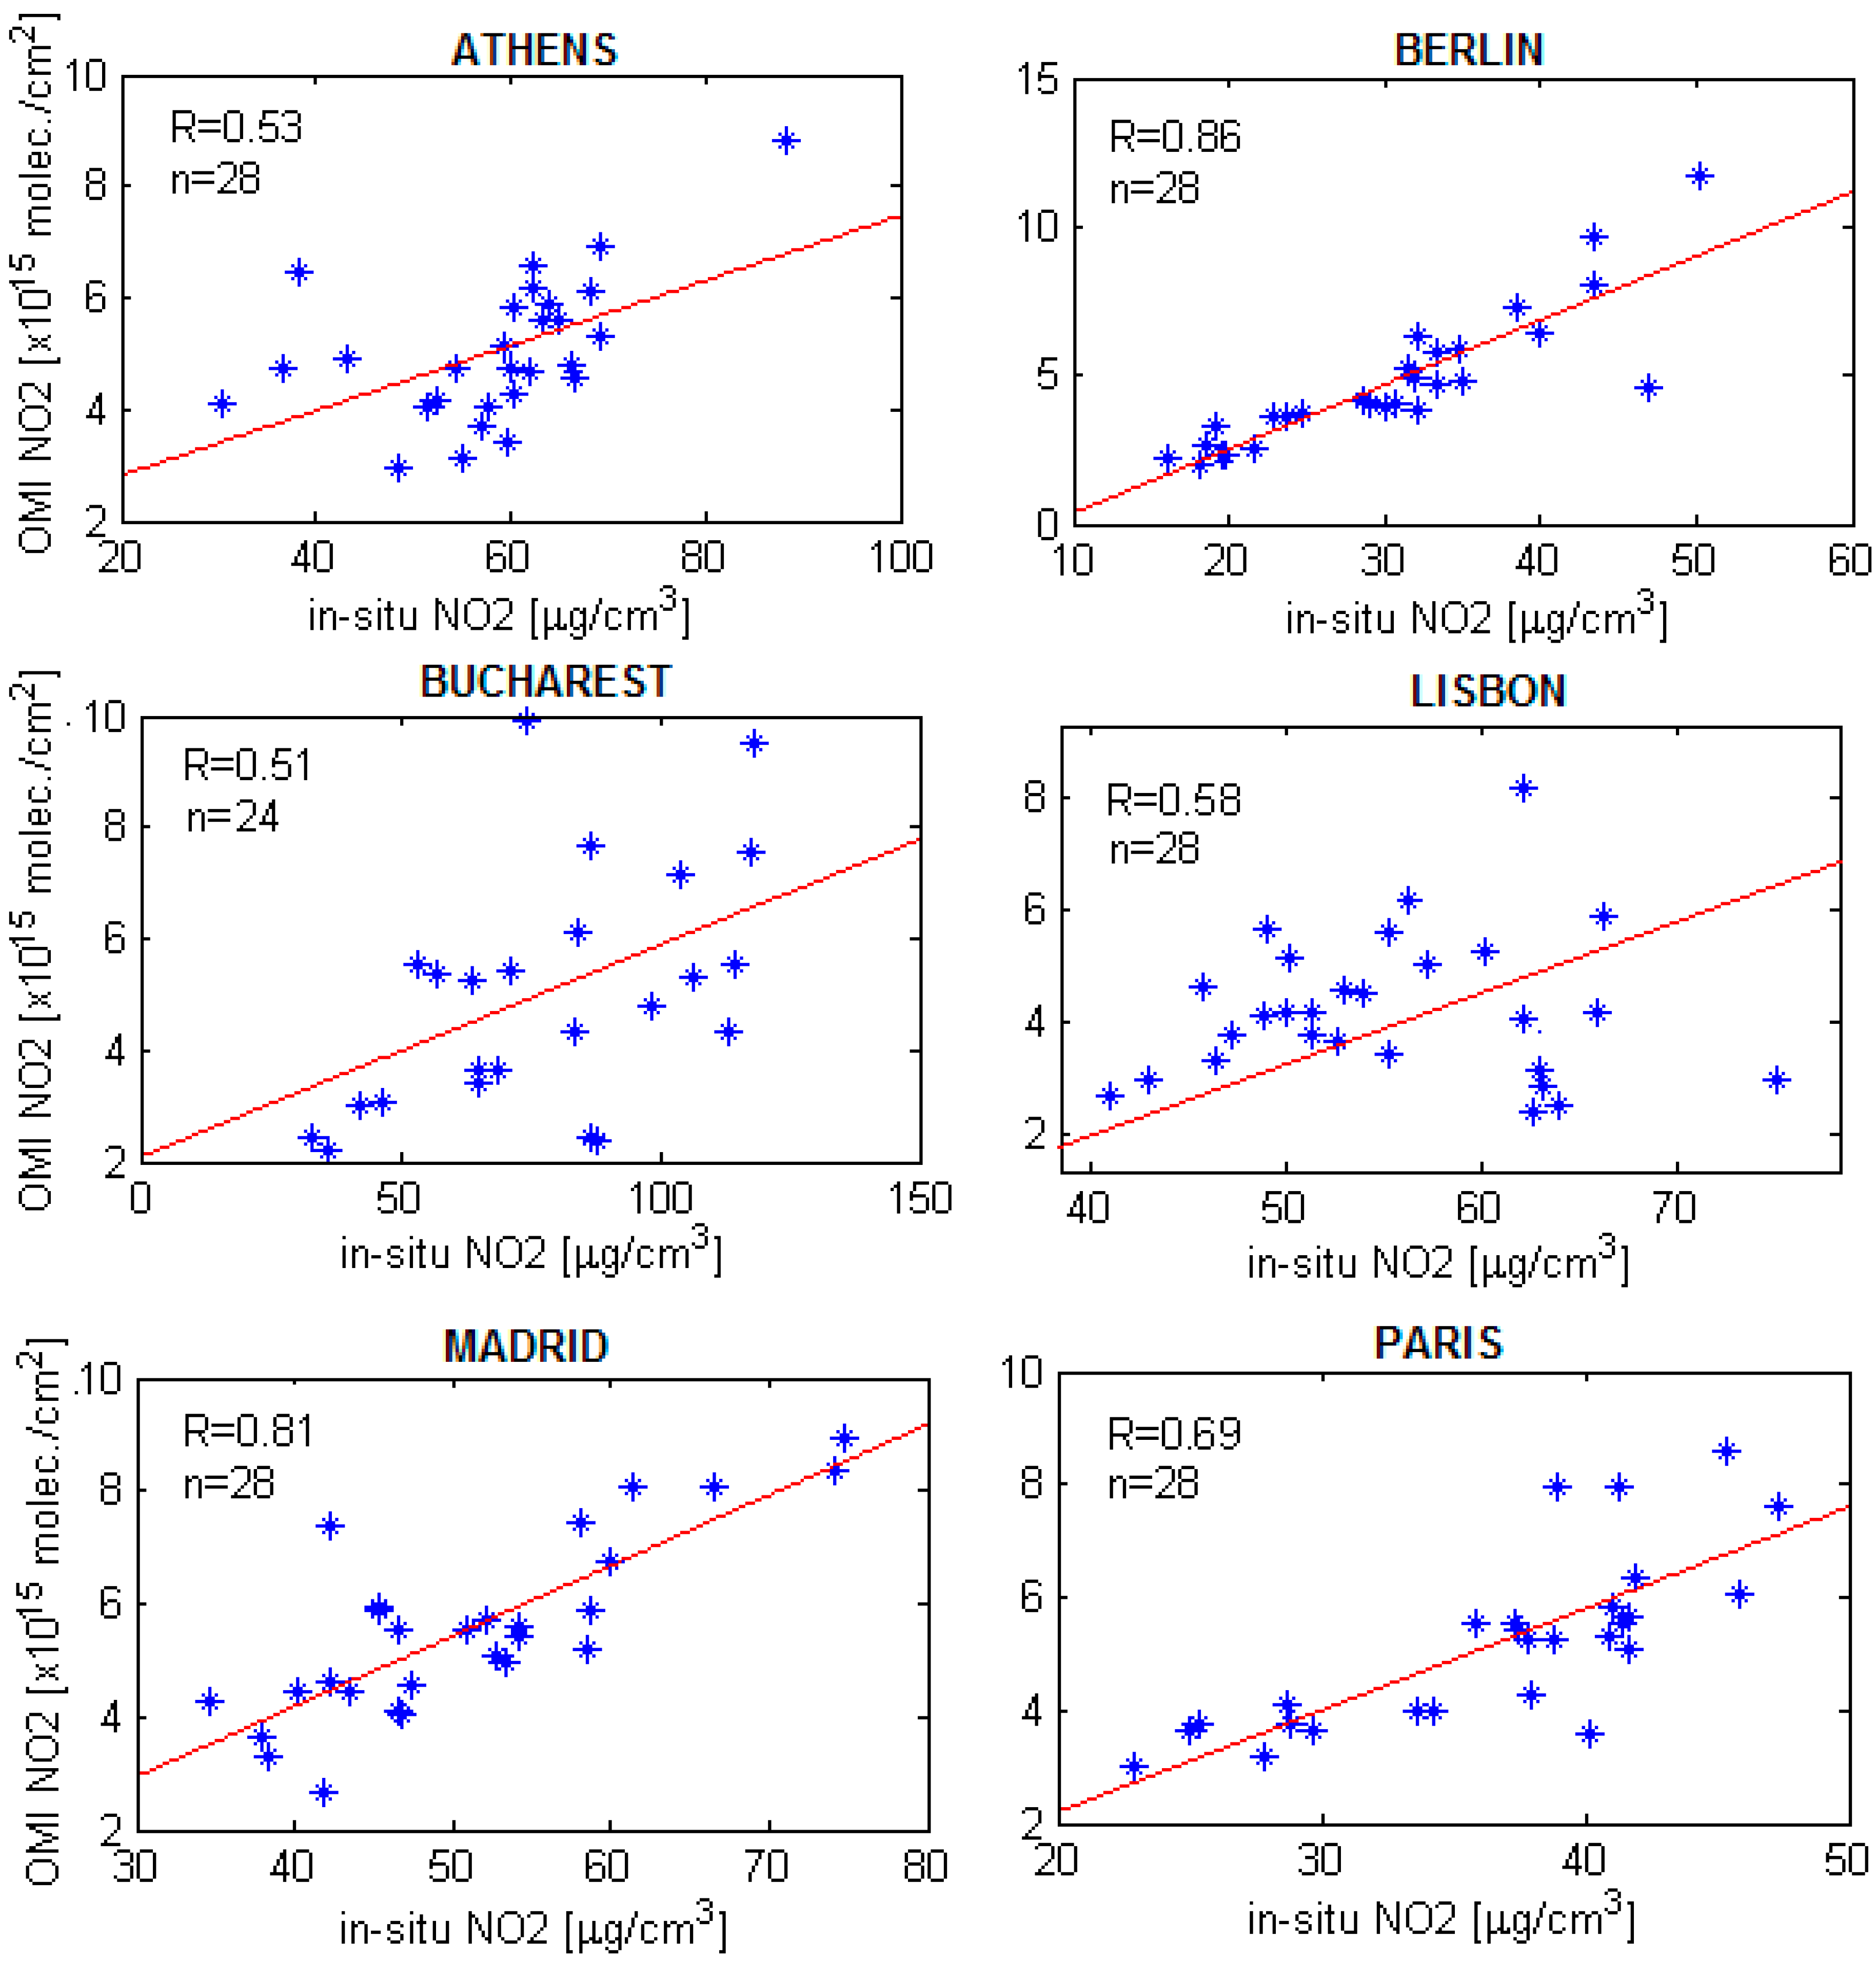
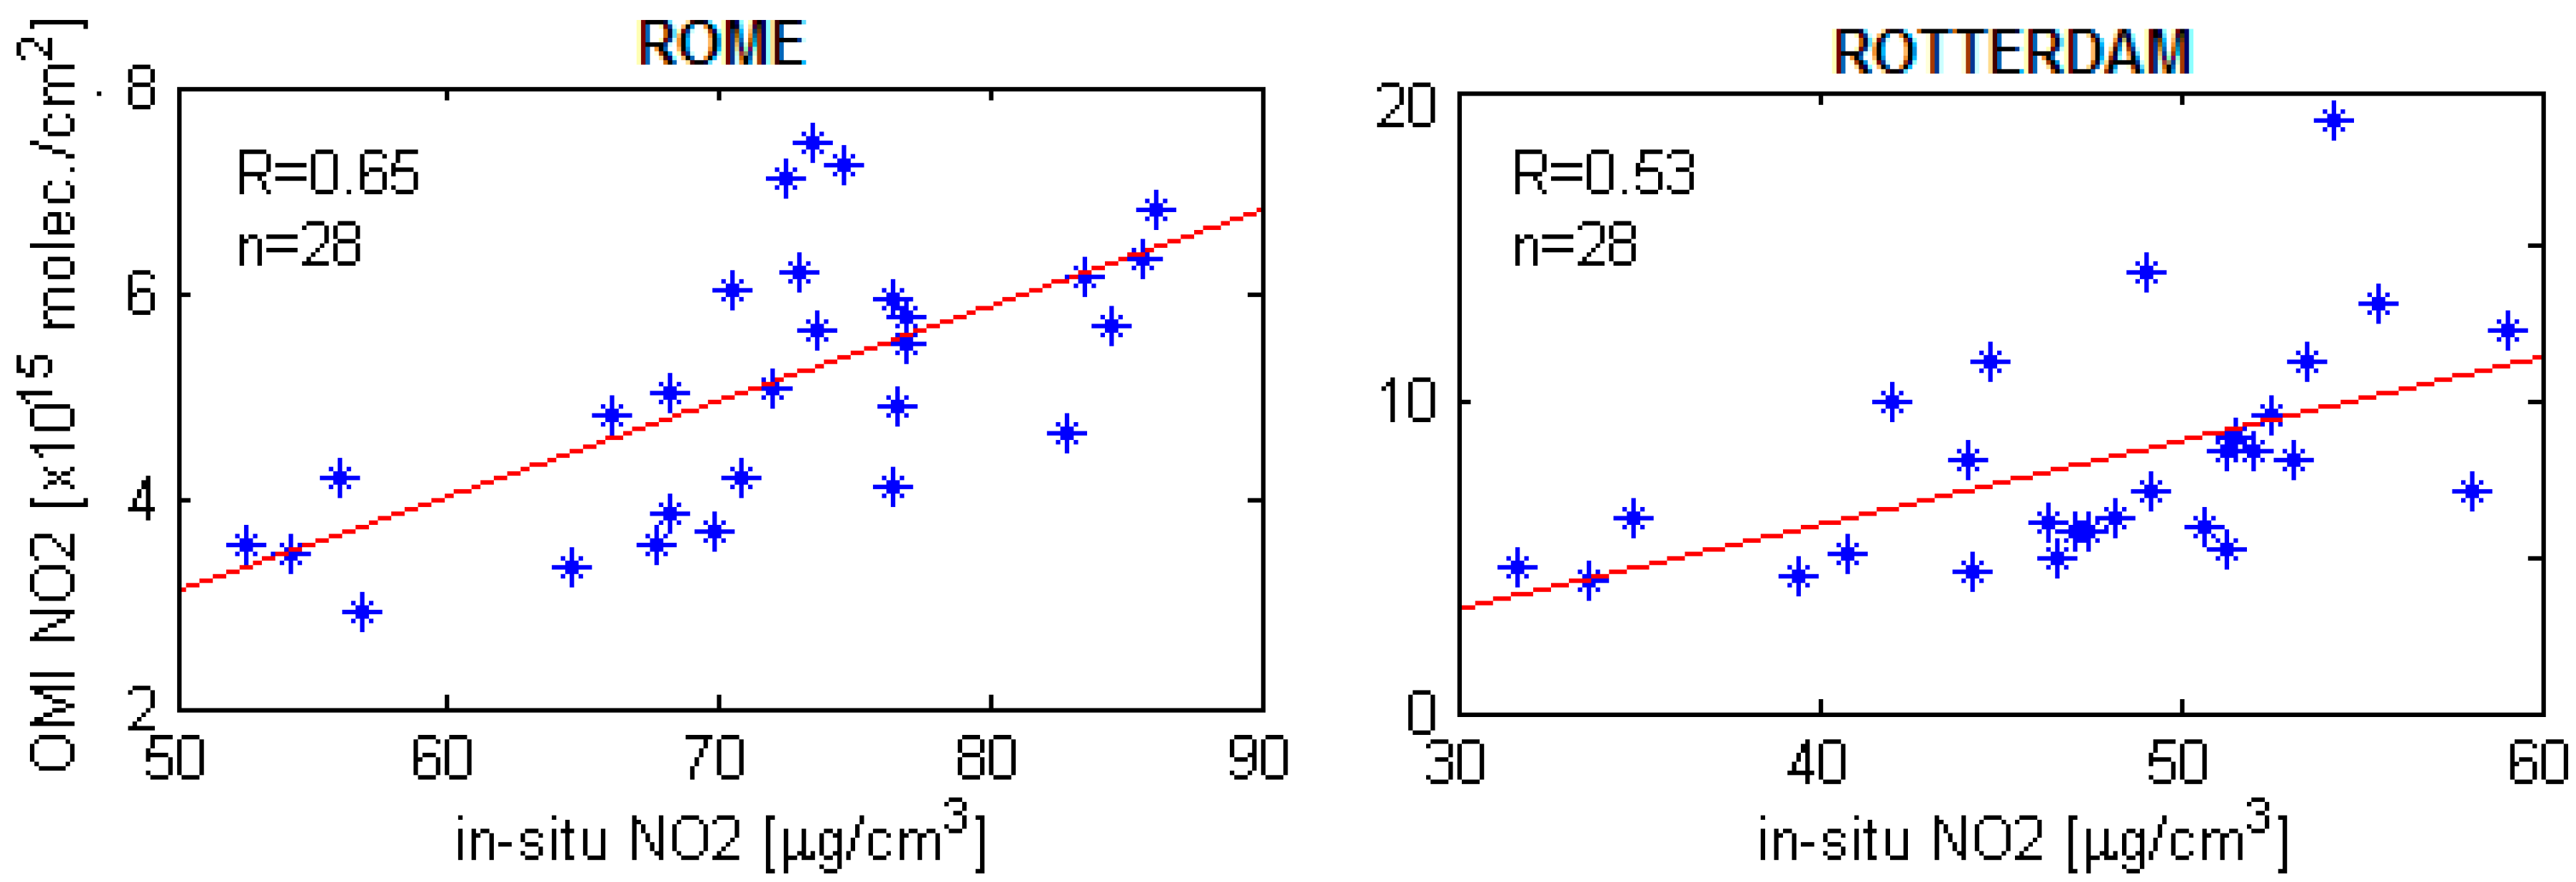
| City | Correlation Coefficient (R) for Each Type of Station | ||
|---|---|---|---|
| T * | U * | A * | |
| Athens | 0.53 | - | - |
| Berlin | 0.86 | 0.84 | 0.87 |
| Bucharest | 0.51 | - | - |
| Lisbon | 0.58 | 0.68 | 0.62 |
| Madrid | 0.81 | 0.75 | 0.86 |
| Paris | 0.69 | 0.74 | 0.79 |
| Rome | 0.65 | 0.86 | 0.81 |
| Rotterdam | 0.53 | - | - |
© 2017 by the authors. Licensee MDPI, Basel, Switzerland. This article is an open access article distributed under the terms and conditions of the Creative Commons Attribution (CC BY) license (http://creativecommons.org/licenses/by/4.0/).
Share and Cite
Paraschiv, S.; Constantin, D.-E.; Paraschiv, S.-L.; Voiculescu, M. OMI and Ground-Based In-Situ Tropospheric Nitrogen Dioxide Observations over Several Important European Cities during 2005–2014. Int. J. Environ. Res. Public Health 2017, 14, 1415. https://doi.org/10.3390/ijerph14111415
Paraschiv S, Constantin D-E, Paraschiv S-L, Voiculescu M. OMI and Ground-Based In-Situ Tropospheric Nitrogen Dioxide Observations over Several Important European Cities during 2005–2014. International Journal of Environmental Research and Public Health. 2017; 14(11):1415. https://doi.org/10.3390/ijerph14111415
Chicago/Turabian StyleParaschiv, Spiru, Daniel-Eduard Constantin, Simona-Lizica Paraschiv, and Mirela Voiculescu. 2017. "OMI and Ground-Based In-Situ Tropospheric Nitrogen Dioxide Observations over Several Important European Cities during 2005–2014" International Journal of Environmental Research and Public Health 14, no. 11: 1415. https://doi.org/10.3390/ijerph14111415