Fatal Pediatric Motor Vehicle Crashes on U.S. Native American Indian Lands Compared to Adjacent Non-Indian Lands: Restraint Use and Injury by Driver, Vehicle, Roadway and Crash Characteristics


Abstract
:1. Introduction
2. Materials and Methods
2.1. Data Source
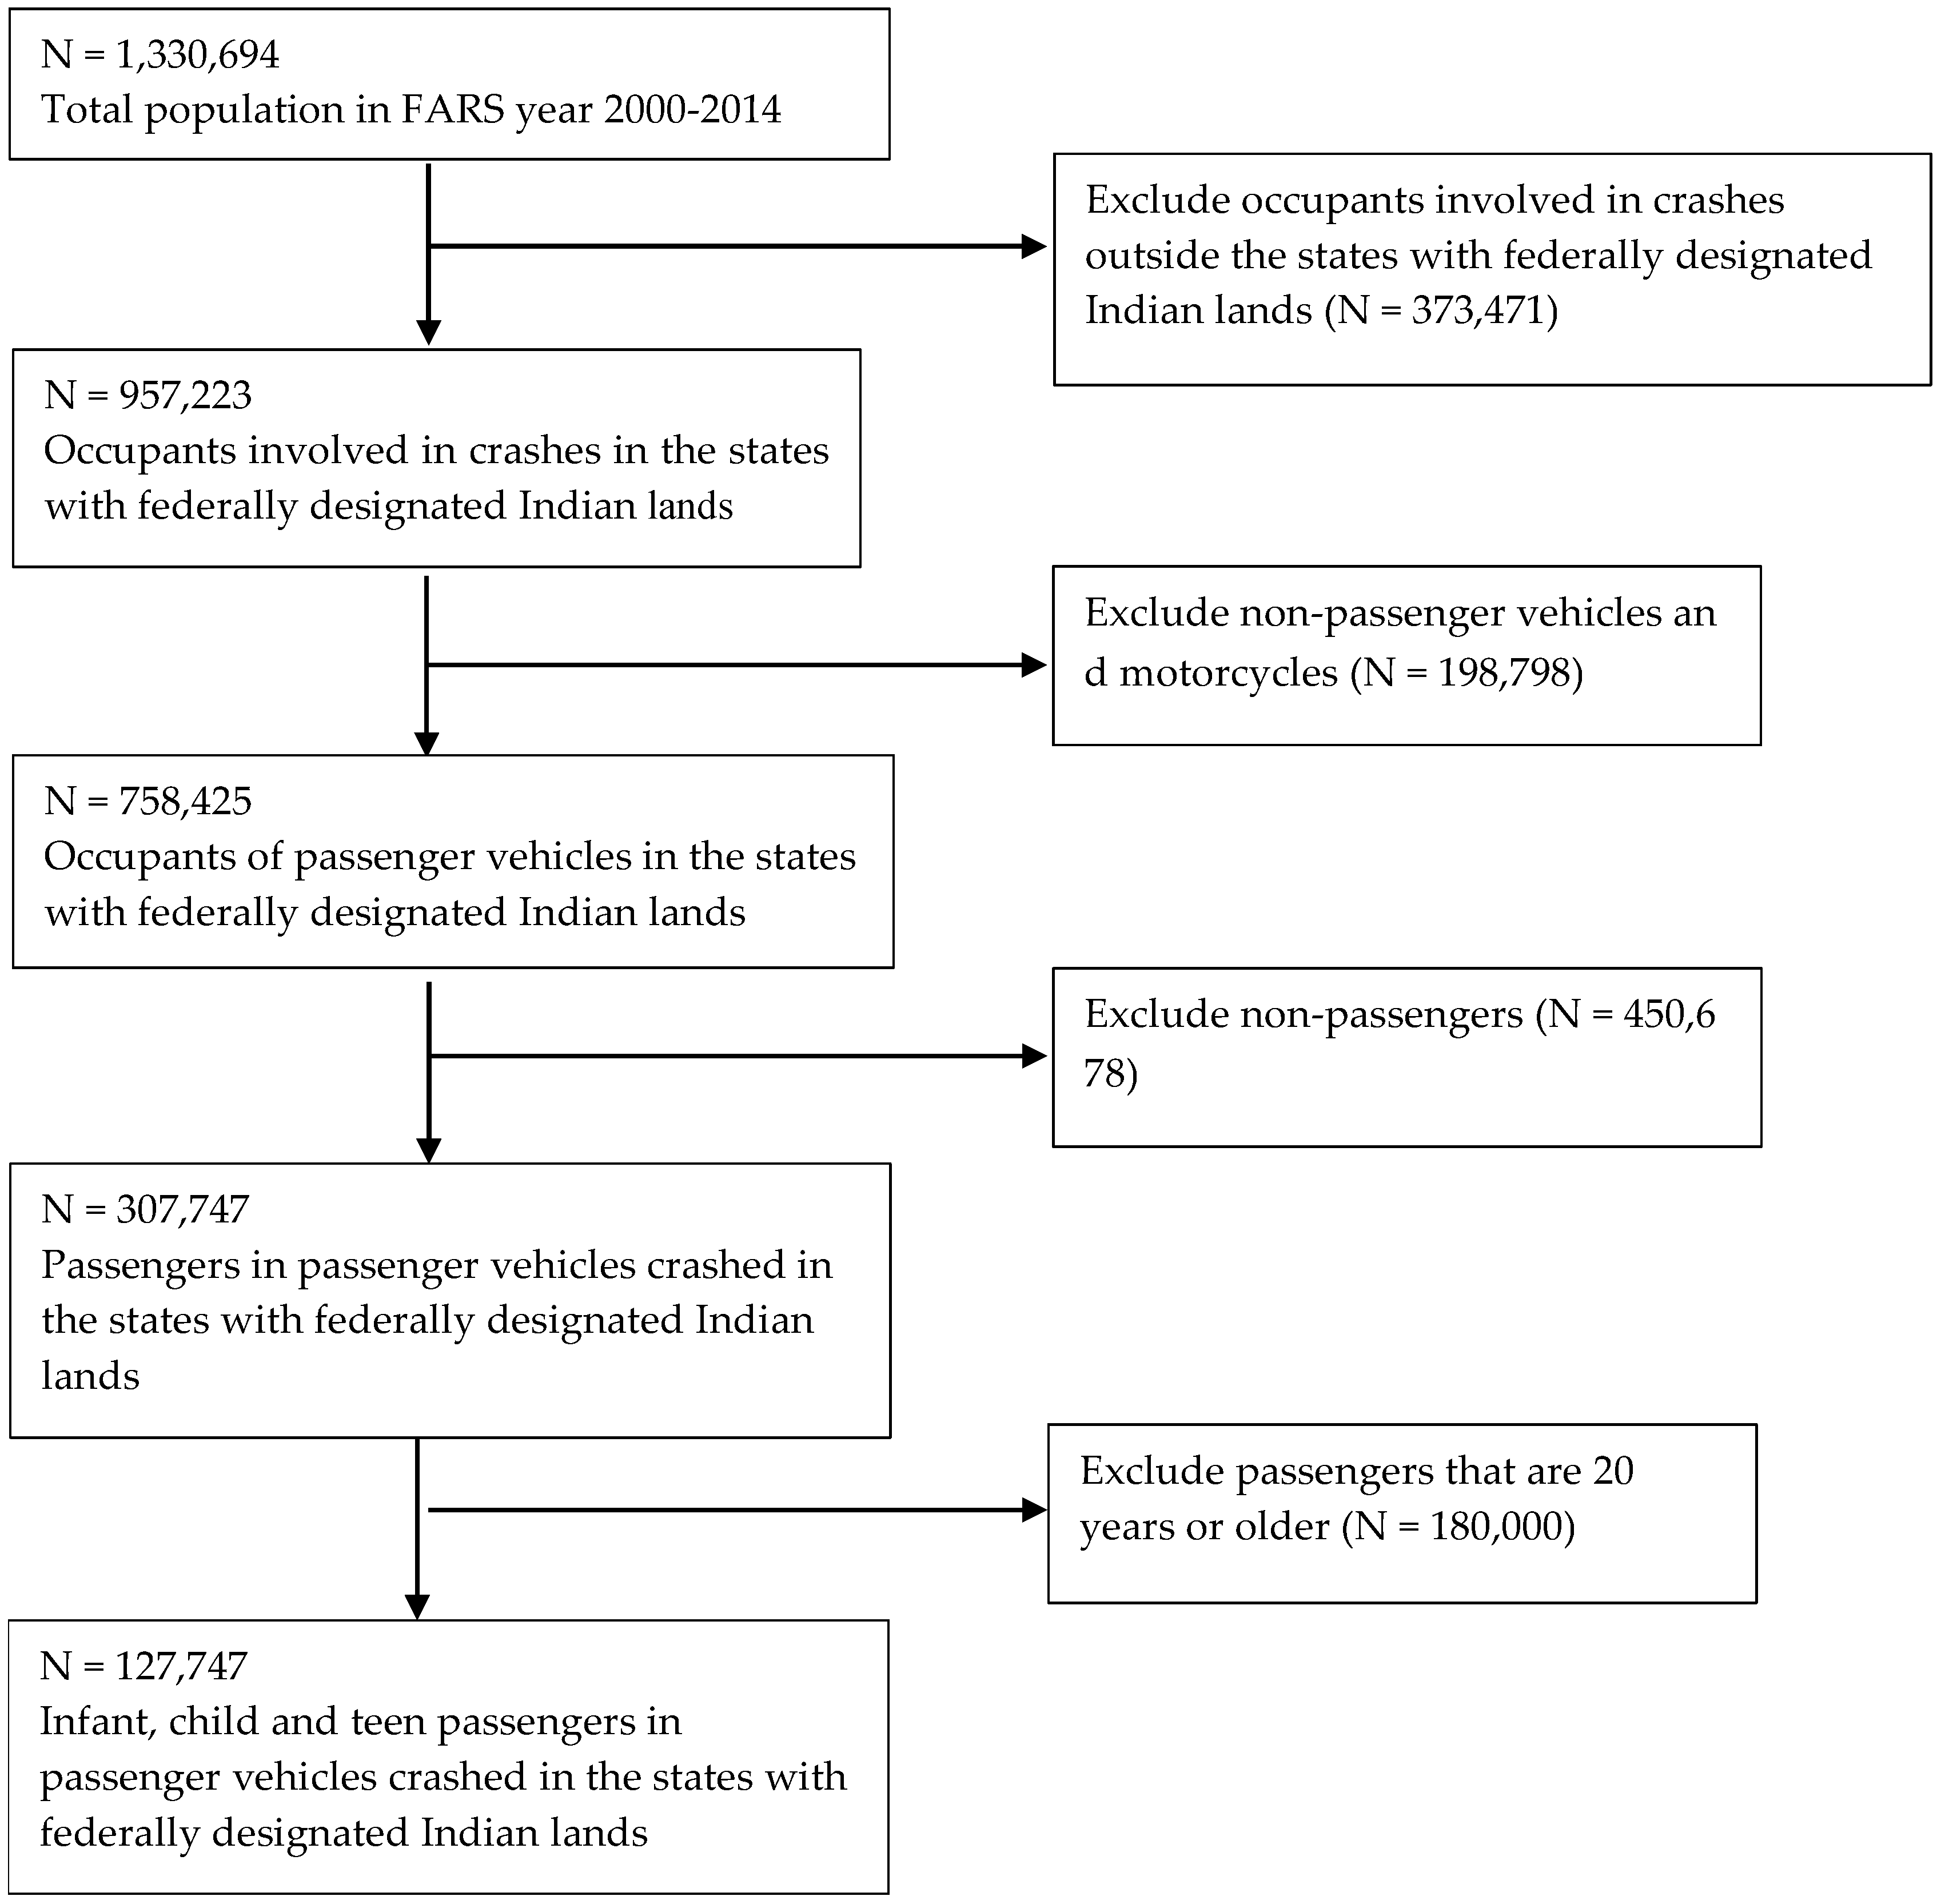
2.2. Study Population
2.3. Variable Classification
2.3.1. Person-Level Characteristics
- Passenger Restraint Status (Outcome). This is a dichotomous variable, restrained or not restrained, with use of any type of restraint being categorized as restrained. Improper restraint use or inappropriate restraint use for the age of the child were not examined outside of the restraint category.
- Passenger Mortality. This was categorized dichotomously from injury severity data in FARS. If the passenger was known to have a fatal injury the passenger was categorized as having died.
- Passenger Age and Gender. Passenger age was categorized as follows: 0–2, 3–8, 9–12, 13–14, 15–17, and 18–19 years. Gender was characterized as male or female.
- Passenger Seating Position. This was comprised of 5 categories—front, rear right or left side, rear middle, other or unknown. Passengers travelling in the sleeper section of the vehicle, cargo area or beyond fifth row of seats were categorized as ‘other’.
- Driver Age and Gender. Driver age was categorized for the 76,428 drivers as follows: less than 20 years old, 20–44, 45–64, and 65 years or older. Gender was characterized as male or female.
- Driver License Validity. License was considered valid at the time of the crash if the driver had a valid learner’s permit, intermediate or full license or a temporary license. A driver’s license was considered invalid if it had been suspended, revoked, expired, or cancelled at the time of crash.
- Driver Drug or Alcohol Status. This variable was categorized as negative, positive or not tested. A positive status included any of the following: (1) Police reported alcohol involvement; (2) driver blood alcohol concentration greater than or equal to 0.01; or (3) the driver otherwise had a positive drug or alcohol test result. If the driver didn’t match any of these criteria and had no missing data in any of these variables, then the driver was categorized as negative. If the records from all those variables indicate that the driver was not tested, then the driver was categorized as not tested and alcohol and drug status as unknown/missing.
- Driver Previous Moving Violation. This was a dichotomous variable of yes or no based on having received a citation within 3 years of the crash date for previously driving while intoxicated, speeding or another moving violation.
- Driver Race and Ethnicity in Death Certificate. Driver race was categorized as White, non-Hispanic; Black, non-Hispanic, Hispanic, White or Black; Native American; Asian or Pacific Islander; and Multiple/other. Race and ethnicity were available only for occupants who died.
2.3.2. Vehicle-Level Characteristics
- Vehicle Model Year. Vehicle model year was examined as a categorical variable (<1994, 1994–1997, 1998–2004, 2005–2008, 2009–2011, 2012–2014) [21].
- Vehicle Model Type. Vehicle type was categorized as passenger car, utility vehicle (SUV), van or pickup truck. Vehicles such as large trucks, motorcycles and buses were excluded.
2.3.3. Crash-Level Characteristics
- Day/night. Day was defined as 6:00 a.m. to 5:59 p.m. and night was defined as 6:00 p.m. to 5:59 a.m.
- Weekday/weekend. Social weekend was defined as Friday at 5:00 p.m. to Sunday at 4:59 p.m., and times outside this were categorized as weekday [22].
- Rollover or Ejection. If the vehicle and the occupants experienced either rollover or ejection or both, the data was categorized as having had rollover or ejection.
- Manner of Collision. Manner of collision was analyzed by categorizing the collision types as rear-end, head-on, angle, sideswipe or other. Non-collision was used as a category for the crashes that did not involve collision with motor vehicle in transport.
2.3.4. Road Characteristics
- Number of Lanes. Number of lanes was categorized as one, two, three, four, five and six or more.
- Trafficway. The categories for this variable were one-way; two-way, divided; two-way, not divided; and other. Both unprotected median and positive median barriers were considered divided.
- Route Signing. This variable was categorized in FARS as interstate, highway, country road, local street or other.
- Traffic Devices and Signs. This was categorized as no controls, traffic signals, regulatory signs or other.
- Traffic Control Device Functioning. Three categories were used—not functioning properly, functioning properly and no controls.
2.4. Statistical Analysis
3. Results
3.1. Driver Characteristics
3.2. Passenger Characteristics
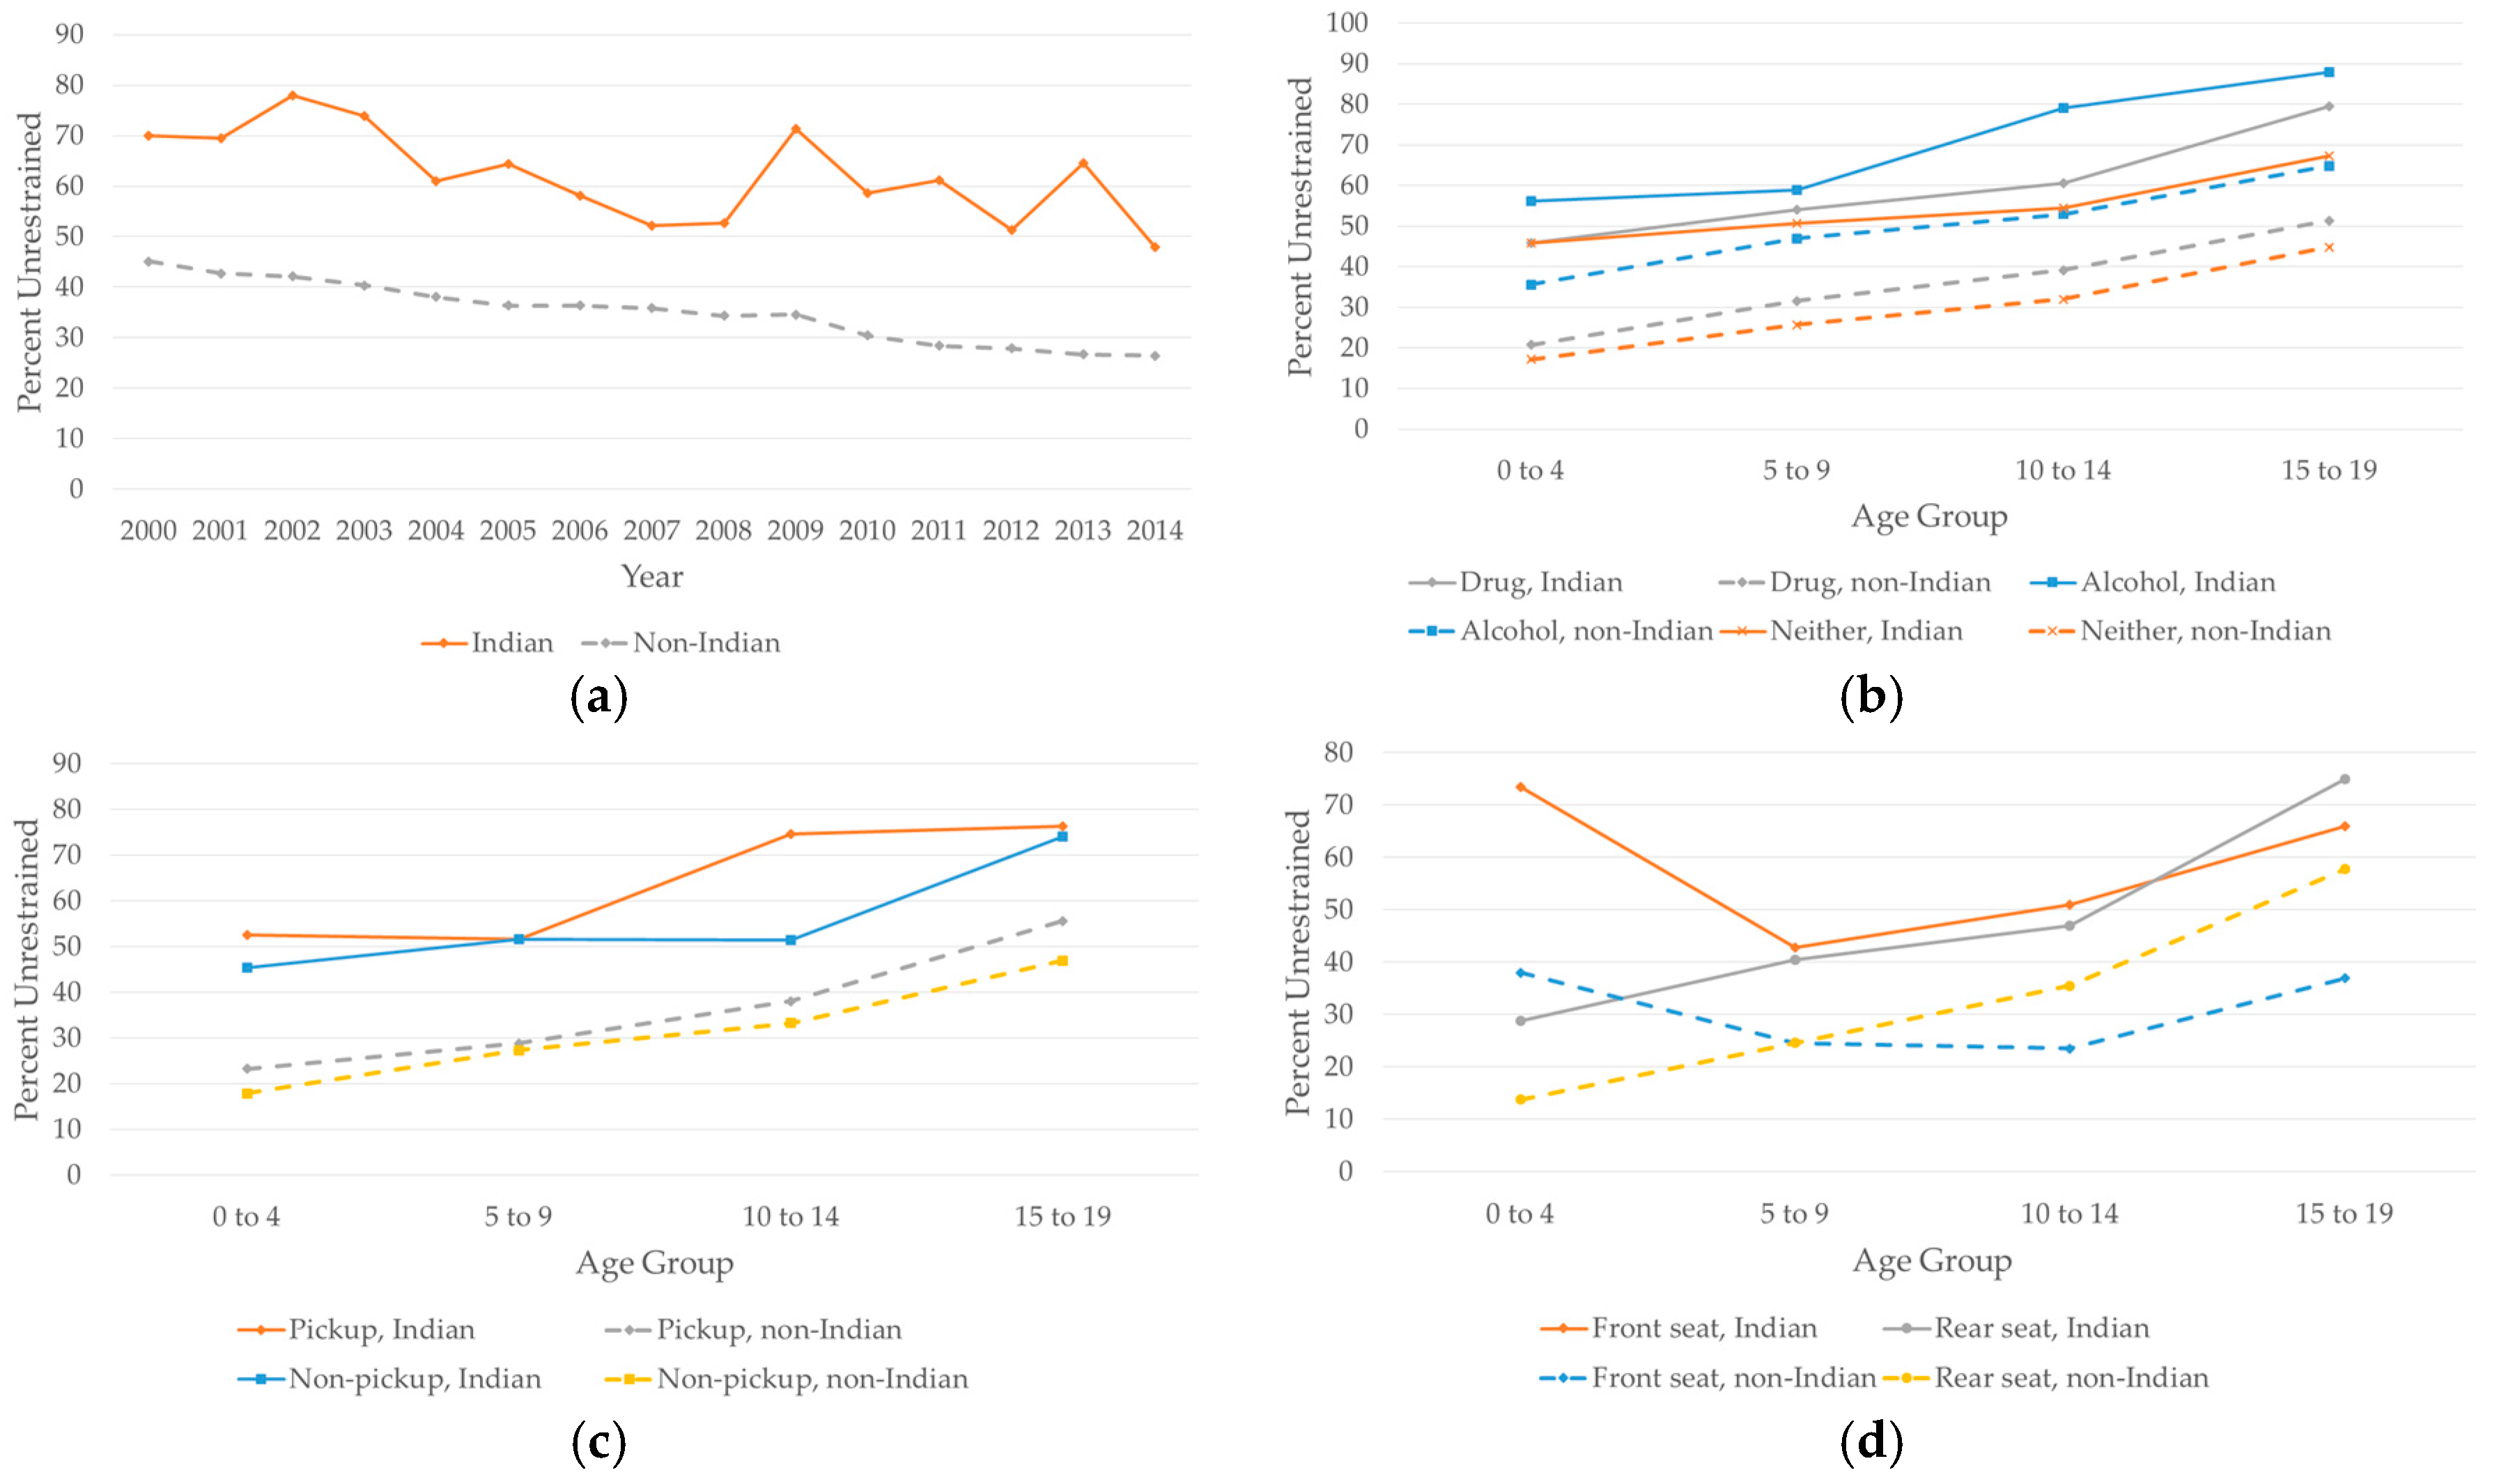
3.2.1. Passenger Restraint Use for Indian Lands
3.2.2. Passenger Restraint Use for Non-Indian Lands
3.3. Vehicle Characteristics
3.4. Crash Characteristics
3.5. Roadway Characteristics
4. Discussion
5. Conclusions
Acknowledgments
Author Contributions
Conflicts of Interest
References
- Murphy, T.; Pokhrel, P.; Worthington, A.; Billie, H.; Sewell, M.; Bill, N. Unintentional injury mortality among American Indians and Alaska Natives in the United States, 1990–2009. Am. J. Public Health 2014, 104, S470–S480. [Google Scholar] [CrossRef] [PubMed]
- Centers for Disease Control and Prevention. Web-based Injury Statistics Query and Reporting System (WISQARS). Available online: https://www.cdc.gov/injury/wisqars/ (accessed on 16 June 2016).
- Pressley, J.C.; Barlow, B.; Kendig, T.; Paneth-Pollak, R. Twenty-year trends in fatal injuries to very young children: The persistence of racial disparities. Pediatrics 2007, 119, e875–e884. [Google Scholar] [CrossRef] [PubMed]
- Ernat, J.J.; Knox, J.B.; Wimberly, R.L.; Riccio, A.I. The effects of restraint type on pattern of spine injury in children. J. Pediatr. Orthop. 2016, 36, 594–601. [Google Scholar] [CrossRef] [PubMed]
- Johnston, C.; Rivara, F.P.; Soderberg, R. Children in car crashes: Analysis of data for injury and use of restraints. Pediatrics 1994, 93, 960–965. [Google Scholar] [PubMed]
- Valent, F.; McGwin, G.; Hardin, W.; Johnston, C.; Rue, L.W. Restraint use and injury patterns among children involved in motor vehicle collisions. J. Trauma Acute Care Surg. 2002, 52, 745–751. [Google Scholar] [CrossRef]
- Lapidus, J.A.; Smith, N.H.; Ebel, B.E.; Romero, F.C. Restraint use among northwest American Indian children traveling in motor vehicles. Am. J. Public Health 2005, 95, 1982–1988. [Google Scholar] [CrossRef] [PubMed]
- Smith, M.; Berger, L. Assessing community child passenger safety efforts in three northwest tribes. Inj. Prev. 2002, 8, 289–292. [Google Scholar] [CrossRef] [PubMed]
- Iragavarapu, V.; Carlson, P.; Schertz, G. Review of Tribal Transportation Safety. Transp. Res. Rec. J. Transp. Res. Board 2015, 2531, 153–160. [Google Scholar] [CrossRef]
- Leaf, W.; Solomon, M.G. Safety Belt Use Estimate for Native American Tribal Reservations. Available online: http://ntl.bts.gov/lib/27000/27000/27032/textfinal.pdf (accessed on 21 June 2016).
- National Highway Traffic Safety Administration. Safety Belt Use Estimate for Native American Tribal Reservations. Available online: https://www.nhtsa.gov/document/safety-belt-use-estimate-native-american-tribal-reservations (accessed on 20 June 2016).
- Huang, Y.; Liu, C.; Pressley, J.C. Child restraint use and driver screening in fatal crashes involving drugs and alcohol. Pediatrics 2016, 138, e20160319. [Google Scholar] [CrossRef] [PubMed]
- Maio, R.F.; Waller, P.F.; Blow, F.C.; Hill, E.M.; Singer, K.M. Alcohol abuse/dependence in motor vehicle crash victims presenting to the emergency department. Acad. Emer. Med. 1997, 4, 256–262. [Google Scholar] [CrossRef]
- Agran, P.F.; Anderson, C.L.; Winn, D.G. Factors associated with restraint use of children in fatal crashes. Pediatrics 1998, 102, e39. [Google Scholar] [CrossRef] [PubMed]
- Poindexter, K. Fatal Motor Vehicle Crashes on Indian Reservations, 1975–2002. Available online: https://crashstats.nhtsa.dot.gov/Api/Public/ViewPublication/809727 (accessed on 18 August 2017).
- Jim, M.A.; Arias, E.; Seneca, D.S.; Hoopes, M.J.; Jim, C.C.; Johnson, N.J.; Wiggins, C.L. Racial misclassification of American Indians and Alaska Natives by Indian Health Service contract health service delivery area. Am. J. Public Health 2014, 104, S295–S302. [Google Scholar] [CrossRef] [PubMed]
- Stevens, J.A.; Dellinger, A.M. Motor vehicle and fall related deaths among older Americans 1990–98: Sex, race, and ethnic disparities. Inj. Prev. 2002, 8, 272–275. [Google Scholar] [CrossRef] [PubMed]
- Sugarman, J.R.; Soderberg, R.; Gordon, J.E.; Rivara, F.P. Racial misclassification of American Indians: Its effect on injury rates in Oregon, 1989 through 1990. Am. J. Public Health 1993, 83, 681–684. [Google Scholar] [CrossRef] [PubMed]
- National Highway Traffic Safety Administration. Fatality Analysis Reporting System (FARS) Analytical User’s Manual 1975–2014. Available online: https://crashstats.nhtsa.dot.gov/Api/Public/Publication/812315 (accessed on 18 August 2017).
- National Conference of State Legislatures. Federal and State Recognized Tribes. Available online: http://www.ncsl.org/research/state-tribal-institute/list-of-federal-and-state-recognized-tribes.aspx#federal (accessed on 18 August 2017).
- Ryb, G.E.; Dischinger, P.C.; McGwin, G.; Griffin, R.L. Crash-related mortality and model year: Are newer vehicles safer? In Proceedings of the Annals of Advances in Automotive Medicine Annual Scientific Conference, Paris, France, 3–5 October 2011; Association for the Advancement of Automotive Medicine: Chicago, IL, USA, 2011; p. 113. [Google Scholar]
- Carpenter, D.; Pressley, J.C. Graduated driver license nighttime compliance in US teen drivers involved in fatal motor vehicle crashes. Accid. Anal. Prev. 2013, 56, 110–117. [Google Scholar] [CrossRef] [PubMed]
- National Highway Traffic Safety Administration. Car Seat Recommendations for Children. Available online: https://www.nhtsa.gov/DOT/NHTSA/Traffic%20Injury%20Control/Articles/Associated%20Files/4StepsFlyer.pdf (accessed on 18 August 2017).
- Governors Highway Safety Association. Child Passenger Safety Laws. Available online: http://www.ghsa.org/html/stateinfo/laws/childsafety_laws.html (accessed on 18 August 2017).
- SAS Institute Inc. Base SAS® 9.4 Procedures Guide: Statistical Procedures. Available online: https://support.sas.com/documentation/cdl/en/procstat/66703/PDF/.../procstat.pdf (accessed on 18 August 2017).
- Beck, L.F.; Downs, J.; Stevens, M.R.; Sauber-Schatz, E.K. Rural and urban differences in passenger-vehicle—Occupant deaths and seat belt use among adults—United States, 2014. MMWR. Surveill. Summ. 2017, 66, 1–13. [Google Scholar] [CrossRef] [PubMed]
- Decina, L.E.; Lococo, K.H. Child restraint system use and misuse in six states. Accid. Anal. Prev. 2005, 37, 583–590. [Google Scholar] [CrossRef] [PubMed]
- Miller, T.R.; Spicer, R.S.; Lestina, D.C. Who is driving when unrestrained children and teenagers are hurt? Accid. Anal. Prev. 1998, 30, 839–849. [Google Scholar] [CrossRef]


| Variables | Indian Lands, n (%) * | Non-Indian Lands, n (%) * | Total * | Chi-Square (p-Value) |
|---|---|---|---|---|
| Total | 1667 (1.30) | 126,080 (98.70) | 127,747 | |
| Driver Characteristics | 868 (1.14) | 75,359 (98.86) | 76,227 | |
| Driver age (years) | 182.2 (<0.0001) | |||
| <20 | 255 (29.38) | 22,242 (29.51) | 22,497 (29.51) | |
| 20 to 44 | 490 (56.45) | 41,523 (55.10) | 42,013 (55.12) | |
| 45 to 64 | 87 (10.02) | 9607 (12.75) | 9694 (12.72) | |
| ≥65 | 11 (1.27) | 1760 (2.34) | 1771 (2.32) | |
| Unknown | 25 (2.88) | 227 (0.30) | 252 (0.33) | |
| Driver gender | 85.8 (<0.0001) | |||
| Male | 502 (57.84) | 44,716 (59.34) | 45,218 (59.32) | |
| Female | 354 (40.78) | 30,537 (40.52) | 30,891 (40.53) | |
| Unknown | 12 (1.38) | 106 (0.14) | 118 (0.15) | |
| Driver belt status | 392.7 (<0.0001) | |||
| Restrained | 319 (36.75) | 51,065 (67.76) | 51,384 (67.41) | |
| Unrestrained | 416 (47.93) | 19,642 (26.06) | 20,058 (26.31) | |
| Unknown | 133 (15.32) | 4652 (6.16) | 4785 (6.28) | |
| Injury severity | 127.4 (<0.0001) | |||
| Died | 297 (34.22) | 22,013 (29.21) | 22,310 (29.27) | |
| Injured | 423 (48.73) | 36,780 (48.81) | 37,203 (48.81) | |
| Not injured | 126 (14.52) | 16,283 (21.61) | 16,409 (21.53) | |
| Unknown | 22 (2.53) | 283 (0.37) | 305 (0.40) | |
| License validity | 398.2 (<0.0001) | |||
| Valid | 504 (57.53) | 62,305 (82.47) | 62,809 (82.18) | |
| Invalid | 313 (35.73) | 11,909 (15.76) | 12,222 (15.99) | |
| Unknown | 59 (6.74) | 1338 (1.77) | 1397 (1.83) | |
| Drug or alcohol tests, tested only | 1.5 (0.2270) | |||
| Tested, negative | 0 (0.00) | 93 (0.43) | 93 (0.42) | |
| Tested, positive | 340 (100.00) | 21,661 (99.57) | 22,001 (99.58) | |
| Race in death certificate, w/o N/A | 4258.0 (<0.0001) | |||
| White, non-Hispanic | 47 (15.82) | 12,296 (55.85) | 12,343 (55.32) | |
| Black, non-Hispanic | 1 (0.34) | 2636 (11.97) | 2637 (11.82) | |
| Hispanic, White or Black | 33 (11.11) | 3692 (16.77) | 3725 (16.70) | |
| Native American | 192 (64.65) | 431 (1.96) | 623 (2.79) | |
| Asian or Pacific Islander | 1 (0.34) | 473 (2.15) | 474 (2.12) | |
| Multiple/Other | 0 (0.00) | 238 (1.08) | 238 (1.07) | |
| Unknown | 23 (7.74) | 2249 (10.22) | 2272 (10.18) | |
| Previous moving violation combined | 305.5 (<0.0001) | |||
| Yes | 207 (23.63) | 21,792 (28.84) | 21,999 (28.78) | |
| No | 548 (62.56) | 51,342 (67.96) | 51,890 (67.89) | |
| Unknown | 121 (13.81) | 2418 (3.20) | 2539 (3.32) | |
| Passenger Characteristics | 1667 (1.30) | 126,080 (98.70) | 127,747 | |
| Passenger age (years) | 8.3 (0.1405) | |||
| 0 to 2 | 173 (10.38) | 13,526 (10.73) | 13,699 (10.72) | |
| 3 to 8 | 323 (19.38) | 26,735 (21.20) | 27,058 (21.18) | |
| 9 to 12 | 217 (13.02) | 17,245 (13.68) | 17,462 (13.67) | |
| 13 to 14 | 176 (10.56) | 11,383 (9.03) | 11,559 (9.05) | |
| 15 to 17 | 431 (25.85) | 32,022 (25.40) | 32,453 (25.40) | |
| 18 to 19 | 347 (20.82) | 25,169 (19.96) | 25,516 (19.97) | |
| Passenger belt status | 470.3 (<0.0001) | |||
| Restrained | 551 (33.05) | 74,764 (59.30) | 75,315 (58.96) | |
| Unrestrained | 919 (55.13) | 42,892 (34.02) | 43,811 (34.40) | |
| Unknown | 197 (11.82) | 8424 (6.68) | 8621 (6.75) | |
| Injury severity | 79.7 (<0.0001) | |||
| Died | 383 (22.98) | 27,869 (22.10) | 28,252 (22.12) | |
| Injured | 1006 (60.35) | 69,296 (54.96) | 70,302 (55.03) | |
| Not injured | 264 (15.84) | 28,679 (22.75) | 28,943 (22.66) | |
| Unknown | 14 (0.84) | 236 (0.19) | 250 (0.20) | |
| Seating position | 531.2 (<0.0001) | |||
| Front | 514 (30.83) | 44,751 (35.49) | 45,265 (35.43) | |
| Rear side | 598 (35.87) | 56,291 (44.65) | 56,889 (44.53) | |
| Rear middle | 193 (11.58) | 14,948 (11.86) | 15,141 (11.85) | |
| Other | 94 (5.64) | 4394 (3.49) | 4488 (3.51) | |
| Unknown | 268 (16.08) | 5696 (4.52) | 5964 (4.67) | |
| Vehicle Characteristics | 876 (1.15) | 75,552 (98.85) | 76,428 | |
| Vehicle model year | 126.1 (<0.0001) | |||
| <1994 | 240 (27.40) | 18,029 (23.86) | 18,269 (23.90) | |
| 1994–1997 | 189 (21.58) | 16,435 (21.75) | 16,624 (21.75) | |
| 1998–2004 | 328 (37.44) | 31,118 (41.19) | 31,446 (41.14) | |
| 2005–2008 | 91 (10.39) | 7707 (10.20) | 7798 (10.20) | |
| 2009–2011 | 7 (0.80) | 1427 (1.89) | 1434 (1.88) | |
| 2012–2014 | 8 (0.91) | 741 (0.98) | 749 (0.98) | |
| Unknown | 13 (1.48) | 95 (0.13) | 108 (0.14) | |
| Model type | 49.1 (<0.0001) | |||
| Passenger cars | 386 (44.06) | 39,025 (51.65) | 39,411 (51.57) | |
| SUV | 177 (20.21) | 16,419 (21.73) | 16,596 (21.71) | |
| Vans | 88 (10.05) | 7273 (9.63) | 7361 (9.63) | |
| Pickups | 225 (25.68) | 12,835 (16.99) | 13,060 (17.09) | |
| Crash Characteristics | 876 (1.15) | 75,552 (98.85) | 76,428 | |
| Day/night | 22.4 (<0.0001) | |||
| Day | 404 (46.12) | 38,552 (51.03) | 38,956 (50.97) | |
| Night | 289 (32.99) | 25,500 (33.75) | 25,789 (33.74) | |
| Unknown | 183 (20.89) | 11,500 (15.22) | 11,683 (15.29) | |
| Weekday/weekend | 22.6 (<0.0001) | |||
| Weekday | 483 (55.14) | 43,991 (58.23) | 44,474 (58.19) | |
| Weekend | 389 (44.41) | 31,513 (41.71) | 31,902 (41.74) | |
| Unknown | 4 (0.46) | 48 (0.06) | 52 (0.07) | |
| Rollover | 318.2 (<0.0001) | |||
| Yes | 474 (54.11) | 20,458 (27.08) | 20,932 (27.39) | |
| No | 402 (45.89) | 55,094 (72.92) | 55,496 (72.61) | |
| Ejected | 328.7 (<0.0001) | |||
| Yes | 199 (22.93) | 8377 (11.12) | 8576 (11.25) | |
| No | 635 (73.16) | 66,627 (88.41) | 67,262 (88.24) | |
| Unknown | 34 (3.92) | 355 (0.47) | 389 (0.51) | |
| Rollover or ejection | 269.9 (<0.0001) | |||
| Yes | 502 (57.31) | 24,278 (32.13) | 24,780 (32.42) | |
| No | 362 (41.32) | 50,899 (67.37) | 51,261 (67.07) | |
| Unknown | 12 (1.37) | 375 (0.50) | 387 (0.51) | |
| Manner of collision | 176.2 (<0.0001) | |||
| Non-collision | 555 (63.36) | 33,642 (44.53) | 34,197 (44.14) | |
| Rear-end | 47 (5.37) | 5946 (7.87) | 5993 (7.84) | |
| Head-on | 116 (13.24) | 10,263 (13.58) | 10,379 (13.58) | |
| Angle | 122 (13.93) | 22,759 (30.12) | 22,881 (29.94) | |
| Sideswipe | 24 (2.74) | 2561 (3.39) | 2585 (3.38) | |
| Other | 5 (0.57) | 265 (0.35) | 270 (0.35) | |
| Unknown | 7 (0.80) | 116 (0.15) | 123 (0.16) | |
| Roadway Characteristics | 876 (1.15) | 75,552 (98.85) | 76,428 | |
| Number of lanes | 65.9 (<0.0001) | |||
| Non-trafficway | 0 (0.00) | 76 (0.10) | 76 (0.10) | |
| One | 4 (0.46) | 196 (0.26) | 200 (0.26) | |
| Two | 209 (23.86) | 12,540 (16.60) | 12,749 (16.68) | |
| Three | 3 (0.34) | 1613 (2.13) | 1616 (2.11) | |
| Four | 7 (0.80) | 2467 (3.27) | 2474 (3.24) | |
| Five | 2 (0.23) | 481 (0.64) | 483 (0.63) | |
| Six or more | 0 (0.00) | 353 (0.47) | 353 (0.46) | |
| Unknown | 651 (74.32) | 57,826 (76.54) | 58,477 (76.51) | |
| Trafficway (one/two-way) | 45.0 (<0.0001) | |||
| Non-trafficway | 0 (0.00) | 76 (0.10) | 76 (0.10) | |
| One-way | 3 (0.34) | 187 (0.25) | 190 (0.25) | |
| Two-way, divided | 36 (4.11) | 6118 (8.10) | 6154 (8.05) | |
| Two-way, not divided | 186 (21.23) | 11,190 (14.81) | 11,376 (14.88) | |
| Other | 0 (0.00) | 187 (0.25) | 187 (0.24) | |
| Unknown | 651 (74.32) | 57,794 (76.50) | 58,445 (76.47) | |
| Traffic devices and signs | 40.8 (<0.0001) | |||
| No controls | 210 (23.97) | 13,728 (18.17) | 13,938 (18.27) | |
| Traffic signals | 0 (0.00) | 1855 (2.46) | 1855 (2.43) | |
| Regulatory signs | 16 (1.83) | 2049 (2.71) | 2065 (2.70) | |
| Other | 2 (0.23) | 145 (0.19) | 147 (0.19) | |
| Unknown | 648 (73.97) | 57,775 (76.47) | 58,423 (76.44) | |
| Route signing | 417.8 (<0.0001) | |||
| Interstate | 59 (7.13) | 10,929 (14.53) | 10,988 (14.45) | |
| Highway | 416 (50.30) | 30,547 (40.62) | 30,963 (40.72) | |
| Country road | 180 (21.77) | 14,976 (19.91) | 15,156 (19.93) | |
| Local street | 29 (3.51) | 15,102 (20.08) | 15,131 (19.90) | |
| Other | 143 (17.29) | 3650 (4.85) | 3793 (4.99) | |
| Traffic control device functioning | 35.4 (<0.0001) | |||
| Not functioning properly | 0 (0.00) | 20 (0.03) | 20 (0.03) | |
| Functioning properly | 17 (1.94) | 3999 (5.29) | 4016 (5.25) | |
| No controls | 210 (23.97) | 13,728 (18.17) | 13,938 (18.24) | |
| Unknown | 649 (74.09) | 57,805 (76.51) | 58,454 (76.48) | |
| Variables | 0–12 Adjusted, Restrained | 13–19 Adjusted, Restrained |
|---|---|---|
| n = 44,459 | n = 50,565 | |
| Driver Characteristics | ||
| Driver age (years) | ||
| <20 | Ref | Ref |
| 20 to 44 | 2.023 (1.798, 2.276) | 1.272 (1.208, 1.340) |
| 45 to 64 | 1.840 (1.601, 2.115) | 1.840 (1.687, 2.008) |
| ≥65 | 2.234 (1.780, 2.803) | 2.063 (1.667, 2.554) |
| Driver restraint use | ||
| Not restrained | Ref | Ref |
| Restrained | 7.759 (7.228, 8.330) | 10.607 (10.046, 11.200) |
| Driver gender | ||
| Male | Ref | Ref |
| Female | 1.021 (0.958, 1.088) | 1.074 (1.019, 1.132) |
| License validity | ||
| Invalid | Ref | Ref |
| Valid | 2.098 (1.930, 2.281) | 1.500 (1.409, 1.598) |
| Drug or alcohol tests | ||
| Tested, negative | Ref | Ref |
| Tested, negative | 1.464 (0.609, 3.520) | 0.870 (0.487, 1.555) |
| Not tested | 1.699 (0.707, 4.084) | 1.087 (0.608, 1.943) |
| Vehicle Characteristics | ||
| Model type | ||
| Passenger cars | Ref | Ref |
| SUV | 0.820 (0.758, 0.887) | 0.742 (0.696, 0.790) |
| Vans | 0.695 (0.631, 0.766) | 0.622 (0.566, 0.683) |
| Pickups | 0.777 (0.705, 0.855) | 0.754 (0.704, 0.807) |
| Crash Characteristics | ||
| Indian land status of the crash site | ||
| Non-Indian land | Ref | Ref |
| Indian land | 0.535 (0.416, 0.715) | 0.635 (0.500, 0.807) |
| Variables | 0–12 Unadjusted, Restrained | 0–12 Adjusted, Restrained | 13–19 Unadjusted, Restrained | 13–19 Adjusted, Restrained |
|---|---|---|---|---|
| n = 713 | n = 520 | n = 954 | n = 628 | |
| Driver Characteristics | ||||
| Driver age (years) | ||||
| <20 | Ref | Ref | Ref | Ref |
| 20 to 44 | 3.726 (1.624, 8.549) | 2.396 (0.826, 6.951) | 1.618 (1.039, 2.519) | 1.273 (0.716, 2.265) |
| 45 to 64 | 4.895 (1.740, 13.775) | 1.225 (0.324, 4.629) | 12.090 (5.091, 28.709) | 4.763 (1.464, 15.495) |
| ≥65 | 1.899 (0.184, 19.636) | 0.286 (0.012, 6.644) | 10.558 (1.280, 87.603) | 1.904 (0.040, 91.206) |
| Driver restraint use | ||||
| Not restrained | Ref | Ref | Ref | Ref |
| Restrained | 8.496 (4.989, 14.468) | 6.548 (3.262, 13.143) | 22.887 (14.029, 37.336) | 13.885 (7.702, 25.033) |
| Driver gender | ||||
| Male | Ref | Ref | Ref | Ref |
| Female | 0.913 (0.556, 1.500) | 0.711 (0.382, 1.324) | 1.693 (1.109, 2.586) | 1.300 (0.742, 2.278) |
| License validity | ||||
| Invalid | Ref | Ref | Ref | Ref |
| Valid | 5.894 (3.314, 10.484) | 2.662 (1.249, 5.674) | 3.929 (2.512, 6.146) | 1.738 (0.966, 3.129) |
| Drug or alcohol tests | ||||
| Tested, positive 1 | Ref | Ref | Ref | Ref |
| Tested, negative | - | - | - | - |
| Not tested | 1.577 (0.936, 2.658) | 1.226 (0.646, 2.325) | 4.426 (2.808, 6.977) | 1.563 (0.827, 2.956) |
| Vehicle Characteristics | ||||
| Model type | ||||
| Passenger cars | Ref | Ref | Ref | Ref |
| SUVs | 0.746 (0.395, 1.411) | 0.937 (0.422, 2.081) | 1.300 (0.755, 2.238) | 0.489 (0.229, 1.046) |
| Vans | 1.023 (0.475, 2.204) | 1.103 (0.425, 2.862) | 2.672 (1.232, 5.795) | 0.932 (0.344, 2.523) |
| Pickups | 0.532 (0.279, 1.014) | 0.553 (0.246, 1.244) | 0.966 (0.581, 1.606) | 0.604 (0.307, 1.185) |
| Variables | 0–12 Unadjusted, Restrained | 0–12 Adjusted, Restrained | 13–19 Unadjusted, Restrained | 13–19 Adjusted, Restrained |
|---|---|---|---|---|
| n = 57,506 | n = 43,939 | n = 68,574 | n = 49,937 | |
| Driver Characteristics | ||||
| Driver age (years) | ||||
| <20 | Ref | Ref | Ref | Ref |
| 20 to 44 | 2.276 (2.063, 2.511) | 2.013 (1.787, 2.267) | 1.228 (1.179, 1.280) | 1.272 (1.208, 1.339) |
| 45 to 64 | 2.367 (2.110, 2.657) | 1.842 (1.601, 2.119) | 2.701 (2.518, 2.898) | 1.829 (1.676, 1.996) |
| ≥65 | 3.050 (2.524, 3.686) | 2.249 (1.790, 2.825) | 3.157 (2.649, 3.763) | 2.066 (1.669, 2.558) |
| Driver restraint use | ||||
| Not restrained | Ref | Ref | Ref | Ref |
| Restrained | 8.509 (8.002, 9.049) | 7.799 (7.261, 8.378) | 12.459 (11.879, 13.068) | 10.565 (10.004, 11.159) |
| Driver gender | ||||
| Male | Ref | Ref | Ref | Ref |
| Female | 1.170 (1.111, 1.233) | 1.026 (0.962, 1.093) | 1.593 (1.527, 1.661) | 1.074 (1.018, 1.132) |
| License validity | ||||
| Invalid | Ref | Ref | Ref | Ref |
| Valid | 2.608 (2.431, 2.798) | 2.097 (1.928, 2.281) | 2.036 (1.935, 2.143) | 1.495 (1.403, 1.592) |
| Drug or alcohol tests | ||||
| Tested, negative | Ref | Ref | Ref | Ref |
| Tested, positive | 1.219 (0.559, 2.658) | 1.462 (0.608, 3.514) | 0.985 (0.592, 1.639) | 0.861 (0.482, 1.535) |
| Not tested | 2.142 (0.983, 4.667) | 1.695 (0.706, 4.073) | 2.014 (1.210, 3.350) | 1.074 (0.602, 1.916) |
| Vehicle Characteristics | ||||
| Model type | ||||
| Passenger cars | Ref | Ref | Ref | Ref |
| SUVs | 0.938 (0.878, 1.003) | 0.819 (0.757, 0.887) | 0.934 (0.887, 0.984) | 0.744 (0.698, 0.793) |
| Vans | 0.968 (0.892, 1.050) | 0.691 (0.627, 0.762) | 1.128 (1.046, 1.217) | 0.619 (0.563, 0.680) |
| Pickups | 0.766 (0.708, 0.830) | 0.784 (0.711, 0.864) | 0.700 (0.663, 0.739) | 0.755 (0.705, 0.808) |
© 2017 by the authors. Licensee MDPI, Basel, Switzerland. This article is an open access article distributed under the terms and conditions of the Creative Commons Attribution (CC BY) license (http://creativecommons.org/licenses/by/4.0/).
Share and Cite
Oh, S.A.; Liu, C.; Pressley, J.C. Fatal Pediatric Motor Vehicle Crashes on U.S. Native American Indian Lands Compared to Adjacent Non-Indian Lands: Restraint Use and Injury by Driver, Vehicle, Roadway and Crash Characteristics. Int. J. Environ. Res. Public Health 2017, 14, 1287. https://doi.org/10.3390/ijerph14111287
Oh SA, Liu C, Pressley JC. Fatal Pediatric Motor Vehicle Crashes on U.S. Native American Indian Lands Compared to Adjacent Non-Indian Lands: Restraint Use and Injury by Driver, Vehicle, Roadway and Crash Characteristics. International Journal of Environmental Research and Public Health. 2017; 14(11):1287. https://doi.org/10.3390/ijerph14111287
Chicago/Turabian StyleOh, Shin Ah, Chang Liu, and Joyce C. Pressley. 2017. "Fatal Pediatric Motor Vehicle Crashes on U.S. Native American Indian Lands Compared to Adjacent Non-Indian Lands: Restraint Use and Injury by Driver, Vehicle, Roadway and Crash Characteristics" International Journal of Environmental Research and Public Health 14, no. 11: 1287. https://doi.org/10.3390/ijerph14111287