
Health Impacts from Corn Production Pre-and Post-NAFTA Trade Agreement (1986–2013)

 ,
,  and
and
Abstract
:1. Introduction
2. Materials and Methods
2.1. Impact Evaluation
2.2. Description of the Analyzed Processes
2.3. Analysis per Functional Unit
2.4. Limitations of the System
3. Results
3.1. Inventory of the Life Cycle: Results from Absolute Data
3.2. Results by Functional Unit
4. Discussion
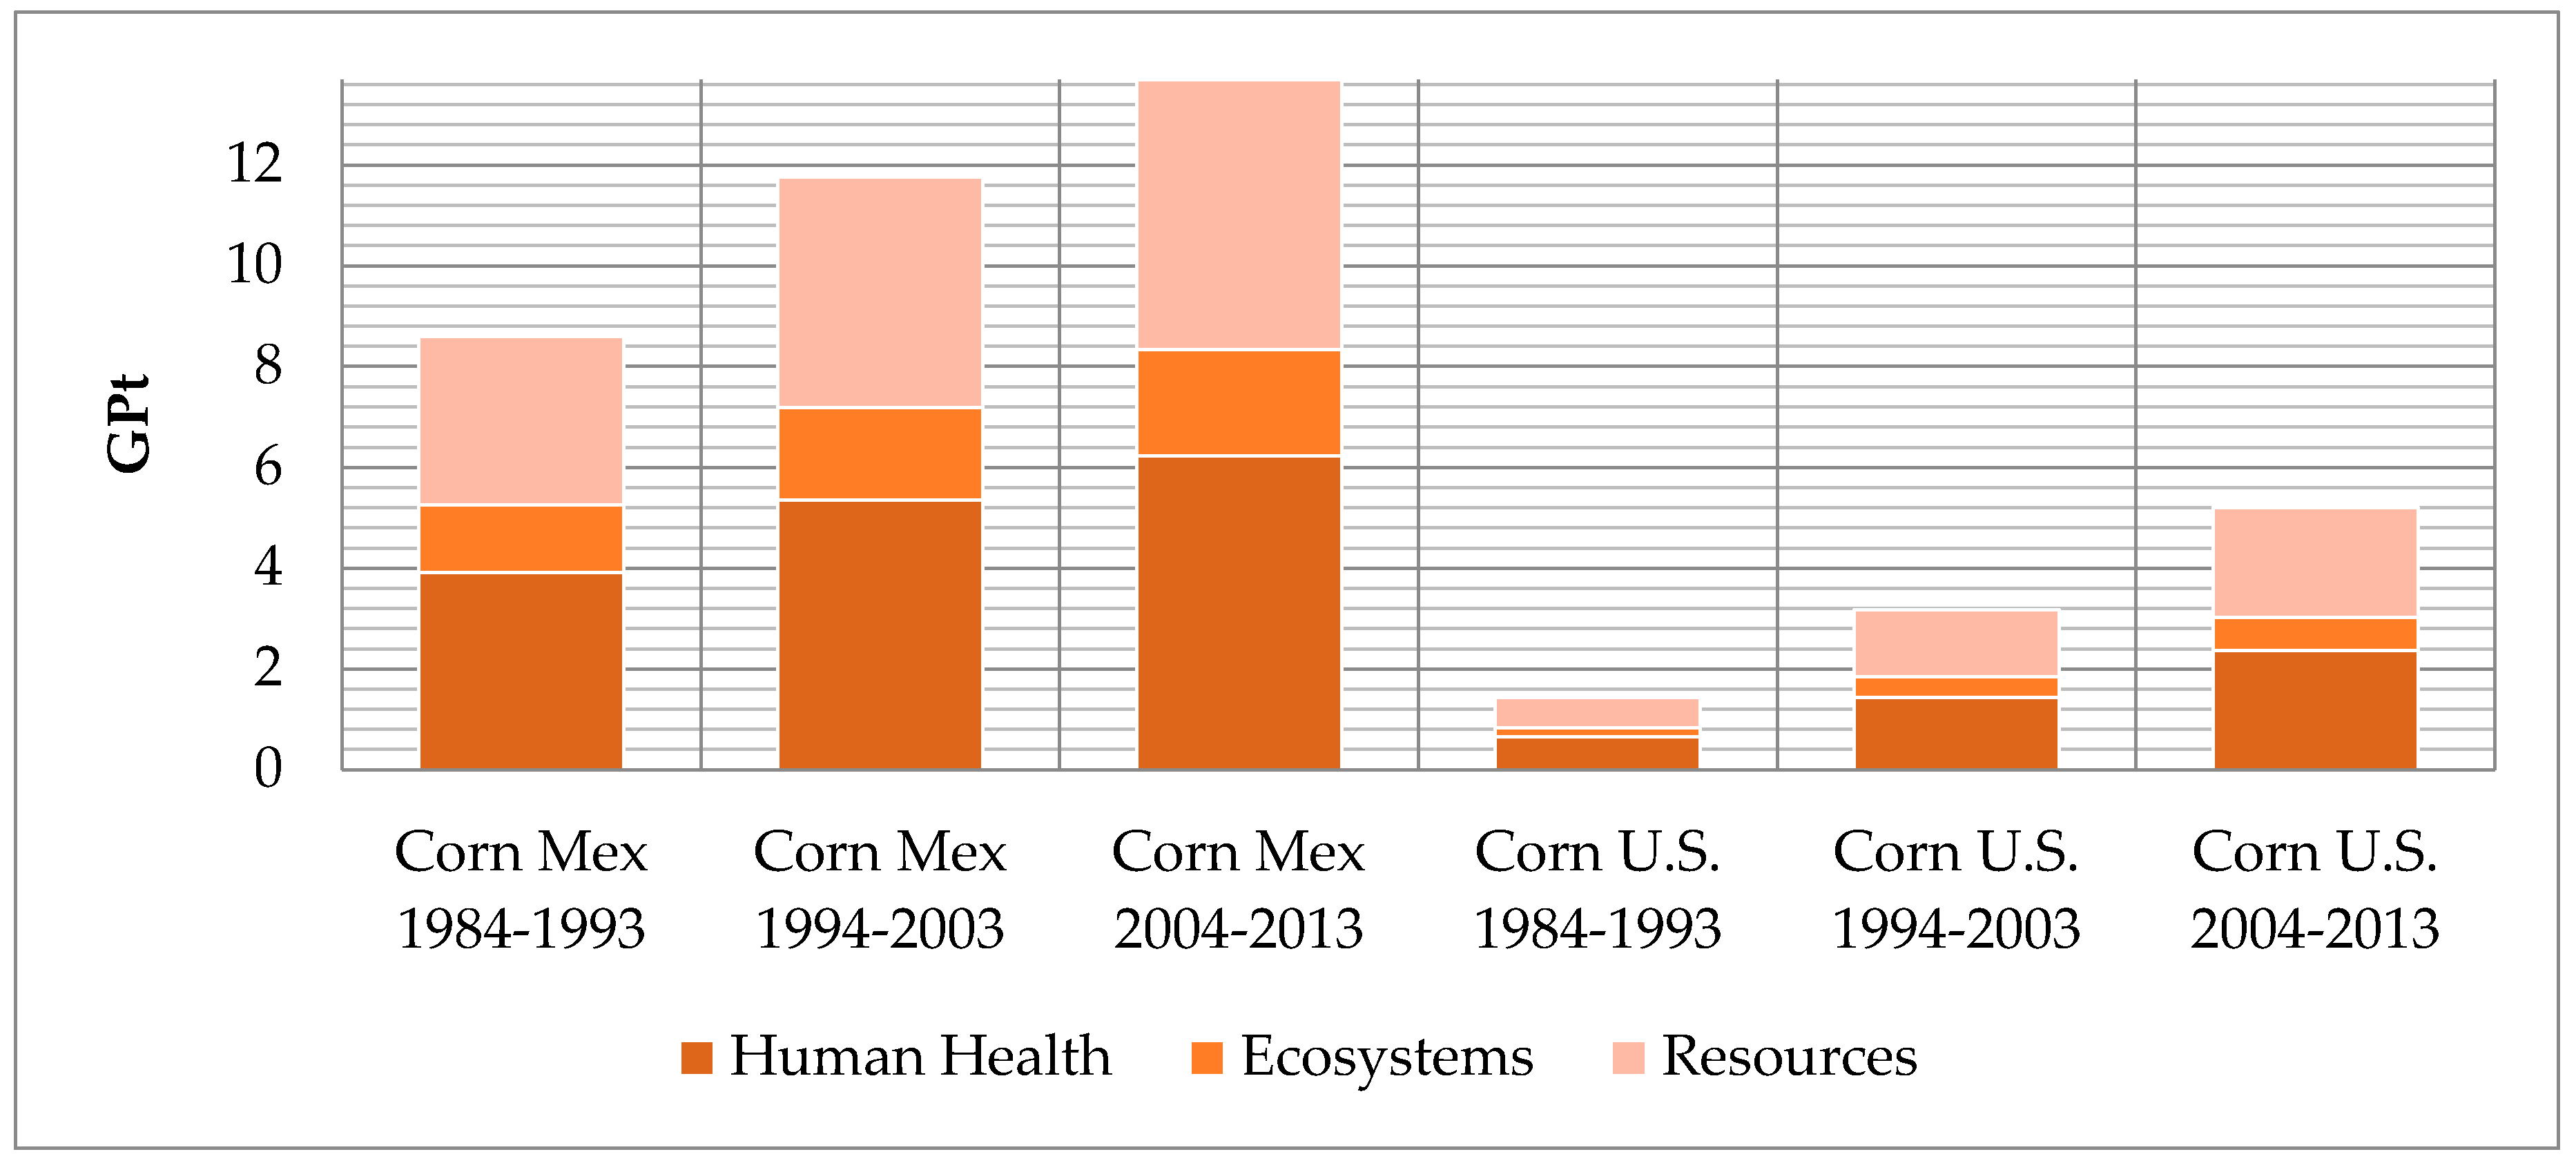
- The total values of corn production were quantified for each impact; corn is the base of Mexican food and provides food security to this country. The maximum in the last decade of corn cultivation in Mexico was found to be 13.6 GPt. This data and analysis is a baseline and reference to quantify the impacts of other established crops in Mexico. We did not find any other documented analysis in Mexico of crop life cycle to date. Sugar cane is still the highest cultivated crop worldwide and is followed closely by corn, then by other crops, such as sorghum, oranges, wheat, banana, tomato, and others. Therefore, corn studies are significant for places like Latin America where corn is the main food supply.
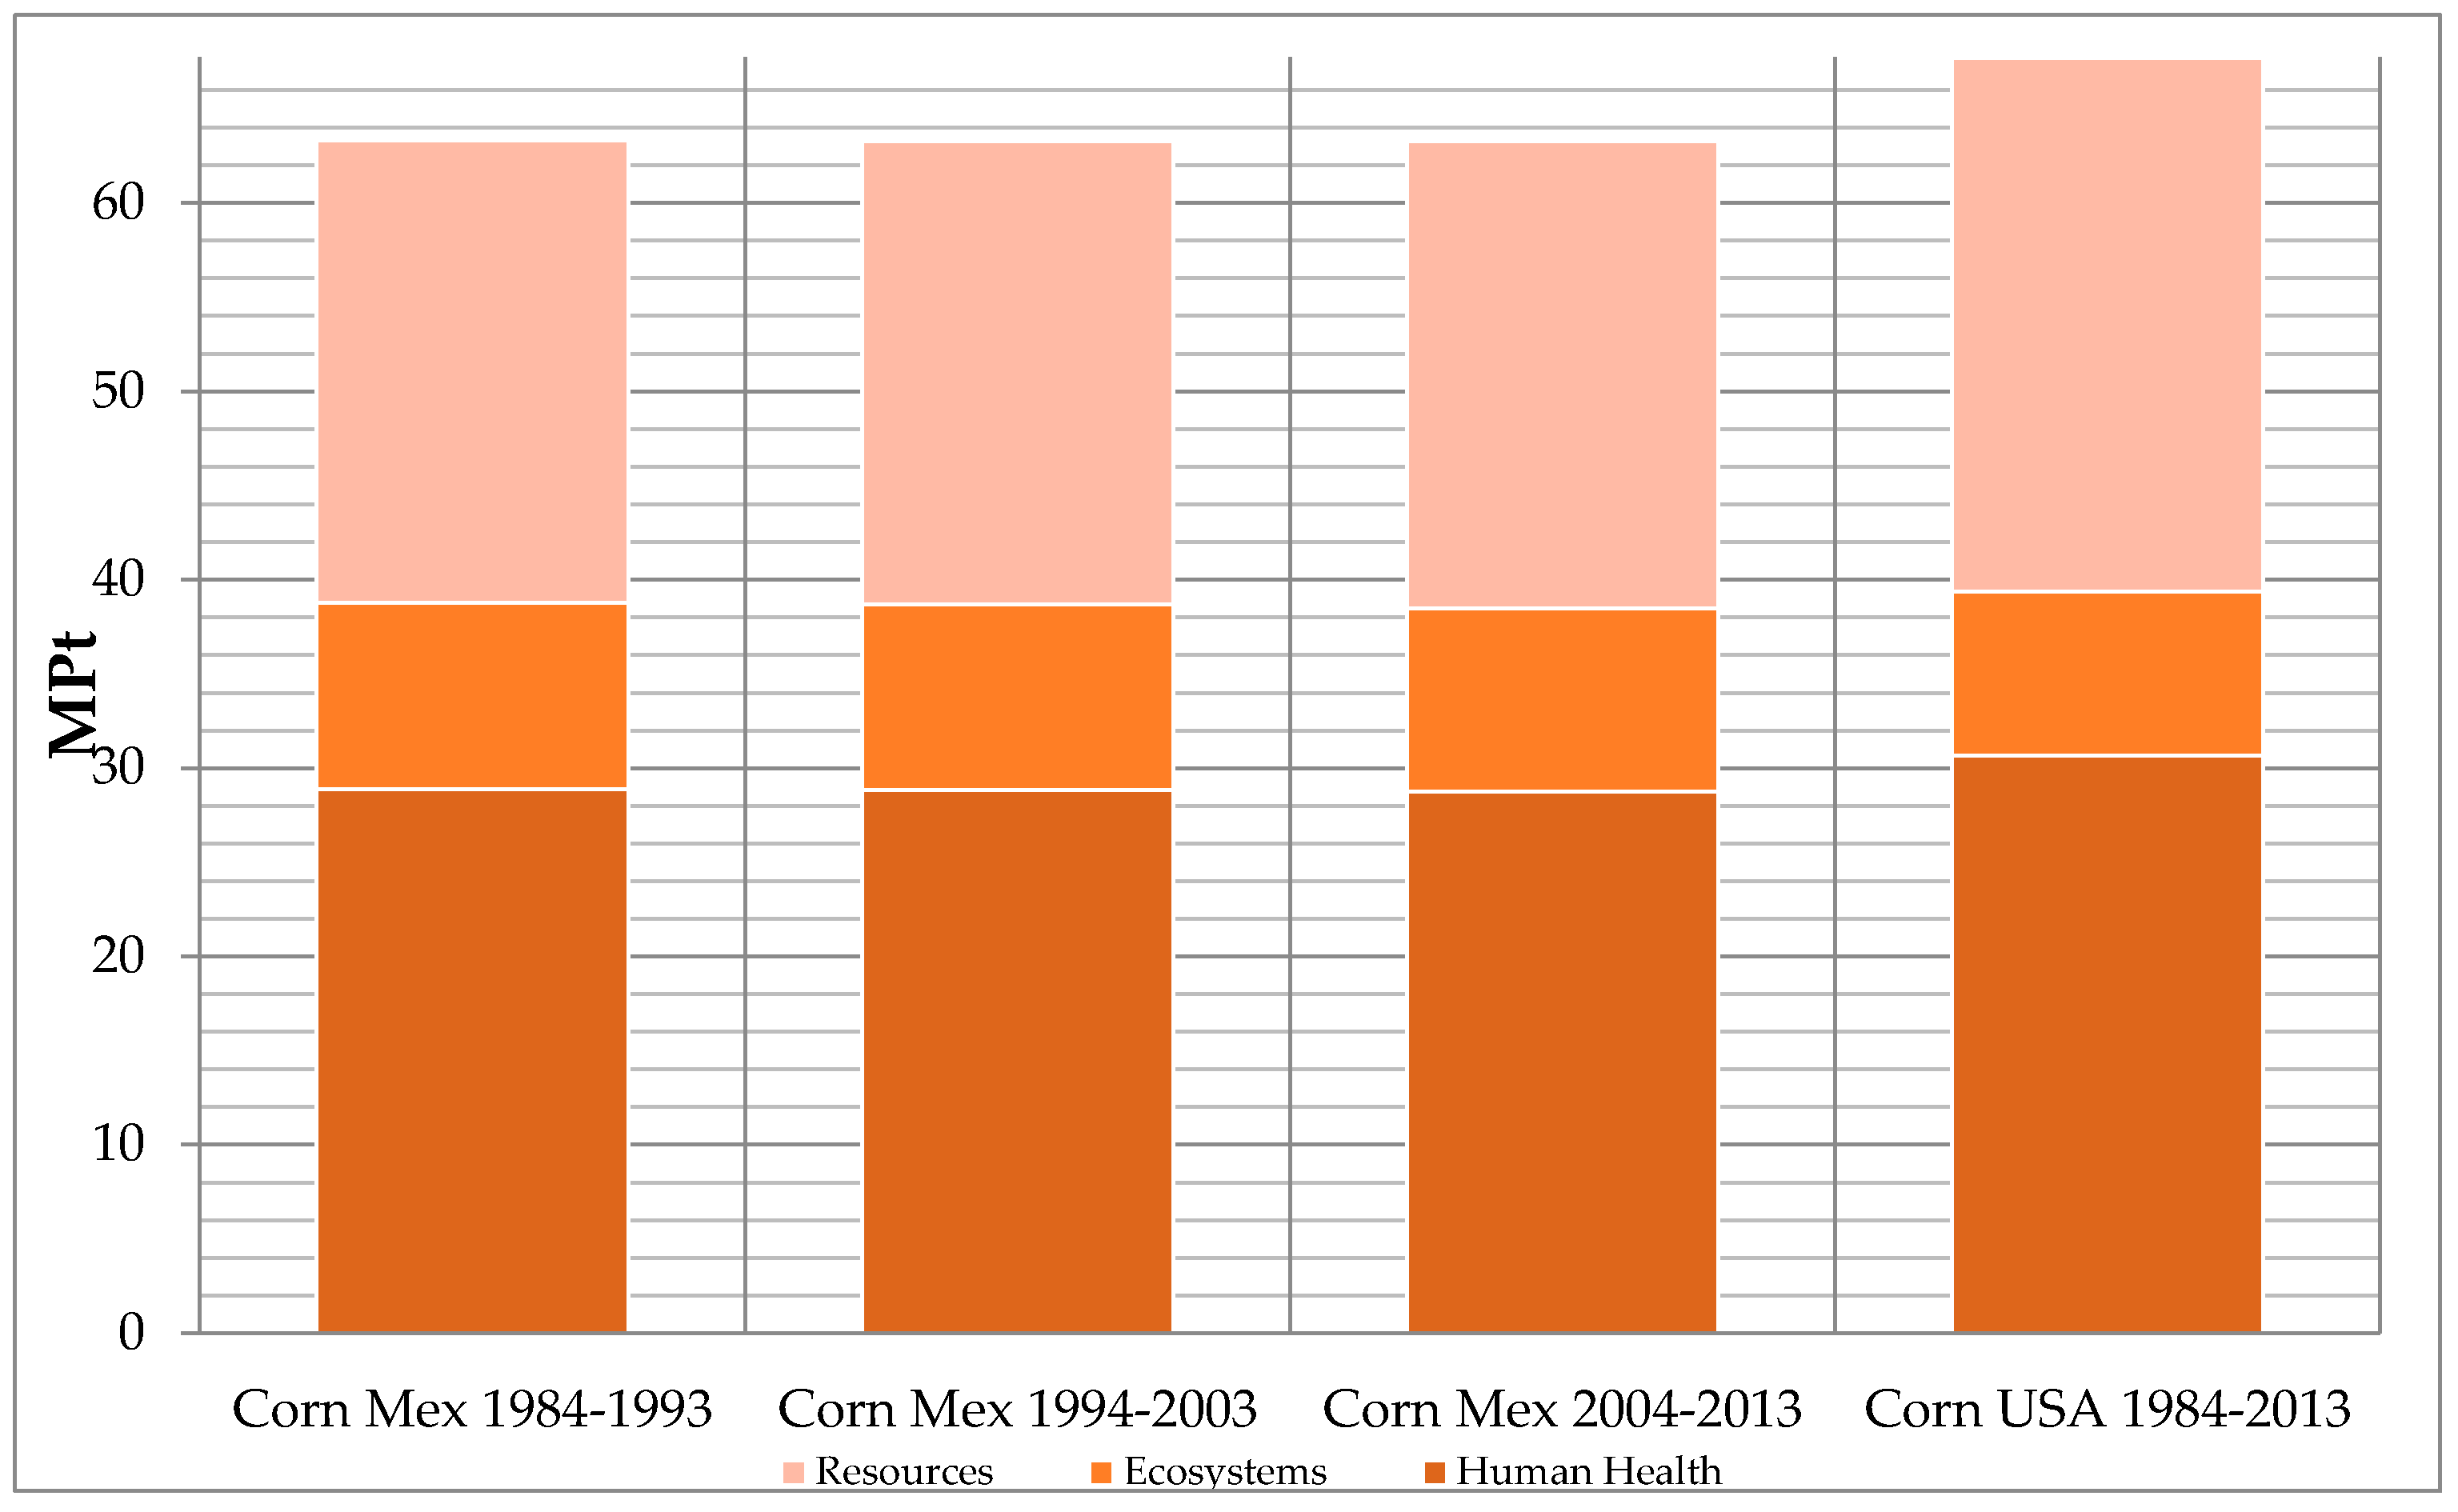
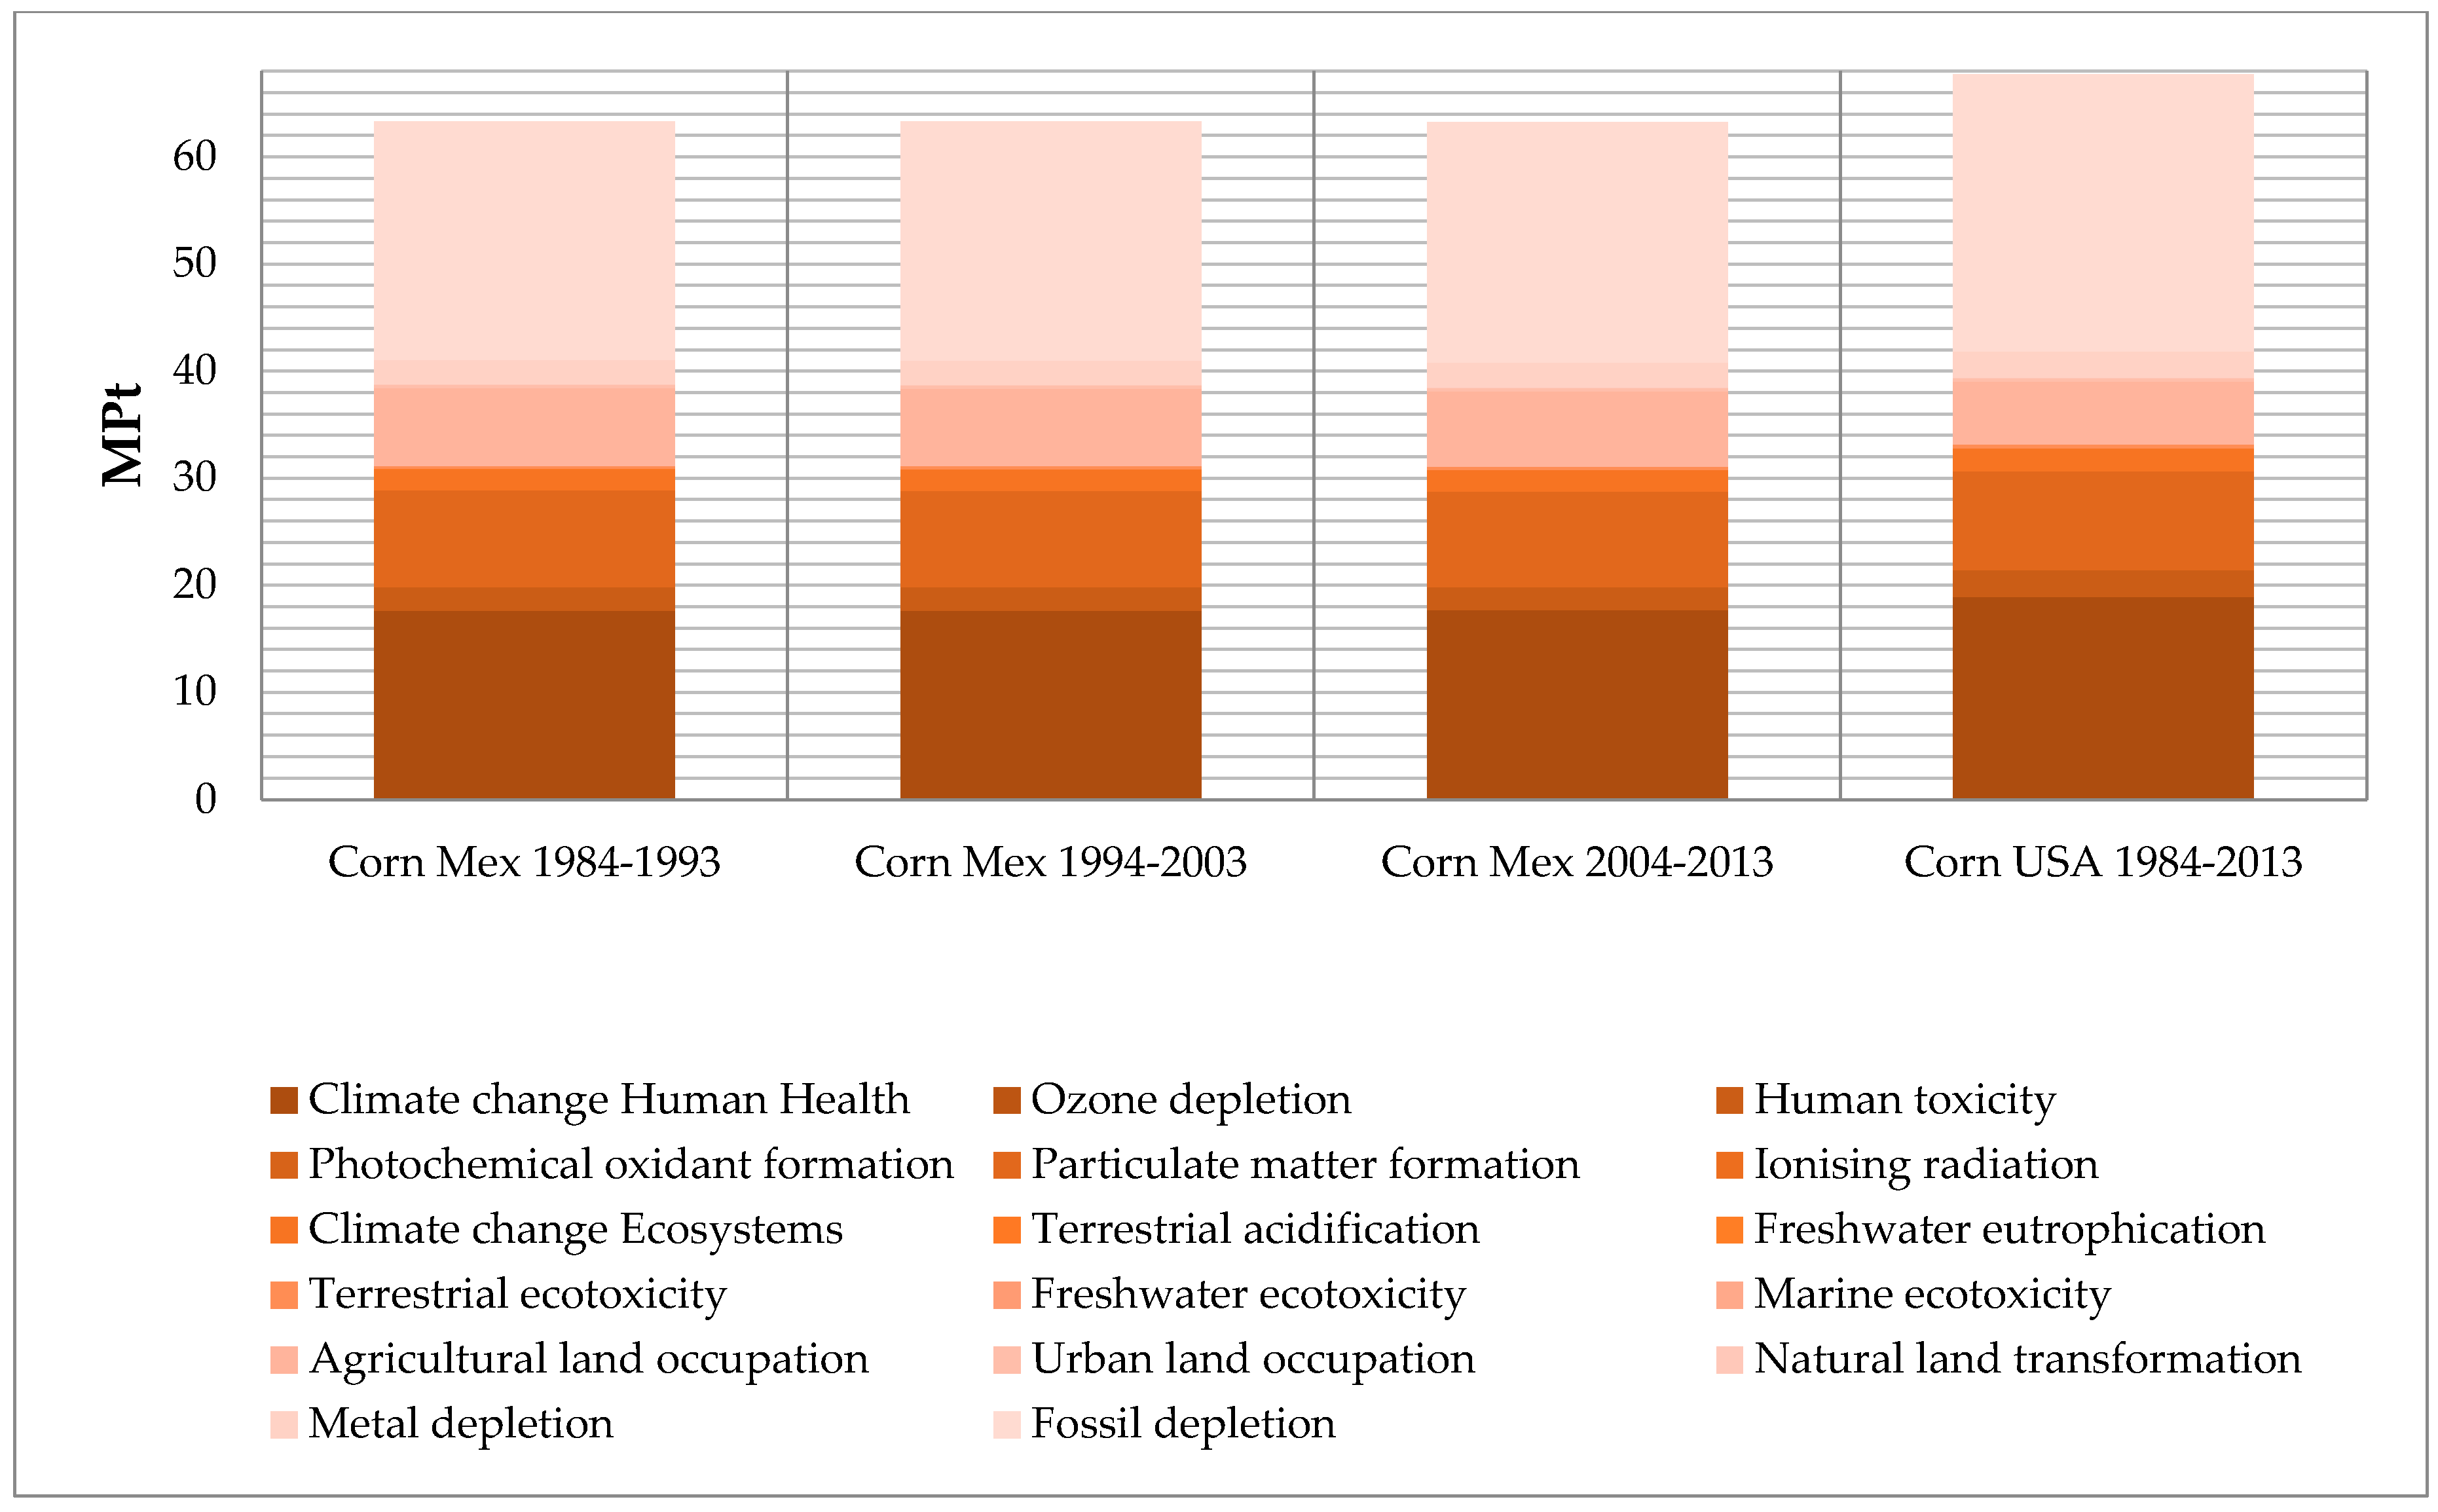
- The analysis regarding functional units shows that the environmental impact representing the imports is 5 MP over the maximum values of corn that can be produced in Mexico (see Figure 2). This indicates that imported corn causes more damage to health, environment, and resources than national production and its internal transportation would entail. Most cultivated corn in Mexico is “white” and it is utilized to produce tortillas and other food products for direct human consumption. This contrasts with the “yellow” hybrid corn that is produced in the US and imported to Mexico, being the only source of imported yellow corn [15,16]. The yellow corn is commonly used as a feed grain in beef cattle diets throughout the US [17,18]. According to [19], 90 to 95 percent of cornstarch is produced using corn imported from the U.S. Tortillas are made with this cornstarch. There is no evidence of increased digestibility or nutritional value of white or yellow corn, but consumers may have resistance to accept yellow corn due to quality problems. This is also due to the knowledge that, over the years, cumulative investment in corn improvement research has been far greater for yellow corn because it is the dominant germplasm adapted to temperate environments in the developed world [20]. The ReCiPe endpoint impact through 1984–2013 in Mexico have remained on the same level because the functional unit is 1 ton of production. However, for hybrid corn exported from the U.S. to Mexico in the three decades, an increase of impacts due to transportation is observed. Transport has a very significant global impact.
5. Conclusions
Acknowledgments
Author Contributions
Conflicts of Interest
Appendix A

| National Volume of Produced Corn Grain by Federal Entity | |||||||||||||
|---|---|---|---|---|---|---|---|---|---|---|---|---|---|
| (tons) | |||||||||||||
| Country of Origin | 1984 | 1985 | 1986 | 1987 | 1988 | 1989 | 1990 | 1991 | 1992 | 1993 | 1994 | 1995 | 1996 |
| Total | 12,788,809 | 14,103,454 | 11,909,708 | 11,606,945 | 10,592,291 | 10,952,847 | 14,635,439 | 14,251,500 | 16,929,342 | 18,125,263 | 18,235,826 | 18,352,856 | 18,025,952 |
| Aguascalientes | 51,336 | 45,083 | 46,410 | 55,838 | 47,108 | 41,799 | 74,222 | 47,420 | 73,188 | 65,997 | 74,037 | 85,562 | 77,249 |
| Baja California | 6185 | 22,072 | 20,248 | 12,192 | 11,219 | 7670 | 3273 | 2012 | 25,912 | 61,878 | 23,661 | 6324 | 7176 |
| Baja California Sur | 3147 | 9193 | 3906 | 4600 | 6109 | 8963 | 26,643 | 77,843 | 87,715 | 89,601 | 97,492 | 40,484 | 85,065 |
| Campeche | 72,969 | 48,015 | 32,565 | 78,484 | 12,839 | 55,907 | 92,766 | 55,565 | 111,122 | 82,268 | 115,314 | 54,889 | 133,041 |
| Coahuila de Zaragoza | 39,219 | 33,836 | 34,418 | 42,798 | 45,822 | 30,552 | 46,408 | 62,955 | 130,403 | 104,002 | 96,172 | 44,855 | 31,851 |
| Colima | 100,825 | 67,094 | 50,721 | 47,346 | 69,524 | 66,717 | 75,270 | 65,372 | 58,119 | 76,546 | 90,568 | 90,654 | 94,318 |
| Chiapas | 1,195,663 | 1,460,524 | 1,387,228 | 1,119,747 | 1,067,807 | 1,125,677 | 1,075,348 | 983,415 | 1,607,369 | 1,594,100 | 1,096,254 | 1,696,001 | 1,543,675 |
| Chihuahua | 259,440 | 357,368 | 320,194 | 399,118 | 250,425 | 235,504 | 435,729 | 739,955 | 948,238 | 880,082 | 487,031 | 303,627 | 412,303 |
| Distrito Federal | 32,429 | 27,155 | 34,728 | 28,774 | 25,152 | 28,642 | 21,786 | 22,168 | 16,565 | 16,070 | 16,216 | 12,826 | 12,758 |
| Durango | 152,793 | 267,759 | 221,839 | 204,004 | 168,950 | 109,676 | 234,458 | 239,127 | 248,521 | 289,215 | 325,088 | 291,280 | 288,146 |
| Guanajuato | 507,962 | 505,636 | 519,230 | 434,198 | 410,681 | 408,406 | 666,431 | 532,760 | 784,174 | 1,255,706 | 1,020,245 | 824,005 | 757,368 |
| Guerrero | 718,093 | 814,860 | 537,017 | 778,936 | 863,892 | 972,546 | 828,356 | 786,516 | 983,801 | 886,836 | 765,736 | 1,112,254 | 1,072,124 |
| Hidalgo | 306,789 | 394,979 | 307,638 | 328,773 | 336,414 | 358,045 | 439,723 | 383,867 | 485,430 | 362,081 | 453,166 | 406,140 | 427,970 |
| Jalisco | 2,031,745 | 2,040,200 | 1,857,714 | 1,768,973 | 1,812,271 | 1,534,645 | 2,226,388 | 2,310,590 | 2,421,193 | 2,379,659 | 2,125,336 | 2,231,290 | 2,328,157 |
| México | 2,163,636 | 2,310,927 | 2,033,605 | 1,886,116 | 617,405 | 1,179,515 | 2,397,144 | 1,755,997 | 1,901,215 | 1,233,450 | 1,561,746 | 2,146,471 | 2,250,753 |
| Michoacán de Ocampo | 724,483 | 875,444 | 857,165 | 840,501 | 842,049 | 644,091 | 904,757 | 979,195 | 920,566 | 1,060,769 | 1,042,268 | 1,293,058 | 1,130,533 |
| Morelos | 97,354 | 62,514 | 52,479 | 43,873 | 65,681 | 87,317 | 95,854 | 67,511 | 102,929 | 94,753 | 97,599 | 115,943 | 100,732 |
| Nayarit | 148,649 | 150,707 | 140,110 | 99,731 | 142,313 | 141,410 | 144,399 | 177,992 | 170,805 | 181,366 | 317,063 | 225,790 | 224,996 |
| Nuevo León | 61,087 | 50,671 | 44,618 | 68,537 | 50,947 | 38,246 | 61,180 | 91,140 | 92,629 | 99,691 | 159,112 | 54,759 | 43,347 |
| Oaxaca | 450,587 | 487,810 | 285,125 | 350,990 | 509,867 | 542,039 | 452,964 | 422,014 | 512,818 | 547,654 | 623,953 | 720,714 | 683,624 |
| Puebla | 967,772 | 1,016,617 | 487,122 | 563,426 | 570,023 | 897,753 | 1,077,138 | 1,020,398 | 1,164,429 | 1,018,884 | 881,146 | 1,063,857 | 1,182,504 |
| Querétaro | 108,051 | 136,846 | 89,024 | 76,410 | 44,790 | 94,352 | 107,156 | 60,640 | 136,505 | 111,856 | 168,409 | 186,173 | 169,207 |
| Quintana Roo | 22,209 | 8433 | 20,977 | 30,843 | 6045 | 21,669 | 34,370 | 16,227 | 33,546 | 16,848 | 6616 | 10,410 | 37,778 |
| San Luis Potosí | 134,760 | 163,358 | 112,205 | 163,037 | 203,573 | 146,417 | 197,093 | 210,361 | 174,692 | 135,392 | 193,209 | 160,989 | 169,285 |
| Sinaloa | 137,995 | 222,854 | 139,692 | 149,821 | 140,383 | 237,518 | 317,517 | 821,000 | 960,109 | 2,449,096 | 2,762,275 | 2,027,474 | 1,696,177 |
| Sonora | 90,198 | 189,506 | 287,617 | 111,219 | 192,990 | 37,355 | 119,401 | 393,714 | 291,271 | 456,659 | 542,981 | 457,480 | 836,442 |
| Tabasco | 75,890 | 93,495 | 85,822 | 102,224 | 75,719 | 82,661 | 92,162 | 74,294 | 67,025 | 71,205 | 125,365 | 99,995 | 140,937 |
| Tamaulipas | 735,306 | 755,793 | 740,549 | 441,571 | 893,661 | 543,603 | 658,631 | 443,304 | 747,037 | 1,108,758 | 1,355,550 | 818,609 | 230,338 |
| Tlaxcala | 307,823 | 337,624 | 187,905 | 301,219 | 119,982 | 275,538 | 305,474 | 262,051 | 379,671 | 253,806 | 310,065 | 297,076 | 328,046 |
| Veracruz de Ignacio de la Llave | 611,173 | 757,809 | 572,921 | 569,513 | 700,055 | 719,787 | 846,122 | 797,570 | 895,397 | 779,912 | 929,953 | 1,104,281 | 1,182,712 |
| Yucatán | 116,069 | 93,528 | 104,124 | 120,941 | 8924 | 87,651 | 118,860 | 131,844 | 153,048 | 116,297 | 94,582 | 73,136 | 45,049 |
| Zacatecas | 357,172 | 295,744 | 294,792 | 383,192 | 279,671 | 191,176 | 458,416 | 216,683 | 243,900 | 244,826 | 277,618 | 296,450 | 302,291 |
| National Volume of Produced Corn Grain by Federal Entity | |||||||||||||
| (tons) | |||||||||||||
| Country of origin | 1997 | 1998 | 1999 | 2000 | 2001 | 2002 | 2003 | 2004 | 2005 | 2006 | 2007 | 2008 | 2009 |
| Total | 17,656,258 | 18,454,710 | 17,706,376 | 17,556,905 | 20,134,312 | 19,297,755 | 20,701,420 | 21,685,833 | 19,338,713 | 21,893,209 | 23,512,752 | 24,410,279 | 20,142,816 |
| Aguascalientes | 63,082 | 91,494 | 37,657 | 31,692 | 42,942 | 58,240 | 58,684 | 49,059 | 41,520 | 51,318 | 47,305 | 83,804 | 45,404 |
| Baja California | 6704 | 8464 | 6848 | 9917 | 5235 | 6069 | 4209 | 25 | 540 | 86 | 0 | 0 | 0 |
| Baja California Sur | 88,657 | 54,036 | 56,751 | 37,279 | 32,489 | 29,398 | 30,202 | 38,301 | 28,122 | 26,238 | 27,332 | 28,051 | 20,716 |
| Campeche | 189,481 | 223,210 | 238,618 | 251,763 | 199,672 | 31,383 | 189,815 | 272,186 | 361,606 | 314,082 | 164,040 | 225,492 | 278,698 |
| Coahuila de Zaragoza | 49,231 | 41,265 | 18,376 | 28,226 | 23,247 | 21,619 | 32,108 | 50,849 | 18,412 | 21,910 | 23,953 | 23,305 | 16,507 |
| Colima | 70,194 | 57,860 | 54,696 | 37,680 | 42,148 | 37,416 | 29,723 | 35,963 | 37,521 | 31,193 | 43,403 | 39,633 | 28,733 |
| Chiapas | 1,319,230 | 1,755,859 | 2,135,550 | 1,887,370 | 1,754,130 | 1,858,328 | 2,002,592 | 1,353,159 | 1,402,833 | 1,592,174 | 1,525,578 | 1,625,350 | 1,218,456 |
| Chihuahua | 768,249 | 572,755 | 498,255 | 453,483 | 657,452 | 557,963 | 531,684 | 745,696 | 671,479 | 678,609 | 848,566 | 829,905 | 974,936 |
| Distrito Federal | 15,211 | 9547 | 12,998 | 12,071 | 12,654 | 10,566 | 9492 | 9411 | 5937 | 8096 | 9467 | 8378 | 7964 |
| Durango | 238,427 | 213,029 | 165,860 | 173,139 | 192,313 | 256,838 | 402,644 | 374,632 | 254,961 | 342,149 | 290,317 | 310,877 | 334,089 |
| Guanajuato | 558,237 | 993,742 | 582,434 | 652,661 | 1,242,638 | 1,189,770 | 1,261,338 | 1,638,580 | 1,037,035 | 1,068,067 | 1,374,287 | 1,499,194 | 844,470 |
| Guerrero | 812,128 | 1,132,220 | 1,269,519 | 1,181,463 | 1,038,965 | 919,054 | 1,209,164 | 1,146,194 | 1,195,169 | 1,215,411 | 1,304,263 | 1,403,046 | 1,135,837 |
| Hidalgo | 465,226 | 502,203 | 526,650 | 595,979 | 607,912 | 578,168 | 604,208 | 618,153 | 561,490 | 649,211 | 590,510 | 627,557 | 513,060 |
| Jalisco | 2,074,466 | 2,782,997 | 2,482,087 | 2,158,926 | 2,888,963 | 3,061,055 | 3,122,596 | 3,351,592 | 2,620,010 | 3,030,254 | 3,251,675 | 3,205,017 | 2,543,056 |
| México | 2,309,408 | 1,591,534 | 2,193,507 | 1,757,710 | 2,284,682 | 1,976,788 | 1,923,410 | 1,680,872 | 1,211,436 | 1,801,331 | 2,002,701 | 1,902,019 | 1,316,202 |
| Michoacán de Ocampo | 985,172 | 1,151,332 | 1,383,741 | 1,103,374 | 1,333,354 | 1,304,269 | 1,442,715 | 1,267,501 | 1,309,695 | 1,405,551 | 1,566,712 | 1,608,916 | 1,182,458 |
| Morelos | 98,534 | 99,590 | 90,723 | 83,719 | 122,714 | 55,805 | 84,902 | 83,965 | 84,419 | 91,499 | 102,470 | 94,604 | 85,315 |
| Nayarit | 242,120 | 234,902 | 212,157 | 226,525 | 200,519 | 198,328 | 184,961 | 204,071 | 124,680 | 176,858 | 227,780 | 186,568 | 214,440 |
| Nuevo León | 64,558 | 25,294 | 33,174 | 31,083 | 32,861 | 54,789 | 52,898 | 70,312 | 71,147 | 35,192 | 59,419 | 30,373 | 35,932 |
| Oaxaca | 625,270 | 735,693 | 741,920 | 817,497 | 804,897 | 601,083 | 713,743 | 694,116 | 601,228 | 627,866 | 766,994 | 785,594 | 594,932 |
| Puebla | 797,162 | 790,027 | 861,374 | 925,136 | 1,121,841 | 724,907 | 863,243 | 855,354 | 777,757 | 1,016,585 | 942,316 | 1,020,642 | 658,118 |
| Querétaro | 156,342 | 233,036 | 143,491 | 176,975 | 274,922 | 308,707 | 285,928 | 307,361 | 202,051 | 189,430 | 376,460 | 311,989 | 214,761 |
| Quintana Roo | 49,731 | 44,869 | 53,324 | 34,318 | 38,593 | 17,082 | 58,127 | 16,782 | 36,381 | 48,504 | 15,692 | 4160 | 33,770 |
| San Luis Potosí | 177,986 | 192,227 | 124,474 | 128,780 | 140,819 | 151,451 | 188,859 | 185,658 | 169,720 | 162,991 | 174,875 | 218,560 | 114,075 |
| Sinaloa | 2,700,843 | 2,618,852 | 1,476,451 | 2,319,475 | 2,650,714 | 3,149,995 | 2,741,316 | 4,004,140 | 4,192,846 | 4,398,420 | 5,132,809 | 5,368,862 | 5,236,720 |
| Sonora | 641,000 | 330,914 | 307,366 | 69,763 | 77,510 | 149,032 | 229,058 | 75,989 | 119,533 | 186,656 | 143,891 | 176,888 | 103,488 |
| Tabasco | 154,920 | 107,359 | 140,280 | 159,851 | 179,105 | 160,023 | 145,921 | 150,828 | 102,161 | 126,382 | 91,937 | 124,105 | 117,534 |
| Tamaulipas | 262,694 | 344,123 | 303,683 | 281,042 | 153,361 | 194,527 | 290,145 | 518,876 | 711,304 | 682,923 | 632,825 | 555,825 | 428,198 |
| Tlaxcala | 178,806 | 176,119 | 150,426 | 279,614 | 312,696 | 171,276 | 265,991 | 292,186 | 189,863 | 267,134 | 287,555 | 311,568 | 274,416 |
| Veracruz de Ignacio de la Llave | 1,121,082 | 947,968 | 1,040,815 | 1,242,284 | 1,216,357 | 1,080,540 | 1,095,484 | 1,052,571 | 888,843 | 1,097,405 | 966,463 | 1,330,345 | 1,138,875 |
| Yucatán | 142,088 | 117,848 | 159,698 | 160,737 | 129,598 | 12,664 | 123,481 | 128,483 | 108,612 | 146,319 | 139,258 | 27,790 | 44,221 |
| Zacatecas | 230,019 | 274,344 | 203,475 | 247,373 | 319,008 | 370,623 | 522,779 | 412,969 | 200,401 | 403,365 | 381,899 | 441,862 | 387,437 |
| National Volume of Produced Corn Grain by Federal Entity | |||||||||||||
| (tons) | |||||||||||||
| Country of origin | 2010 | 2011 | 2012 | 2013 | |||||||||
| Total | 23,301,878 | 17,635,417 | 22,069,254 | 22,663,953 | |||||||||
| Aguascalientes | 51,630 | 51,247 | 56,307 | 79,956 | |||||||||
| Baja California | 0 | 0 | 6 | 1472 | |||||||||
| Baja California Sur | 17,095 | 19,546 | 32,056 | 21,288 | |||||||||
| Campeche | 384,582 | 457,009 | 343,904 | 440,546 | |||||||||
| Coahuila de Zaragoza | 39,278 | 9750 | 13,153 | 40,122 | |||||||||
| Colima | 38,141 | 39,912 | 33,705 | 38,156 | |||||||||
| Chiapas | 1,394,496 | 1,554,368 | 1,404,680 | 1,529,385 | |||||||||
| Chihuahua | 1,068,689 | 851,208 | 1,113,012 | 1,309,634 | |||||||||
| Distrito Federal | 8829 | 4881 | 5521 | 5251 | |||||||||
| Durango | 249,437 | 177,148 | 211,489 | 297,383 | |||||||||
| Guanajuato | 1,185,172 | 1,015,660 | 1,217,706 | 1,526,682 | |||||||||
| Guerrero | 1,413,973 | 1,309,068 | 1,304,133 | 989,673 | |||||||||
| Hidalgo | 613,320 | 454,945 | 704,422 | 644,628 | |||||||||
| Jalisco | 3,395,072 | 2,519,276 | 3,235,189 | 3,303,498 | |||||||||
| México | 1,549,545 | 649,179 | 1,575,300 | 2,012,774 | |||||||||
| Michoacán de Ocampo | 1,526,484 | 1,386,363 | 1,801,965 | 1,746,768 | |||||||||
| Morelos | 94,008 | 89,885 | 86,479 | 80,499 | |||||||||
| Nayarit | 176,224 | 188,046 | 201,138 | 193,606 | |||||||||
| Nuevo León | 60,735 | 20,148 | 61,415 | 99,733 | |||||||||
| Oaxaca | 645,531 | 694,554 | 729,351 | 628,530 | |||||||||
| Puebla | 1,080,462 | 611,805 | 1,002,278 | 942,171 | |||||||||
| Querétaro | 282,427 | 158,895 | 272,414 | 301,607 | |||||||||
| Quintana Roo | 55,779 | 67,470 | 54,363 | 70,491 | |||||||||
| San Luis Potosí | 165,768 | 112,908 | 105,381 | 154,150 | |||||||||
| Sinaloa | 5,227,872 | 2,929,180 | 3,646,875 | 3,627,778 | |||||||||
| Sonora | 240,954 | 83,221 | 167,125 | 113,534 | |||||||||
| Tabasco | 104,467 | 132,708 | 181,557 | 155,183 | |||||||||
| Tamaulipas | 540,170 | 489,380 | 517,670 | 400,057 | |||||||||
| Tlaxcala | 305,544 | 158,685 | 313,879 | 284,118 | |||||||||
| Veracruz de Ignacio de la Llave | 973,458 | 1,039,846 | 1,275,318 | 1,192,169 | |||||||||
| Yucatán | 120,542 | 149,060 | 113,380 | 103,914 | |||||||||
| Zacatecas | 292,195 | 210,067 | 288,081 | 329,200 | |||||||||
Appendix B
| Functional Unit: 1 Million Tons of Corn | ||
|---|---|---|
| Mexican production during the period 1984–1993 | ||
| 53.15 million ton | 39.11% | Hybrid corn |
| 60.21 million ton | 44.33% | Non-hybrid corn with chemicals |
| 22.52 million ton | 16.59% | Organic corn |
| 135.83 million ton | 100% | Total |
| Transportation and production results within of Mexico by functional unit | ||
| 1.00 E8 ton-km | Bus average fuel mix | Non-hybrid corn with chemicals |
| 443.11E6 ton-km | Train fuel mix 80% | Hybrid corn |
| Production | ||
| 391,100 ton | Corn grain US | Hybrid corn |
| 443,000 ton | Corn grain ROW | Non-hybrid corn with chemicals |
| 165,000 ton | Corn grain, organic | Organic corn |
| Mexican Production during the period of 1994–2003 | ||
| 76.645 million ton | 41.18% | Hybrid corn |
| 79.667 million ton | 42.80% | Non-hybrid corn with chemicals |
| 29.799 million ton | 16.02% | Organic corn |
| 186.122 million ton | 100% | Total |
| Transportation and production results inside of Mexico by functional unit | ||
| 1.00 E8 ton-km | Bus average fuel mix | Non-hybrid corn with chemicals |
| 466.57E6 ton-km | Train fuel mix 80% | Hybrid corn |
| Production | ||
| 411,800 ton | Corn grain U.S. | Hybrid corn |
| 428,000 ton | Corn grain ROW | Non-hybrid corn with chemicals |
| 160,200 ton | Corn grain, organic | Organic corn |
| Mexican Production during the period of 2004–2013 | ||
| 104.478 million ton | 48.22% | Hybrid corn |
| 81.641 million ton | 37.68% | Non-hybrid corn with chemicals |
| 30.534 million ton | 14.1% | Organic corn |
| 216.654 million ton | 100% | Total |
| Transportation and production results within of Mexico by functional unit | ||
| 1.00 E8 ton-km | Bus average fuel mix | Non-hybrid corn with chemicals |
| 546.332E6 ton-km | Train fuel mix 80% | Hybrid corn |
| Production | ||
| 482,200 ton | Corn grain U.S. | Hybrid corn |
| 376,800 ton | Corn grain ROW | Non-hybrid corn with chemicals |
| 141,000 ton | Corn grain, organic | Organic corn |
| Functional Unit: 1 Million of tons of imported corn from EEUU | ||
| Derived Mexican production from the period of 1984–2013 of hybrid corn | ||
| Nuevo Laredo | 73% | Hybrid corn |
| Matamoros | 7% | Hybrid corn |
| Veracruz | 20% | Hybrid corn |
| Total | 100% | |
| US Transportation and production results by functional unit | ||
| 1.986E9 ton-km | Diesel train powered/U.S. | Hybrid corn |
| 460E6 ton-km | Barge average fuel/U.S. | Hybrid corn |
| Production | ||
| 1E6 ton | Maice grain U.S. | Hybrid corn |
References
- FAO (Food and Agriculture Organization of the United Nations). Statistics 2014. Available online: http://faostat.fao.org/site/339/default.aspx (accessed on 22 July 2015).
- INEGI (Instituto Nacional de Estadística y Geografía). Censo Agrícola, Ganadero y Forestal 2007. Available online: http://www.inegi.org.mx/est/contenidos/proyectos/Agro/ca2007/Resultados_Agricola/default.aspx (accessed on 3 July 2015).
- SAGARPA (Secretaría de Agricultura, Ganadería y Pesca). Situación Actual y Perspectivas del Maíz en México 1996–2012; SAGARPA: Mexico City, Mexico, 2015. [Google Scholar]
- Pretty, J.; Ball, A.; Lang, T.; Morison, J. Farm costs and food miles: An assessment of the full cost of the UK weekly food basket. Food Policy 2005, 30, 1–19. [Google Scholar] [CrossRef]
- Ackerman, F.; Wise, T.; Ney, L.; Flores, R. Free Trade, Corn, and the Environment: Environmental Impacts of U.S.—Mexico Corn Trade under NAFTA. Available online: http://www.ase.tufts.edu/gdae/pubs/wp/03-06-naftacorn.pdf (accessed on 27 July 2015).
- Nadal, A.; Wise, T. The Environmental Costs of Agricultural Trade Liberalization: Mexico-US Maize Trade under NAFTA; Working Group on Development and Environment in the Americas: Medford, MA, USA, 2004. [Google Scholar]
- SIAP (Servicio de Información Agroalimentaria y Pesquera). Producción Agropecuaria y Pesquera 2015. Available online: http://www.siap.gob.mx/produccion-agropecuaria/ (accessed on 27 July 2015).
- Appendini, K. Reconstructing the maize market in rural Mexico. J. Agrar. Chang. 2014, 14, 1–25. [Google Scholar] [CrossRef]
- Kim, S.; Dale, B.; Jenkins, R. Life cycle assessment of corn grain and corn stover in the United States. Int. J. Life Cycle Assess. 2009, 14, 160–174. [Google Scholar] [CrossRef]
- ISO (International Organization for Standardization). Environmental Management: Life Cycle Assessment, Principles and Framework ISO 14040; ISO: Geneva, Switzerland, 2006. [Google Scholar]
- ISO (International Organization for Standardization). Quality Management Systems: Requirements ISO 9001; ISO: Geneva, Switzerland, 2008. [Google Scholar]
- Goedkoop, M.; Heijungs, R.; Huijbregts, M.; De Schryver, A.; Struijs, J.; Van Zelm, R. ReCiPe 2008, A life Cycle Impact Assessment Method Which Comprises Harmonised Category Indicators at the Midpoint and the Endpoint Level. Available online: http://www.lcia-recipe.net/ (accessed on 24 June 2015).
- Comisión de Cooperación Ambiental. Evaluación de los Efectos Ambientales del Tratado de Libre Comercio de América del Norte Marco de Trabajo Analítico (Fase II) y Estudios Temáticos. Estudio Temático 1: El Maíz en México: Algunas Implicaciones Ambientales del Tratado de Libre Comercio de América del Norte; Comisión de Cooperación Ambiental: Montréal, QU, Canada, 1999; pp. 85–182. [Google Scholar]
- Adcock, F.; Rosson, C.; Varela, A. Tracking US Grain and Soybean Exports in Mexico 2007. Cooperative Agreement #12-25-A-4501 between Agricultural Marketing Service/USDA and Texas Agricultural Experiment Station. 2015. Available online: http://cnas.tamu.edu/AMS%20Final%20Export%20Report.pdf (accessed on 26 June 2015).
- Polanco-Jaime, A.; Flores-Méndez, T. Bases Para una Política de I& D e Innovación de la Cadena de Valor del Maíz; Foro Consultivo y Científico, A.C.: Mexico DF, Mexico, 2008. [Google Scholar]
- Mejia, M.; Peel, D. White corn and yellow corn production in Mexico: Food versus feed? In Analysis & Comments; Livestock Marketing Information Center State Extension Services in Cooperation with USDA: Lakewood, CO, USA, 2009. [Google Scholar]
- Lardy, G. Feeding Corn to Beef Cattle. North Dakota State University. Animal Sciences Department. (AS1238 (Revised). Available online: https://www.ag.ndsu.edu/publications/livestock/feeding-corn-to-beef-cattle (accessed on 15 May 2015).
- Lehman, K. Agriculture. In NAFTA’s First Year: Lessons for the Hemisphere; Institute for Policy Studies: Washington, DC, USA, 1995. [Google Scholar]
- Yuñez-Naude, A.; Juarez-Torres, M.; Bárcenas-Paredes, F. Productive efficiency in agricultural corn production in Mexico. In Proceedings of the International Association of Agricultural Economic Conference, Gold Coast, Australia, 12–28 August 2006.
- Food and Agricultural Organization of the United Nations (FAO). White Maize: A Traditional Food Grain in Developing Countries; FAO: Rome, Italy, 1997. [Google Scholar]
- Sweeney, S.; Steigerwald, D.; Davenport, F.; Eakin, H. Mexican maize production: Evolving organizational and spatial structures since 1980. Appl. Geogr. 2013, 39, 78–92. [Google Scholar] [CrossRef]
- Donnet, M.; Lopez, D.; Arista, J.; Carrion, F.; Hernandez, V.; Gonzalez, A. El Potencial de Mercado de Semillas Mejoradas de Máiz en México; International Maize and Wheat Improvement Center (CIMMYT): Mexico City, Mexico, 2012. [Google Scholar]
- Monterroso-Rivas, A.; Conde-Álvarez, C.; Rosales-Dorantes, G.; Gómez-Díaz, J.; Gay-García, C. Assessing current and potential rainfed maize suitability under climate change scenarios in México. Atmósfera 2011, 24, 53–67. [Google Scholar]
- Turrent-Fernández, A.; Wise, T.; Garvey, E. Factibilidad de Alcanzar el Potencial Productivo de Maíz de México (Mexican Rural Development Research Report No. 24). Available online: http://www.ase.tufts.edu/gdae/Pubs/wp/12-03TurrentMexMaizeSpan.pdf (accessed on 13 July 2015).
- Fields, S. The fat of the land: Do agricultural subsidies foster poor health? Environ. Health Perspect. 2004, 112, A820–A823. [Google Scholar] [CrossRef] [PubMed]
- Franck, C.; Grandi, S.M.; Eisenberg, M.J. Agricultural subsidies and the American obesity epidemic. Am. J. Prev. Med. 2013, 45, 327–333. [Google Scholar] [CrossRef] [PubMed]
- Hawkes, C. Agricultural and food policy for cardiovascular health in Latin America. Prev. Control 2006, 2, 137–147. [Google Scholar] [CrossRef]
- Hawkes, C. Promoting healthy diets and tackling obesity and diet-related chronic diseases: What are the agricultural policy levers? Food Nutr. Bull. 2007, 28, S312–S322. [Google Scholar] [CrossRef] [PubMed]
- Reinert, K.; Roland-Holst, D. The industrial Pollution Impacts of NAFTA: Some preliminary results. In The Environmental Effects of Free Trade; Vaughan, S., Ed.; North American Commission for Environmental Cooperation (NACEC): Montreal, QC, Canada, 2002. [Google Scholar]
- Ackerman, F.; Wise, T.; Gallagher, K.; Ney, L.; Flores, K. Free Trade Corn and the Environment: Environmental Impacts of US-Mexico Corn Trade under NAFTA; Working Paper No. 03-06; Global Development and Environmental Institute: Medford, MA, USA, 2003. [Google Scholar]
- Carpenter, C.L. Trade Liberalization Impacts on Agriculture: Predicted vs. Realized; North American Commission for Environmental Cooperation (NACEC): Montreal, QC, Canada, 2001. [Google Scholar]
- Nadal, A. Evaluación de los Efectos Ambientales del Tratado de Libre Comercio de América del Norte; Comisión para la Cooperación Ambiental: Montreal, QC, Canada, 1999. [Google Scholar]
- De Ita, A. Los Impactos Socioeconómicos y Ambientales de la Liberalización Comercial de los Granos Básicos en el Contexto del TLCAN: El Caso de Sinaloa; Unpublished Document; Centro de Estudios para el Cambio en el Campo Mexicano, Centro Mexicano de Derecho Ambiental: Mexico DF, Mexico, 2003. [Google Scholar]
- Burfisher, M.; Robinson, S.; Thinderfelder, K. The impact of NAFTA in the United States. J. Econ. Perspect. 2001, 15, 125–144. [Google Scholar] [CrossRef]
- Levy, S.; Wijnbergen, S. Agriculture in a US-Mexican free trade agreement. In Modeling Trade Policy; Francois, J., Shiells, C., Eds.; Cambridge University Press: Cambridge, UK, 1994. [Google Scholar]
- Burfisher, M.; Robinson, S.; Thier-Felder, K. Farm policy reforms and harmonization in the NAFTA. In Regional Trade Agreements and US Agriculture; Burfisher, M., Jones, E., Eds.; AER No. 771; Economic Research Service/USDA: Washington, DC, USA, 1998. [Google Scholar]
| Nuevo Laredo | Matamoros | Veracruz | |
|---|---|---|---|
| Iowa | Train: 1686 km | Train: 1800 km | Train: 220 km Water: 2300 km |
| Ilinois | Train: 1637 km | Train: 1700 km | Train: 405 km Water: 2300 km |
| Indiana | Train: 1833 km | Train: 1885 km | Train: 677 km Water: 2300 km |
| Total | 1718 km + 650 km to the middle of the country | 1795 km + 650 km to the middle of the country | 434 km, train + 650 km to the middle of the country, Water: 2300 km |
| Considered Data Corn for this Evaluation, in Tons | |||
|---|---|---|---|
| Mexico production | 1984–1993 | 1994–2003 | 2004–2013 |
| Hybrid corn | 53,157,410 | 76,645,180 | 104,478,337 |
| Non-hybrid corn | 82,738,188 | 109,477,191 | 112,175,769 |
| Organic corn | 22,521,335 | 29,799,691 | 30,534,244 |
| Total national production | 135,895,598 | 186,122,370 | 216,654,105 |
| Imports from the U.S. | 1984–1993 | 1994–2003 | 2004–2013 |
| Hybrid corn | 21,373,961 | 47,196,287 | 77,226,920 |
| Transportation | 1984–1993 | 1994–2003 | 2004–2013 |
| Nuevo Laredo, train | 15,602,991 | 34,453,289 | 56,375,651 |
| Matamoros, train | 1,496,177 | 3,303,740 | 5,405,884 |
| Veracruz, train | 4,274,792 | 9,439,257 | 15,445,383 |
| Damage Category | Unit | Corn Mexico 1984–1993 | Corn Mexico 1994–2003 | Corn Mexico 2004–2013 | Corn U.S. 1984–2013 | Corn U.S. 1994–2003 | Corn U.S. 2004–2013 |
|---|---|---|---|---|---|---|---|
| Human Health | DALY | 178,431 | 244,175 | 28,3426 | 29,815 | 65,837 | 107,729 |
| Ecosystems | species.year | 3085.64 | 4206.83 | 4821.37 | 426.53 | 941.87 | 1541.18 |
| Resources | $ | 2,723,802,639 | 3,739,806,116 | 4,389,726,449 | 494,797,850 | 1,092,615,886 | 1,787,828,511 |
| Total | GPt | 8.60 | 11.78 | 13.70 | 1.44 | 3.19 | 5.22 |
| Human Health | GPt | 3.92 | 5.36 | 6.23 | 0.65 | 1.44 | 2.36 |
| Ecosystems | GPt | 1.34 | 1.83 | 2.10 | 0.18 | 0.41 | 0.67 |
| Resources | GPt | 3.33 | 4.57 | 5.37 | 0.60 | 1.33 | 2.18 |
| Damage Category | Unit | Corn Mex. 1984–1993 | Corn Mex. 1994–2003 | Corn Mex. 2004–2013 | Corn U.S. 1984–2013 |
|---|---|---|---|---|---|
| Human health | DALYs | 1313.00 | 1311.90 | 1308.19 | 1394.99 |
| Ecosystems | species.year | 22.70 | 22.60 | 22.25 | 19.95 |
| Resources | $ | 20,043,435 | 20,093,305 | 20,261,460 | 23,150,604 |
| Total | MPt | 63.30 | 63.29 | 63.26 | 67.71 |
| Human health | MPt | 28.87 | 28.84 | 28.76 | 30.67 |
| Ecosystems | MPt | 9.89 | 9.85 | 9.70 | 8.70 |
| Resources | MPt | 24.54 | 24.60 | 24.80 | 28.33 |
© 2016 by the authors; licensee MDPI, Basel, Switzerland. This article is an open access article distributed under the terms and conditions of the Creative Commons Attribution (CC-BY) license (http://creativecommons.org/licenses/by/4.0/).
Share and Cite
Mendoza-Cano, O.; Sánchez-Piña, R.A.; González-Ibarra, Á.J.; Murillo-Zamora, E.; Nava-Garibaldi, C.M. Health Impacts from Corn Production Pre-and Post-NAFTA Trade Agreement (1986–2013). Int. J. Environ. Res. Public Health 2016, 13, 709. https://doi.org/10.3390/ijerph13070709
Mendoza-Cano O, Sánchez-Piña RA, González-Ibarra ÁJ, Murillo-Zamora E, Nava-Garibaldi CM. Health Impacts from Corn Production Pre-and Post-NAFTA Trade Agreement (1986–2013). International Journal of Environmental Research and Public Health. 2016; 13(7):709. https://doi.org/10.3390/ijerph13070709
Chicago/Turabian StyleMendoza-Cano, Oliver, Ramón Alberto Sánchez-Piña, Álvaro Jesús González-Ibarra, Efrén Murillo-Zamora, and Cynthia Monique Nava-Garibaldi. 2016. "Health Impacts from Corn Production Pre-and Post-NAFTA Trade Agreement (1986–2013)" International Journal of Environmental Research and Public Health 13, no. 7: 709. https://doi.org/10.3390/ijerph13070709