
Using the Reverse Shock Index at the Injury Scene and in the Emergency Department to Identify High-Risk Patients: A Cross-Sectional Retrospective Study


 ,
,
Abstract
:1. Background
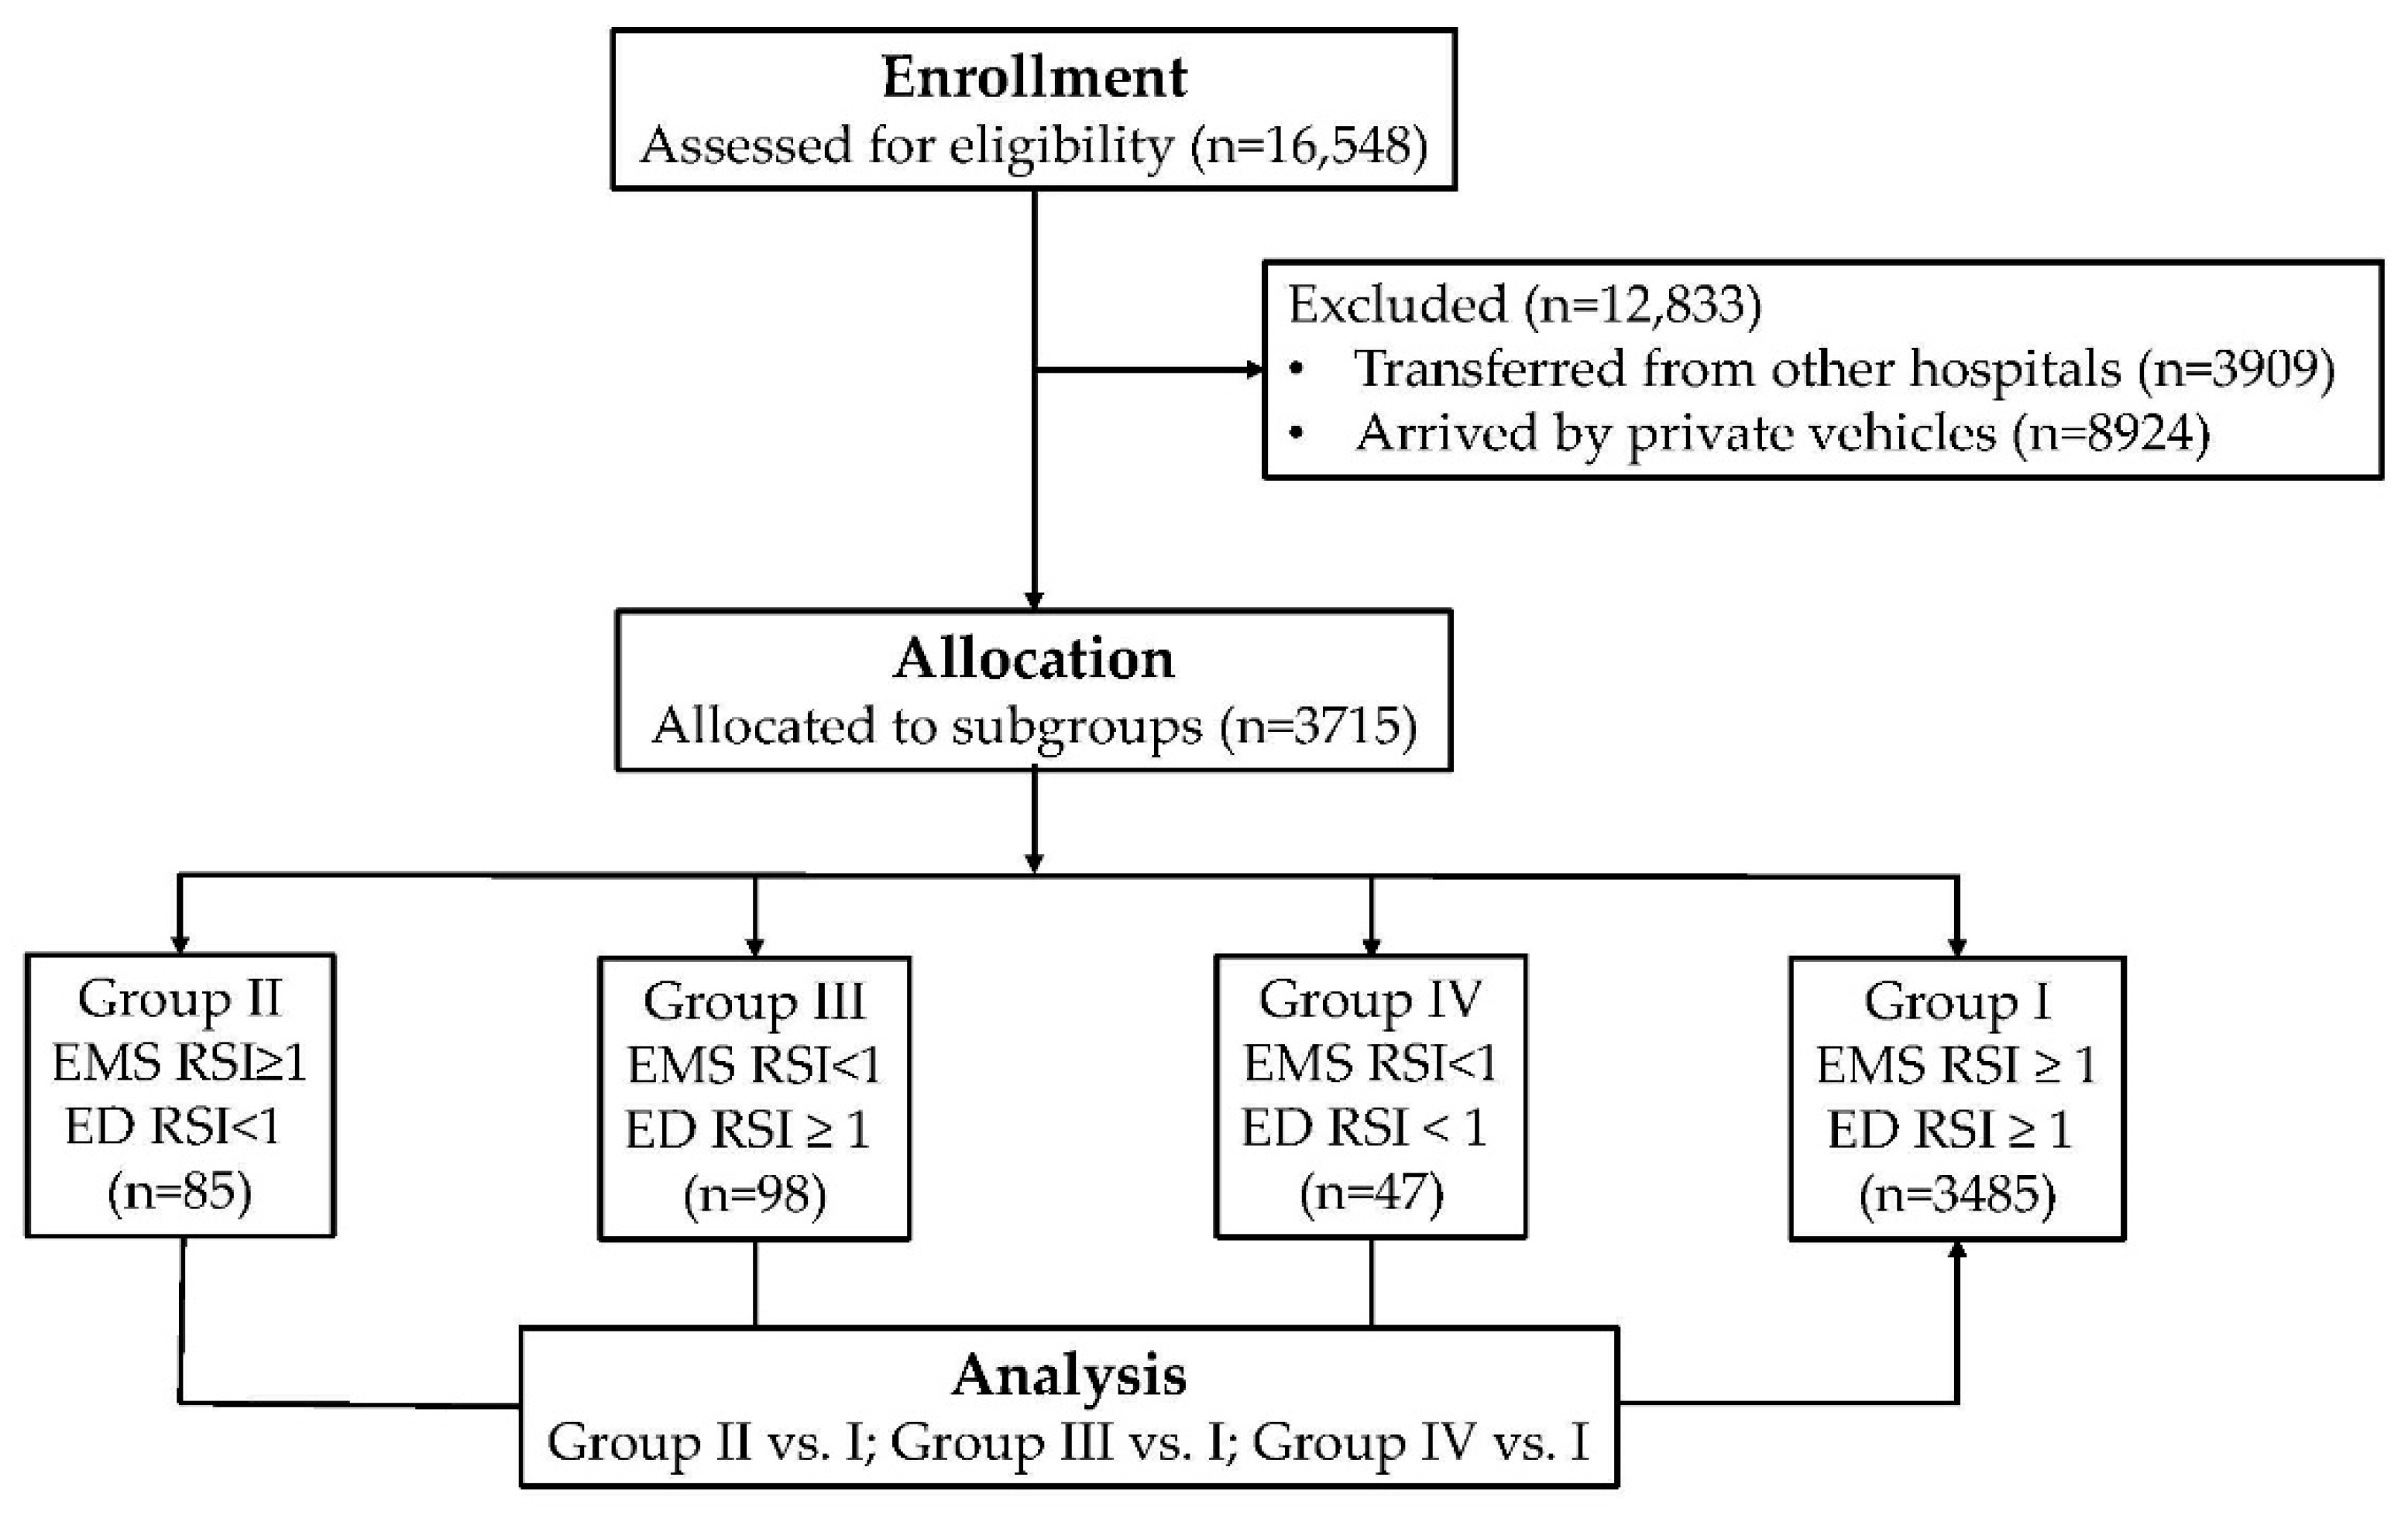
2. Methods
2.1. Ethics Statement
2.2. Study Design
3. Results
3.1. Patient Injury Characteristics
3.2. Management Characteristics
3.3. Associated Injuries
3.4. LOS in Hospital and ICU
4. Discussion
5. Conclusions
Acknowledgments
Author Contributions
Conflicts of Interest
Abbreviations
| AOR | Adjusted odd ratio |
| AIS | Abbreviated injury scale |
| CI | Confidence interval |
| ED | Emergency department |
| EMS | Emergency medical services |
| GCS | Glasgow coma scale |
| HR | Heart rate |
| ICU | Intensive care unit |
| ISS | Injury severity score |
| LOS | Length of stay |
| NISS | New injury severity score |
| OR | Odds ratio |
| RSI | Reverse shock index |
| SI | Shock index |
| SBP | Systolic blood pressure |
| TRISS | Trauma and injury severity score |
References
- Chan, L.; Bartfield, J.M.; Reilly, K.M. The significance of out-of-hospital hypotension in blunt trauma patients. Acad. Emerg. Med. 1997, 4, 785–788. [Google Scholar] [CrossRef] [PubMed]
- Patton, K.; Funk, D.L.; McErlean, M.; Bartfield, J.M. Accuracy of estimation of external blood loss by EMS personnel. J. Trauma 2001, 50, 914–916. [Google Scholar] [CrossRef] [PubMed]
- Holler, J.G.; Bech, C.N.; Henriksen, D.P.; Mikkelsen, S.; Pedersen, C.; Lassen, A.T. Nontraumatic hypotension and shock in the emergency department and the prehospital setting, prevalence, etiology, and mortality: A systematic review. PLoS ONE 2015, 10, e0119331. [Google Scholar] [CrossRef] [PubMed]
- Victorino, G.P.; Battistella, F.D.; Wisner, D.H. Does tachycardia correlate with hypotension after trauma? J. Am. Coll. Surg. 2003, 196, 679–684. [Google Scholar] [CrossRef]
- Brasel, K.J.; Guse, C.; Gentilello, L.M.; Nirula, R. Heart rate: Is it truly a vital sign? J. Trauma 2007, 62, 812–817. [Google Scholar] [CrossRef] [PubMed]
- Havel, C.; Arrich, J.; Losert, H.; Gamper, G.; Mullner, M.; Herkner, H. Vasopressors for hypotensive shock. Cochrane Database Syst. Rev. 2011, 5. [Google Scholar] [CrossRef]
- Andersen, G.O. Circulatory shock. N. Engl. J. Med. 2014, 370, 583. [Google Scholar] [PubMed]
- Bruns, B.; Gentilello, L.; Elliott, A.; Shafi, S. Prehospital hypotension redefined. J. Trauma 2008, 65, 1217–1221. [Google Scholar] [CrossRef] [PubMed]
- Lalezarzadeh, F.; Wisniewski, P.; Huynh, K.; Loza, M.; Gnanadev, D. Evaluation of prehospital and emergency department systolic blood pressure as a predictor of in-hospital mortality. Am. Surg. 2009, 75, 1009–1014. [Google Scholar] [PubMed]
- Hasler, R.M.; Nuesch, E.; Juni, P.; Bouamra, O.; Exadaktylos, A.K.; Lecky, F. Systolic blood pressure below 110 mmHg is associated with increased mortality in penetrating major trauma patients: Multicentre cohort study. Resuscitation 2012, 83, 476–481. [Google Scholar] [CrossRef] [PubMed]
- King, R.W.; Plewa, M.C.; Buderer, N.M.; Knotts, F.B. Shock index as a marker for significant injury in trauma patients. Acad. Emerg. Med. 1996, 3, 1041–1045. [Google Scholar] [CrossRef] [PubMed]
- Rady, M.Y.; Smithline, H.A.; Blake, H.; Nowak, R.; Rivers, E. A comparison of the shock index and conventional vital signs to identify acute, critical illness in the emergency department. Ann. Emerg. Med. 1994, 24, 685–690. [Google Scholar] [CrossRef]
- Cannon, C.M.; Braxton, C.C.; Kling-Smith, M.; Mahnken, J.D.; Carlton, E.; Moncure, M. Utility of the shock index in predicting mortality in traumatically injured patients. J. Trauma 2009, 67, 1426–1430. [Google Scholar] [CrossRef] [PubMed]
- Gutierrez, G.; Reines, H.D.; Wulf-Gutierrez, M.E. Clinical review: Hemorrhagic shock. Crit. Care 2004, 8, 373–381. [Google Scholar] [CrossRef] [PubMed] [Green Version]
- Mitra, B.; Fitzgerald, M.; Chan, J. The utility of a shock index ≥ 1 as an indication for pre-hospital oxygen carrier administration in major trauma. Injury 2014, 45, 61–65. [Google Scholar] [CrossRef] [PubMed]
- McNab, A.; Burns, B.; Bhullar, I.; Chesire, D.; Kerwin, A. An analysis of shock index as a correlate for outcomes in trauma by age group. Surgery 2013, 154, 384–387. [Google Scholar] [CrossRef] [PubMed]
- DeMuro, J.P.; Simmons, S.; Jax, J.; Gianelli, S.M. Application of the Shock Index to the prediction of need for hemostasis intervention. Am. J. Emerg. Med. 2013, 31, 1260–1263. [Google Scholar] [CrossRef] [PubMed]
- Rady, M.Y.; Rivers, E.P.; Martin, G.B.; Smithline, H.; Appelton, T.; Nowak, R.M. Continuous central venous oximetry and shock index in the emergency department: Use in the evaluation of clinical shock. Am. J. Emerg. Med. 1992, 10, 538–541. [Google Scholar] [CrossRef]
- Mutschler, M.; Nienaber, U.; Munzberg, M.; Wolfl, C.; Schoechl, H.; Paffrath, T.; Bouillon, B.; Maegele, M. The Shock Index revisited—A fast guide to transfusion requirement? A retrospective analysis on 21,853 patients derived from the TraumaRegister DGU. Crit. Care 2013, 17, R172. [Google Scholar] [CrossRef] [PubMed]
- Rady, M.Y.; Nightingale, P.; Little, R.A.; Edwards, J.D. Shock index: A re-evaluation in acute circulatory failure. Resuscitation 1992, 23, 227–234. [Google Scholar] [CrossRef]
- Heffner, A.C.; Swords, D.S.; Nussbaum, M.L.; Kline, J.A.; Jones, A.E. Predictors of the complication of postintubation hypotension during emergency airway management. J. Crit. Care 2012, 27, 587–593. [Google Scholar] [CrossRef] [PubMed]
- Edla, S.; Reisner, A.T.; Liu, J.; Convertino, V.A.; Carter, R., 3rd; Reifman, J. In reply to “Utility of shock index calculation in hemorrhagic trauma”. Am. J. Emerg. Med. 2015, 33, 978–979. [Google Scholar] [CrossRef] [PubMed]
- Kristensen, A.K.; Holler, J.G.; Hallas, J.; Lassen, A.; Shapiro, N.I. Is shock index a valid predictor of mortality in emergency department patients with hypertension, diabetes, high age, or receipt of β- or calcium channel blockers? Ann. Emerg. Med. 2016, 67, 106–113. [Google Scholar] [CrossRef] [PubMed]
- McNab, A.; Burns, B.; Bhullar, I.; Chesire, D. Kerwin, A. A prehospital shock index for trauma correlates with measures of hospital resource use and mortality. Surgery 2012, 152, 473–476. [Google Scholar] [CrossRef] [PubMed]
- Morrison, C.A.; Carrick, M.M.; Norman, M.A.; Scott, B.G.; Welsh, F.J.; Tsai, P.; Liscum, K.R.; Wall, M.J., Jr.; Mattox, K.L. Hypotensive resuscitation strategy reduces transfusion requirements and severe postoperative coagulopathy in trauma patients with hemorrhagic shock: Preliminary results of a randomized controlled trial. J. Trauma 2011, 70, 652–663. [Google Scholar] [CrossRef] [PubMed]
- Kwan, I.; Bunn, F.; Chinnock, P.; Roberts, I. Timing and volume of fluid administration for patients with bleeding. Cochrane Database Syst. Rev. 2014, 3, Cd002245. [Google Scholar] [PubMed]
- Harrois, A.; Hamada, S.R.; Duranteau, J. Fluid resuscitation and vasopressors in severe trauma patients. Curr. Opin. Crit. Care 2014, 20, 632–637. [Google Scholar] [CrossRef] [PubMed]
- Spahn, D.R.; Bouillon, B.; Cerny, V.; Coats, T.J.; Duranteau, J.; Fernandez-Mondejar, E.; Filipescu, D.; Hunt, B.J.; Komadina, R.; Nardi, G.; et al. Management of bleeding and coagulopathy following major trauma: An updated European guideline. Crit. Care 2013, 17, R76. [Google Scholar] [CrossRef] [PubMed] [Green Version]
- Hai, S.A. Permissive hypotensive resuscitation—An evolving concept in trauma. JPMA J. Pak. Med. Assoc. 2004, 54, 434–436. [Google Scholar] [PubMed]
- Kreimeier, U.; Prueckner, S.; Peter, K. Permissive hypotension. Schweiz. Med. Wochenschr. 2000, 130, 1516–1524. [Google Scholar] [PubMed]
- Smith, J.B.; Pittet, J.F.; Pierce, A. Hypotensive Resuscitation. Curr. Anesthesiol. Rep. 2014, 4, 209–215. [Google Scholar] [CrossRef] [PubMed]
- Dutton, R.P.; Stansbury, L.G.; Leone, S.; Kramer, E.; Hess, J.R.; Scalea, T.M. Trauma mortality in mature trauma systems: Are we doing better? An analysis of trauma mortality patterns, 1997–2008. J. Trauma 2010, 69, 620–626. [Google Scholar] [CrossRef] [PubMed]
- Moscati, R.; Billittier, A.J.; Marshall, B.; Fincher, M.; Jehle, D.; Braen, G.R. Blood loss estimation by out-of-hospital emergency care providers. Prehosp. Emerg. Care 1999, 3, 239–242. [Google Scholar] [CrossRef] [PubMed]
- Travers, D.A.; Waller, A.E.; Bowling, J.M.; Flowers, D.; Tintinalli, J. Five-level triage system more effective than three-level in tertiary emergency department. J. Emerg. Nurs. 2002, 28, 395–400. [Google Scholar] [CrossRef] [PubMed]


| Variables | EMS RSI ≥ 1 ED RSI < 1 n = 85 (II) | EMS RSI < 1 ED RSI ≥ 1 n = 98 (III) | EMS RSI < 1 ED RSI < 1 n = 47 (IV) | EMS RSI ≥ 1 ED RSI ≥ 1 n = 3485 (I) | OR (95%CI) p | OR (95%CI) p | OR (95%CI) p | |||
|---|---|---|---|---|---|---|---|---|---|---|
| II vs. I | III vs. I | IV vs. I | ||||||||
| Age | 36.6 ± 13.5 | 39.2 ± 15.5 | 38.9 ± 12.5 | 41.9 ± 14.4 | - | 0.001 | - | 0.071 | - | 0.158 |
| Gender | 0.021 | 0.690 | 0.011 | |||||||
| Male | 60 (70.6) | 55 (56.1) | 36 (76.6) | 2026 (58.1) | 1.7 (1.1–2.8) | 0.9 (0.6–1.4) | 2.4 (1.2–4.7) | |||
| Female | 25 (29.4) | 43 (43.9) | 11 (23.4) | 1459 (41.9) | 0.6 (0.4–0.9) | 1.1 (0.7–1.6) | 0.4 (0.2–0.8) | |||
| GCS | 12.4 ± 3.8 | 14.2 ± 2.1 | 13.0 ± 3.3 | 14.3 ± 2.1 | - | <0.001 | - | 0.669 | - | <0.001 |
| ≤8 | 16 (18.8) | 5 (5.1) | 7 (14.9) | 148 (4.2) | 5.2 (3.0–9.2) | <0.001 | 1.2 (0.5–3.0) | 0.680 | 3.9 (1.7–9.0) | <0.001 |
| 9–12 | 13 (15.3) | 5 (5.1) | 5 (10.6) | 156 (4.5) | 3.9 (2.1–7.1) | <0.001 | 1.1 (0.5–2.9) | 0.768 | 2.5 (1.0–6.5) | 0.044 |
| ≥13 | 56 (65.9) | 88 (89.8) | 35 (74.5) | 3181 (91.3) | 0.2 (0.1–0.3) | <0.001 | 0.8 (0.4–1.6) | 0.609 | 0.3 (0.1–0.5) | <0.001 |
| AIS | ||||||||||
| Head/Neck | 39 (45.9) | 32 (32.7) | 22 (46.8) | 1074 (30.8) | 1.9 (1.2–2.9) | 0.003 | 1.1 (0.7–1.7) | 0.698 | 2.0 (1.1–3.5) | 0.019 |
| Face | 19 (22.4) | 21 (21.4) | 11 (23.4) | 734 ( (21.1) | 1.1 (0.6–1.8) | 0.773 | 1.0 (0.6–1.7) | 0.930 | 1.1 (0.6–2.3) | 0.696 |
| Thorax | 29 (34.1) | 23 (23.5) | 23 (48.9) | 477 (13.7) | 3.3 (2.1–5.2) | <0.001 | 1.9 (1.2–3.1) | 0.006 | 6.0 (3.4–10.8) | <0.001 |
| Abdomen | 21 (24.7) | 10 (10.2) | 19 (40.4) | 237 (6.8) | 4.5 (2.7–7.5) | <0.001 | 1.6 (0.8–3.0) | 0.190 | 9.3 (5.1–16.9) | <0.001 |
| Extremity | 54 (63.5) | 72 (73.5) | 33 (70.2) | 2585 (74.2) | 0.6 (0.4–1.0) | 0.027 | 1.0 (0.6–1.5) | 0.875 | 0.8 (0.4–1.5) | 0.538 |
| ISS | 15.1 ± 11.1 | 10.5 ± 7.1 | 15.8 ± 11.3 | 8.9 ± 6.9 | - | <0.001 | - | 0.026 | - | <0.001 |
| <16 | 48 (56.5) | 76 (77.6) | 23 (48.9) | 2794 (80.2) | 0.3 (0.2–0.5) | <0.001 | 0.9 (0.5–1.4) | 0.522 | 0.2 (0.1–0.4) | <0.001 |
| 16–24 | 16 (18.9) | 16 (6.1) | 14 (29.8) | 483 (13.9) | 1.4 (0.8–2.5) | 0.192 | 1.2 (0.7–2.1) | 0.487 | 2.6 (1.4–5.0) | 0.002 |
| ≥25 | 21 (24.7) | 6 (6.1) | 10 (21.3) | 208 (6.0) | 5.2 (3.1–8.6) | <0.001 | 1.0 (0.5–2.4) | 0.949 | 4.3 (2.1–8.7) | <0.001 |
| NISS | 17.8 ± 14.4 | 12.3 ± 8.3 | 16.7 ± 12.6 | 10.5 ± 8.5 | - | <0.001 | - | 0.036 | - | <0.001 |
| TRISS | 0.953 ± 0.213 | 0.980 ± 0.142 | 0.957 ± 0.204 | 0.991 ± 0.093 | - | <0.001 | - | 0.233 | - | 0.016 |
| Mortality | 11 (12.9) | 1 (1.0) | 2 (4.3) | 32 (0.9) | 16.0 (7.8–33.0) | <0.001 | 1.1 (0.2–8.2) | 0.917 | 4.8 (1.1–20.6) | 0.020 |
| ISS | - | - | - | - | 5.8 (2.3–14.4) | <0.001 | 1.0 (1.0–1.1) | 0.053 | 1.1 (1.1–1.1) | <0.001 |
| Variables | EMS RSI ≥ 1 ED RSI < 1 n = 85 (II) | EMS RSI < 1 ED RSI ≥ 1 n = 98 (III) | EMS RSI < 1 ED RSI < 1 n = 47 (IV) | EMS RSI ≥ 1 ED RSI ≥ 1 n = 3485 (I) | OR (95%CI) p | OR (95%CI) p | OR (95%CI) p | |||
|---|---|---|---|---|---|---|---|---|---|---|
| II vs. I | III vs. I | IV vs. I | ||||||||
| Transport time | ||||||||||
| Mean (mins) | 23.0 ± 9.6 | 24.2 ± 8.9 | 22.1 ± 6.7 | 22.8 ± 9.4 | - | 0.864 | - | 0.138 | - | 0.603 |
| Range (mins) | 10–67 | 12–68 | 10–36 | 4–142 | - | - | - | - | - | - |
| Procedures performed by EMS personnel | ||||||||||
| Intubation | 0 (0.0) | 0 (0.0) | 0 (0.0) | 0 (0.0) | - | - | - | - | - | - |
| Airway | 2 (2.4) | 4 (4.1) | 1 (2.1) | 17 (0.5) | 4.9 (1.1–21.6) | 0.020 | 8.7 (2.9–26.3) | <0.001 | 4.4 (0.6–34.0) | 0.117 |
| Neck collar | 29 (34.1) | 28 (28.6) | 22 (46.8) | 849 (24.4) | 1.6 (1.0–2.5) | 0.039 | 1.2 (0.8–1.9) | 0.339 | 2.7 (1.5–4.9) | <0.001 |
| Backboard | 36 (42.4) | 36 (36.7) | 23 (48.9) | 930 (26.7) | 2.0 (1.3–3.1) | 0.001 | 1.6 (1.1–2.4) | 0.027 | 2.6 (1.5–4.7) | 0.001 |
| Spinal immobilizer | 3 (3.5) | 1 (1.0) | 0 (0.0) | 12 (0.3) | 10.6 (2.9–38.2) | <0.001 | 3.0 (0.4–23.2) | 0.272 | 1.0 (1.0–1.0) | 0.687 |
| Oxygenation | 15 (17.6) | 12 (12.2) | 11 (23.4) | 203 (5.8) | 3.5 (2.0–6.2) | <0.001 | 2.3 (1.2–4.2) | 0.008 | 4.9 (2.5–9.9) | <0.001 |
| Cardiopulmonary resuscitation | 1 (1.2) | 0 (0.0) | 0 (0.0) | 1 (0.0) | 41.5 (2.6–668.7) | <0.001 | - | 0.867 | - | 0.908 |
| Procedures at ED | ||||||||||
| Intubation | 18 (21.2) | 5 (5.1) | 8 (17.0) | 117 (3.4) | 7.7 (4.5–13.4) | <0.001 | 1.5 (0.6–3.9) | 0.348 | 5.9 (2.7–12.9) | <0.001 |
| Chest tube insertion | 9 (10.6) | 3 (3.1) | 5 (10.6) | 43 (1.2) | 9.5 (4.5–20.1) | <0.001 | 2.5 (0.8–8.3) | 0.113 | 9.5 (3.6–25.3) | <0.001 |
| Blood transfusion | 21 (24.7) | 4 (4.1) | 15 (31.9) | 92 (2.6) | 12.1 (7.1–20.7) | <0.001 | 1.6 (0.6–4.4) | 0.383 | 17.3 (9.1–33.0) | <0.001 |
| Variables | EMS RSI ≥ 1 ED RSI < 1 n = 85 (II) | EMS RSI < 1 ED RSI ≥ 1 n = 98 (III) | EMS RSI < 1 ED RSI < 1 n = 47 (IV) | EMS RSI ≥ 1 ED RSI ≥ 1 n = 3485 (I) | OR (95%CI) p | OR (95%CI) p | OR (95%CI) p | |||
|---|---|---|---|---|---|---|---|---|---|---|
| II vs. I | III vs. I | IV vs. I | ||||||||
| Head/Neck trauma | ||||||||||
| Neurologic deficit | 1 (1.2) | 1 (1.0) | 0 (0.0) | 24 (0.7) | 1.7 (0.2–12.8) | 0.594 | 1.5 (0.2–11.1) | 0.697 | 1.0 (1.0–1.0) | 0.568 |
| Cranial fracture | 10 (11.8) | 6 (6.1) | 1 (2.1) | 258 (7.4) | 1.7 (0.9–3.3) | 0.132 | 0.8 (0.4–1.9) | 0.632 | 0.3 (0.0–2.0) | 0.168 |
| Epidural hematoma | 5 (5.9) | 4 (4.1) | 2 (4.3) | 173 (5.0) | 1.2 (0.5–3.0) | 0.701 | 0.8 (0.3–2.2) | 0.691 | 0.9 (0.2–3.5) | 0.824 |
| Subdural hematoma | 10 (11.8) | 7 (7.1) | 4 (8.5) | 319 (9.2) | 1.3 (0.7–2.6) | 0.411 | 0.8 (0.4–1.7) | 0.495 | 0.9 (0.3–2.6) | 0.879 |
| Subarachnoid hemorrhage | 10 (11.8) | 8 (8.2) | 5 (10.6) | 382 (11.0) | 1.1 (0.6–2.1) | 0.815 | 0.7 (0.4–1.5) | 0.380 | 1.0 (0.4–2.5) | 0.944 |
| Intracerebral hematoma | 6 (7.1) | 1 (1.0) | 0 (0.0) | 69 (2.0) | 3.8 (1.6–8.9) | 0.001 | 0.5 (0.1–3.7) | 0.498 | - | 0.330 |
| Cerebral contusion | 5 (5.9) | 8 (8.2) | 1 (2.1) | 173 (5.0) | 1.2 (0.5–3.0) | 0.701 | 1.7 (0.8–3.6) | 0.154 | 0.4 (0.1–3.0) | 0.372 |
| Cervical vertebral fracture | 3 (3.5) | 1 (1.0) | 1 (2.1) | 28 (0.8) | 4.5 (1.4–15.2) | 0.007 | 1.3 (0.2–9.5) | 0.813 | 2.7 (0.4–20.2) | 0.318 |
| Maxillofacial trauma | ||||||||||
| Orbital fracture | 0 (0.0) | 4 (4.1) | 0 (0.0) | 77 (2.2) | - | 0.166 | 1.9 (0.7–5.3) | 0.219 | - | 0.303 |
| Maxillary fracture | 0 (0.0) | 1 (1.0) | 1 (2.1) | 54 (1.5) | - | 0.248 | 0.7 (0.1–4.8) | 0.674 | 1.4 (0.2–10.2) | 0.750 |
| Mandibular fracture | 6 (7.1) | 10 (10.2) | 6 (12.8) | 247 (7.1) | 1.0 (0.4–2.3) | 0.992 | 1.5 (0.8–2.9) | 0.238 | 1.9 (0.8–4.6) | 0.134 |
| Nasal fracture | 1 (1.2) | 3 (3.1) | 2 (4.3) | 80 (2.3) | 0.5 (0.1–3.7) | 0.494 | 1.3 (0.4–4.3) | 0.619 | 1.9 (0.5–7.9) | 0.375 |
| Thoracic trauma | ||||||||||
| Rib fracture | 11 (12.9) | 17 (17.3) | 14 (29.8) | 357 (10.2) | 1.3 (0.7–2.5) | 0.419 | 1.8 (1.1–3.1) | 0.023 | 3.7 (2.0–7.0) | <0.001 |
| Hemothorax | 3 (3.5) | 6 (6.1) | 4 (8.5) | 48 (1.4) | 2.6 (0.8–8.6) | 0.099 | 4.7 (2.0–11.2) | <0.001 | 6.7 (2.3–19.3) | <0.001 |
| Pneumothorax | 4 (4.7) | 2 (2.0) | 3 (6.4) | 57 (1.6) | 3.0 (1.1–8.4) | 0.031 | 1.3 (0.3–5.2) | 0.756 | 4.1 (1.2–13.6) | 0.012 |
| Hemopneumothorax | 5 (5.9) | 2 (2.0) | 6 (12.8) | 35 (1.0) | 6.2 (2.4–16.1) | <0.001 | 2.1 (0.5–8.7) | 0.317 | 14.4 (5.8–36.2) | <0.001 |
| Lung contusion | 4 (4.7) | 0 (0.0) | 0 (0.0) | 43 (1.2) | 4.0 (1.4–11.3) | 0.006 | - | 0.269 | - | 0.444 |
| Abdominal trauma | ||||||||||
| Intra–abdominal injury | 4 (4.7) | 1 (1.0) | 7 (14.9) | 77 (2.2) | 2.2 (0.8–6.1) | 0.127 | 0.5 (0.1–3.3) | 0.426 | 7.7 (3.4–17.8) | <0.001 |
| Hepatic injury | 12 (14.1) | 5 (5.1) | 7 (14.9) | 70 (2.0) | 8.0 (4.2–15.4) | <0.001 | 2.6 (1.0–6.7) | 0.035 | 8.5 (3.7–19.7) | <0.001 |
| Splenic injury | 4 (4.7) | 2 (2.0) | 4 (8.5) | 28 (0.8) | 6.1 (2.1–17.8) | <0.001 | 2.6 (0.6–11.0) | 0.185 | 11.5 (3.9–34.2) | <0.001 |
| Retroperitoneal injury | 2 (2.4) | 0 (0.0) | 0 (0.0) | 5 (0.1) | 16.8 (3.2–87.7) | <0.001 | - | 0.707 | - | 0.795 |
| Renal injury | 2 (2.4) | 0 (0.0) | 1 (2.1) | 13 (0.4) | 6.4 (1.4–29.0) | 0.005 | - | 0.545 | 5.8 (0.7–45.3) | 0.057 |
| Extremity trauma | ||||||||||
| Humeral fracture | 1 (1.2) | 5 (5.1) | 3 (6.4) | 174 (5.0) | 0.2 (0.0–1.6) | 0.107 | 1.0 (0.4–2.6) | 0.961 | 1.3 (0.4–4.2) | 0.664 |
| Radial fracture | 5 (5.9) | 7 (7.1) | 3 (6.4) | 351 (10.1) | 0.6 (0.2–1.4) | 0.203 | 0.7 (0.3–1.5) | 0.340 | 0.6 (0.2–2.0) | 0.403 |
| Ulnar fracture | 3 (3.5) | 5 (5.1) | 4 (8.5) | 173 (5.0) | 0.7 (0.2–2.2) | 0.546 | 1.0 (0.4–2.6) | 0.951 | 1.8 (0.6–5.0) | 0.268 |
| Pelvic fracture | 6 (7.1) | 4 (4.1) | 7 (14.9) | 121 (3.5) | 2.1 (0.9–4.9) | 0.078 | 1.2 (0.4–3.3) | 0.746 | 4.9 (2.1–11.1) | <0.001 |
| Femoral fracture | 14 (16.5) | 14 (14.3) | 8 (17.0) | 393 (11.3) | 1.6 (0.9–2.8) | 0.137 | 1.3 (0.7–2.3) | 0.355 | 1.6 (0.8–3.5) | 0.218 |
| Tibial fracture | 10 (11.8) | 14 (14.3) | 5 (10.6) | 373 (10.7) | 1.1 (0.6–2.2) | 0.755 | 1.4 (0.8–2.5) | 0.260 | 1.0 (0.4–2.5) | 0.989 |
| Fibular fracture | 5 (5.9) | 10 (10.2) | 3 (6.4) | 222 (6.4) | 0.9 (0.4–2.3) | 0.856 | 1.7 (0.9–3.3) | 0.128 | 1.0 (0.3–3.3) | 0.997 |
| Variables | EMS RSI ≥ 1 ED RSI < 1 n = 85 (II) | EMS RSI < 1 ED RSI ≥ 1 n = 98 (III) | EMS RSI < 1 ED RSI < 1 n = 47 (IV) | EMS RSI ≥ 1 ED RSI ≥ 1 n = 3485 (I) | OR (95%CI) p | OR (95%CI) p | OR (95%CI) p | |||
|---|---|---|---|---|---|---|---|---|---|---|
| II vs. I | III vs. I | IV vs. I | ||||||||
| Hospital LOS | ||||||||||
| days | 15.2 ± 14.5 | 10.9 ± 12.0 | 16.9 ± 16.2 | 9.5 ± 9.4 | - | 0.001 | - | 0.156 | - | <0.001 |
| ICU LOS | ||||||||||
| n (%) | 39 (45.9) | 19 (19.4) | 24 (51.1) | 575 (16.5) | 4.3 (2.8–6.6) | <0.001 | 1.2 (0.7–2.0) | 0.448 | 5.3 (3.0–9.4) | <0.001 |
| days | 13.1 ± 14.3 | 6.5 ± 6.2 | 13.0 ± 20.3 | 7.6 ± 8.2 | - | 0.296 | - | 0.397 | - | 0.070 |
© 2016 by the authors; licensee MDPI, Basel, Switzerland. This article is an open access article distributed under the terms and conditions of the Creative Commons by Attribution (CC-BY) license (http://creativecommons.org/licenses/by/4.0/).
Share and Cite
Lai, W.-H.; Rau, C.-S.; Hsu, S.-Y.; Wu, S.-C.; Kuo, P.-J.; Hsieh, H.-Y.; Chen, Y.-C.; Hsieh, C.-H. Using the Reverse Shock Index at the Injury Scene and in the Emergency Department to Identify High-Risk Patients: A Cross-Sectional Retrospective Study. Int. J. Environ. Res. Public Health 2016, 13, 357. https://doi.org/10.3390/ijerph13040357
Lai W-H, Rau C-S, Hsu S-Y, Wu S-C, Kuo P-J, Hsieh H-Y, Chen Y-C, Hsieh C-H. Using the Reverse Shock Index at the Injury Scene and in the Emergency Department to Identify High-Risk Patients: A Cross-Sectional Retrospective Study. International Journal of Environmental Research and Public Health. 2016; 13(4):357. https://doi.org/10.3390/ijerph13040357
Chicago/Turabian StyleLai, Wei-Hung, Cheng-Shyuan Rau, Shiun-Yuan Hsu, Shao-Chun Wu, Pao-Jen Kuo, Hsiao-Yun Hsieh, Yi-Chun Chen, and Ching-Hua Hsieh. 2016. "Using the Reverse Shock Index at the Injury Scene and in the Emergency Department to Identify High-Risk Patients: A Cross-Sectional Retrospective Study" International Journal of Environmental Research and Public Health 13, no. 4: 357. https://doi.org/10.3390/ijerph13040357