
Greenness and Birth Outcomes in a Range of Pennsylvania Communities


Abstract
:1. Introduction
2. Materials and Methods
2.1. Conceptual Framework
2.2. Setting and Study Population
2.3. Outcome Assessment
2.4. Individual- and Community-Level Covariates
2.5. Greenness Exposure Assessment
2.6. Statistical Analysis
2.7. Sensitivity Analyses
3. Results
4. Discussion
5. Conclusions
Supplementary Materials
Acknowledgments
Author Contributions
Conflicts of Interest
Abbreviations
| AFO | Animal feeding operation |
| CSD | community socioeconomic deprivation |
| EHR | electronic health record |
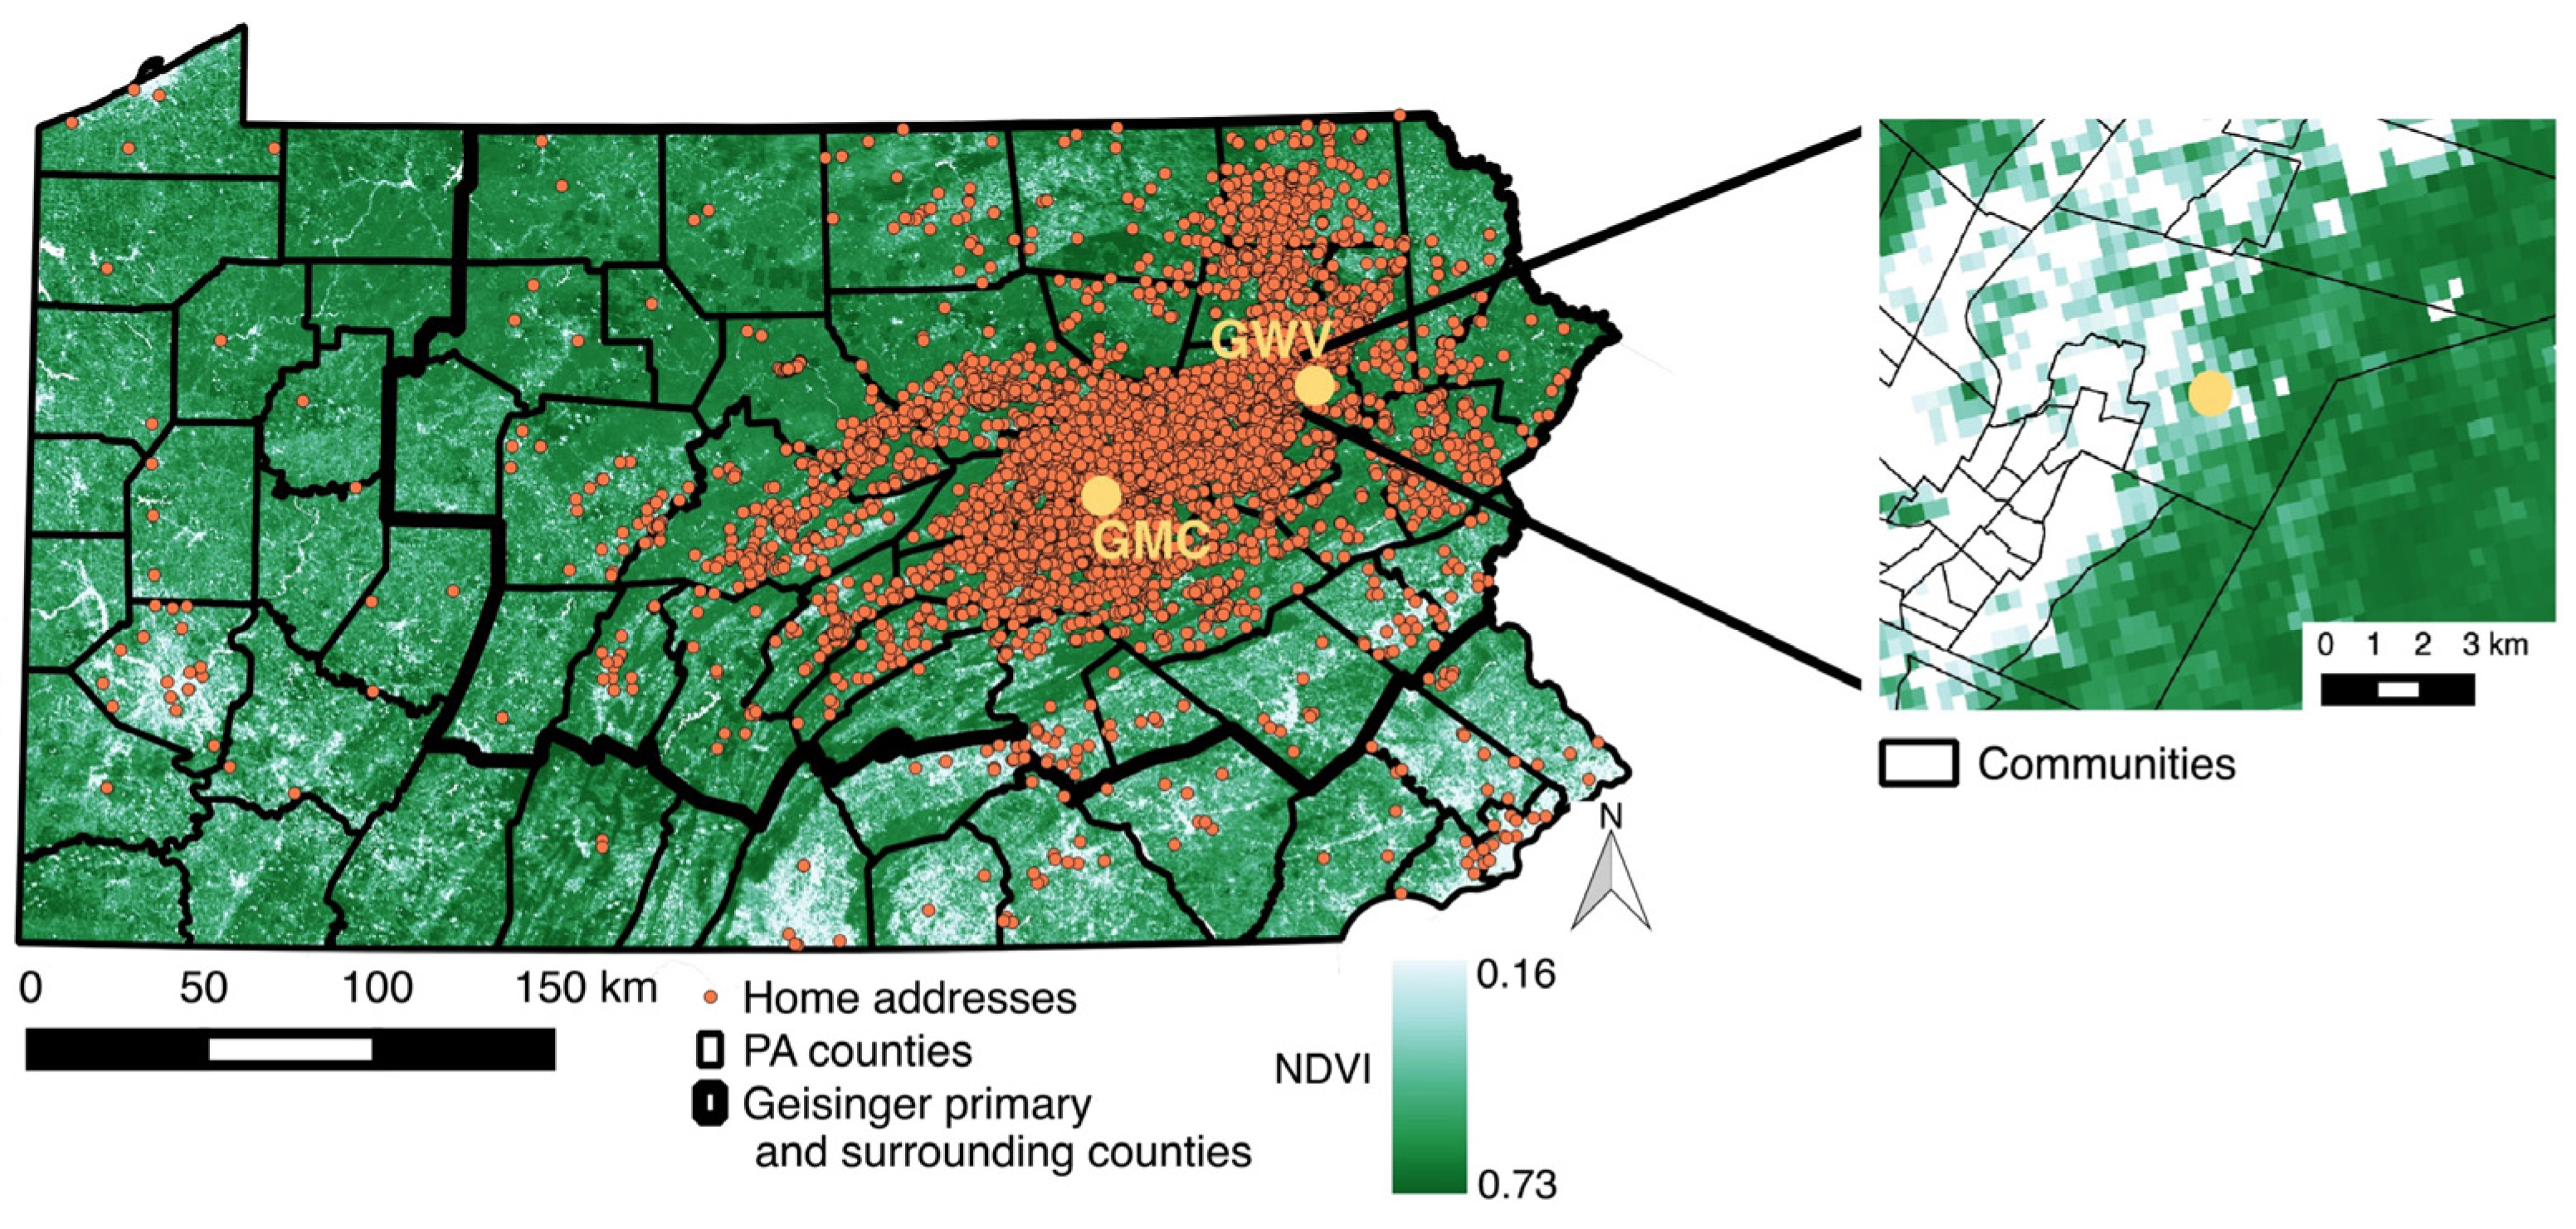
| GMC | Geisinger Medical Center |
| GWV | Geisinger Wyoming Valley |
| MODIS | Moderate-resolution Imaging Spectroradiometer |
| NDVI | normalized difference vegetation index |
| PADEP | Pennsylvania Department of Environmental Protection |
| SES | socioeconomic status |
| UNGD | Unconventional natural gas development |
References
- Wilson, E. Biophilia; Harvard University Press: Cambridge, MA, USA, 1984. [Google Scholar]
- James, P.; Banay, R.F.; Hart, J.E.; Laden, F. A review of the health benefits of greenness. Curr. Epidemiol. Rep. 2015, 2, 131–142. [Google Scholar] [CrossRef] [PubMed]
- Dadvand, P.; de Nazelle, A.; Figueras, F.; Basagana, X.; Su, J.; Amoly, E.; Jerrett, M.; Vrijheid, M.; Sunyer, J.; Nieuwenhuijsen, M.J. Green space, health inequality and pregnancy. Environ. Int. 2012, 40, 110–115. [Google Scholar] [CrossRef] [PubMed]
- Dadvand, P.; Sunyer, J.; Basagana, X.; Ballester, F.; Lertxundi, A.; Fernandez-Somoano, A.; Estarlich, M.; Garcia-Esteban, R.; Mendez, M.A.; Nieuwenhuijsen, M.J. Surrounding greenness and pregnancy outcomes in four Spanish birth cohorts. Environ. Health Perspect. 2012, 120, 1481–1487. [Google Scholar] [CrossRef] [PubMed]
- Dadvand, P.; Wright, J.; Martinez, D.; Basagana, X.; McEachan, R.R.; Cirach, M.; Gidlow, C.J.; de Hoogh, K.; Grazuleviciene, R.; Nieuwenhuijsen, M.J. Inequality, green spaces, and pregnant women: Roles of ethnicity and individual and neighbourhood socioeconomic status. Environ. Int. 2014, 71, 101–108. [Google Scholar] [CrossRef] [PubMed]
- Markevych, I.; Fuertes, E.; Tiesler, C.M.; Birk, M.; Bauer, C.P.; Koletzko, S.; von Berg, A.; Berdel, D.; Heinrich, J. Surrounding greenness and birth weight: Results from the GINIplus and LISAplus birth cohorts in Munich. Health Place 2014, 26, 39–46. [Google Scholar] [CrossRef] [PubMed]
- Kihal-Talantikite, W.; Padilla, C.M.; Lalloue, B.; Gelormini, M.; Zmirou-Navier, D.; Deguen, S. Green space, social inequalities and neonatal mortality in France. BMC Pregnancy Childbirth 2013, 13, 191. [Google Scholar] [CrossRef] [PubMed] [Green Version]
- Grazuleviciene, R.; Danileviciute, A.; Dedele, A.; Vencloviene, J.; Andrusaityte, S.; Uzdanaviciute, I.; Nieuwenhuijsen, M.J. Surrounding greenness, proximity to city parks and pregnancy outcomes in Kaunas cohort study. Int. J. Hyg. Environ. Health 2015, 218, 358–365. [Google Scholar] [CrossRef] [PubMed]
- Agay-Shay, K.; Peled, A.; Crespo, A.V.; Peretz, C.; Amitai, Y.; Linn, S.; Friger, M.; Nieuwenhuijsen, M.J. Green spaces and adverse pregnancy outcomes. Occup. Environ. Med. 2014, 71, 562–569. [Google Scholar] [CrossRef] [PubMed]
- Hystad, P.; Davies, H.W.; Frank, L.; Van Loon, J.; Gehring, U.; Tamburic, L.; Brauer, M. Residential greenness and birth outcomes: Evaluating the influence of spatially correlated built-environment factors. Environ. Health Perspect. 2014, 122, 1095–1102. [Google Scholar] [CrossRef] [PubMed]
- Donovan, G.H.; Michael, Y.L.; Butry, D.T.; Sullivan, A.D.; Chase, J.M. Urban trees and the risk of poor birth outcomes. Health Place 2011, 17, 390–393. [Google Scholar] [CrossRef] [PubMed]
- Laurent, O.; Wu, J.; Li, L.; Milesi, C. Green spaces and pregnancy outcomes in Southern California. Health Place 2013, 24, 190–195. [Google Scholar] [CrossRef] [PubMed]
- Ebisu, K.; Holford, T.R.; Bell, M.L. Association between greenness, urbanicity, and birth weight. Sci. Total Environ. 2016, 542, 750–756. [Google Scholar] [CrossRef] [PubMed]
- Sacks, J.D.; Rappold, A.G.; Allen Davis, J.; Richardson, D.B.; Waller, A.E.; Luben, T.J. Influence of urbanicity and county characteristics on the association between ozone and asthma emergency department visits in North Carolina. Environ. Health Perspect. 2014, 122, 506–512. [Google Scholar] [CrossRef] [PubMed]
- Markevych, I.; Thiering, E.; Fuertes, E.; Sugiri, D.; Berdel, D.; Koletzko, S.; von Berg, A.; Bauer, C.-P.; Heinrich, J. A cross-sectional analysis of the effects of residential greenness on blood pressure in 10-year old children: Results from the GINIplus and LISAplus studies. BMC Public Health 2014, 14, 477. [Google Scholar] [CrossRef] [PubMed]
- Bertin, M.; Chevrier, C.; Serrano, T.; Monfort, C.; Rouget, F.; Cordier, S.; Viel, J.F. Association between prenatal exposure to traffic-related air pollution and preterm birth in the PELAGIE mother-child cohort, Brittany, France. Does the urban-rural context matter? Environ. Res. 2015, 142, 17–24. [Google Scholar] [CrossRef] [PubMed] [Green Version]
- Lederbogen, F.; Kirsch, P.; Haddad, L.; Streit, F.; Tost, H.; Schuch, P.; Wust, S.; Pruessner, J.C.; Rietschel, M.; Deuschle, M.; et al. City living and urban upbringing affect neural social stress processing in humans. Nature 2011, 474, 498–501. [Google Scholar] [CrossRef] [PubMed]
- Pirracchio, R.; Petersen, M.L.; van der Laan, M. Improving propensity score estimators’ robustness to model misspecification using Super Learner. Am. J. Epidemiol. 2015, 181, 108–119. [Google Scholar] [CrossRef] [PubMed]
- Rosenbaum, P.R.; Rubin, D.B. The central role of the propensity score in observational studies for causal effects. Biometrika 1983, 70, 41–55. [Google Scholar] [CrossRef]
- Casey, J.A.; Kim, B.F.; Larsen, J.; Price, L.B.; Nachman, K.E. Industrial food animal production and community health. Curr. Environ. Health Rep. 2015, 2, 259–271. [Google Scholar] [CrossRef] [PubMed]
- Sneeringer, S. Does animal feeding operation pollution hurt public health? A national longitudinal study of health externalities identified by geographic shifts in livestock production. Am. J. Agric. Econ. 2009, 91, 124–137. [Google Scholar] [CrossRef]
- Casey, J.A.; Savitz, D.A.; Rasmussen, S.G.; Ogburn, E.L.; Pollak, J.; Mercer, D.G.; Schwartz, B.S. Unconventional natural gas development and birth outcomes in Pennsylvania, USA. Epidemiology 2016, 27, 163–172. [Google Scholar] [CrossRef] [PubMed]
- Stacy, S.L.; Brink, L.L.; Larkin, J.C.; Sadovsky, Y.; Goldstein, B.D.; Pitt, B.R.; Talbott, E.O. Perinatal outcomes and unconventional natural gas operations in Southwest Pennsylvania. PLoS ONE 2015, 10, e0126425. [Google Scholar]
- Manassaram, D.M.; Backer, L.C.; Moll, D.M. A review of nitrates in drinking water: Maternal exposure and adverse reproductive and developmental outcomes. Environ. Health Perspect. 2006, 114, 320–327. [Google Scholar] [CrossRef] [PubMed]
- Casey, J.A.; Curriero, F.C.; Cosgrove, S.E.; Nachman, K.E.; Schwartz, B.S. High-density livestock operations, crop field application of manure, and risk of community-associated methicillin-resistant Staphylococcus aureus infection in Pennsylvania. JAMA Intern. Med. 2013, 173, 1980–1990. [Google Scholar] [CrossRef] [PubMed]
- Liu, A.Y.; Curriero, F.C.; Glass, T.A.; Stewart, W.F.; Schwartz, B.S. The contextual influence of coal abandoned mine lands in communities and type 2 diabetes in Pennsylvania. Health Place 2013, 22, 115–122. [Google Scholar] [CrossRef] [PubMed]
- Ahrens, W.; Pigeot, I. Handbook of Epidemiology; Springer-Verlag Berlin Heidelberg: Berlin, Germany, 2005. [Google Scholar]
- Iliodromiti, S.; Mackay, D.F.; Smith, G.C.; Pell, J.P.; Nelson, S.M. Apgar score and the risk of cause-specific infant mortality: A population-based cohort study. Lancet 2014, 384, 1749–1755. [Google Scholar] [CrossRef]
- Ayanian, J.Z.; Kohler, B.A.; Abe, T.; Epstein, A.M. The relation between health insurance coverage and clinical outcomes among women with breast cancer. N. Engl. J. Med. 1993, 329, 326–331. [Google Scholar] [CrossRef] [PubMed]
- Schwartz, B.S.; Bailey-Davis, L.; Bandeen-Roche, K.; Pollak, J.; Hirsch, A.G.; Nau, C.; Liu, A.Y.; Glass, T.A. Attention deficit disorder, stimulant use, and childhood body mass index trajectory. Pediatrics 2014, 133, 668–676. [Google Scholar] [CrossRef] [PubMed]
- Darrow, L.A.; Strickland, M.J.; Klein, M.; Waller, L.A.; Flanders, W.D.; Correa, A.; Marcus, M.; Tolbert, P.E. Seasonality of birth and implications for temporal studies of preterm birth. Epidemiology 2009, 20, 699–706. [Google Scholar] [CrossRef] [PubMed]
- Vinikoor-Imler, L.C.; Messer, L.C.; Evenson, K.R.; Laraia, B.A. Neighborhood conditions are associated with maternal health behaviors and pregnancy outcomes. Soc. Sci. Med. 2011, 73, 1302–1311. [Google Scholar] [CrossRef] [PubMed]
- Metcalfe, A.; Lail, P.; Ghali, W.A.; Sauve, R.S. The association between neighbourhoods and adverse birth outcomes: A systematic review and meta-analysis of multi-level studies. Paediatr. Perinat. Epidemiol. 2011, 25, 236–245. [Google Scholar] [CrossRef] [PubMed]
- Nau, C.; Schwartz, B.S.; Bandeen-Roche, K.; Liu, A.; Pollak, J.; Hirsch, A.; Bailey-Davis, L.; Glass, T.A. Community socioeconomic deprivation and obesity trajectories in children using electronic health records. Obesity 2015, 23, 207–212. [Google Scholar] [CrossRef] [PubMed]
- Dadvand, P.; Ostro, B.; Figueras, F.; Foraster, M.; Basagana, X.; Valentin, A.; Martinez, D.; Beelen, R.; Cirach, M.; Hoek, G.; et al. Residential proximity to major roads and term low birth weight: The roles of air pollution, heat, noise, and road-adjacent trees. Epidemiology 2014, 25, 518–525. [Google Scholar] [CrossRef] [PubMed]
- U.S. Environmental Protection Agency. Smart Location Database. Available online: http://www2.epa.gov/smart-growth/smart-location-mapping#SLD (accessed on 15 January 2015).
- Liu, A.Y.; Curriero, F.C.; Glass, T.A.; Stewart, W.F.; Schwartz, B.S. Associations of the burden of coal abandoned mine lands with three dimensions of community context in Pennsylvania. ISRN Public Health 2012, 2012, 1–11. [Google Scholar] [CrossRef]
- Kriegler, F.; Malila, W.; Nalepka, R.; Richardson, W. Preprocessing transformations and their effects on multispectral recognition. Remote Sens. Environ. 1969, 6, 97. [Google Scholar]
- Solano, R.; Didan, K.; Jacobson, A.; Huete, A. MODIS Vegetation Index User’s Guide (MOD13 Series) Version 2.00; The University of Arizona: Tucson, AZ, USA, 2010. [Google Scholar]
- USGS (U.S. Geological Survey). Land Processes Distributed Active Archive Center (LP DAAS), Vegetation Indices. Available online: https://lpdaac.usgs.gov/products/modis_products_table/mod13q1 (accessed on 14 September 2015).
- James, P.; Berrigan, D.; Hart, J.E.; Hipp, J.A.; Hoehner, C.M.; Kerr, J.; Major, J.M.; Oka, M.; Laden, F. Effects of buffer size and shape on associations between the built environment and energy balance. Health Place 2014, 27, 162–170. [Google Scholar] [CrossRef] [PubMed]
- Van der Laan, M.J.; Polley, E.C.; Hubbard, A.E. Super learner. Stat. Appl. Genet. Mol. Biol. 2007, 6, 25. [Google Scholar] [CrossRef] [PubMed]
- Ehrlich, S.F.; Rosas, L.G.; Ferrara, A.; King, J.C.; Abrams, B.; Harley, K.G.; Hedderson, M.M.; Eskenazi, B. Pregnancy glycemia in Mexican-American women without diabetes or gestational diabetes and programming for childhood obesity. Am. J. Epidemiol. 2013, 177, 768–775. [Google Scholar] [CrossRef] [PubMed]
- Gruber, S.; Logan, R.W.; Jarrín, I.; Monge, S.; Hernán, M.A. Ensemble learning of inverse probability weights for marginal structural modeling in large observational datasets. Stat. Med. 2015, 34, 106–117. [Google Scholar] [CrossRef] [PubMed]
- Sturmer, T.; Rothman, K.J.; Avorn, J.; Glynn, R.J. Treatment effects in the presence of unmeasured confounding: Dealing with observations in the tails of the propensity score distribution—A simulation study. Am. J. Epidemiol. 2010, 172, 843–854. [Google Scholar] [CrossRef] [PubMed]
- Cameron, A.C.; Gelbach, J.B.; Miller, D.L. Robust inference with multiway clustering. J. Bus. Econ. Stat. 2011, 29. [Google Scholar] [CrossRef]
- Sram, R.J.; Binkova, B.; Dejmek, J.; Bobak, M. Ambient air pollution and pregnancy outcomes: A review of the literature. Environ. Health Perspect. 2005, 113, 375–382. [Google Scholar] [CrossRef] [PubMed]
- Both, M.I.; Overvest, M.A.; Wildhagen, M.F.; Golding, J.; Wildschut, H.I. The association of daily physical activity and birth outcome: A population-based cohort study. Eur. J. Epidemiol. 2010, 25, 421–429. [Google Scholar] [CrossRef] [PubMed]
- Dadvand, P.; de Nazelle, A.; Triguero-Mas, M.; Schembari, A.; Cirach, M.; Amoly, E.; Figueras, F.; Basagana, X.; Ostro, B.; Nieuwenhuijsen, M. Surrounding greenness and exposure to air pollution during pregnancy: An analysis of personal monitoring data. Environ. Health Perspect. 2012, 120, 1286–1290. [Google Scholar] [CrossRef] [PubMed]
- Hegaard, H.K.; Pedersen, B.K.; Nielsen, B.B.; Damm, P. Leisure time physical activity during pregnancy and impact on gestational diabetes mellitus, pre-eclampsia, preterm delivery and birth weight: A review. Acta Obstet. Gynecol. Scand. 2007, 86, 1290–1296. [Google Scholar] [CrossRef] [PubMed]
- Grote, N.K.; Bridge, J.A.; Gavin, A.R.; Melville, J.L.; Iyengar, S.; Katon, W.J. A meta-analysis of depression during pregnancy and the risk of preterm birth, low birth weight, and intrauterine growth restriction. Arch. Gen. Psychiatry 2010, 67, 1012–1024. [Google Scholar] [CrossRef] [PubMed]
- Rondo, P.H.; Ferreira, R.F.; Nogueira, F.; Ribeiro, M.C.; Lobert, H.; Artes, R. Maternal psychological stress and distress as predictors of low birth weight, prematurity and intrauterine growth retardation. Eur. J. Clin. Nutr. 2003, 57, 266–272. [Google Scholar] [CrossRef] [PubMed]
- Dadvand, P.; Basagana, X.; Sartini, C.; Figueras, F.; Vrijheid, M.; de Nazelle, A.; Sunyer, J.; Nieuwenhuijsen, M.J. Climate extremes and the length of gestation. Environ. Health Perspect. 2011, 119, 1449–1453. [Google Scholar] [CrossRef] [PubMed]
- Gill, S.E.; Handley, J.F.; Ennos, A.R.; Pauleit, S. Adapting cities for climate change: The role of the green infrastructure. Built Environ. 2007, 33, 115–133. [Google Scholar] [CrossRef]
- Kramer, M.S.; Seguin, L.; Lydon, J.; Goulet, L. Socio-economic disparities in pregnancy outcome: Why do the poor fare so poorly? Paediatr. Perinat. Epidemiol. 2000, 14, 194–210. [Google Scholar] [CrossRef] [PubMed]
- Parker, J.D.; Schoendorf, K.C.; Kiely, J.L. Associations between measures of socioeconomic status and low birth weight, small for gestational age, and premature delivery in the United States. Ann. Epidemiol. 1994, 4, 271–278. [Google Scholar] [CrossRef]


| Variable, n (%) unless Specified | City n = 2563 | Borough n = 3797 | Township n = 6461 | ||||
|---|---|---|---|---|---|---|---|
| Community-Specific NDVI Tertile | Community-Specific NDVI Tertile | Community-Specific NDVI Tertile | |||||
| 1, n = 927 | 2–3, n = 1636 | 1, n = 1253 | 2–3, n = 2544 | 1, n = 2249 | 2–3, n = 4212 | ||
| NDVI, mean (SD) | 0.39 (0.04) | 0.50 (0.05) | 0.44 (0.04) | 0.57 (0.05) | 0.48 (0.05) | 0.62 (0.05) | |
| NDVI, tertile 1 for all community types | 927 (100) | 889 (54.3) | 1253 (100) | 10 (< 1) | 1195 (53.1) | 0 | |
| NDVI, tertiles 2–3 for all community types | 0 | 747 (45.7) | 0 | 2534 (100) | 1054 (46.9) | 4212 (100) | |
| Maternal characteristics | |||||||
| Age, median (IQR) | 28.3 (24.0–32.3) | 28.6 (24.4–32.8) | 26.9 (23.2–30.8) | 26.8 (22.8–31.0) | 25.1 (21.7–30.0) | 25.6 (21.8–30.1) | |
| Nulliparous | 438 (47.2) | 752 (46) | 587 (46.8) | 1141 (44.9) | 1148 (51.0) | 2024 (48.1) | |
| Multiparous | 489 (52.8) | 884 (54) | 666 (53.2) | 1403 (55.1) | 1101 (49.0) | 2188 (51.9) | |
| Race/ethnicity | |||||||
| White | 640 (69.0) | 1231 (75.2) | 1149 (91.7) | 2359 (92.7) | 2126 (94.5) | 4037 (95.8) | |
| Black | 160 (17.3) | 215 (13.1) | 54 (4.3) | 98 (3.9) | 49 (2.2) | 72 (1.7) | |
| Hispanic | 106 (11.4) | 171 (10.5) | 41 (3.3) | 65 (2.6) | 42 (1.9) | 53 (1.3) | |
| Other | 21 (2.3) | 19 (1.2) | 9 (0.7) | 22 (0.9) | 32 (1.4) | 50 (1.2) | |
| Ever smoker | 148 (16.0) | 333 (20.4) | 280 (22.4) | 587 (23.1) | 501 (22.3) | 901 (21.4) | |
| No receipt of medical assistance | 356 (38.4) | 690 (42.2) | 645 (51.5) | 1338 (52.6) | 1435 (63.8) | 2815 (66.8) | |
| Receipt of medical assistance | 571 (61.6) | 946 (57.8) | 608 (48.5) | 1206 (47.4) | 814 (36.2) | 1397 (33.2) | |
| Pre-pregnancy body mass index, kg/m2 | |||||||
| Normal (18.5–24.9) | 386 (41.6) | 740 (45.2) | 523 (41.7) | 1127 (44.3) | 897 (39.9) | 1715 (40.7) | |
| Overweight (25.0–29.9) | 247 (26.6) | 360 (22.0) | 328 (26.2) | 634 (24.9) | 616 (27.4) | 1185 (28.1) | |
| Obese (≥30.0) | 275 (29.7) | 495 (30.3) | 375 (30.0) | 728 (28.6) | 694 (30.9) | 1225 (29.1) | |
| Underweight (<18.5) | 19 (2.0) | 41 (2.5) | 27 (2.2) | 55 (2.2) | 42 (1.9) | 87 (2.7) | |
| No antibiotic orders during pregnancy | 644 (69.5) | 1195 (73.0) | 925 (73.8) | 1945 (76.5) | 1700 (75.6) | 3299 (78.3) | |
| ≥1 antibiotic orders during pregnancy | 283 (30.5) | 441 (27.0) | 328 (26.2) | 599 (23.5) | 549 (24.4) | 913 (21.7) | |
| Non-primary care patient | 593 (64.0) | 1012 (61.9) | 652 (52.0) | 1289 (50.7) | 1057 (47.0) | 1973 (46.8) | |
| Primary care patient | 334 (36.0) | 624 (38.1) | 601 (48.0) | 1255 (49.3) | 1192 (53.0) | 2239 (53.2) | |
| Community socioeconomic deprivation, median (IQR) | 4.4 (2.5–6.6) | 4.1 (2.2–6.5) | 0.6 (−1.0–2.5) | 0.6 (−1.1–2.6) | −1.4 (−2.5–0) | −1.6 (−2.8–0) | |
| Walkability z-score, median (IQR) | 2.0 (1.1–3.3) | 1.8 (0.5–3.1) | 0.8 (−0.1–1.9) | 0.7 (−0.2–1.8) | −1.2 (−1.9–−0.5) | −1.2 (−2.4–−0.9) | |
| Distance to nearest major road (m), median (IQR) | 278 (137–535) | 309 (141–610) | 411 (167–1034) | 498 (175–1173) | 1784 (611–5017) | 2444 (735–6121) | |
| Drilled unconventional natural gas wells within 20 km of home, mean (SD) | 5 (21) | 8 (26) | 21 (89) | 22 (86) | 43 (131) | 38 (118) | |
| Swine operation exposure (animal units per km2 surrounding home), median (IQR) | 5.9 (5.6–21.3) | 6.3 (5.6–21) | 10.8 (5.6–34.1) | 11.2 (5.7–35.0) | 16.6 (6.6–32.8) | 16.3 (6.3–31.9) | |
| Infant characteristics | |||||||
| Female | 450 (48.5) | 817 (49.9) | 617 (49.2) | 1236 (48.6) | 1099 (48.9) | 2036 (48.3) | |
| Male | 477 (51.5) | 819 (50.1) | 636 (50.8) | 1308 (51.4) | 1150 (51.1) | 2176 (51.7) | |
| Year of birth | |||||||
| 2006–2007 | 209 (22.5) | 343 (21.0) | 262 (20.9) | 686 (27.0) | 410 (18.2) | 1349 (32.0) | |
| 2008–2010 | 403 (43.5) | 708 (43.3) | 601 (48.0) | 1092 (42.9) | 1215 (54.0) | 1867 (44.3) | |
| 2011–2013 | 315 (34.0) | 585 (35.8) | 390 (31.1) | 766 (30.1) | 624 (27.7) | 996 (23.6) | |
| Season of birth | |||||||
| Winter (December–February) | 277 (29.9) | 366 (22.4) | 341 (27.2) | 683 (26.8) | 520 (23.1) | 1040 (24.7) | |
| Spring (March–May) | 49 (5.3) | 589 (36.0) | 78 (6.2) | 851 (33.5) | 124 (5.5) | 1509 (35.8) | |
| Summer (June–August) | 237 (25.6) | 420 (25.7) | 318 (25.4) | 654 (25.7) | 555 (24.7) | 1120 (26.7) | |
| Fall (September–November) | 364 (39.3) | 261 (16.0) | 516 (41.1) | 356 (14.0) | 1050 (46.7) | 543 (12.9) | |
| Term birth weight, median (IQR) | 3293 (2993–3606) | 3312 (3028–3637) | 3345 (3060–3666) | 3370 (3072–3668) | 3390 (3090–3697) | 3391 (3090–3698) | |
| Small for gestational age birth | 126 (13.6) | 180 (11.0) | 109 (8.7) | 237 (9.3) | 210 (9.3) | 352 (8.4) | |
| Preterm birth (<37 weeks gestational age) | 127 (13.7) | 195 (11.9) | 117 (9.3) | 297 (11.7) | 248 (11.1) | 465 (11.0) | |
| 5 min Apgar score <7 | 17 1.8) | 41 (2.5) | 26 (2.1) | 39 (1.5) | 42 (1.9) | 88 (2.1) | |
| Variable b | Unadjusted | Adjusted a | ||||||
|---|---|---|---|---|---|---|---|---|
| Term Birth Weight (g) | Small for Gestational Age | Preterm Birth | 5 min Apgar Score <7 | Term Birth Weight (g) | Small for Gestational Age | Preterm Birth | 5 min Apgar Score <7 | |
| β (95% CI) | OR (95% CI) | OR (95% CI) | OR (95% CI) | β (95% CI) | OR (95% CI) | OR (95% CI) | OR (95% CI) | |
| City, N births | 2125 | 2420 | 2460 | 2497 | 2125 | 2420 | 2460 | 2497 |
| Greenness T1 | 0 | 1 | 1 | 1 | 0 | 1 | 1 | 1 |
| Greenness T2–3 | 36 (−5–78) | 0.77 (0.60–1.00) | 0.85 (0.67–1.07) | 1.24 (0.82–1.87) | 42 (−1–85) | 0.73 (0.58–0.97) | 0.78 (0.61–0.99) | 1.42 (0.69–2.92) |
| Borough, N births | 3184 | 3565 | 3609 | 3658 | 3184 | 3565 | 3609 | 3658 |
| Greenness T1 | 0 | 1 | 1 | 1 | 0 | 1 | 1 | 1 |
| Greenness T2-3 | −3 (−28–21) | 1.09 (0.90–1.32) | 1.29 (1.02–1.62) | 1.08 (0.75–1.53) | 4 (−22–30) | 1.19 (0.88–1.59) | 1.25 (0.96–1.59) | 0.94 (0.57–1.55) |
| Township, N births | 5546 | 6205 | 6281 | 6209 | 5546 | 6205 | 6281 | 6209 |
| Greenness T1 | 0 | 1 | 1 | 1 | 0 | 1 | 1 | 1 |
| Greenness T2–3 | 5 (−18–29) | 0.89 (0.73–1.09) | 1.00 (0.85–1.18) | 1.15 (0.81–1.65) | 2 (−21–24) | 0.90 (0.71–1.15) | 0.95 (0.79–1.15) | 1.20 (0.79–1.82) |
© 2016 by the authors; licensee MDPI, Basel, Switzerland. This article is an open access article distributed under the terms and conditions of the Creative Commons by Attribution (CC-BY) license (http://creativecommons.org/licenses/by/4.0/).
Share and Cite
Casey, J.A.; James, P.; Rudolph, K.E.; Wu, C.-D.; Schwartz, B.S. Greenness and Birth Outcomes in a Range of Pennsylvania Communities. Int. J. Environ. Res. Public Health 2016, 13, 311. https://doi.org/10.3390/ijerph13030311
Casey JA, James P, Rudolph KE, Wu C-D, Schwartz BS. Greenness and Birth Outcomes in a Range of Pennsylvania Communities. International Journal of Environmental Research and Public Health. 2016; 13(3):311. https://doi.org/10.3390/ijerph13030311
Chicago/Turabian StyleCasey, Joan A., Peter James, Kara E. Rudolph, Chih-Da Wu, and Brian S. Schwartz. 2016. "Greenness and Birth Outcomes in a Range of Pennsylvania Communities" International Journal of Environmental Research and Public Health 13, no. 3: 311. https://doi.org/10.3390/ijerph13030311