
Bioremediation of Crude Oil Contaminated Desert Soil: Effect of Biostimulation, Bioaugmentation and Bioavailability in Biopile Treatment Systems

Abstract
:1. Introduction
2. Experimental Section
2.1. Soils and Biopile Formulations

| Biopile tag | Clean Soil (g) | Crude oil (g) | Urea-N (g) | K2HPO4-P (g) | K2HPO4-K (g) | Amnite P300 (g) | Tween 80 ** (g) |
|---|---|---|---|---|---|---|---|
| Bio_Cont | 1850 | 277.5 | -- | -- | -- | -- | -- |
| Bio_Stim | 1850 | 277.5 | 23.8–11.1 | 9.74–2.2 | 9.74–5.5 | -- | -- |
| Bio_Aug | 1850 | 277.5 | 23.8–11.1 | 9.74–2.2 | 9.74–5.5 | 3%–55.5 | -- |
| Bio_Avail | 1850 | 277.5 | 23.8–11.1 | 9.74–2.2 | 9.74–5.5 | 3%–55.5 | 157.25 * |
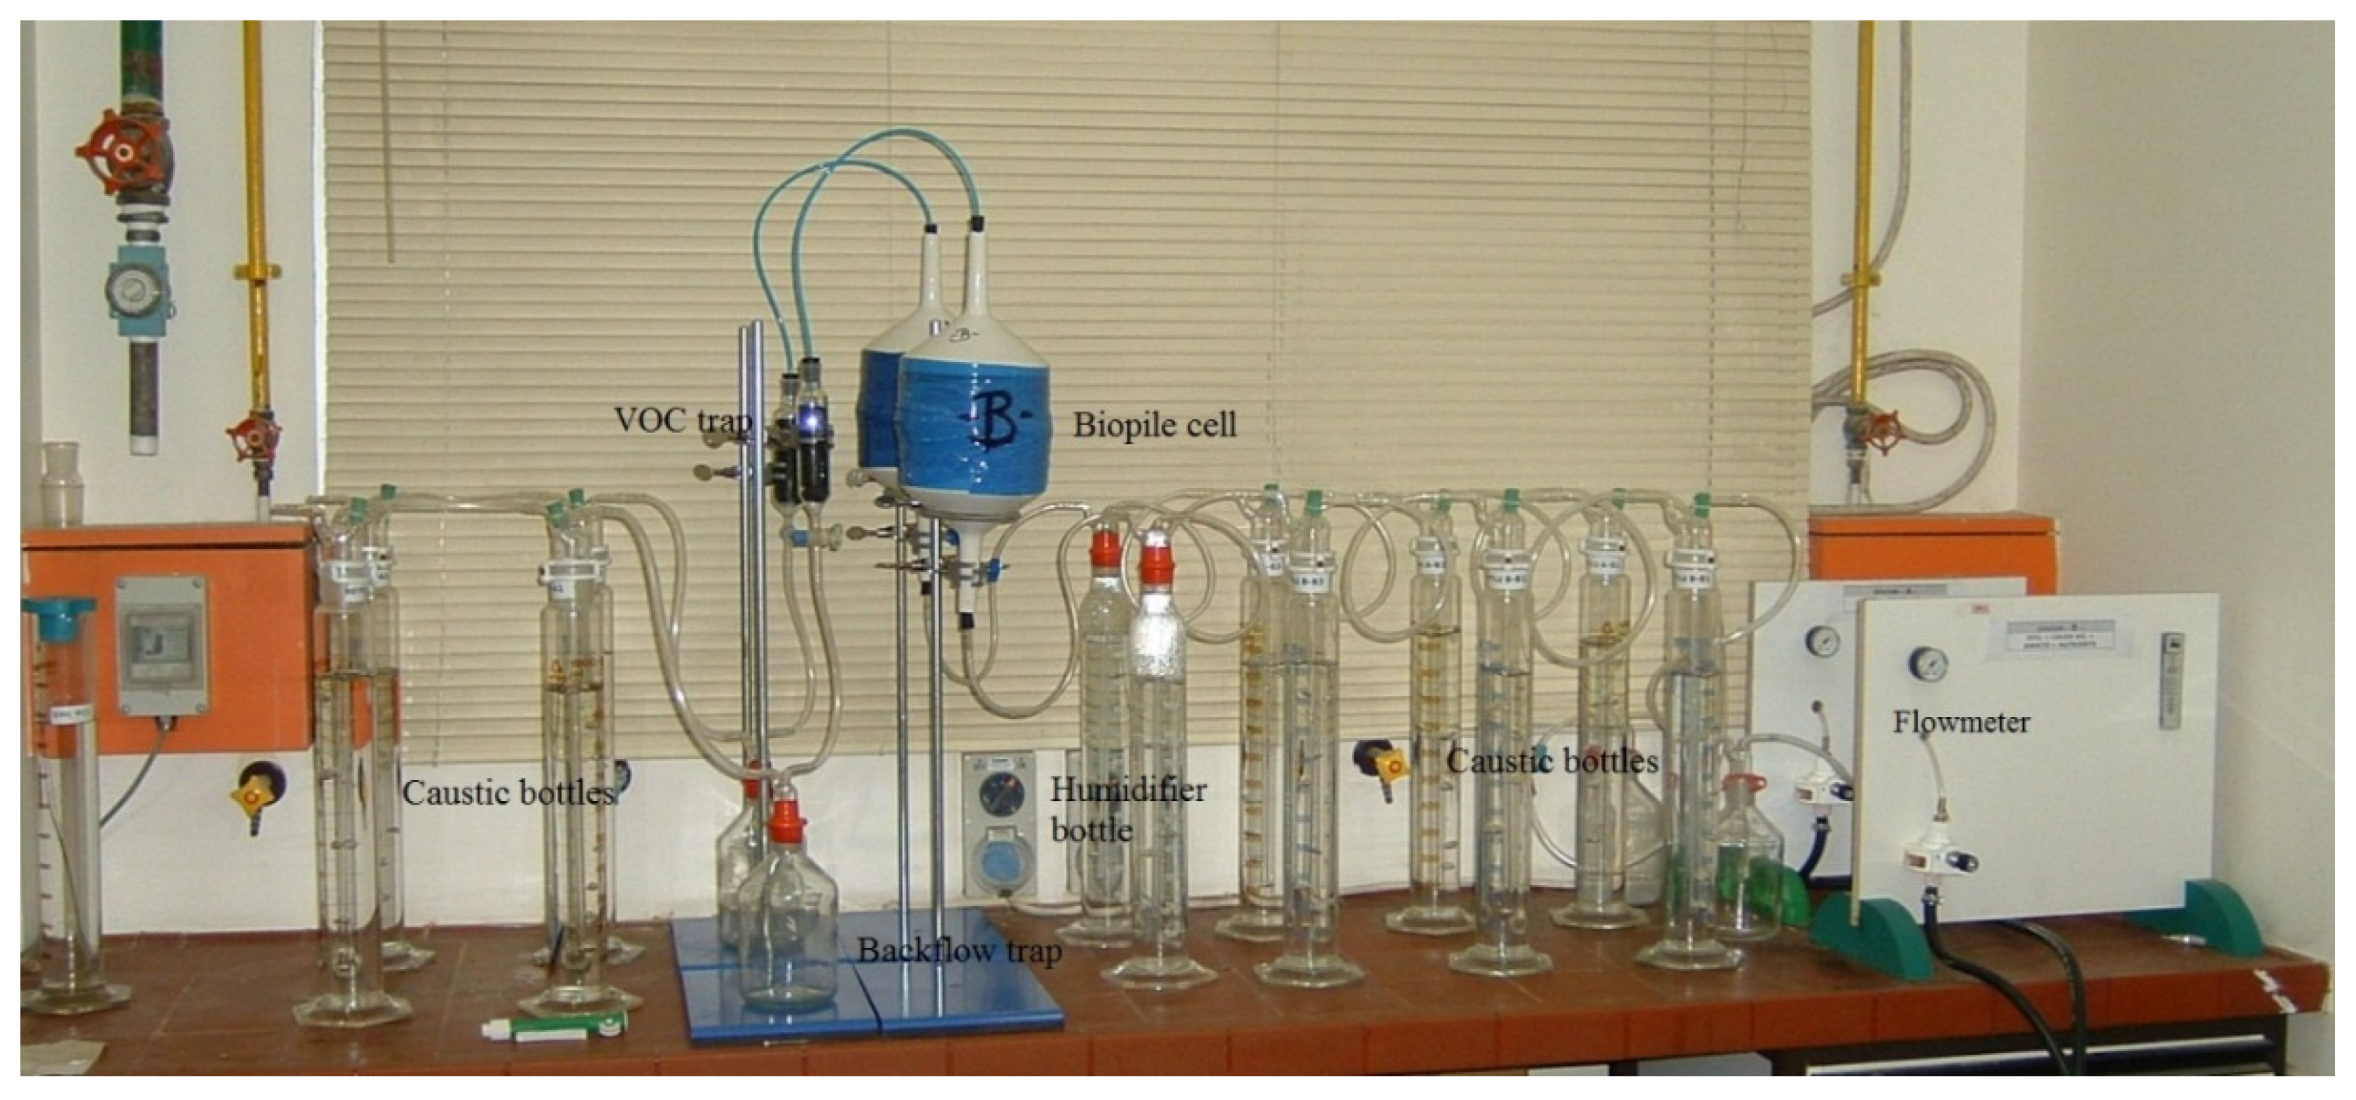
2.2. Biopile Set-Ups
2.3. Analytical Methods
2.3.1. TPH and TKN
2.3.2. Determination of Respiration CO2
2.4. Experimental Design
3. Results and Discussion
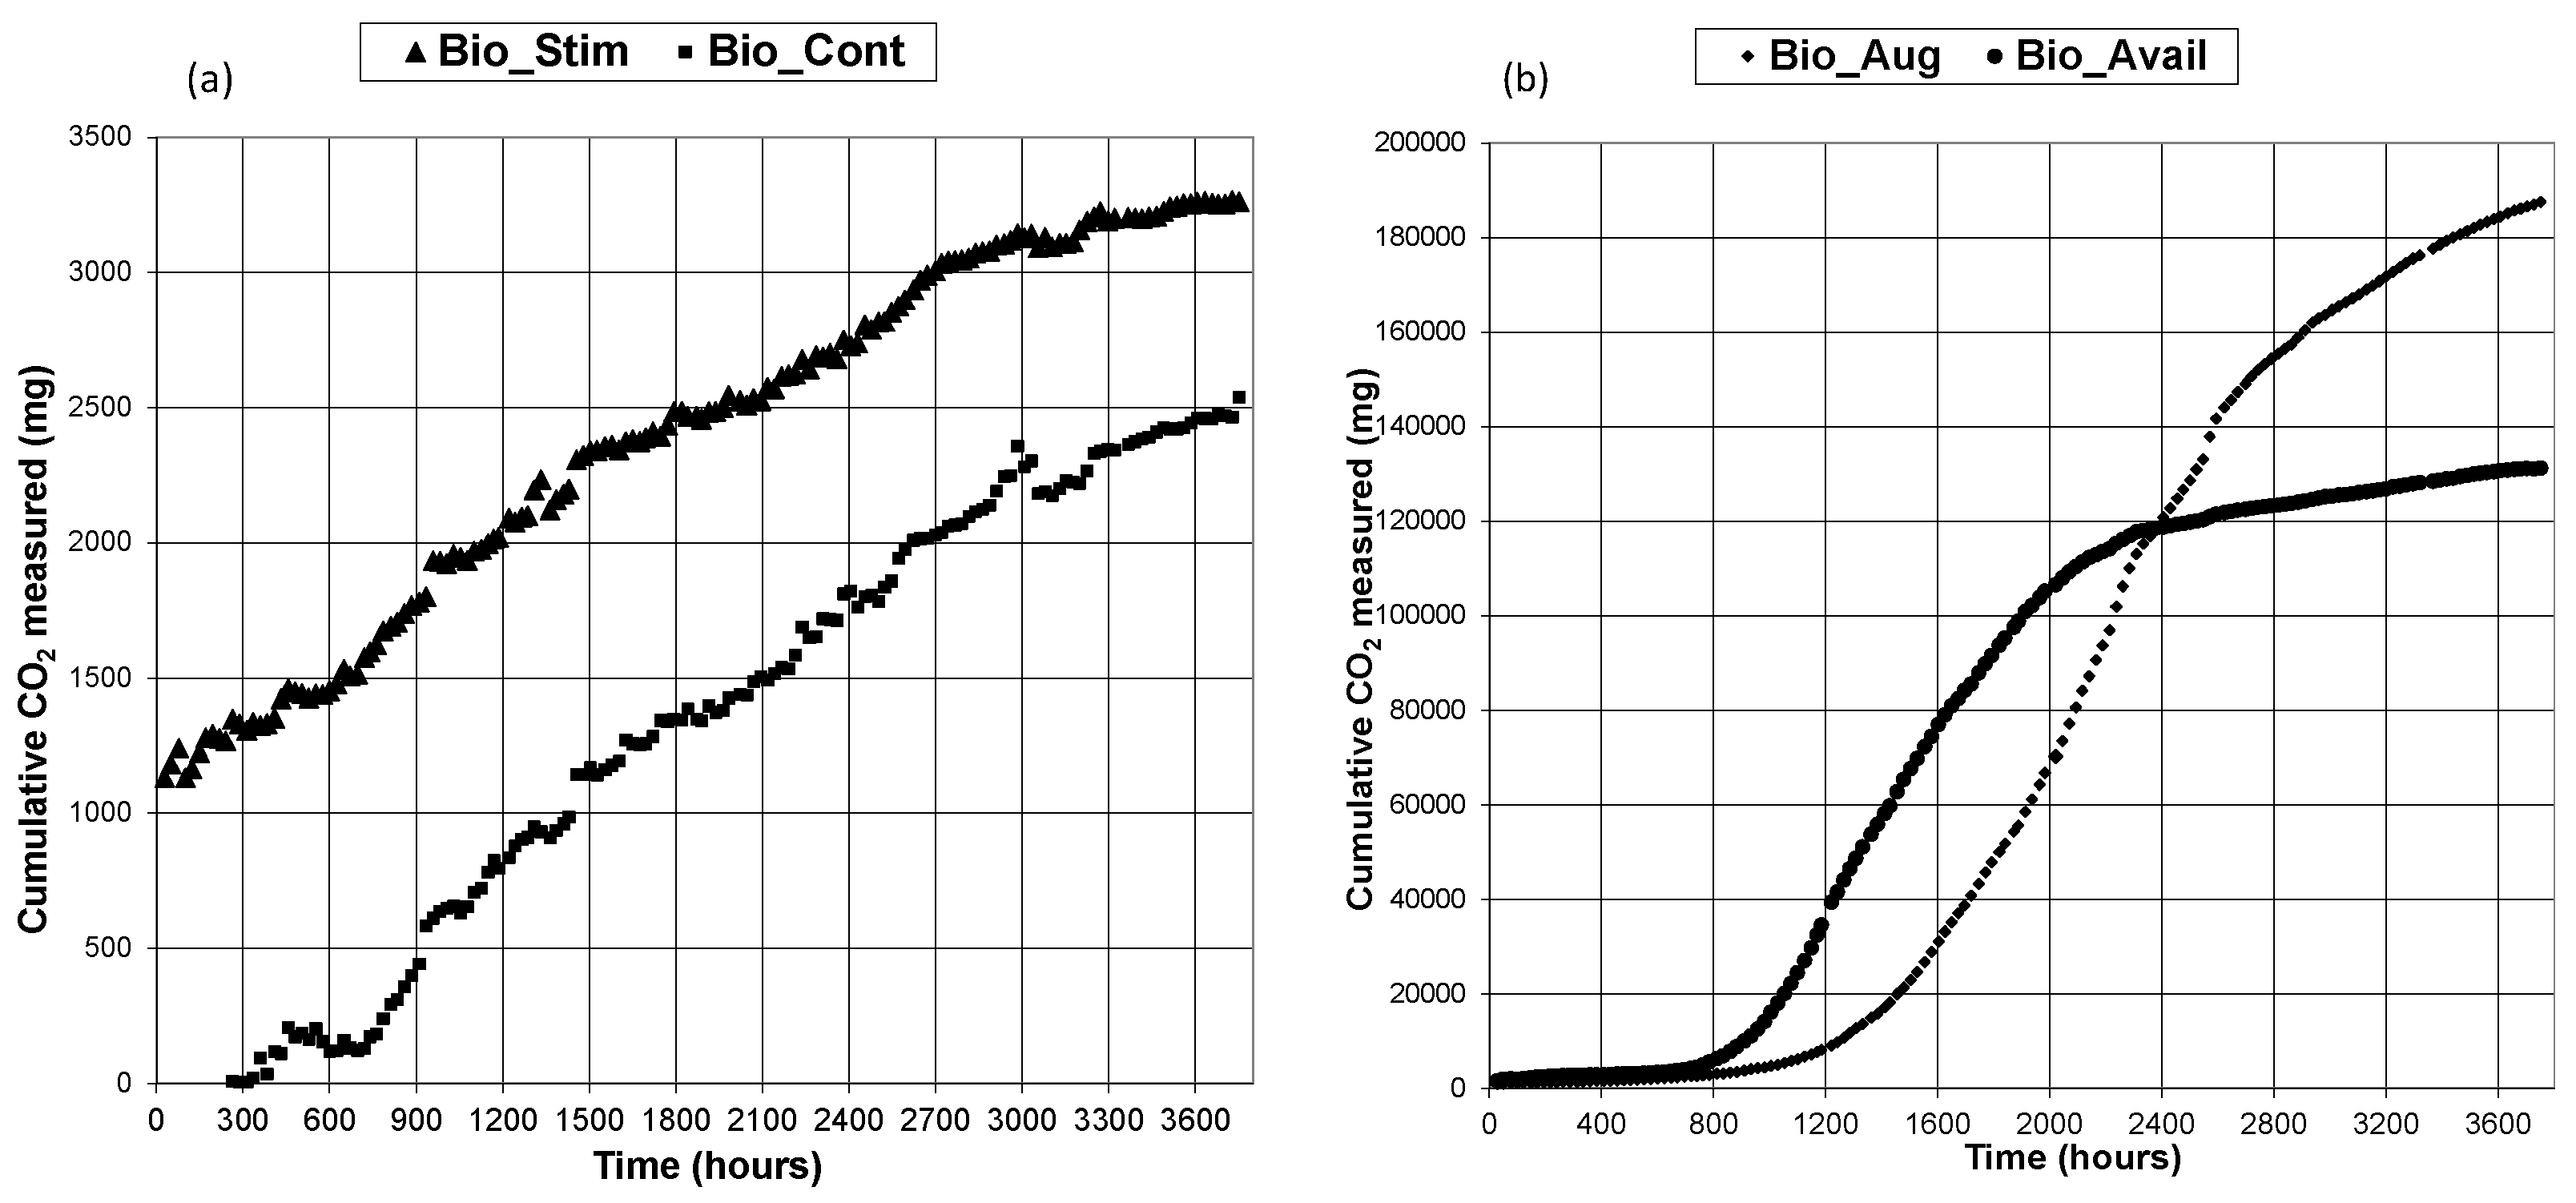
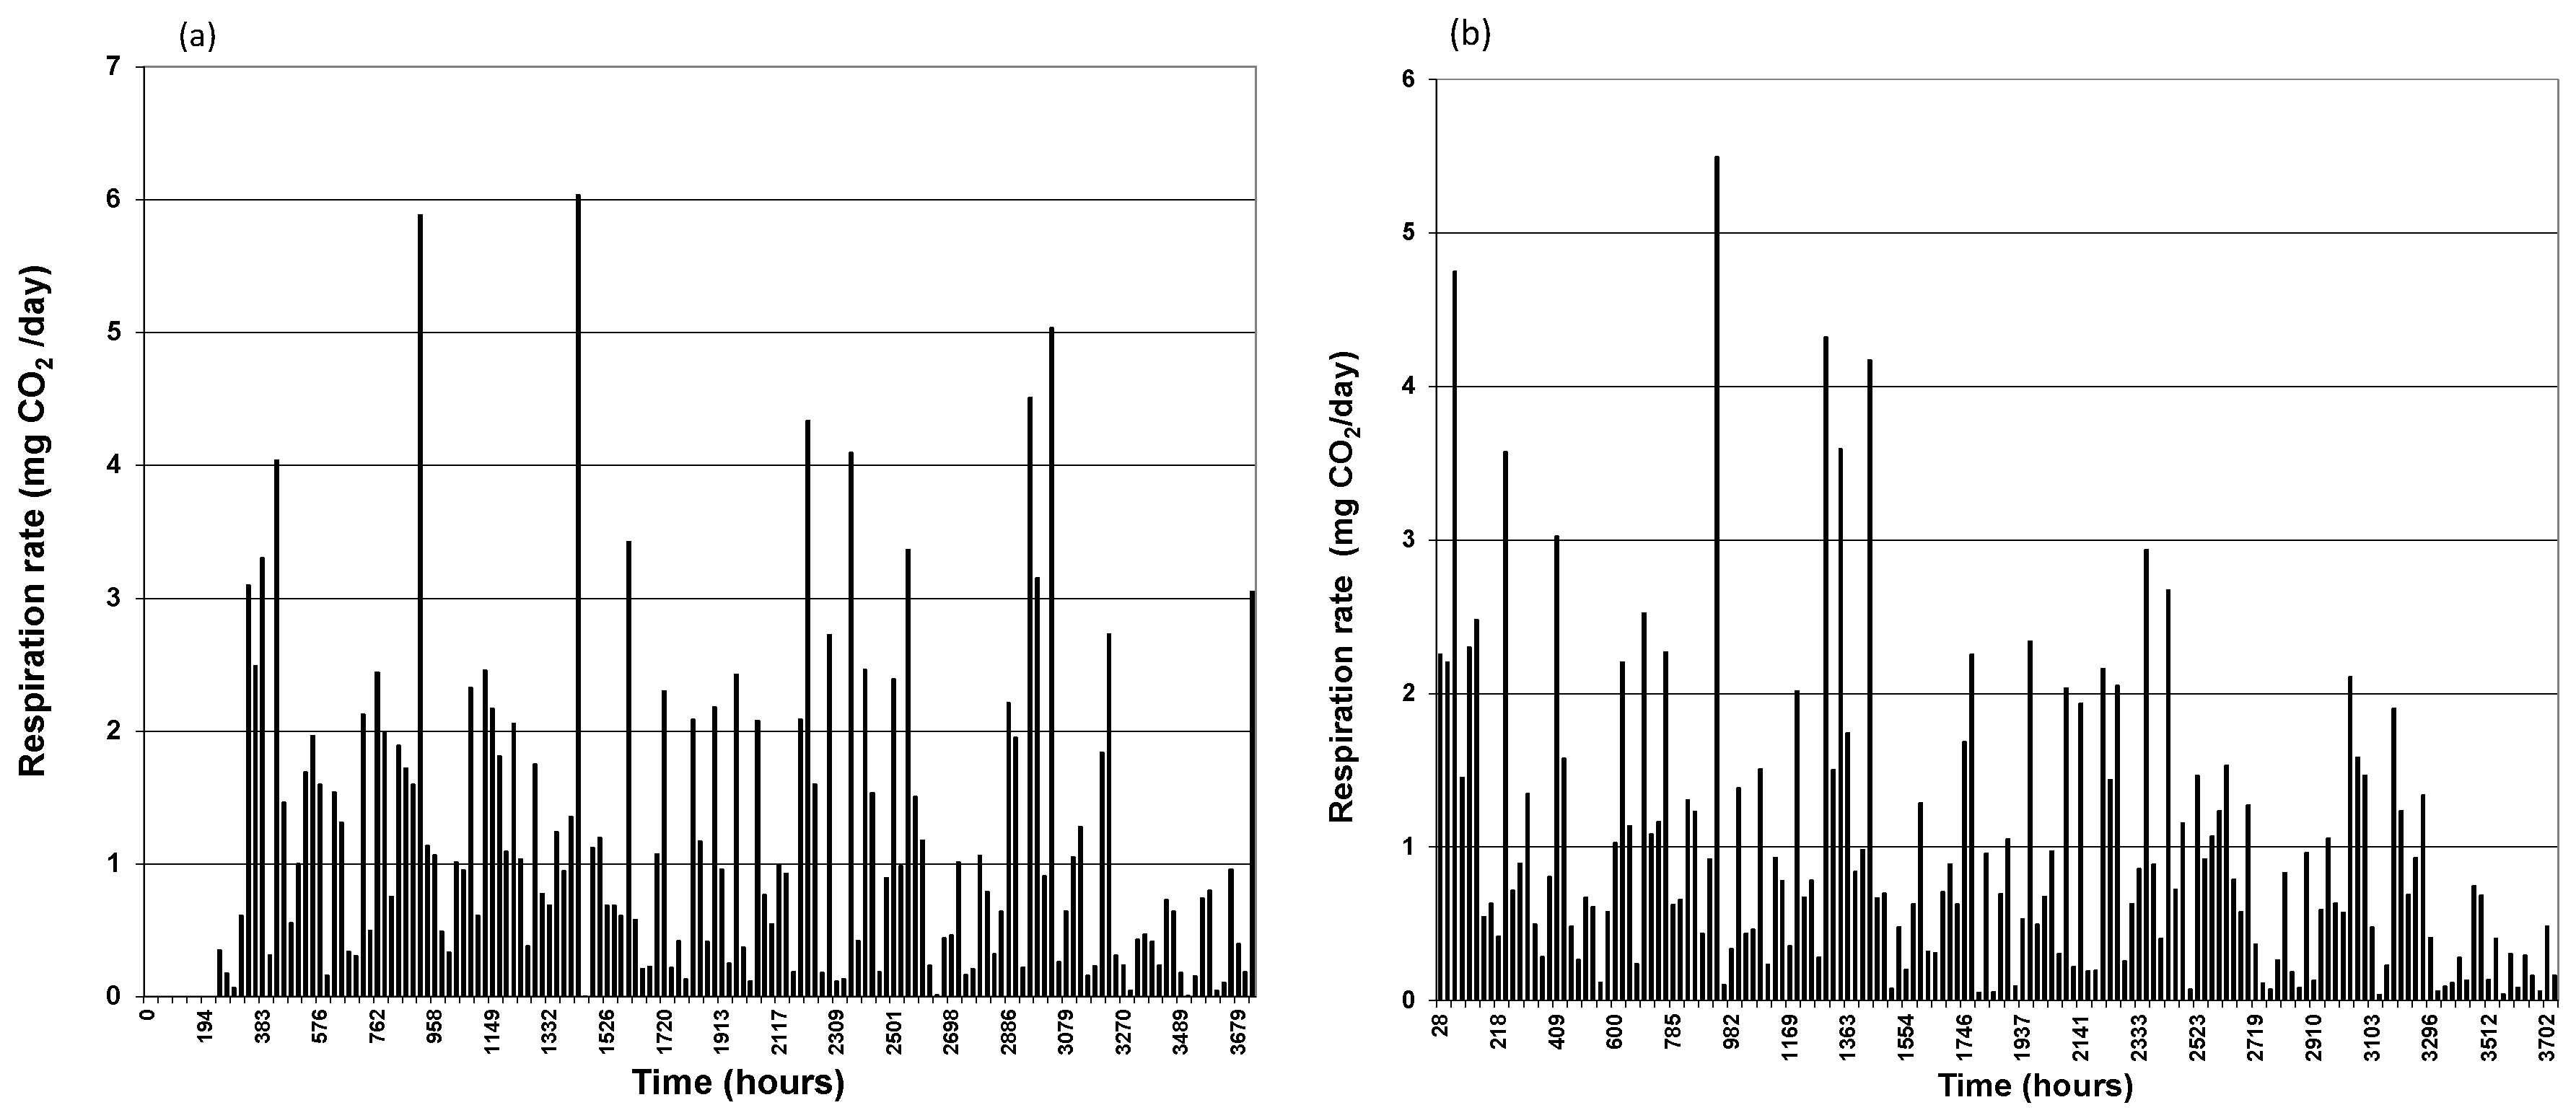
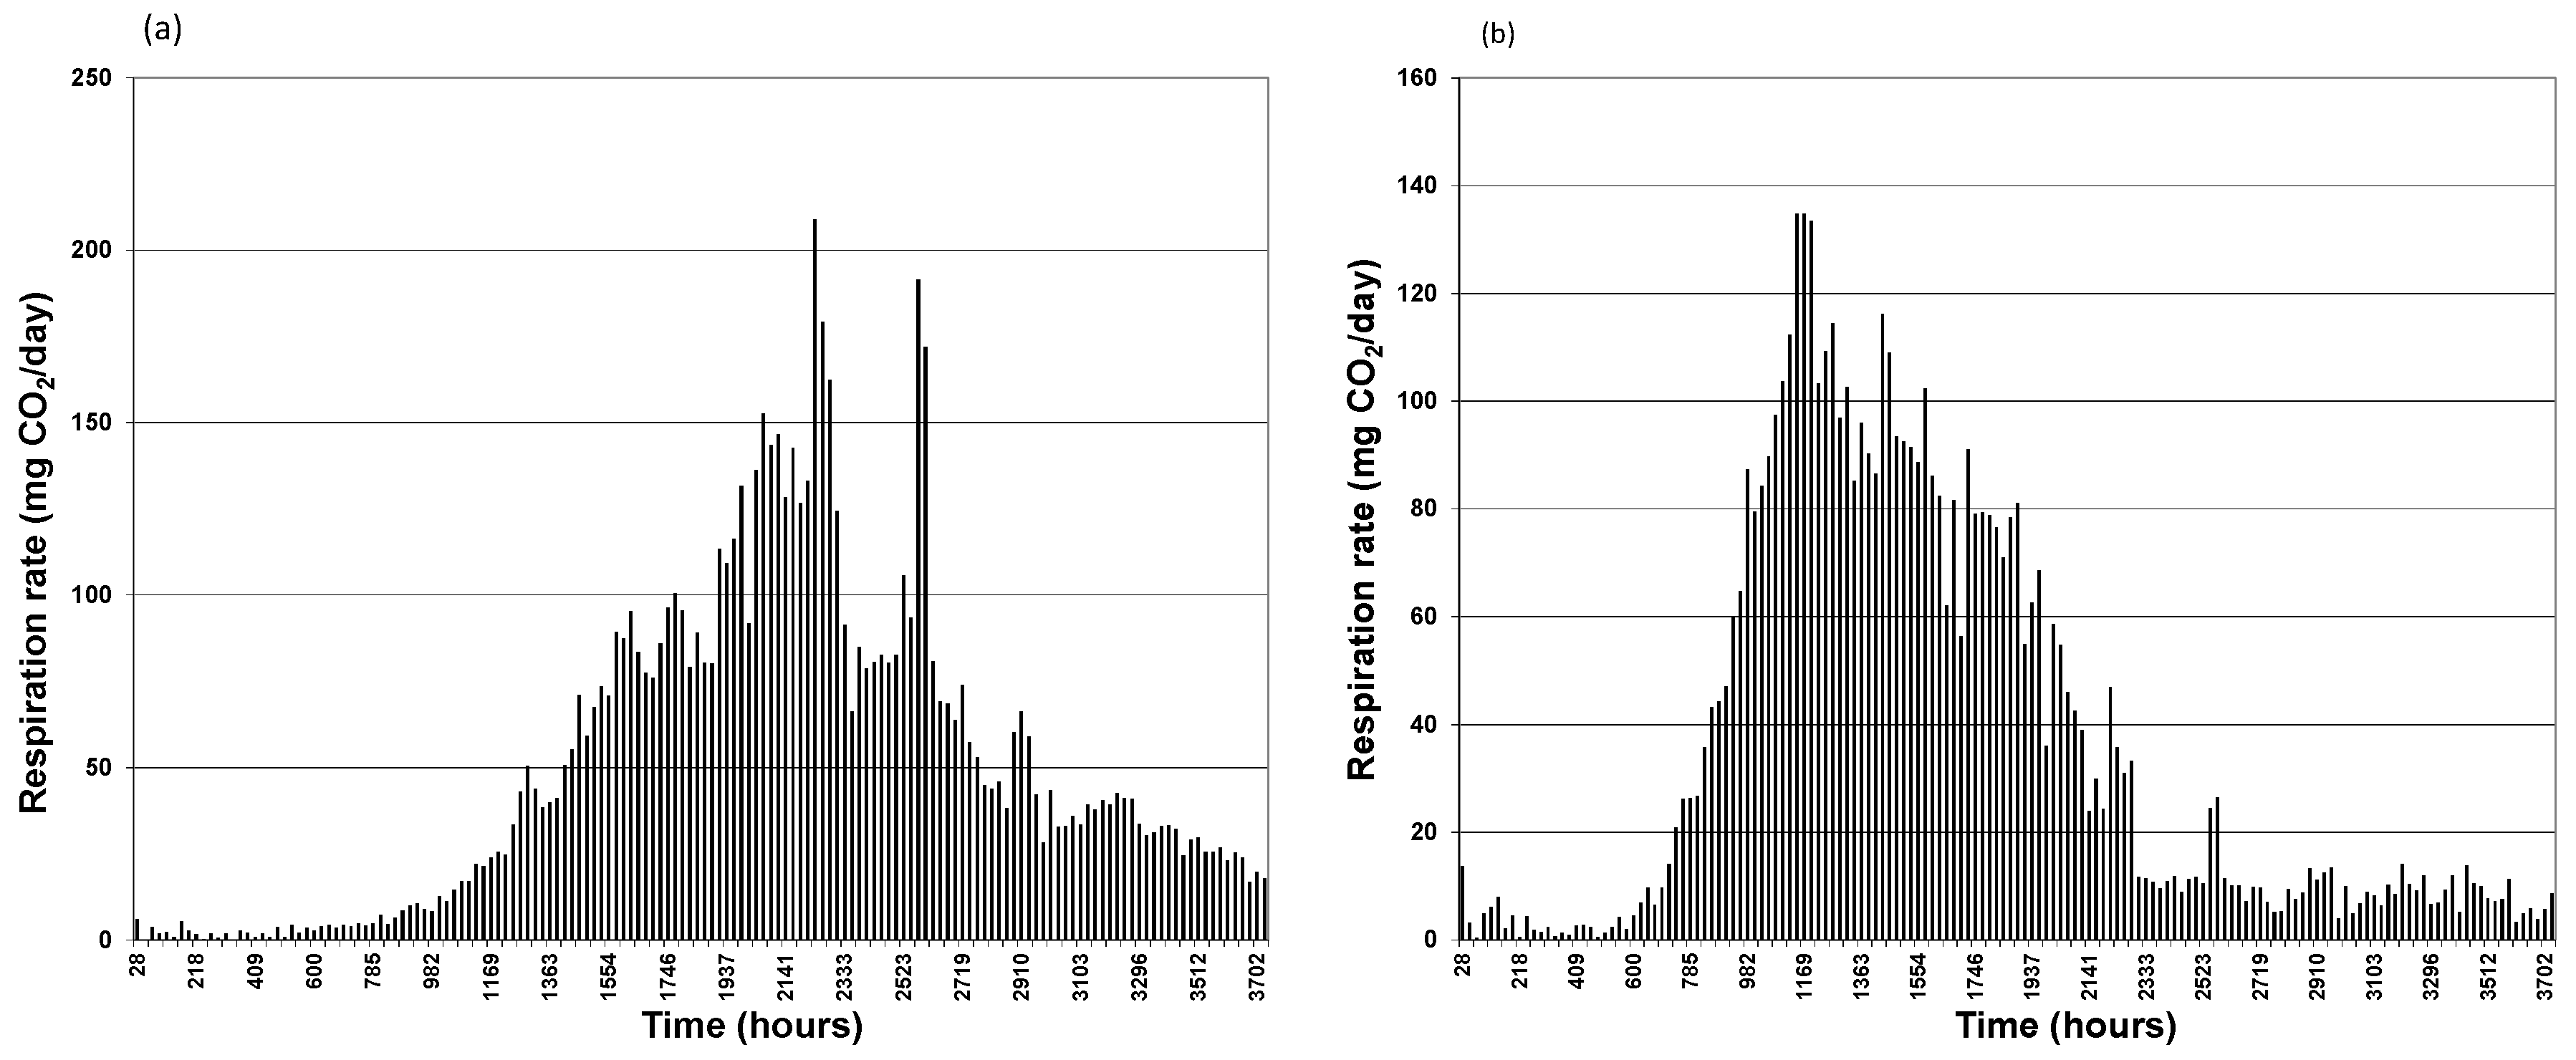
3.1. CO2 Generation

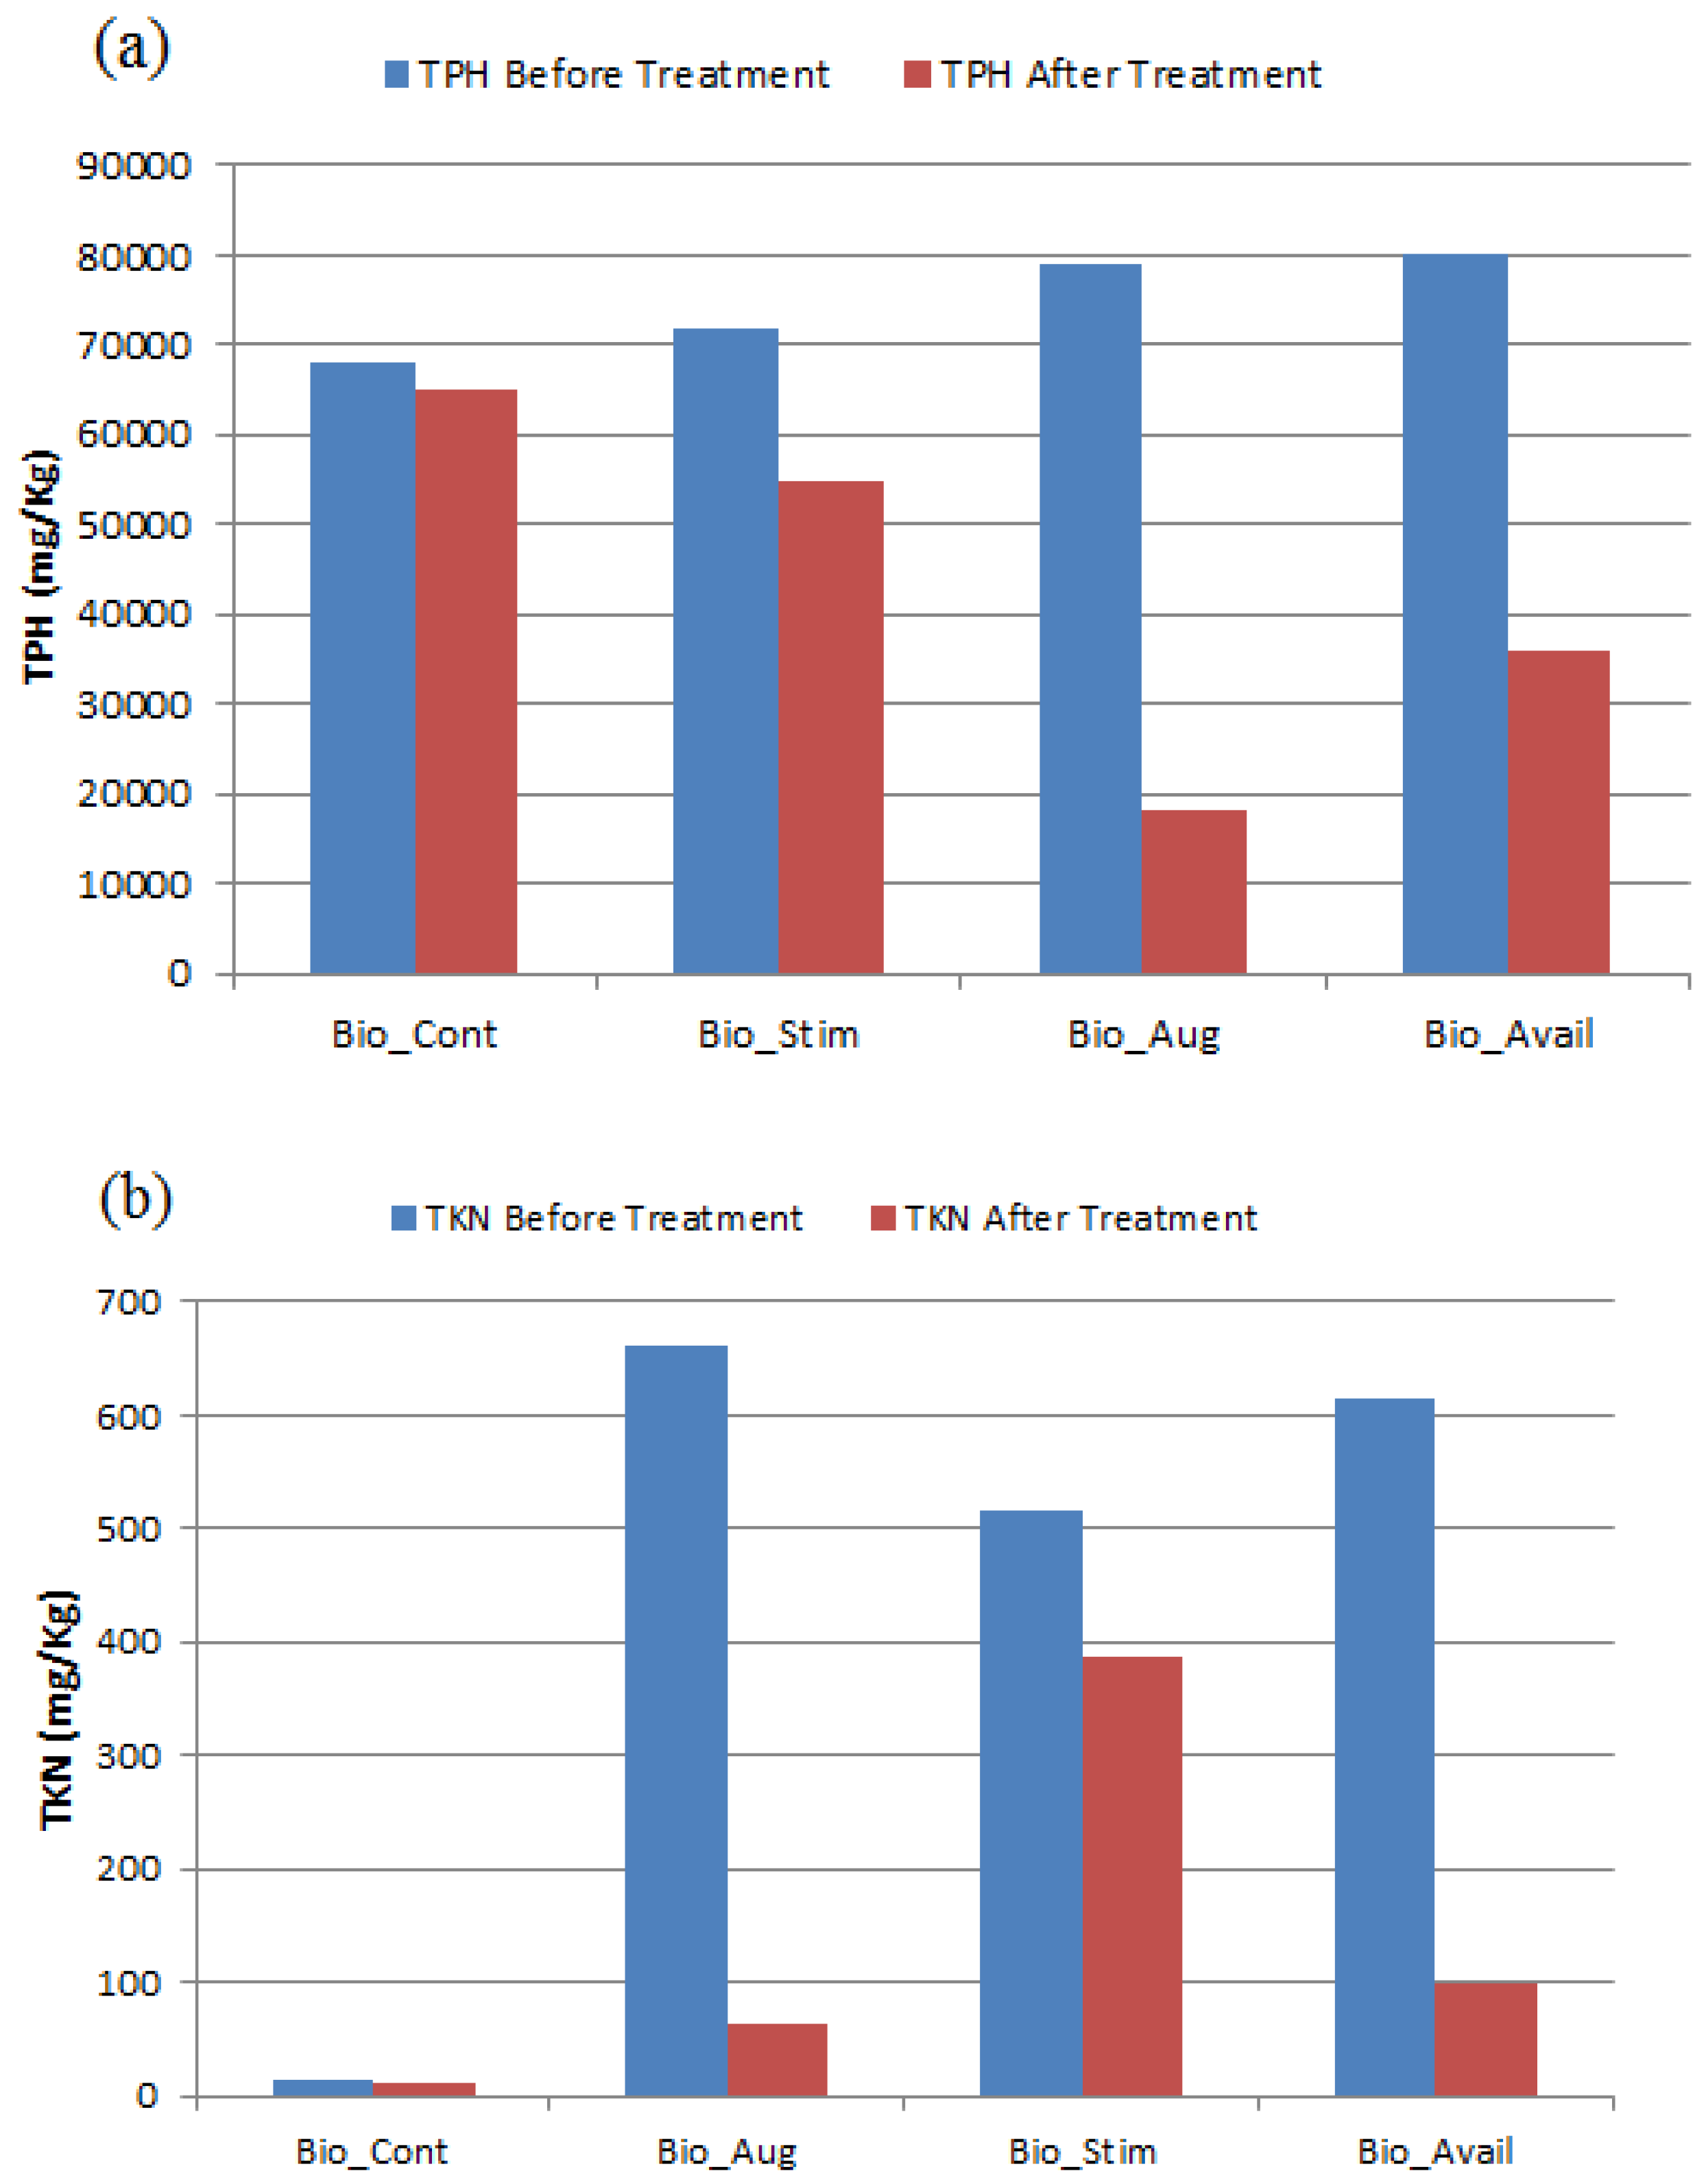
3.2. TPH Removal Efficiency
3.3. Nitrogen Nutrient Effect
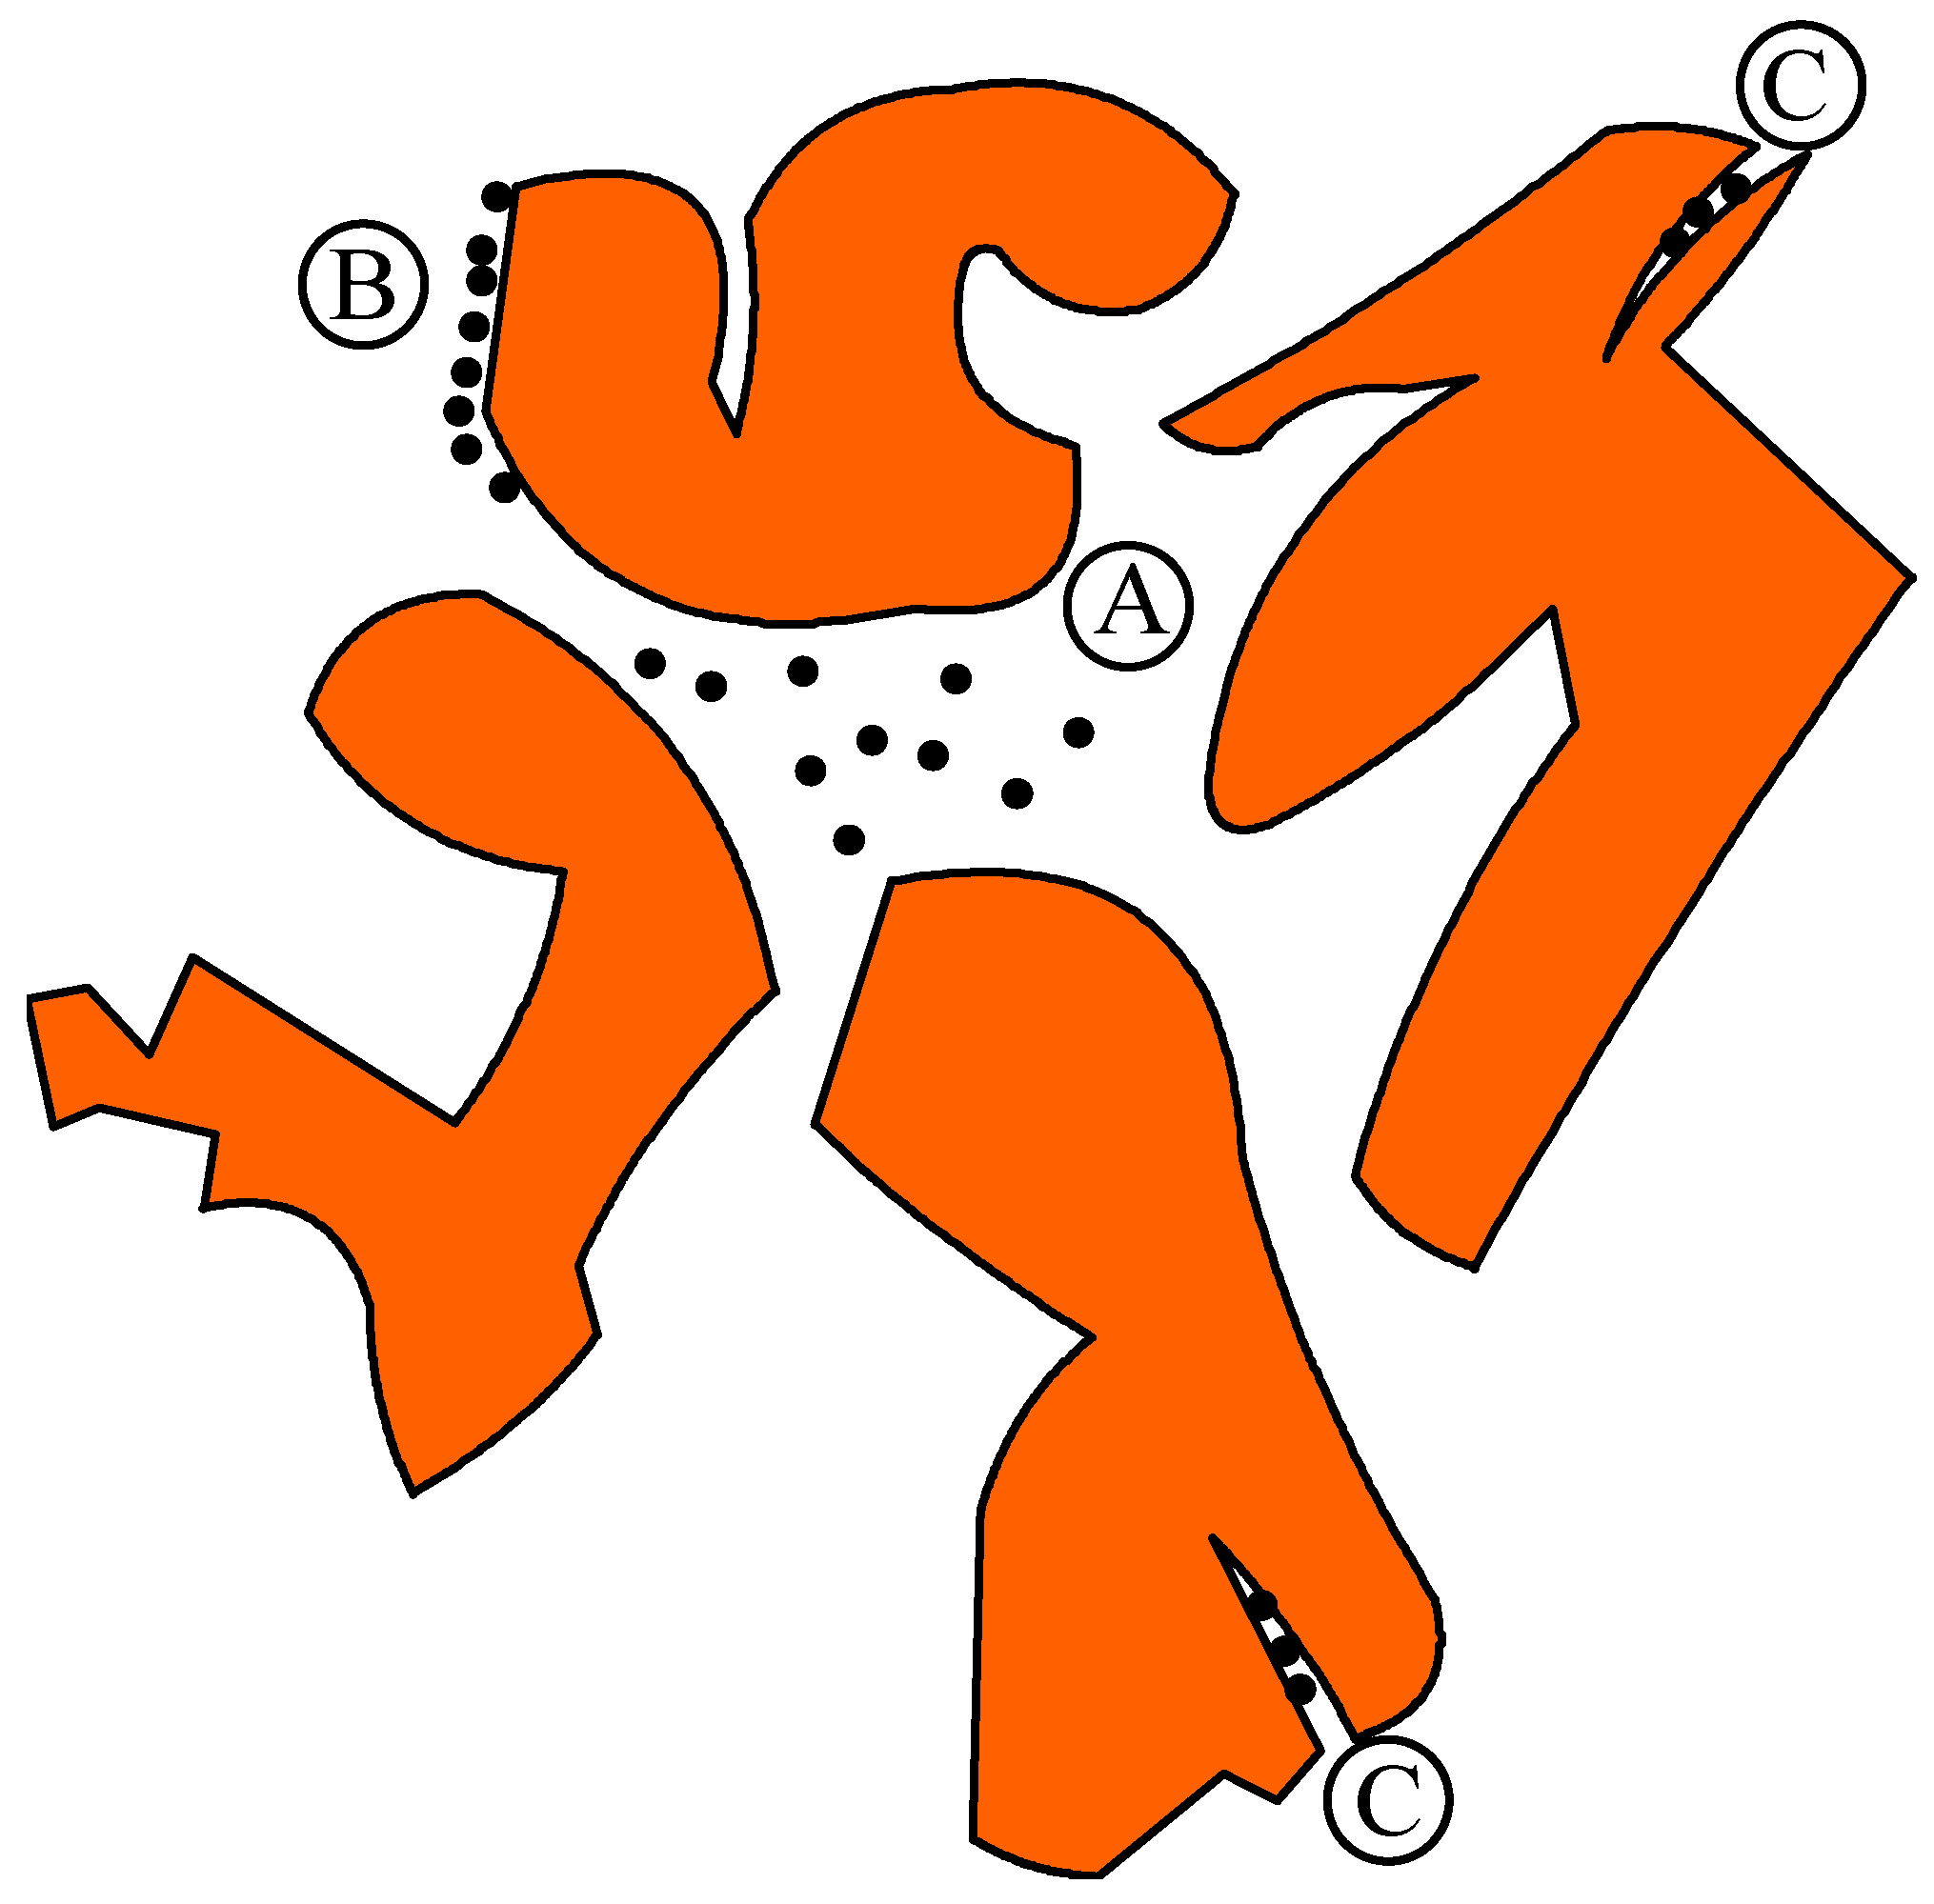
3.4. Bioaccessibility Concept
- A1:
- Hydrocarbons/nutrients can be “bioavailable” if bacteria are also located in the same spot;
- A2:
- Hydrocarbons/nutrients can be “bioaccessible” if bacteria are not located in the same spot but these nutrients may be transported to the spots where bacteria are located;
- B:
- Hydrocarbons/nutrients are adsorbed on soil particles and can be released to become either “bioavailable” or “bioaccessible” as per case A1 or A2;
- C:
- Hydrocarbons/nutrients can be trapped and hence not “bioaccessible” to bacteria.
3.5. Residual PAH Post Biopile Treatment
| PAH | Bio_Cont | Bio_Aug | Bio_Stim | Bio_Avail |
|---|---|---|---|---|
| Naphthalene | 2.65 | 0.54 | 0.70 | 0.49 |
| Acenaphthylene | ND * | 0.09 | 0.16 | 0.10 |
| Acenaphthene | 0.38 | 0.31 | 0.42 | 0.33 |
| Flourene | 3.87 | 2.88 | 4.14 | 3.30 |
| Phenanthrene | 10.30 | 7.48 | 11.0 | 0.21 |
| Anthracene | 0.04 | 0.03 | 0.05 | 0.03 |
| Fluoranthene | 11.30 | 9.55 | 14.9 | 9.78 |
| Pyrene | 2.64 | 2.13 | 3.23 | 2.30 |
| Benzo(a)anthracene | 1.10 | 0.65 | 0.96 | 0.72 |
| Chrycene | 4.87 | 3.43 | 5.22 | 3.83 |
| Benzo(b)flouranthene | 0.05 | 0.09 | 0.03 | 0.08 |
| Benzo(k)flouranthene | 0.07 | 0.20 | 0.38 | 0.07 |
| Benzo(a)pyrene | 0.20 | 0.05 | 0.20 | 0.05 |
| Dibenzo(a,h)anthracene | 0.05 | 0.08 | 0.19 | 0.04 |
| Benzo(g,h,i)perylene | 0.28 | 0.12 | 0.26 | 0.14 |
| Indeno(1,2,3-cd)pyrene | 0.12 | 0.18 | 0.14 | 0.10 |
4. Conclusions
Acknowledgments
Author Contributions
Conflicts of Interest
Appendix
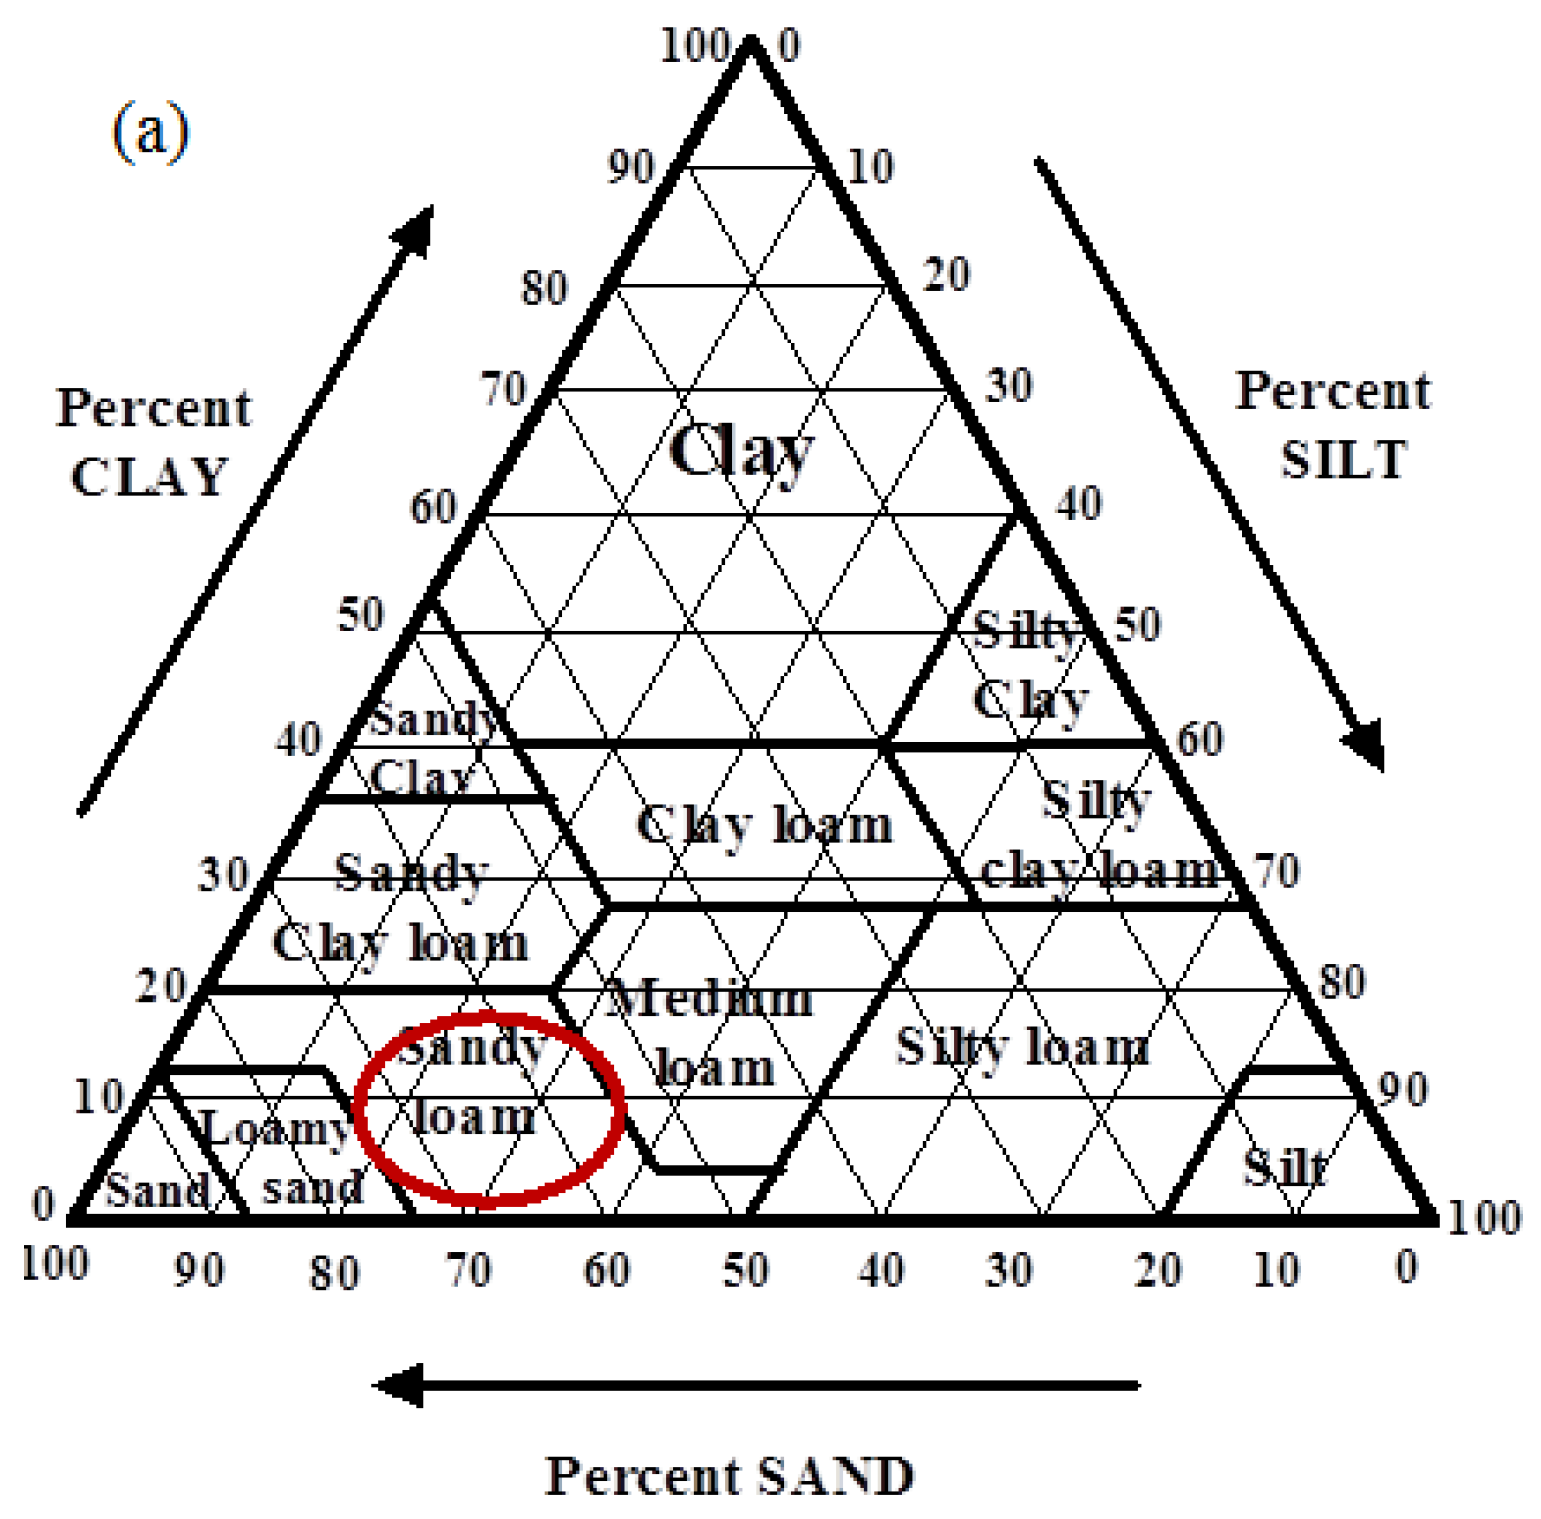
| Texture | Average Particle Size (μm) | Bulk Density (g/L) | pH | Conductivity (μS cm-1) | Field Capacity % (wt/wt) | Oil Absorption Capacity % (wt/wt) |
|---|---|---|---|---|---|---|
| Sandy loam (86.52% sand, 13.48% silt, 0% clay) | 150 | 1.6 | 7.81 | 118 | 23 | 17 |
References
- Jùrgensen, K.S.; Puustinen, J.; Suortti, A.M. Bioremediation of petroleum hydrocarbon-contaminated soil by composting in biopiles. Environ. Pollut. 2000, 107, 245–254. [Google Scholar] [CrossRef]
- Benyahia, F.; Abdulkarim, M.; Zekri, A.; Chaalal, O.; Hasanain, H. Bioremediation of Crude Oil Contaminated Soils: A Black Art or an Engineering Challenge? Process. Saf. Environ. Prot. 2005, 83, 364–370. [Google Scholar] [CrossRef]
- Roy, A.S.; Baruah, R.; Borah, M.; Singh, A.K.; Boruah, H.P.D.; Saikia, N.; Deka, M.; Dutta, N.; Bora, T.C. Bioremediation potential of native hydrocarbon degrading bacterial strains in crude oil contaminated soil under microcosm study. Int. Biodeterior. Biodegradation 2014, 94, 79–89. [Google Scholar] [CrossRef]
- Megharaj, M.; Ramakrishnan, B.; Venkateswarlu, K.; Sethunathan, N.; Naidu, R. Bioremediation approaches for organic pollutants: A critical perspective. Environ. Int. 2011, 37, 1362–1375. [Google Scholar] [CrossRef] [PubMed]
- Glazer, A.N.; Nikaido, H. Microbial Biotechnology: Fundamentals of Applied Microbiology; Cambridge University Press: Cambridge, UK, 2007. [Google Scholar]
- Fodelianakis, S.; Antoniou, E.; Mapelli, F.; Magagnini, M.; Nikolopoulou, M.; Marasco, R.; Barbato, M.; Tsiola, A.; Tsikopoulou, I.; Giaccaglia, L.; et al. Allochthonous bioaugmentation in ex situ treatment of crude oil-polluted sediments in the presence of an effective degrading indigenous microbiome. J. Hazard. Mater. 2015, 287, 78–86. [Google Scholar] [CrossRef] [PubMed]
- Suja, F.; Rahim, F.; Taha, M.R.; Hambali, N.; Razali, M.R.; Khalid, A.; Hamzah, A. Effects of local microbial bioaugmentation and biostimulation on the bioremediation of total petroleum hydrocarbons (TPH) in crude oil contaminated soil based on laboratory and field observations. Int. Biodeterior. Biodegradation 2014, 90, 115–122. [Google Scholar] [CrossRef]
- Saadoun, I.; Mohammad, M.J.; Hameed, K.M.; Shawaqfah, M. Microbial populations of crude oil spill polluted soils at the Jordan-Iraq desert (the Badia region). Braz. J. Microbiol. 2008, 39, 453–456. [Google Scholar] [CrossRef] [PubMed]
- Alvarez, P.J.J.; Illman, W.A. Bioremediation and Natural Attenuation: Process. Fundamentals and Mathematical Model; John Wiley & Sons: New York, NY, USA, 2006. [Google Scholar]
- Braddock, J.F.; Ruth, M.L.; Catterall, P.H.; Walworth, J.L.; McCarthy, K.A. Enhancement and Inhibition of Microbial Activity in Hydrocarbon-Contaminated Arctic Soils: Implications for Nutrient-Amended Bioremediation. Environ. Sci. Technol. Lett. 1997, 31, 2078–2084. [Google Scholar] [CrossRef]
- Morgan, P.; Watkinson, R.J. Hydrocarbon degradation in soils and methods for soil biotreatment. Crit. Rev. Biotechnol. 1989, 8, 305–333. [Google Scholar] [CrossRef] [PubMed]
- Agamuthu, P.; Tan, Y.S.; Fauziah, S.H. Bioremediation of hydrocarbon contaminated soil using selected organic wastes. Procedia Environ. Sci. 2013, 18, 694–702. [Google Scholar] [CrossRef]
- Acuña, A.J.; Pucci, O.H.; Pucci, G.N. Effect of nitrogen deficiency in the biodegradation of aliphatic and aromatic hydrocarbons in Patagonian contaminated soil. Int. J. Res. Rev. Appl. Sci. 2012, 11, 470–476. [Google Scholar]
- Lee, S.H.; Lee, S.; Kim, D.Y.; Kim, J.G. Degradation characteristics of waste lubricants under different nutrient conditions. J. Hazard. Mater. 2007, 143, 65–72. [Google Scholar] [CrossRef] [PubMed]
- Xu, Y.; Lu, M. Bioremediation of crude oil-contaminated soil: Comparison of different biostimulation and bioaugmentation treatments. J. Hazard. Mater. 2010, 183, 395–401. [Google Scholar] [CrossRef] [PubMed]
- Betancur-Corredor, B.; Pino, N.J.; Cardona, S.; Peñuela, G.A. Evaluation of biostimulation and Tween 80 addition for the bioremediation of long-term DDT-contaminated soil. J. Environ. Sci. 2015, 28, 101–109. [Google Scholar] [CrossRef] [PubMed]
- Calvo, C.; Manzanera, M.; Silva-Castro, G.A.; Uad, I.; Gonzales-Lopez, J. Application of bioemulsifiers in soil oil bioremediation processes. Future prospects. Sci. Total Environ. 2009, 407, 3634–3640. [Google Scholar] [CrossRef] [PubMed]
- Harmsen, J. Measuring Bioavailability: From a Scientific Approach to Standard Methods. J. Environ. Qual. 2007, 36, 1420–1428. [Google Scholar] [CrossRef] [PubMed]
- Semple, K.T.; Doick, K.J.; Wick, L.Y.; Harms, H. Microbial interactions with organic contaminants in soil: Definitions, processes and measurement. Environ. Pollut. 2007, 150, 166–176. [Google Scholar] [CrossRef] [PubMed]
- Stokes, J.D.; Paton, G.I.; Semple, K.T. Behaviour and assessment of bioavailability of organic contaminants in soil: Relevance for risk assessment and remediation. Soil Use Manag. 2006, 21, 475–486. [Google Scholar] [CrossRef]
- Couling, N.R.; Towell, M.G.; Semple, K.T. Biodegradation of PAHs in soil: Influence of chemical structure, concentration and multiple amendment. Environ. Pollut. 2010, 158, 3411–3420. [Google Scholar] [CrossRef] [PubMed]
- Riding, M.J.; Doick, K.J.; Martin, F.L.; Jones, K.C.; Semple, K.T. Chemical measures of bioavailability/bioaccessibility of PAHs in soil: Fundamentals to application. J. Hazard. Mater. 2013, 261, 687–700. [Google Scholar] [CrossRef] [PubMed]
- Margesin, R.; Zimmerbauer, A.; Schinner, F. Monitoring of bioremediation by soil biological activities. Chemosphere 2000, 40, 339–346. [Google Scholar] [CrossRef]
- Amnite p300: Aliphatic and Aromatic Chemicals Degrading Product. Available online: http://www.clevebio.com/prodpage.asp?prodid=14 (accessed on 24 December 2015).
© 2016 by the authors; licensee MDPI, Basel, Switzerland. This article is an open access article distributed under the terms and conditions of the Creative Commons by Attribution (CC-BY) license (http://creativecommons.org/licenses/by/4.0/).
Share and Cite
Benyahia, F.; Embaby, A.S. Bioremediation of Crude Oil Contaminated Desert Soil: Effect of Biostimulation, Bioaugmentation and Bioavailability in Biopile Treatment Systems. Int. J. Environ. Res. Public Health 2016, 13, 219. https://doi.org/10.3390/ijerph13020219
Benyahia F, Embaby AS. Bioremediation of Crude Oil Contaminated Desert Soil: Effect of Biostimulation, Bioaugmentation and Bioavailability in Biopile Treatment Systems. International Journal of Environmental Research and Public Health. 2016; 13(2):219. https://doi.org/10.3390/ijerph13020219
Chicago/Turabian StyleBenyahia, Farid, and Ahmed Shams Embaby. 2016. "Bioremediation of Crude Oil Contaminated Desert Soil: Effect of Biostimulation, Bioaugmentation and Bioavailability in Biopile Treatment Systems" International Journal of Environmental Research and Public Health 13, no. 2: 219. https://doi.org/10.3390/ijerph13020219