
Crash Risk Prediction Modeling Based on the Traffic Conflict Technique and a Microscopic Simulation for Freeway Interchange Merging Areas


Abstract
:1. Introduction
2. Methodology
2.1. Time to Collision (TTC) Calculation
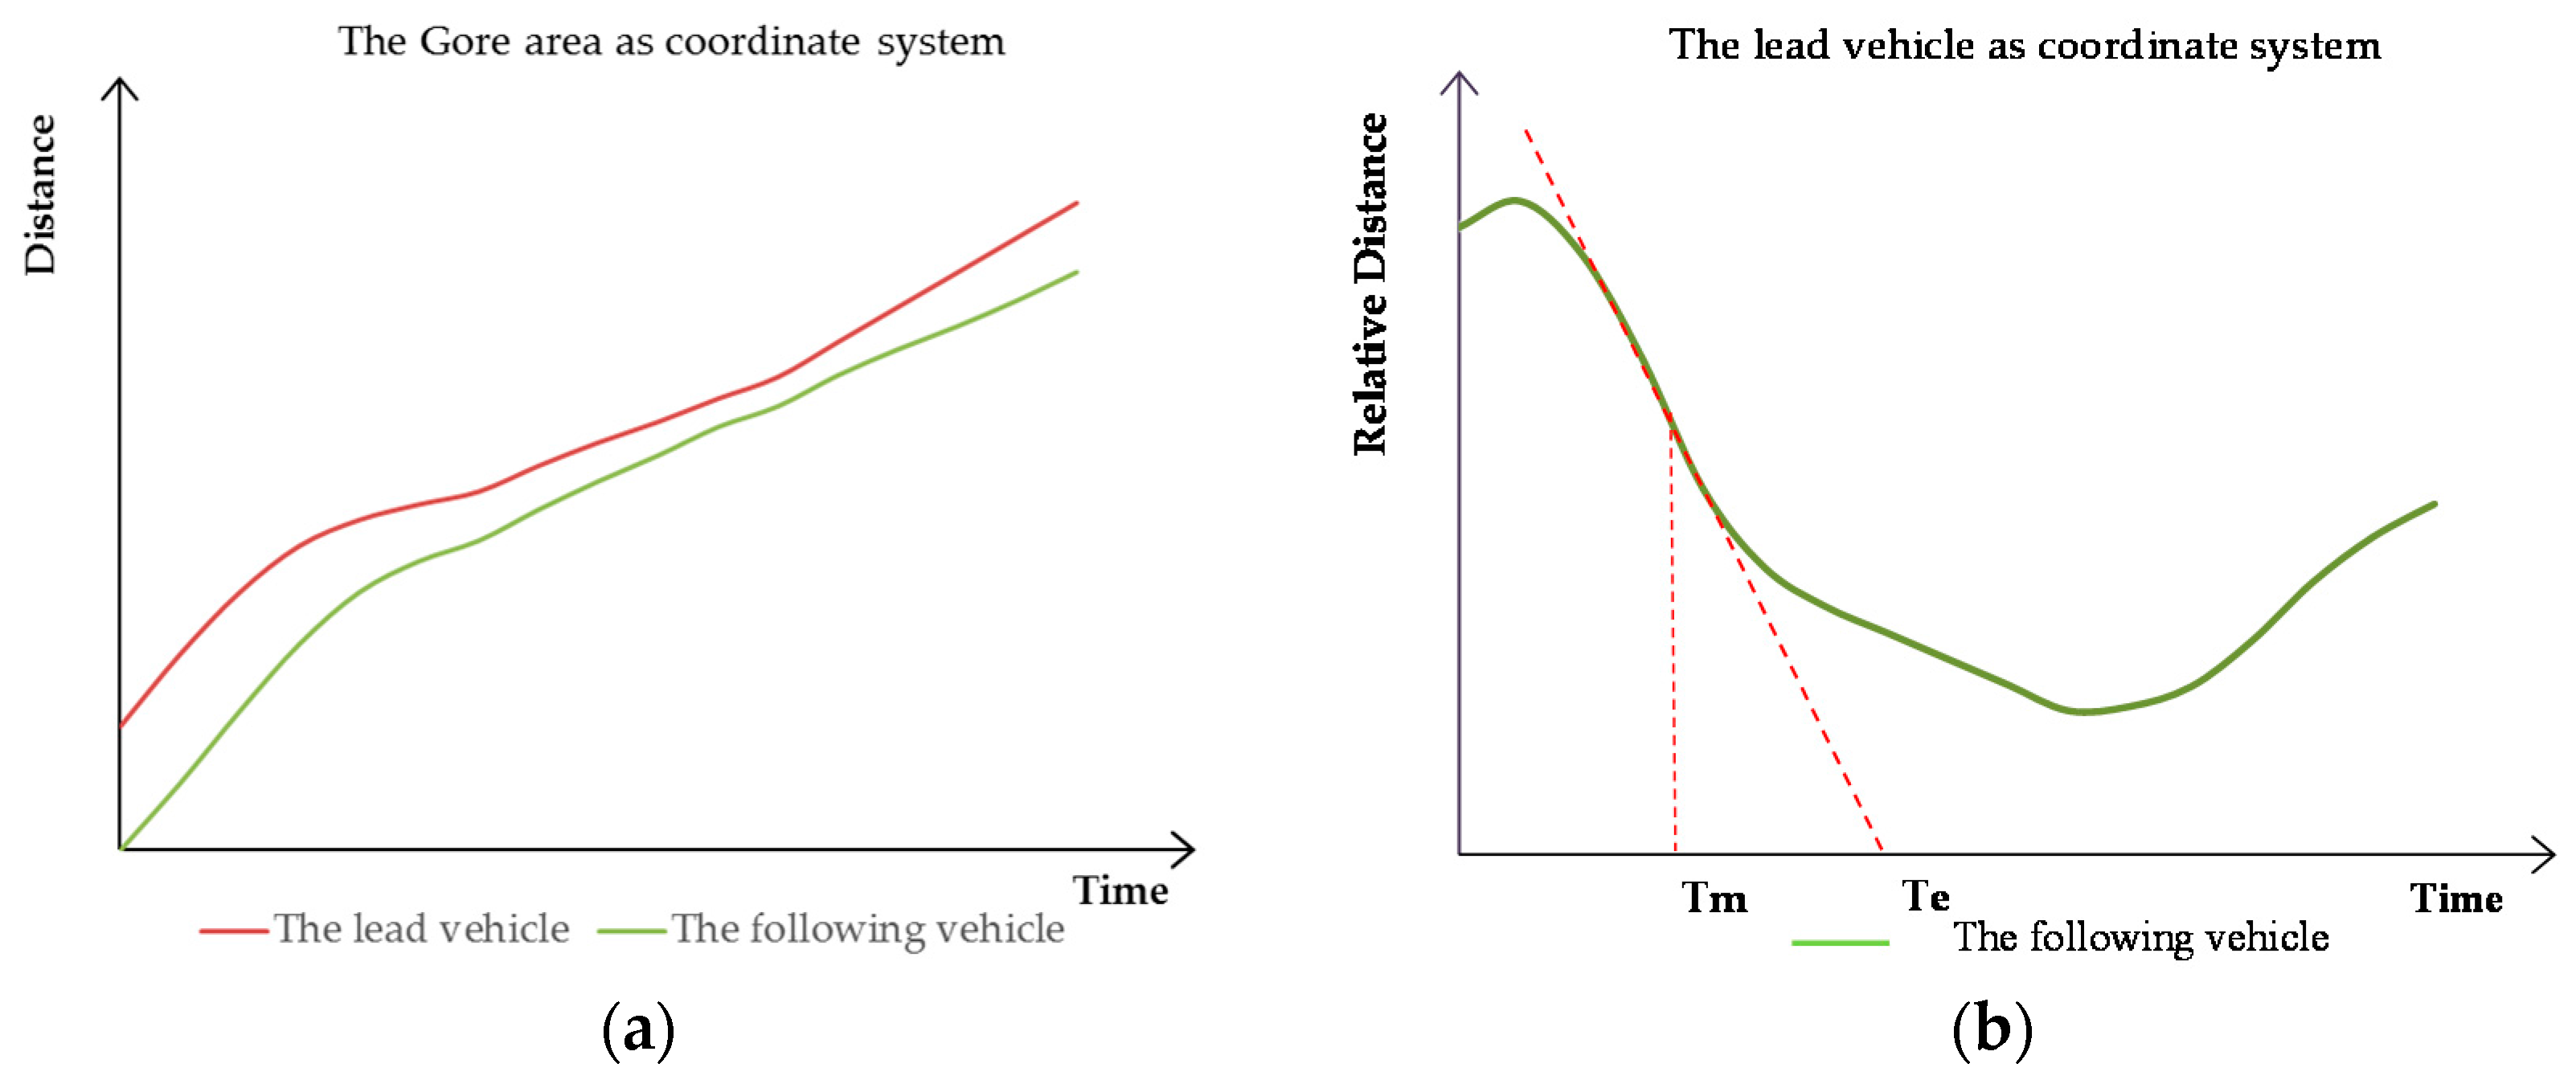
2.1.1. The Rear-End Conflict
- —Rear-end conflict value, s;
- —The largest slope of Relative Distance occurred time, s;
- —The virtual collision moment, s.
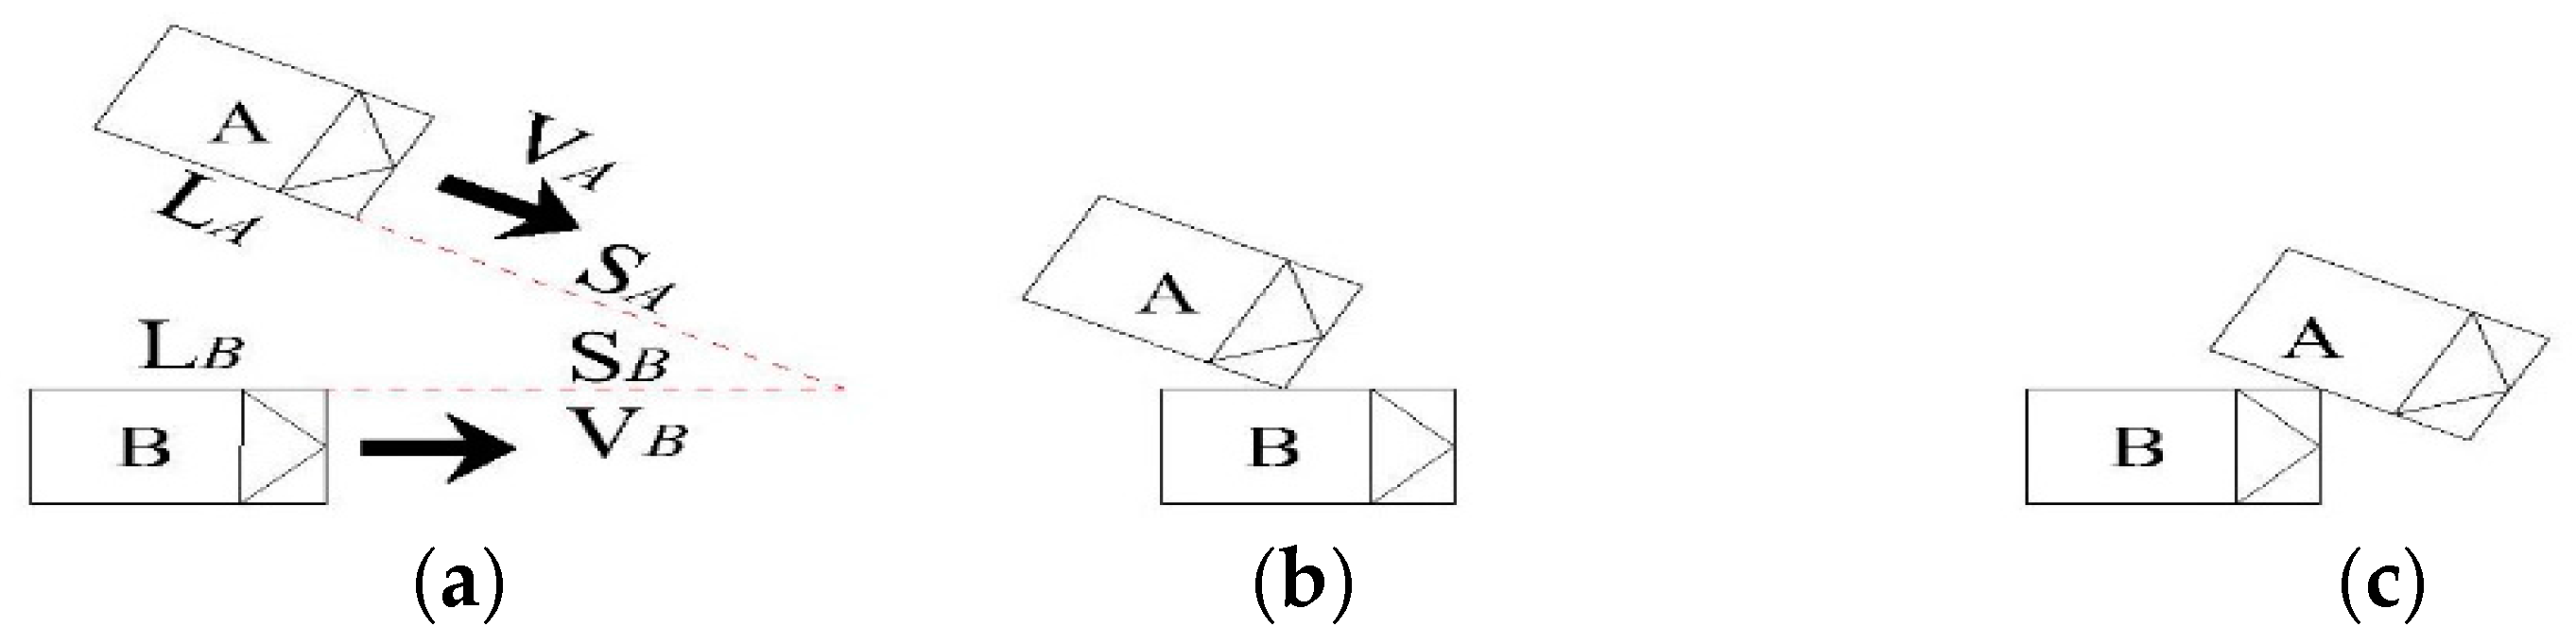
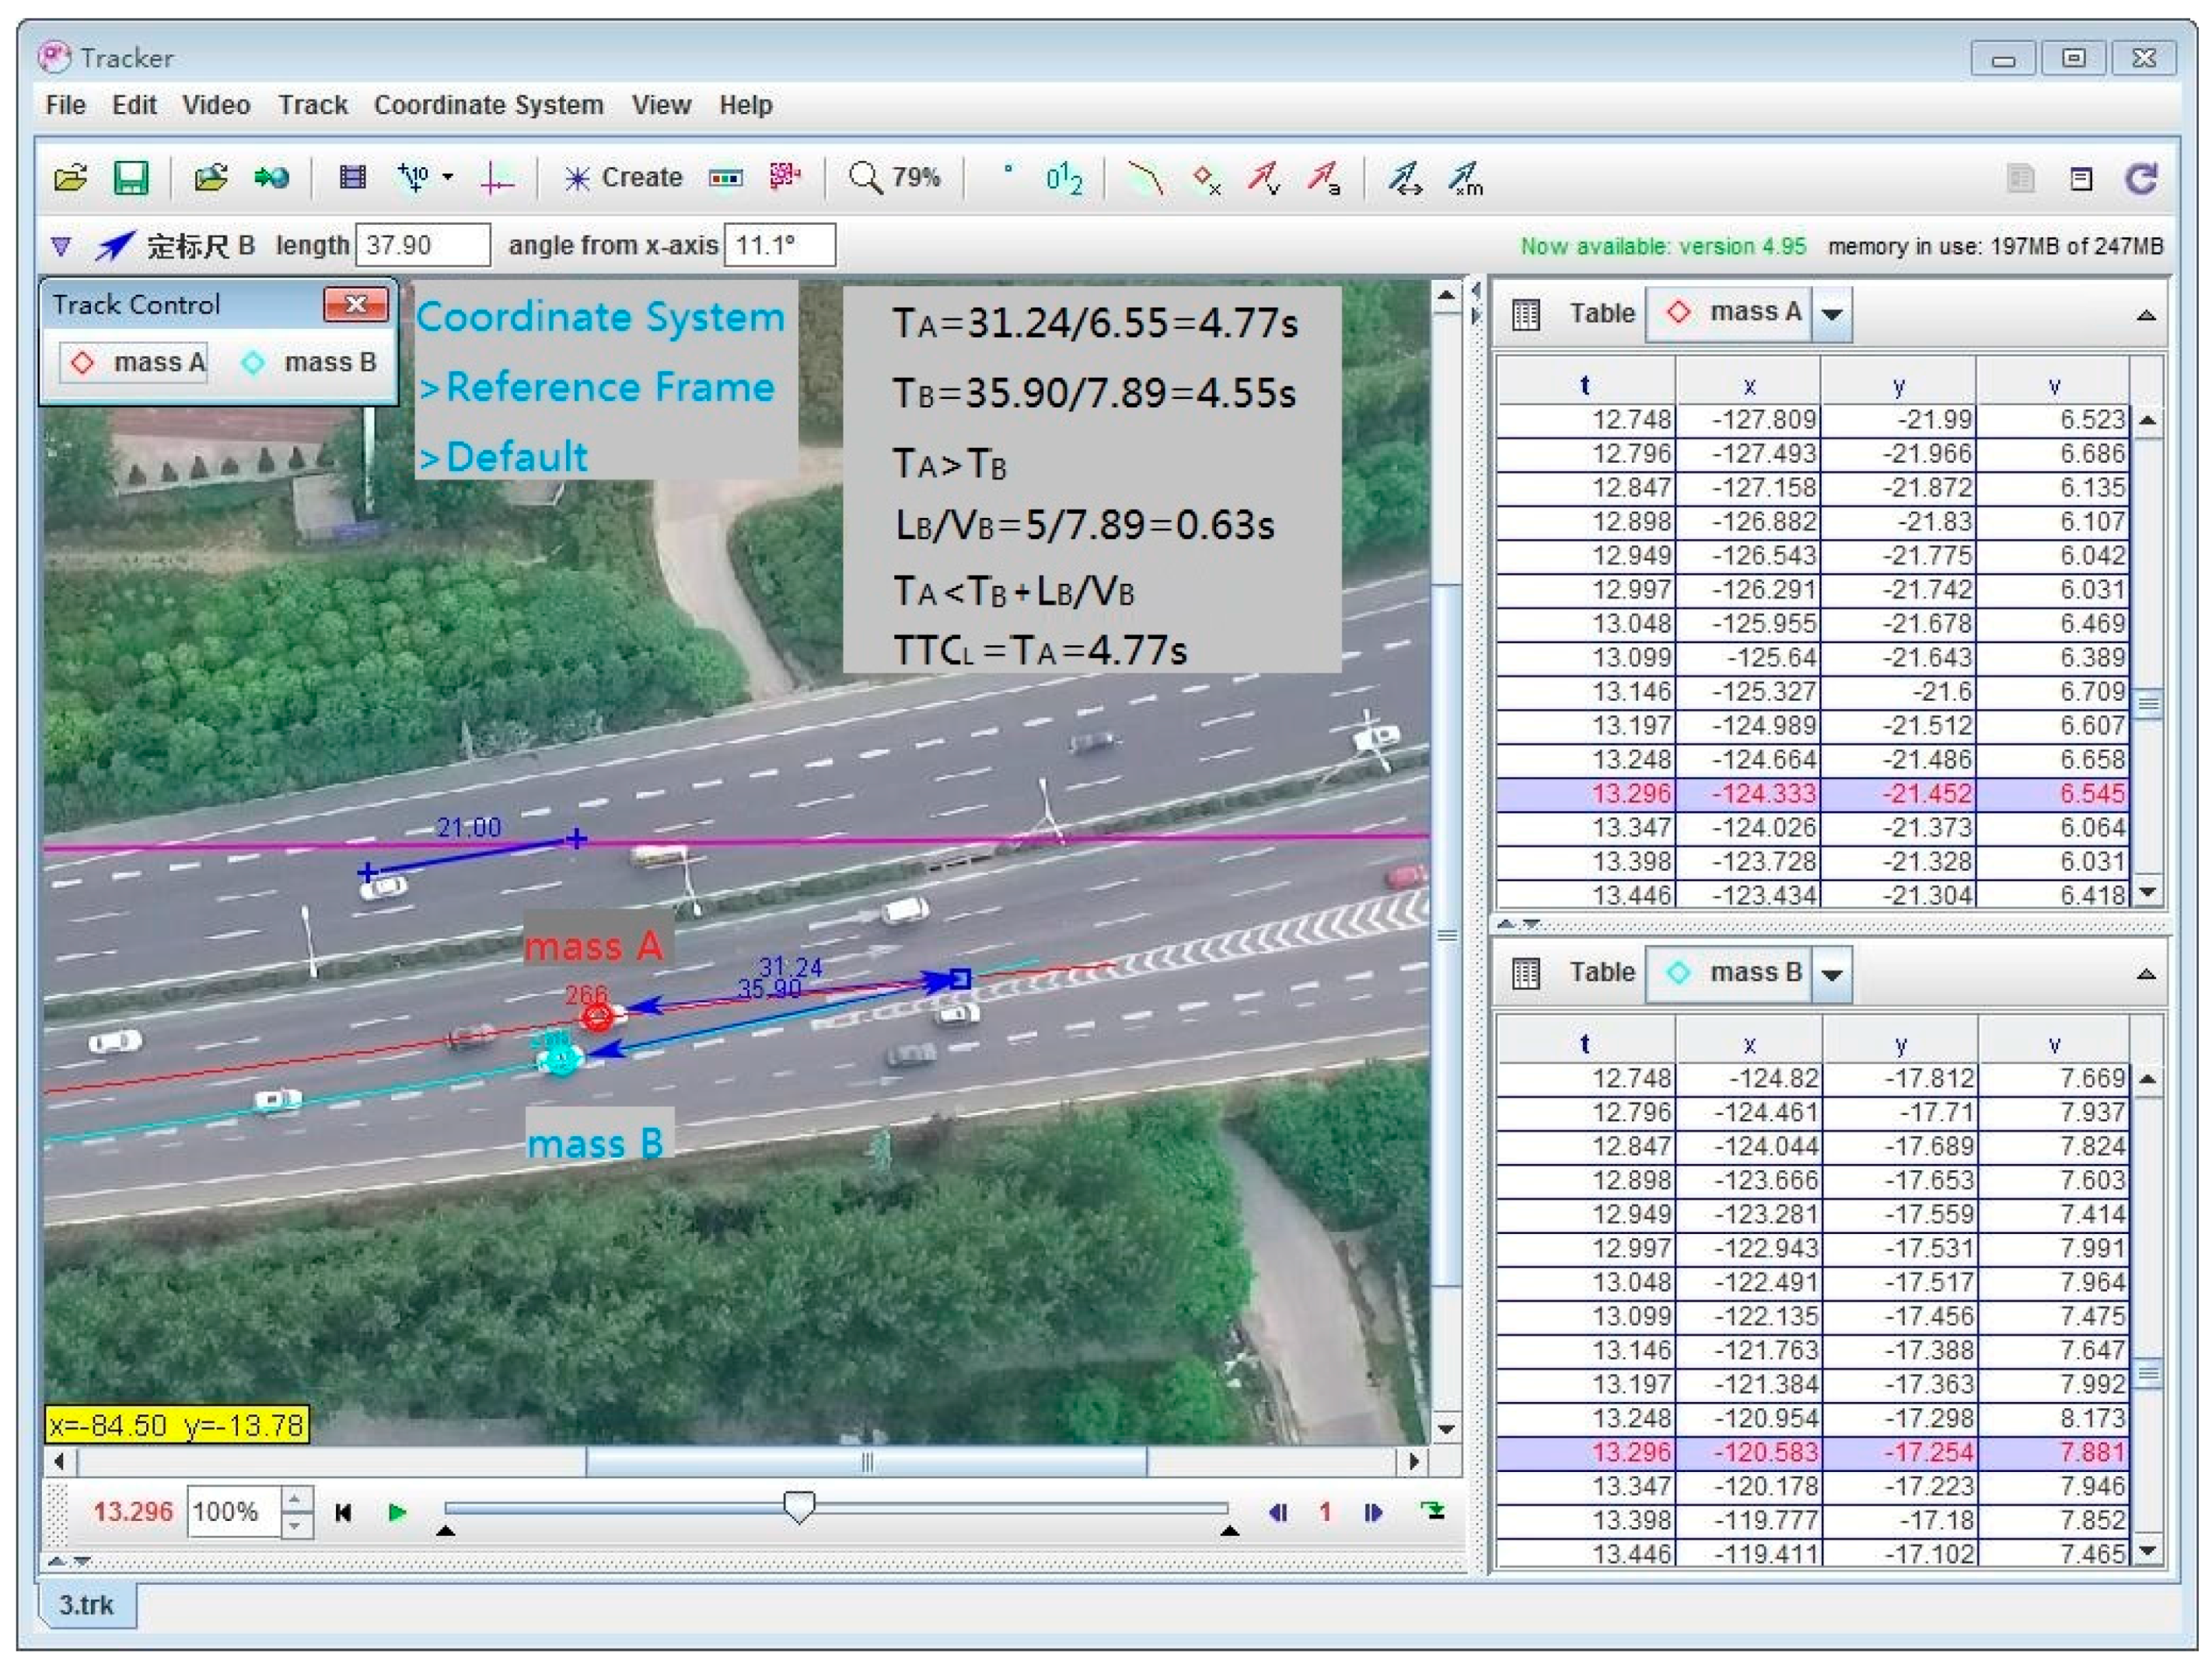
2.1.2. The Lane-Change Conflict
- —Lane-change conflict value, s;
- —Avoidance behavior generation time, s;
- —Vehicle A length, m;
- —Vehicle B length, m;
- —Vehicle A speed at , m/s;
- —Vehicle B speed at , m/s;
- —Travel distance of vehicle A from avoidance behavior generation site to trajectory cross-point, m;
- —Travel distance of vehicle B from avoidance behavior generation site to trajectory cross-point, m;
- —Travel time of vehicle A from avoidance behavior generation site to trajectory cross-point, s;
- —Travel time of vehicle B from avoidance behavior generation site to trajectory cross-point, s.
2.1.3. TTC Threshold Calculation
Severity Classification
TTC Value Calculation
TTC Threshold Calculation
2.2. HCRI Calculation
- —Hourly conflict risk indexes;
- —The number of serious lane-change conflicts;
- —The number of general lane-change conflicts;
- —The number of serious rear-end conflicts;
- —The number of general rear-end conflicts.
2.3. Model Prototype
- —Hourly conflict risk indexes;
- —Independent variable coefficient;
- —Some independent variable;
- —Ramp traffic volume, veh/h;
- —Outer lane traffic volume, veh/h;
- —Acceleration lane length, m;
- —Ramp percent heavy vehicles, %;
- —Outer lane percent heavy vehicles, %;
- —Ramp design speed, km/h.
- —Constant term.
3. Data Collection
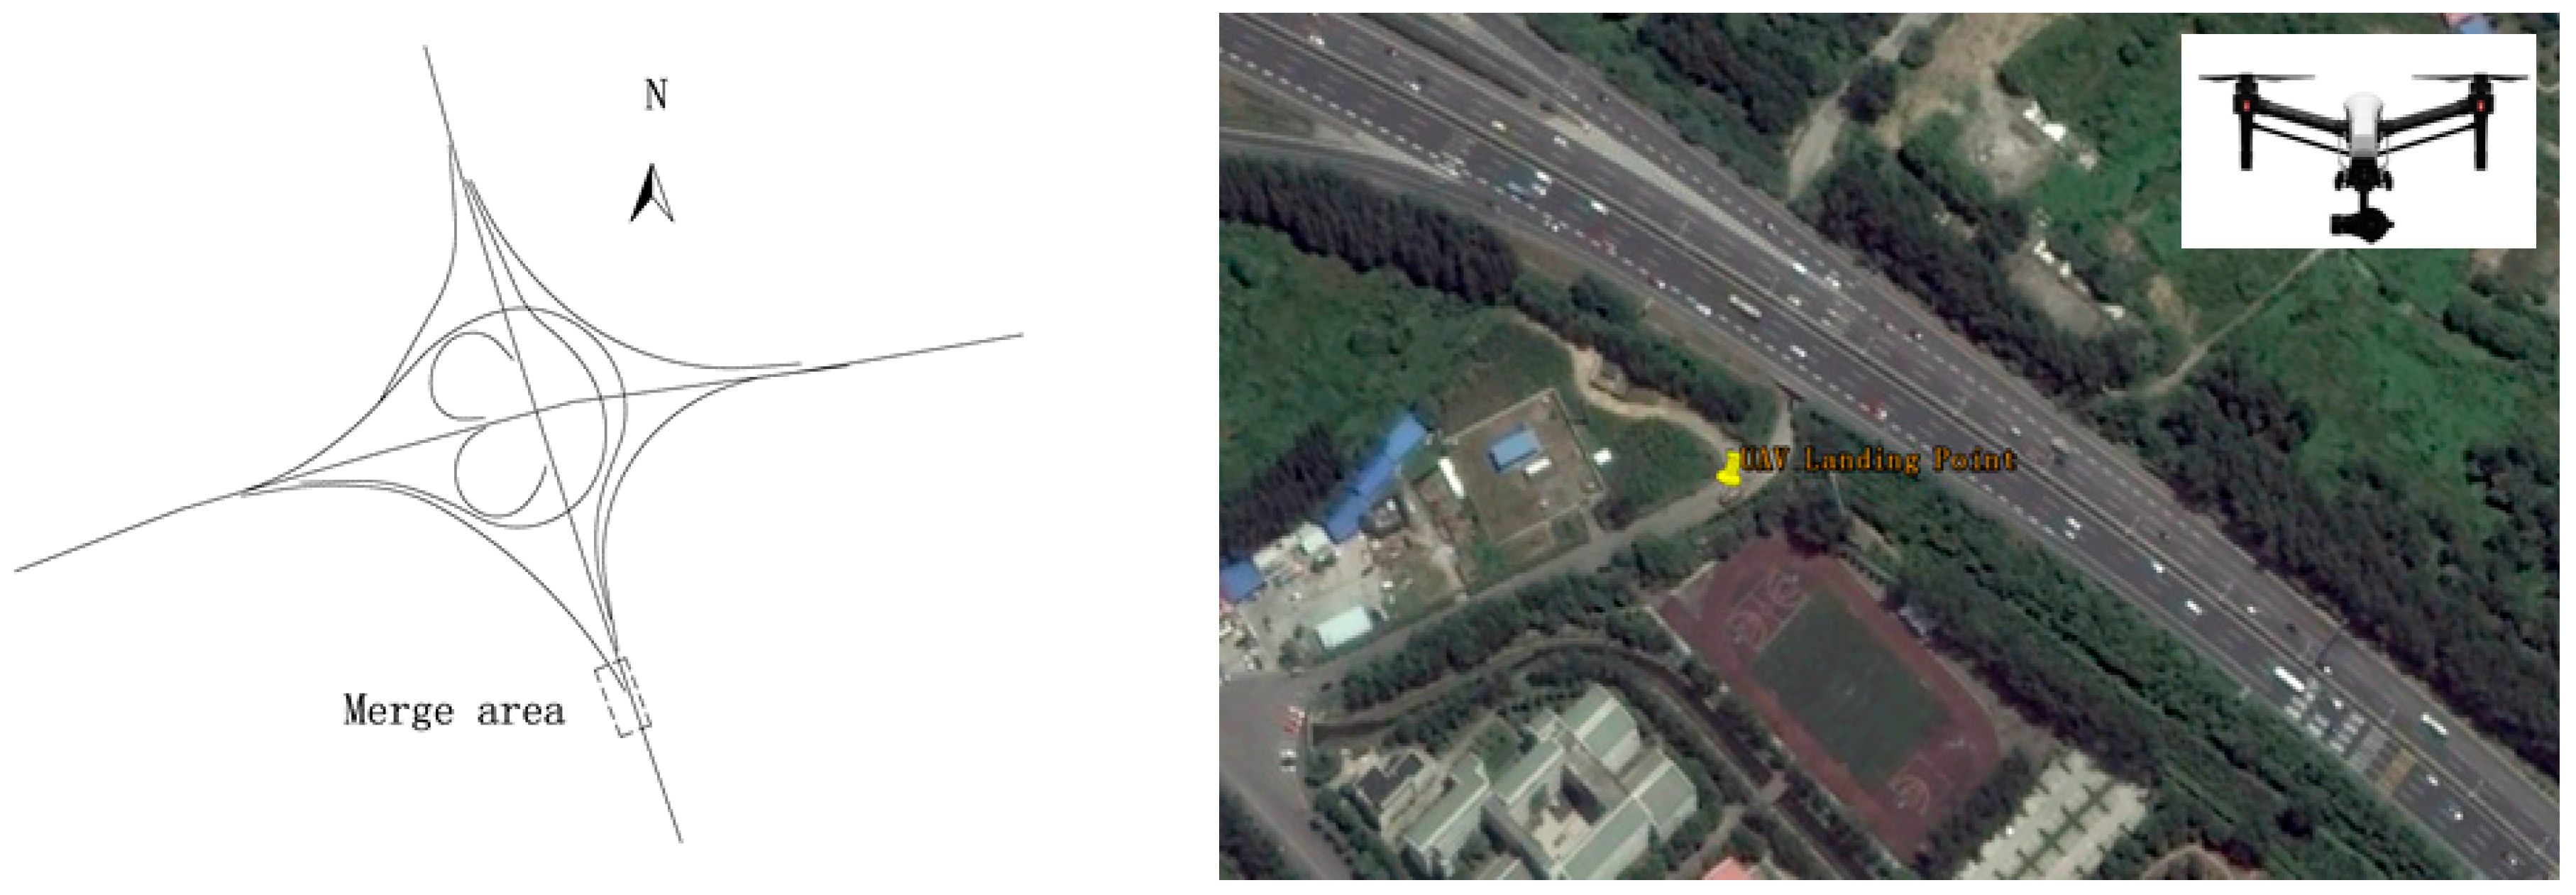
3.1. Field Data
3.1.1. Observer Training
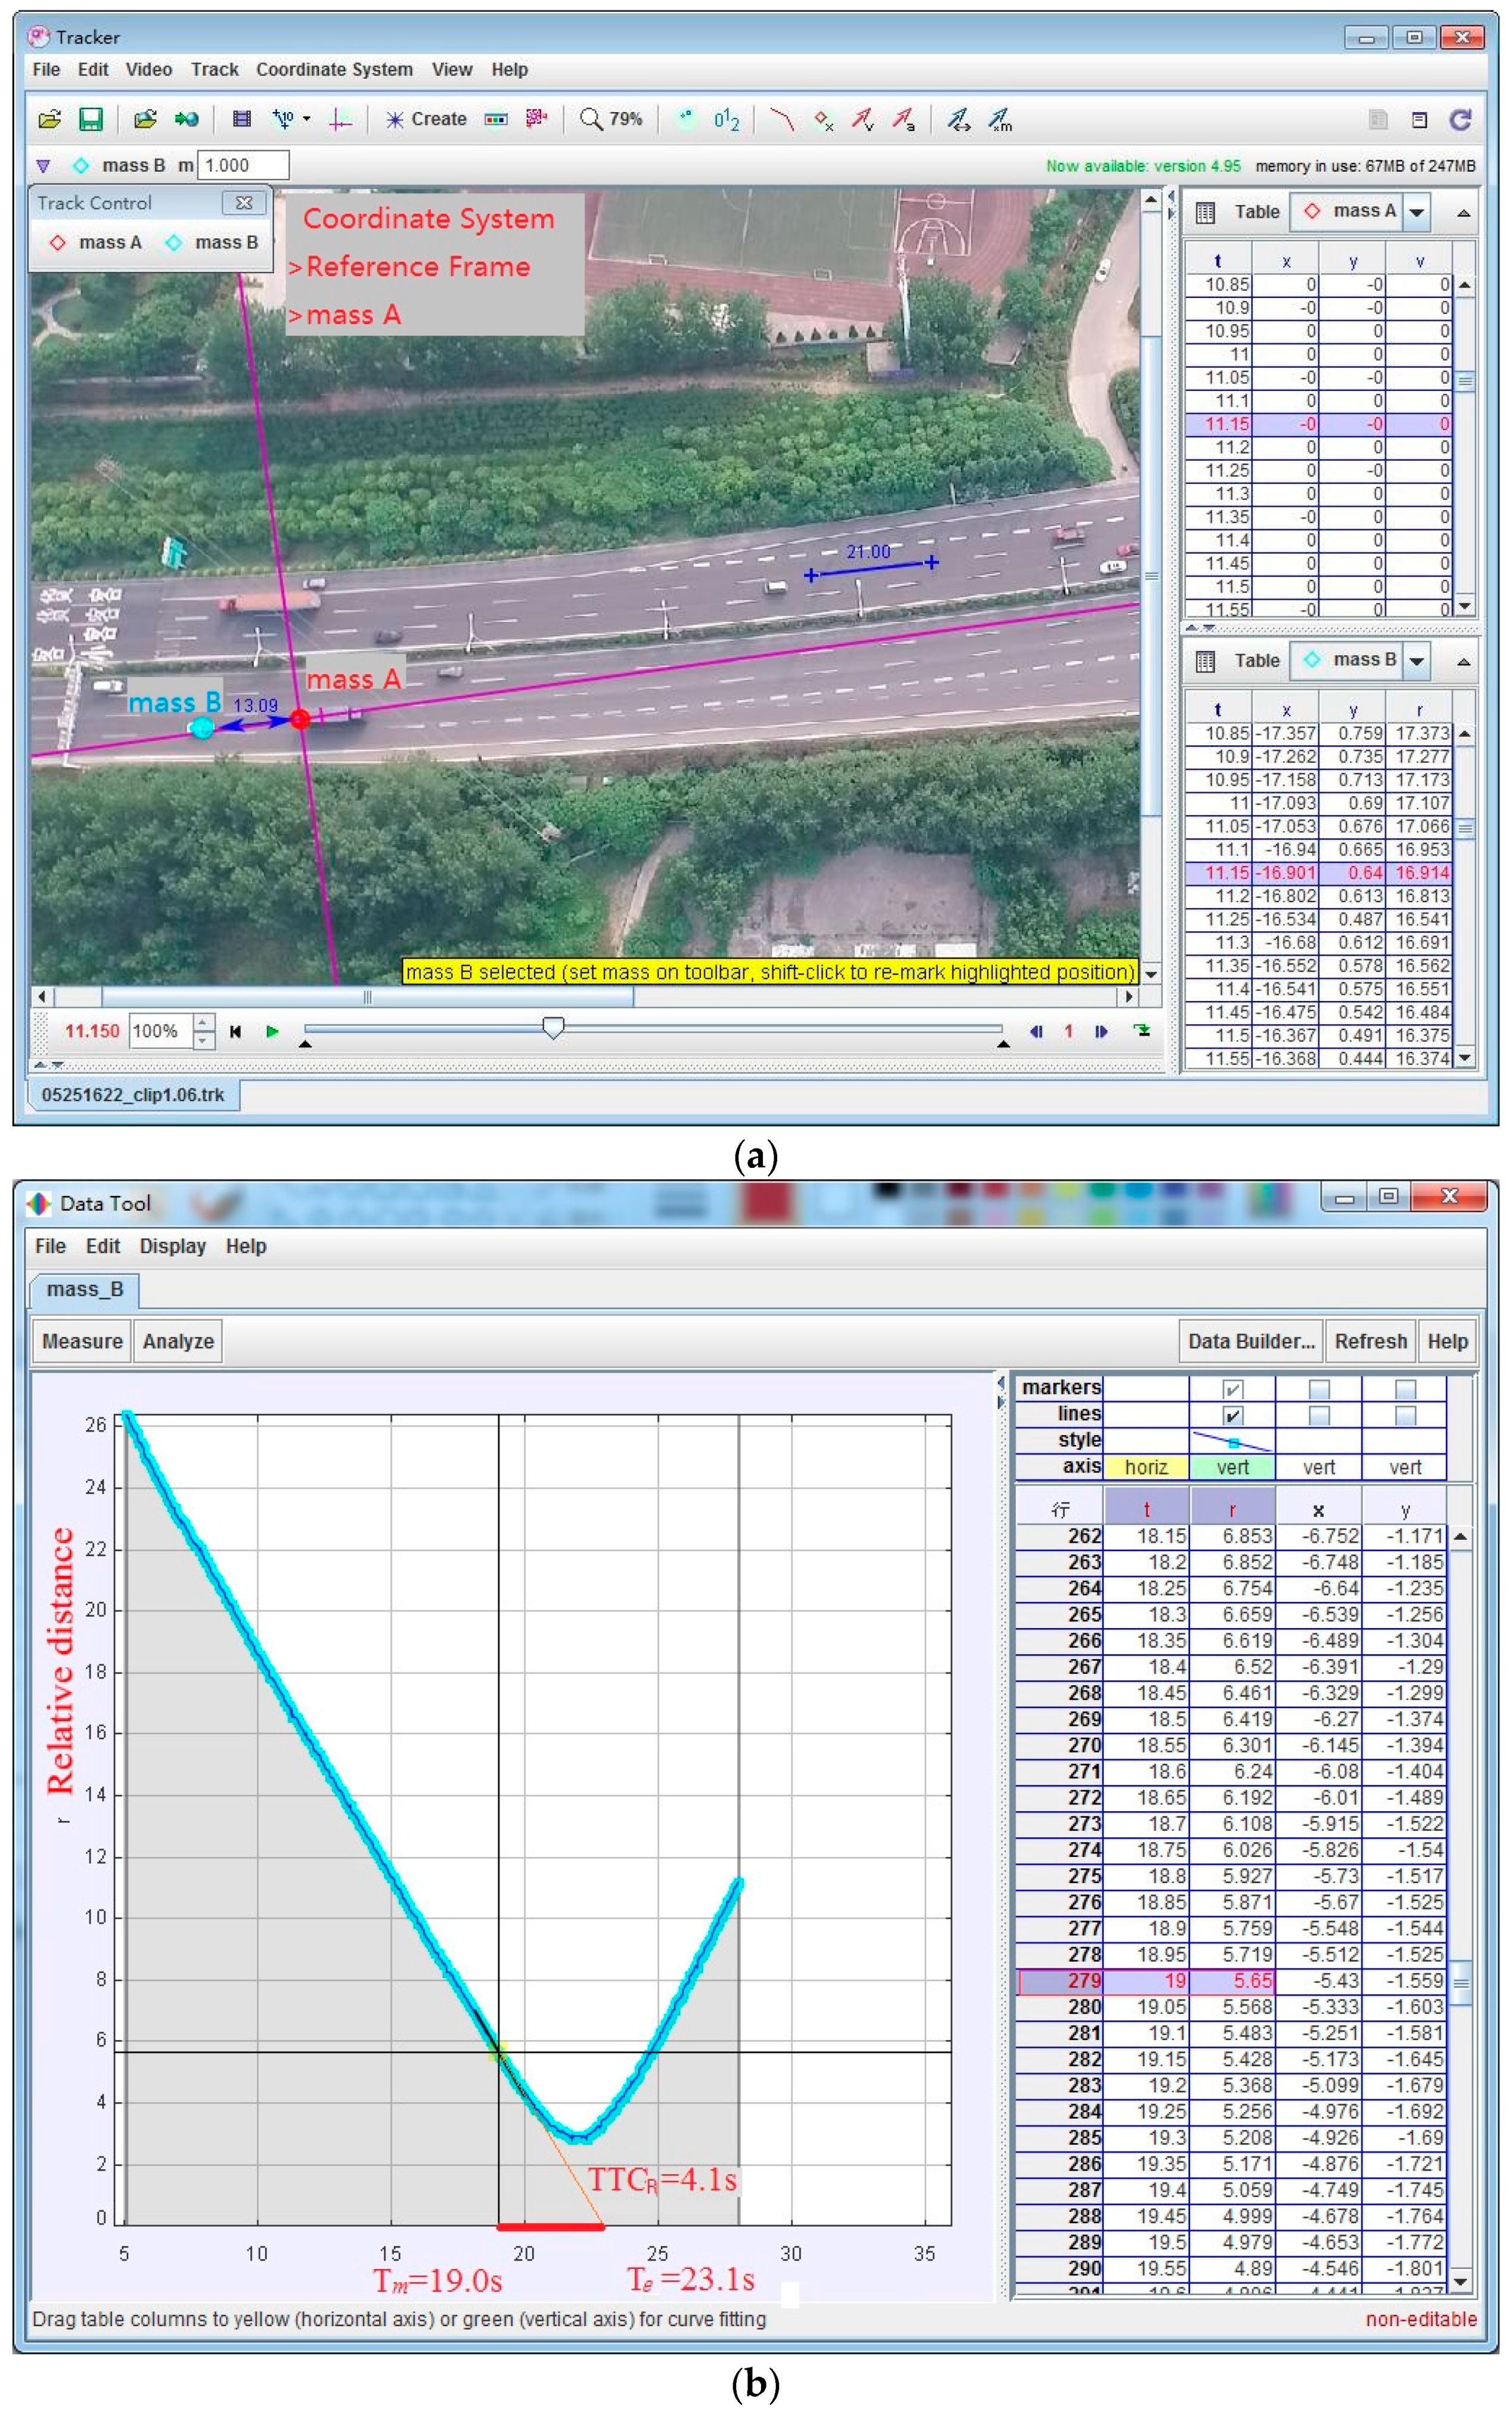
3.1.2. Data Processing
The Rear-End Conflict
The Lane-Change Conflict
TTC Threshold Calculation
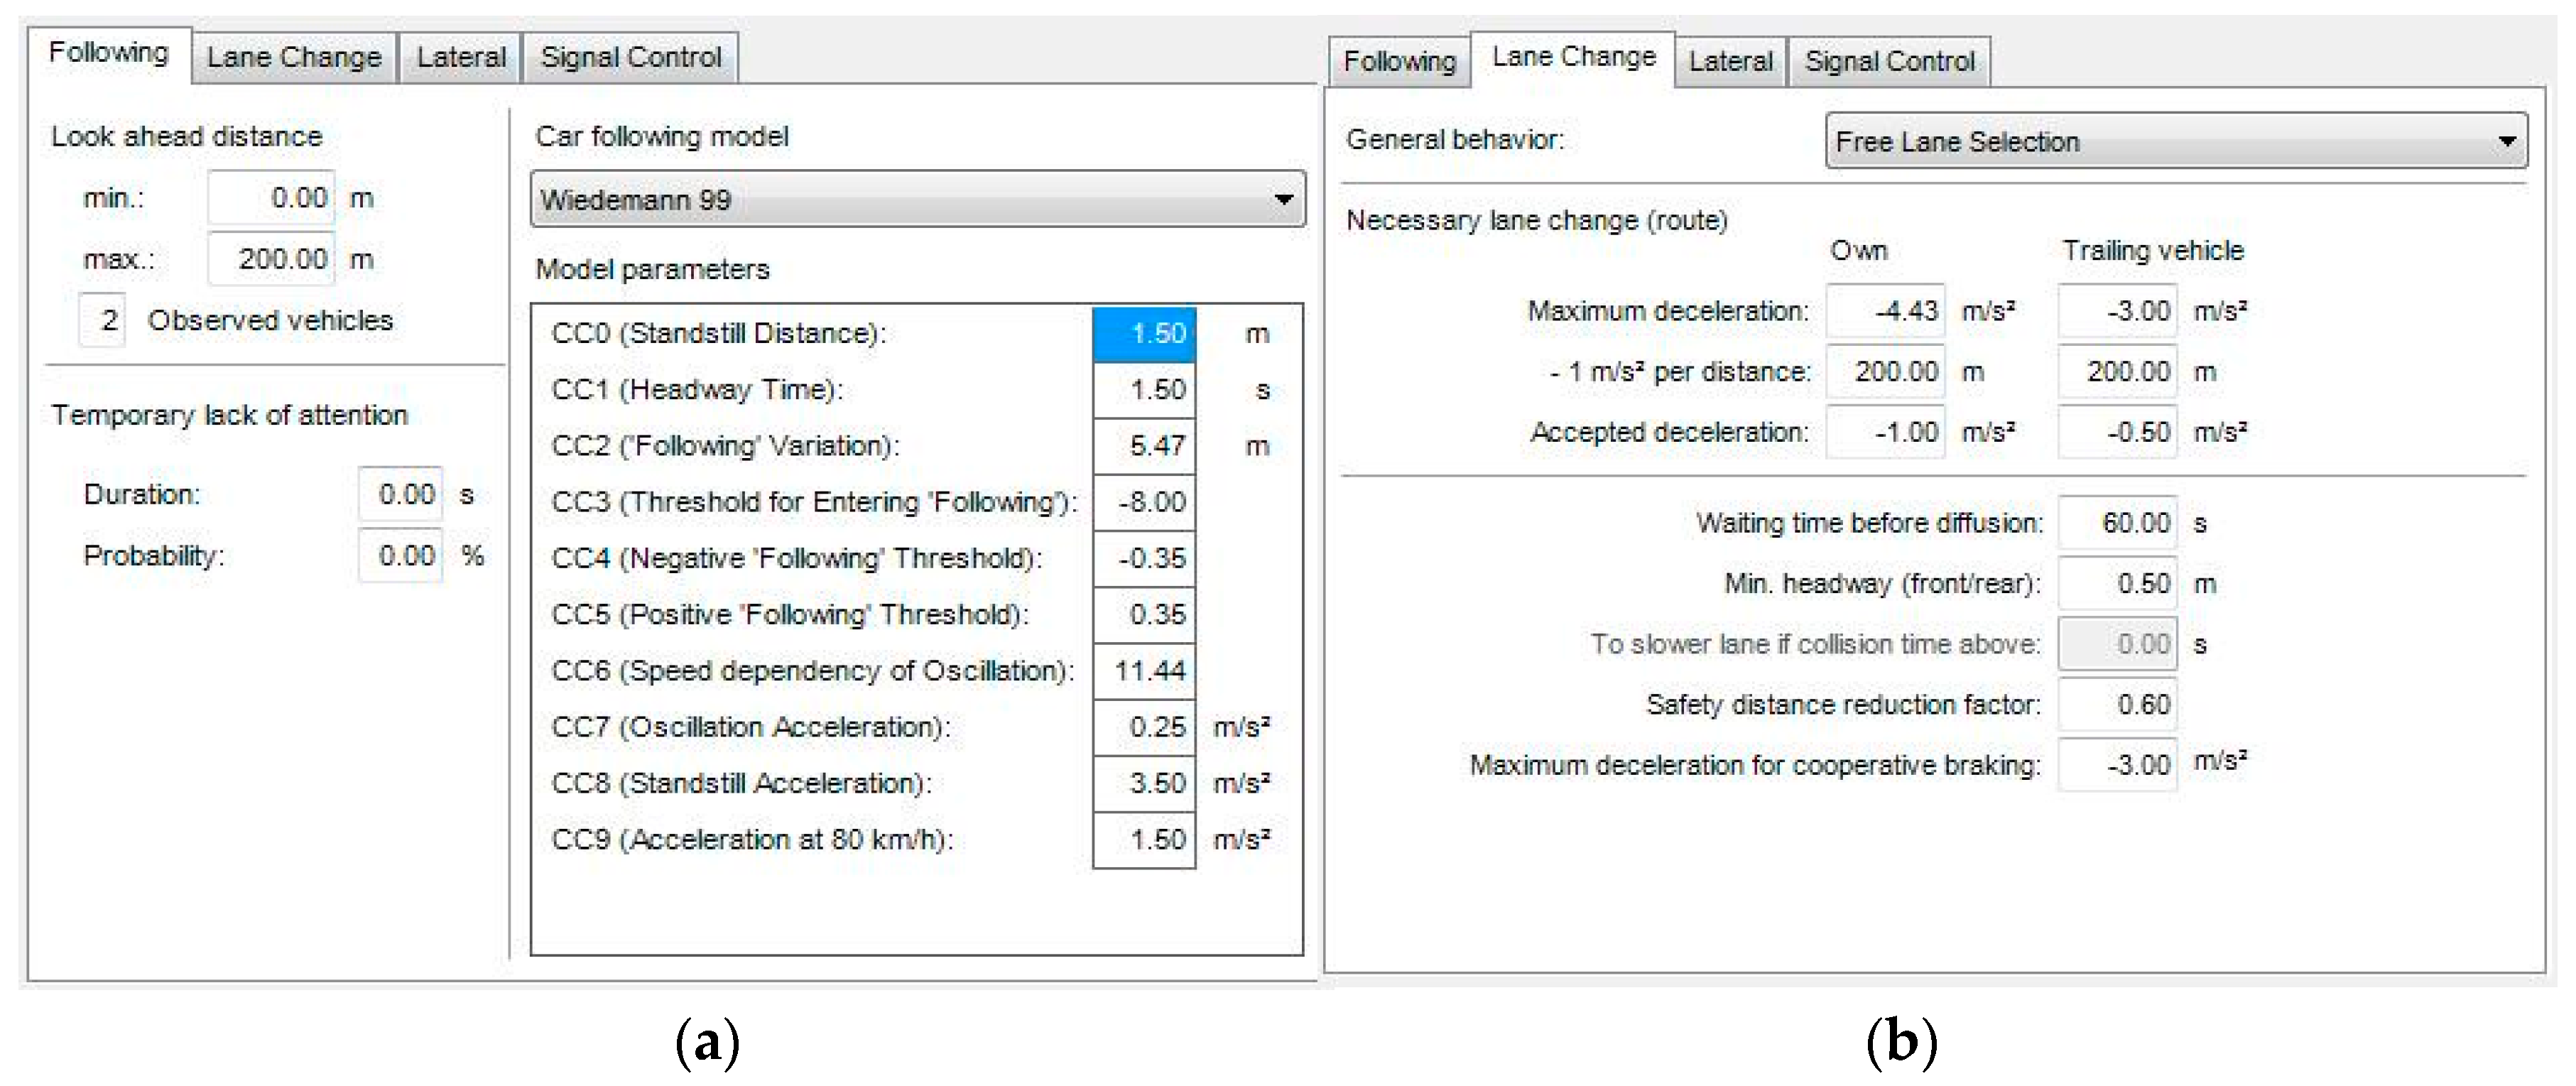
3.2. Simulation Data
3.2.1. Calibration and Validation
Part 1
Part 2
Part 3
3.2.2. Simulation Design
The Range of Variables
Design of Orthogonal Test Table
Independent Variable Correlation
Data Analysis
4. Model
4.1. Establishment of the Model
- HCRI—Hourly conflict risk indexes;
- —Ramp traffic volume, veh/h;
- —Acceleration lane length, m.
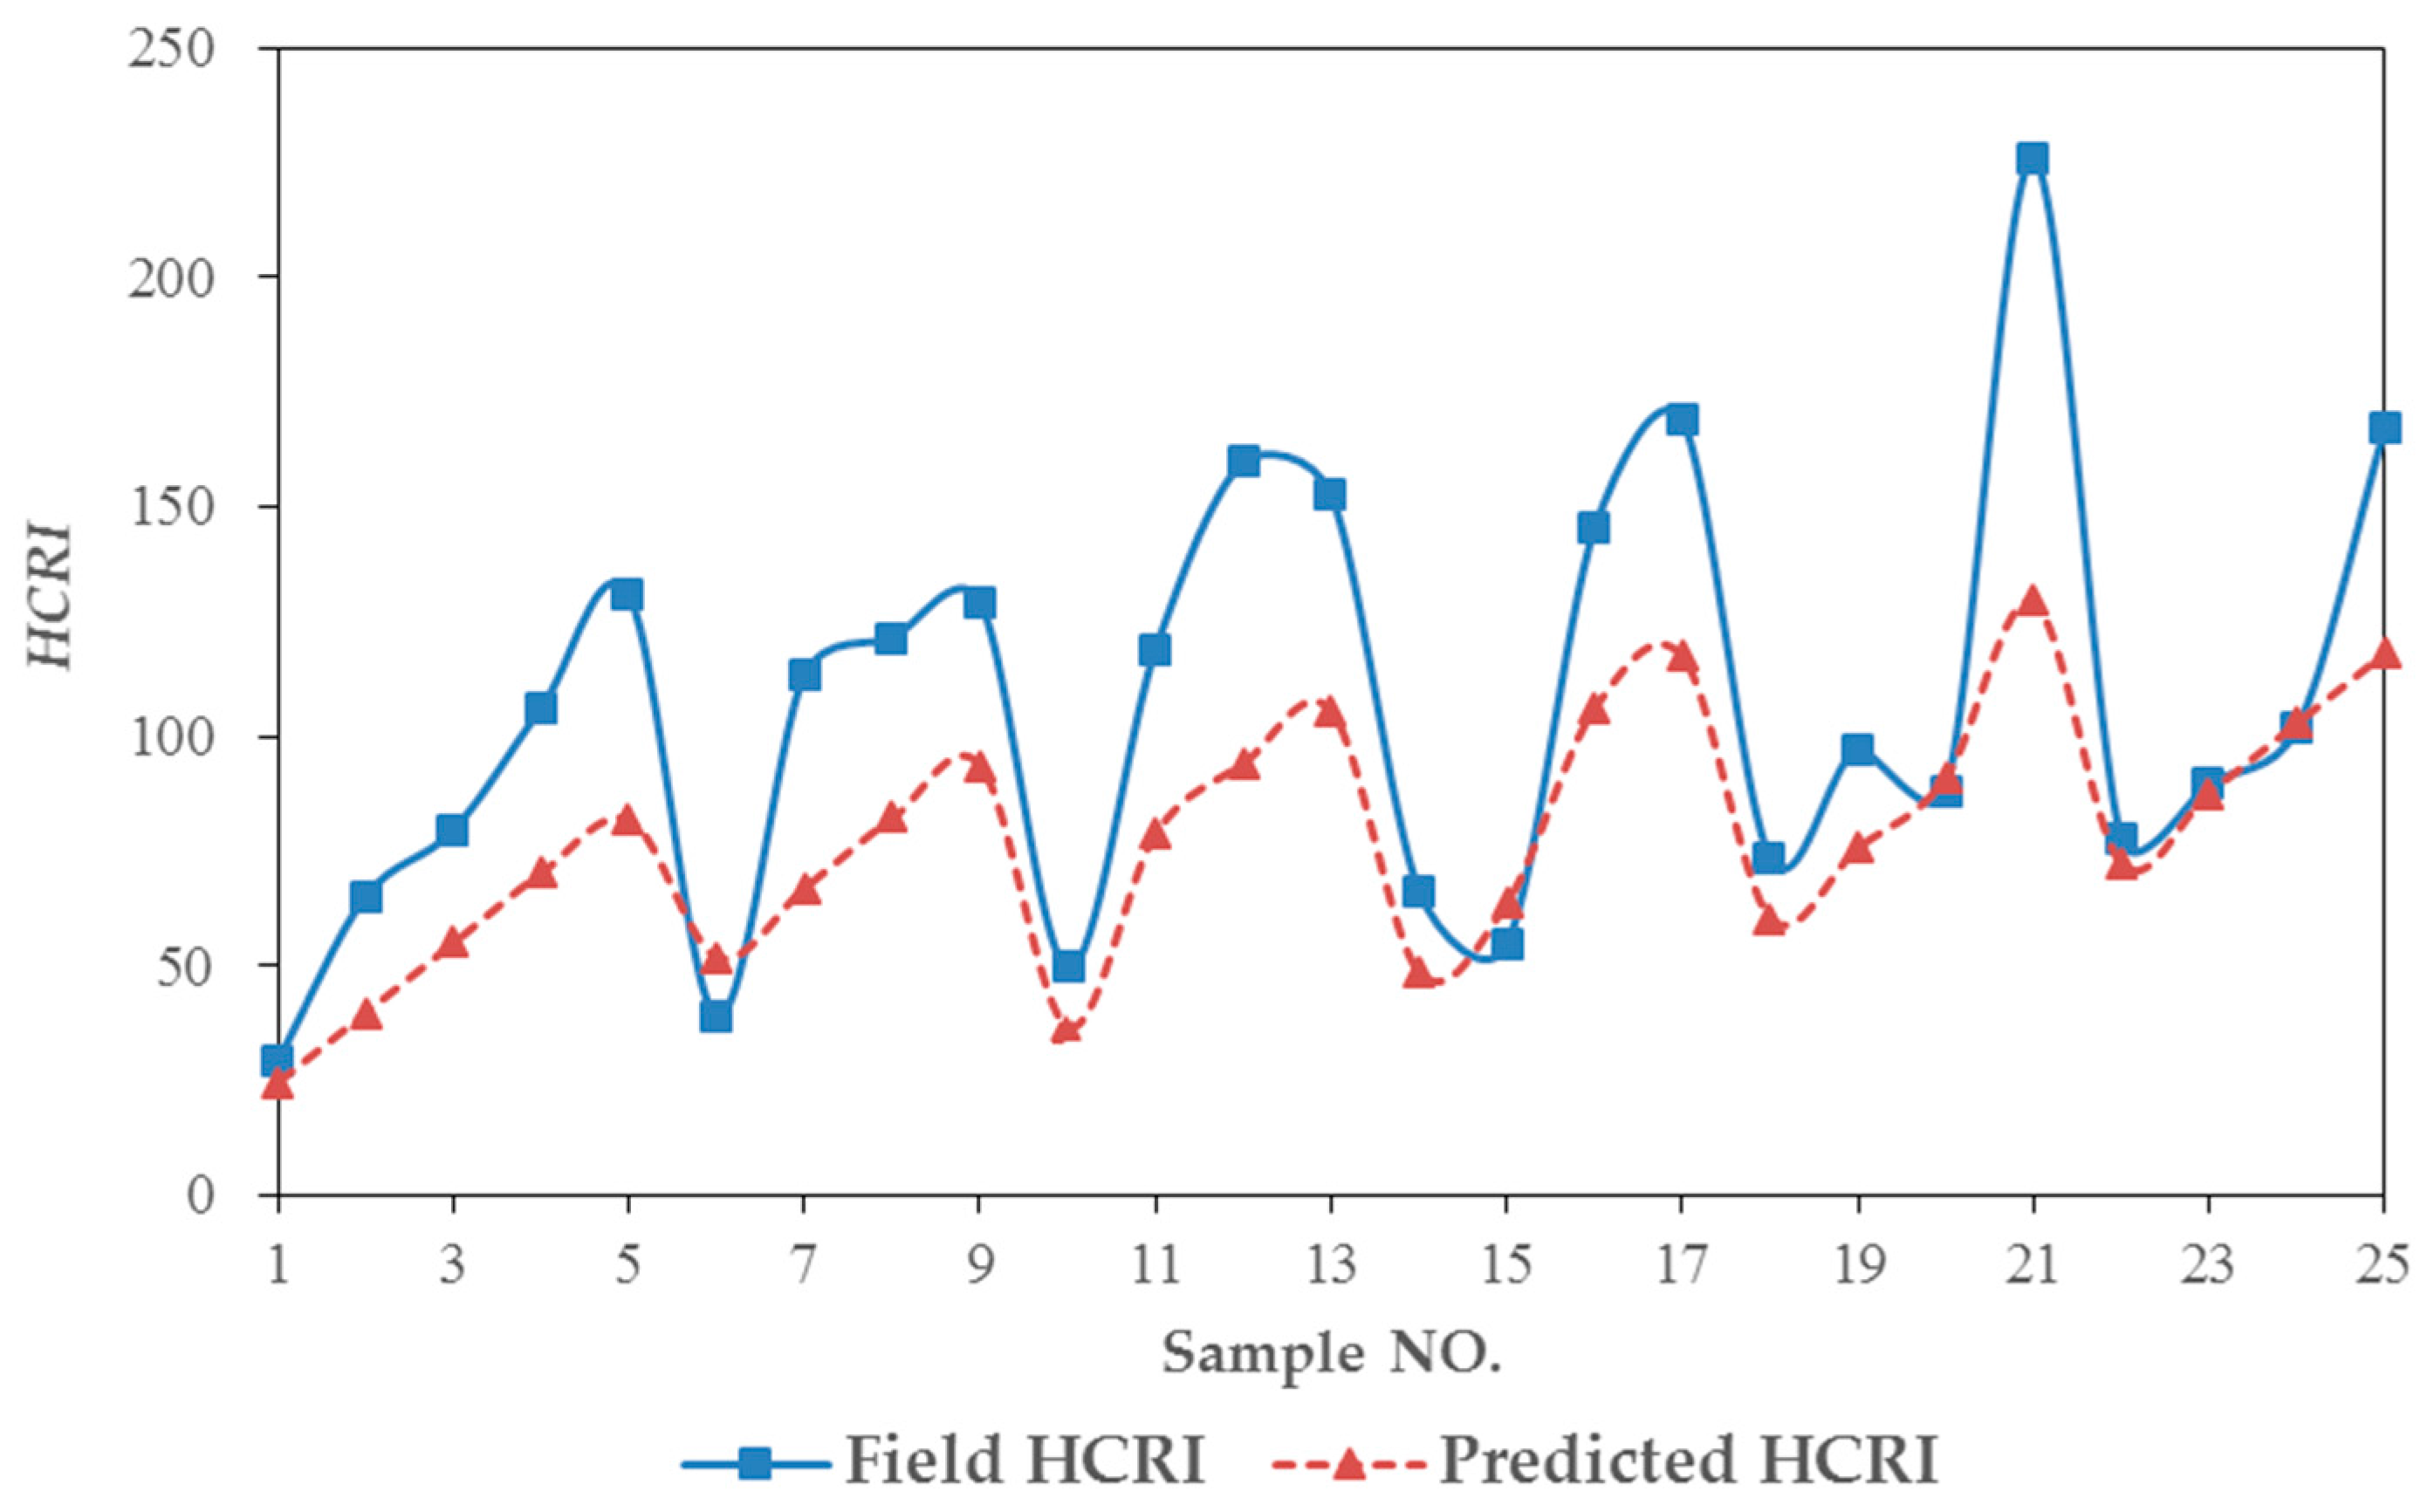
4.2. Model Validation
5. Conclusions
- (1)
- The threshold of serious and general lane-change conflicts lies between 0–2.3 s and 2.3–4.2 s, respectively; the threshold of serious and general rear-end conflicts lies between 0–2.8 s and 2.8–4.7 s, respectively.
- (2)
- The field data was used to calibrate and verify the simulation model. The traffic conflict is 12.032%, which meets the requirements. The fitting degree of the HCRI model is 0.620. The HCRI model can be used as an effective complement to the method of the traffic conflict technique.
- (3)
- The MAPE of the verified model was 25.91%. More models on the HCRI index can be established in the future.
- (4)
- This paper reports the explorative effort on developing a new traffic conflict model using HCRI as an evaluation index. Such a study bears a lot of potential for engineering applications and safety evaluation.
Acknowledgments
Author Contributions
Conflicts of Interest
References
- Haleem, K.; Gan, A.; Lu, J.Y. Using multivariate adaptive regression splines (MARS) to develop crash modification factors for urban freeway interchange influence areas. Accid. Anal. Prev. 2013, 55, 12–21. [Google Scholar] [CrossRef] [PubMed]
- Sarvi, M.; Kuwahara, M. Using ITS to Improve the Capacity of Freeway Merging Sections by Transferring Freight Vehicles. IEEE Trans. Intell. Transp. Syst. 2008, 9, 580–588. [Google Scholar] [CrossRef]
- Leclercq, L.; Knoop, V.L.; Marczak, F.; Hoogendoorn, S.P. Capacity drops at merges: New analytical investigations. Transp. Res. Part C Emerg. Technol. 2016, 62, 171–181. [Google Scholar] [CrossRef]
- Sun, J.; Li, Z.P.; Sun, J. Study on traffic characteristics for a typical expressway on-ramp bottleneck considering various merging behaviors. Physica A 2015, 440, 57–67. [Google Scholar] [CrossRef]
- Li, Z.B.; Liu, P.; Wang, W.; Xu, C.C. Development of control strategy of variable speed limits for improving traffic operations at freeway bottlenecks. J. Cent. South Univ. 2014, 21, 2526–2538. [Google Scholar] [CrossRef]
- Sadia, R.; Polus, A. Interchange Complexity Model and Related Safety Implications. J. Transp. Eng.-ASCE 2013, 139, 458–466. [Google Scholar] [CrossRef]
- Torbic, D.J.; Harwood, D.W.; Gilmore, D.K.; Richard, K.R.; Bared, J.G. Safety Analysis of Interchanges. Transp. Res. Rec. 2009, 2092, 39–47. [Google Scholar] [CrossRef]
- Lu, J.Y.; Haleem, K.; Alluri, P.; Gan, A. Full Versus Simple Safety Performance Functions Comparison Based on Urban Four-Lane Freeway Interchange Influence Areas in Florida. Transp. Res. Rec. 2013, 2398, 83–92. [Google Scholar] [CrossRef]
- AASHTOWare Product, Safety Analyst. Available online: http://www.safetyanalyst.org/index.htm (accessed on 17 November 2016).
- Surrogate Safety Assessment Model (SSAM) 2.16; Federal Highway Administration: Washington, DC, USA, 2008.
- Fan, R.; Yu, H.; Liu, P.; Wang, W. Using VISSIM simulation model and Surrogate Safety Assessment Model for estimating field measured traffic conflicts at freeway merge areas. IET Intell. Transp. Syst. 2013, 7, 68–77. [Google Scholar] [CrossRef]
- VISSIM 4.3; PTV Planung Transport Verkehr AG: Karlsruhe, Germany, 2007.
- Shea, M.S.; Le, T.Q.; Porter, R.J. Combined Crash Frequency-Crash Severity Evaluation of Geometric Design Decisions Entrance-Exit Ramp Spacing and Auxiliary Lane Presence. Transp. Res. Rec. 2015, 2521, 54–63. [Google Scholar] [CrossRef]
- La Torre, F.; Domenichini, L.; Corsi, F.; Fanfani, F. Transferability of the Highway Safety Manual Freeway Model to the Italian Motorway Network. Transp. Res. Rec. 2014, 2435, 61–71. [Google Scholar] [CrossRef]
- Kuang, Y.; Qu, X.B.; Wang, S.A. A tree-structured crash surrogate measure for freeways. Accid. Anal. Prev. 2015, 77, 137–148. [Google Scholar] [CrossRef] [PubMed]
- Qu, X.B.; Jin, S.; Weng, J.X. Analysis of the relationship between aggregated traffic volume and traffic conflicts on expressways. Transportmetrica A 2015, 11, 648–658. [Google Scholar] [CrossRef]
- Yuan, L.; Yuan, H.W.; Ma, Y.F.; Ren, Y.W. Development of a Safety Evaluation Model for Provincial Highway. Discret. Dyn. Nat. Soc. 2014, 2014, 10. [Google Scholar] [CrossRef]
- So, J.; Lim, I.K.; Kweon, Y.J. Exploring Traffic Conflict-Based Surrogate Approach for Safety Assessment of Highway Facilities. Transp. Res. Rec. 2015, 2513, 56–62. [Google Scholar] [CrossRef]
- Pan, F.Q.; Zhang, L.X.; Lu, J.; Zhao, J.J.; Wang, F.Y. A Method for Determining the Number of Traffic Conflict Points Between Vehicles at MajorMinor Highway Intersections. Traffic Inj. Prev. 2013, 14, 424–433. [Google Scholar] [CrossRef] [PubMed]
- Qu, X.B.; Yang, Y.; Liu, Z.Y.; Jin, S.; Weng, J.X. Potential crash risks of expressway on-ramps and off-ramps: A case study in Beijing, China. Saf. Sci. 2014, 70, 58–62. [Google Scholar] [CrossRef]
- Lu, J.J.; Chen, S.D.; Ge, X.; Pan, F.Q. A programmable calculation procedure for number of traffic conflict points at highway intersections. J. Adv. Transp. 2013, 47, 692–703. [Google Scholar] [CrossRef]
- Xiang, Q.; Lu, C.; Wu, Q.; Lu, J.; Ma, Y. Research on Traffic Conflict Prediction Model of Unsignalized Highway Intersection. J. Highw. Transp. Res. Dev. 2009, 26, 132–135. [Google Scholar]
- Zheng, L.; Ismail, K.; Meng, X. Freeway safety estimation using extreme value theory approaches: A comparative study. Accid. Anal. Prev. 2014, 62, 32–41. [Google Scholar] [CrossRef] [PubMed]
- Wang, C.; Stamatiadis, N. Surrogate Safety Measure for Simulation-Based Conflict Study. Transp. Res. Rec. 2013, 2386, 72–80. [Google Scholar] [CrossRef]
- Guo, Y.Y.; Sayed, T.; Zaki, M.H.; Liu, P. Safety evaluation of unconventional outside left-turn lane using automated traffic conflict techniques. Can. J. Civ. Eng. 2016, 43, 631–642. [Google Scholar] [CrossRef]
- Li, H.; Chu, D.; Xie, F.; Yue, Z.; Huang, Z. Statistical Analysis of Car Crash on Freeways Based on K-means Clustering. CSSJ 2013, 23, 91–96. [Google Scholar]
- Wang, W. Traffic Engineering, 2nd ed.; Southeast University Press: Nangjing, China, 2011; p. 216. [Google Scholar]
- Wang, J.F.; Wang, Y.H.; Bi, C.F.; Weng, J.X.; Yan, X.D. Modeling the probability of freeway lane-changing collision occurrence considering intervehicle interaction. Traffic Inj. Prev. 2016, 17, 181–187. [Google Scholar] [CrossRef] [PubMed]
- Moon, J.P.; Hummer, J.E.; Van Duyn, M.H. Saving Space in a Dense City: When Designers Should Consider the New Nano-Interchange. KSCE J. Civ. Eng. 2011, 15, 1101–1108. [Google Scholar] [CrossRef]
- Ministry of Transport of the People’s Republic of China (MOT). Guidlines for Design of Highway Grade-Separated Intersection; JTGT D21-2014; MOT: Beijing, China, 2014.
- Tracker 4.95. Available online: http://physlets.org/tracker/ (accessed on 17 November 2016).
- Zhang, Q. Calibration of Vissim Microscopic Traffic Simulation Model. Master’s Thesis, Beijing Jiaotong University, Beijing, China, June 2012. [Google Scholar]


| Total No. | Accident Type | Total Loss | Average Loss | Weight |
|---|---|---|---|---|
| 92 | Rear-end | 820,000 | 8913.04 | 0.54 |
| 90 | Lane-change | 675,000 | 7500.00 | 0.46 |
| Conflict Type | Rear-End Conflict | Lane-Change Conflict | ||
|---|---|---|---|---|
| Serious (S) | General (G) | Serious (S) | General (G) | |
| TTC average value | 2.4 | 3.9 | 1.8 | 3.3 |
| Severity Weight | 0.62 | 0.38 | 0.65 | 0.35 |
| Conflict Type | Rear End | Lane-Change | ||
|---|---|---|---|---|
| Serious Conflict | General Conflict | Serious Conflict | General Conflict | |
| Threshold (TTC/s) | 0–2.8 | 2.8–4.7 | 0–2.3 | 2.3–4.2 |
| Validation Sets | Travel Time | The Number of Conflicts | ||||
|---|---|---|---|---|---|---|
| Observed | Simulated | Observed | Simulated | |||
| 1 | 11.4 | 11.2 | 1.754% | 72 | 65 | 9.722% |
| 2 | 10.3 | 10.5 | 1.942% | 94 | 85 | 9.574% |
| 3 | 10.8 | 11 | 1.852% | 35 | 41 | 17.143% |
| 4 | 9.6 | 10.1 | 5.208% | 35 | 40 | 14.286% |
| 5 | 10.1 | 10.6 | 4.950% | 53 | 58 | 9.434% |
| Average | 10.44 | 10.68 | 3.141% | 57.8 | 57.8 | 12.032% |
| No. | X1 (veh/h) | X2 (veh/h) | X3 (m) | X4 (%) | X5 (%) | X6 (km/h) |
|---|---|---|---|---|---|---|
| Mean | 865 | 1250 | 180 | 0.07 | 0.26 | 62.54 |
| Std. deviation | 155 | 245 | 45 | 0.02 | 0.13 | 13.25 |
| No. | X1 (veh/h) | X2 (veh/h) | X3 (m) | X4 (%) | X5 (%) | X6 (km/h) |
|---|---|---|---|---|---|---|
| 1 | 500 | 1000 | 150 | 0.02 | 0.05 | 40 |
| 2 | 600 | 1100 | 180 | 0.04 | 0.10 | 48 |
| 3 | 700 | 1200 | 210 | 0.06 | 0.20 | 56 |
| 4 | 800 | 1300 | 240 | 0.08 | 0.30 | 64 |
| 5 | 900 | 1400 | 270 | 0.10 | 0.40 | 72 |
| 6 | 1000 | 1500 | 300 | 0.12 | 0.50 | 80 |
| Variable | X1 | X2 | X3 | X4 | X5 | X6 |
|---|---|---|---|---|---|---|
| X1 | 1.0000 | |||||
| X2 | −0.0397 | 1.0000 | ||||
| X3 | 0.0000 | −0.0079 | 1.0000 | |||
| X4 | −0.0000 | 0.0238 | 0.0000 | 1.0000 | ||
| X5 | −0.0000 | 0.0241 | −0.0000 | −0.0000 | 1.0000 | |
| X6 | 0.0000 | −0.0397 | 0.0000 | 0.0000 | 0.0000 | 1.0000 |
| Evalution Index | Maximum | Minimum | Mean | Std. Deviation |
|---|---|---|---|---|
| HCRI | 147.953 | 3.095 | 71.137 | 35.980 |
| HCR | 0.329 | 0.008 | 0.162 | 0.079 |
| Variable | HCR | HCRI | ||||
|---|---|---|---|---|---|---|
| Coef. | Std. Err. | p > |t| | Coef. | Std. Err. | p > |t| | |
| X1 | 0.000227 | 0.000030 | 0.000 | 0.120002 | 0.012565 | 0.000 |
| X2 | −0.000026 | 0.000030 | 0.396 | 0.016022 | 0.012587 | 0.206 |
| X3 | 0.000838 | 0.000100 | 0.000 | 0.381452 | 0.041851 | 0.000 |
| X4 | −0.090874 | 0.150695 | 0.548 | −49.579750 | 62.791880 | 0.432 |
| X5 | 0.060689 | 0.032330 | 0.063 | 23.210860 | 13.471470 | 0.088 |
| X6 | −0.000608 | 0.000377 | 0.110 | −0.215238 | 0.157059 | 0.174 |
| _cons | −0.137401 | 0.057390 | 0.019 | −114.403800 | 23.913310 | 0.000 |
| R-squared | 0.5450 | 0.620 | ||||
| Root MSE | 0.05348 | 22.283 | ||||
| HCRI | Removing X2, X4, X6 | Removing X2, X4, X6, X5 | ||||
|---|---|---|---|---|---|---|
| Coef. | Std. Err. | p > |t| | Coef. | Std. Err. | p > |t| | |
| X1 | 0.119367 | 0.012628 | 0.000 | 0.119366 | 0.012750 | 0.000 |
| X3 | 0.381029 | 0.042094 | 0.000 | 0.381029 | 0.042501 | 0.000 |
| X5 | 23.625440 | 13.54627 | 0.084 | |||
| _cons | −110.2217 | 14.01081 | 0.000 | −104.1185 | 13.69801 | 0.000 |
| R-squared | 0.6156 | 0.6081 | ||||
| MSE | 22.413 | 22.63 | ||||
| Validation Dataset | Maximum | Minimum | Mean | Std. Deviation | RMSE | MAPE |
|---|---|---|---|---|---|---|
| Field HCRI | 225.70 | 29.28 | 106.08 | 46.90 | 38.27 | 25.91% |
| Predicted HCRI | 129.56 | 24.66 | 78.25 | 27.11 |
© 2016 by the authors; licensee MDPI, Basel, Switzerland. This article is an open access article distributed under the terms and conditions of the Creative Commons Attribution (CC-BY) license (http://creativecommons.org/licenses/by/4.0/).
Share and Cite
Li, S.; Xiang, Q.; Ma, Y.; Gu, X.; Li, H. Crash Risk Prediction Modeling Based on the Traffic Conflict Technique and a Microscopic Simulation for Freeway Interchange Merging Areas. Int. J. Environ. Res. Public Health 2016, 13, 1157. https://doi.org/10.3390/ijerph13111157
Li S, Xiang Q, Ma Y, Gu X, Li H. Crash Risk Prediction Modeling Based on the Traffic Conflict Technique and a Microscopic Simulation for Freeway Interchange Merging Areas. International Journal of Environmental Research and Public Health. 2016; 13(11):1157. https://doi.org/10.3390/ijerph13111157
Chicago/Turabian StyleLi, Shen, Qiaojun Xiang, Yongfeng Ma, Xin Gu, and Han Li. 2016. "Crash Risk Prediction Modeling Based on the Traffic Conflict Technique and a Microscopic Simulation for Freeway Interchange Merging Areas" International Journal of Environmental Research and Public Health 13, no. 11: 1157. https://doi.org/10.3390/ijerph13111157