
Identifying Spatial Clusters of Schistosomiasis in Anhui Province of China: A Study from the Perspective of Application

Abstract
:1. Introduction
2. Experimental Section
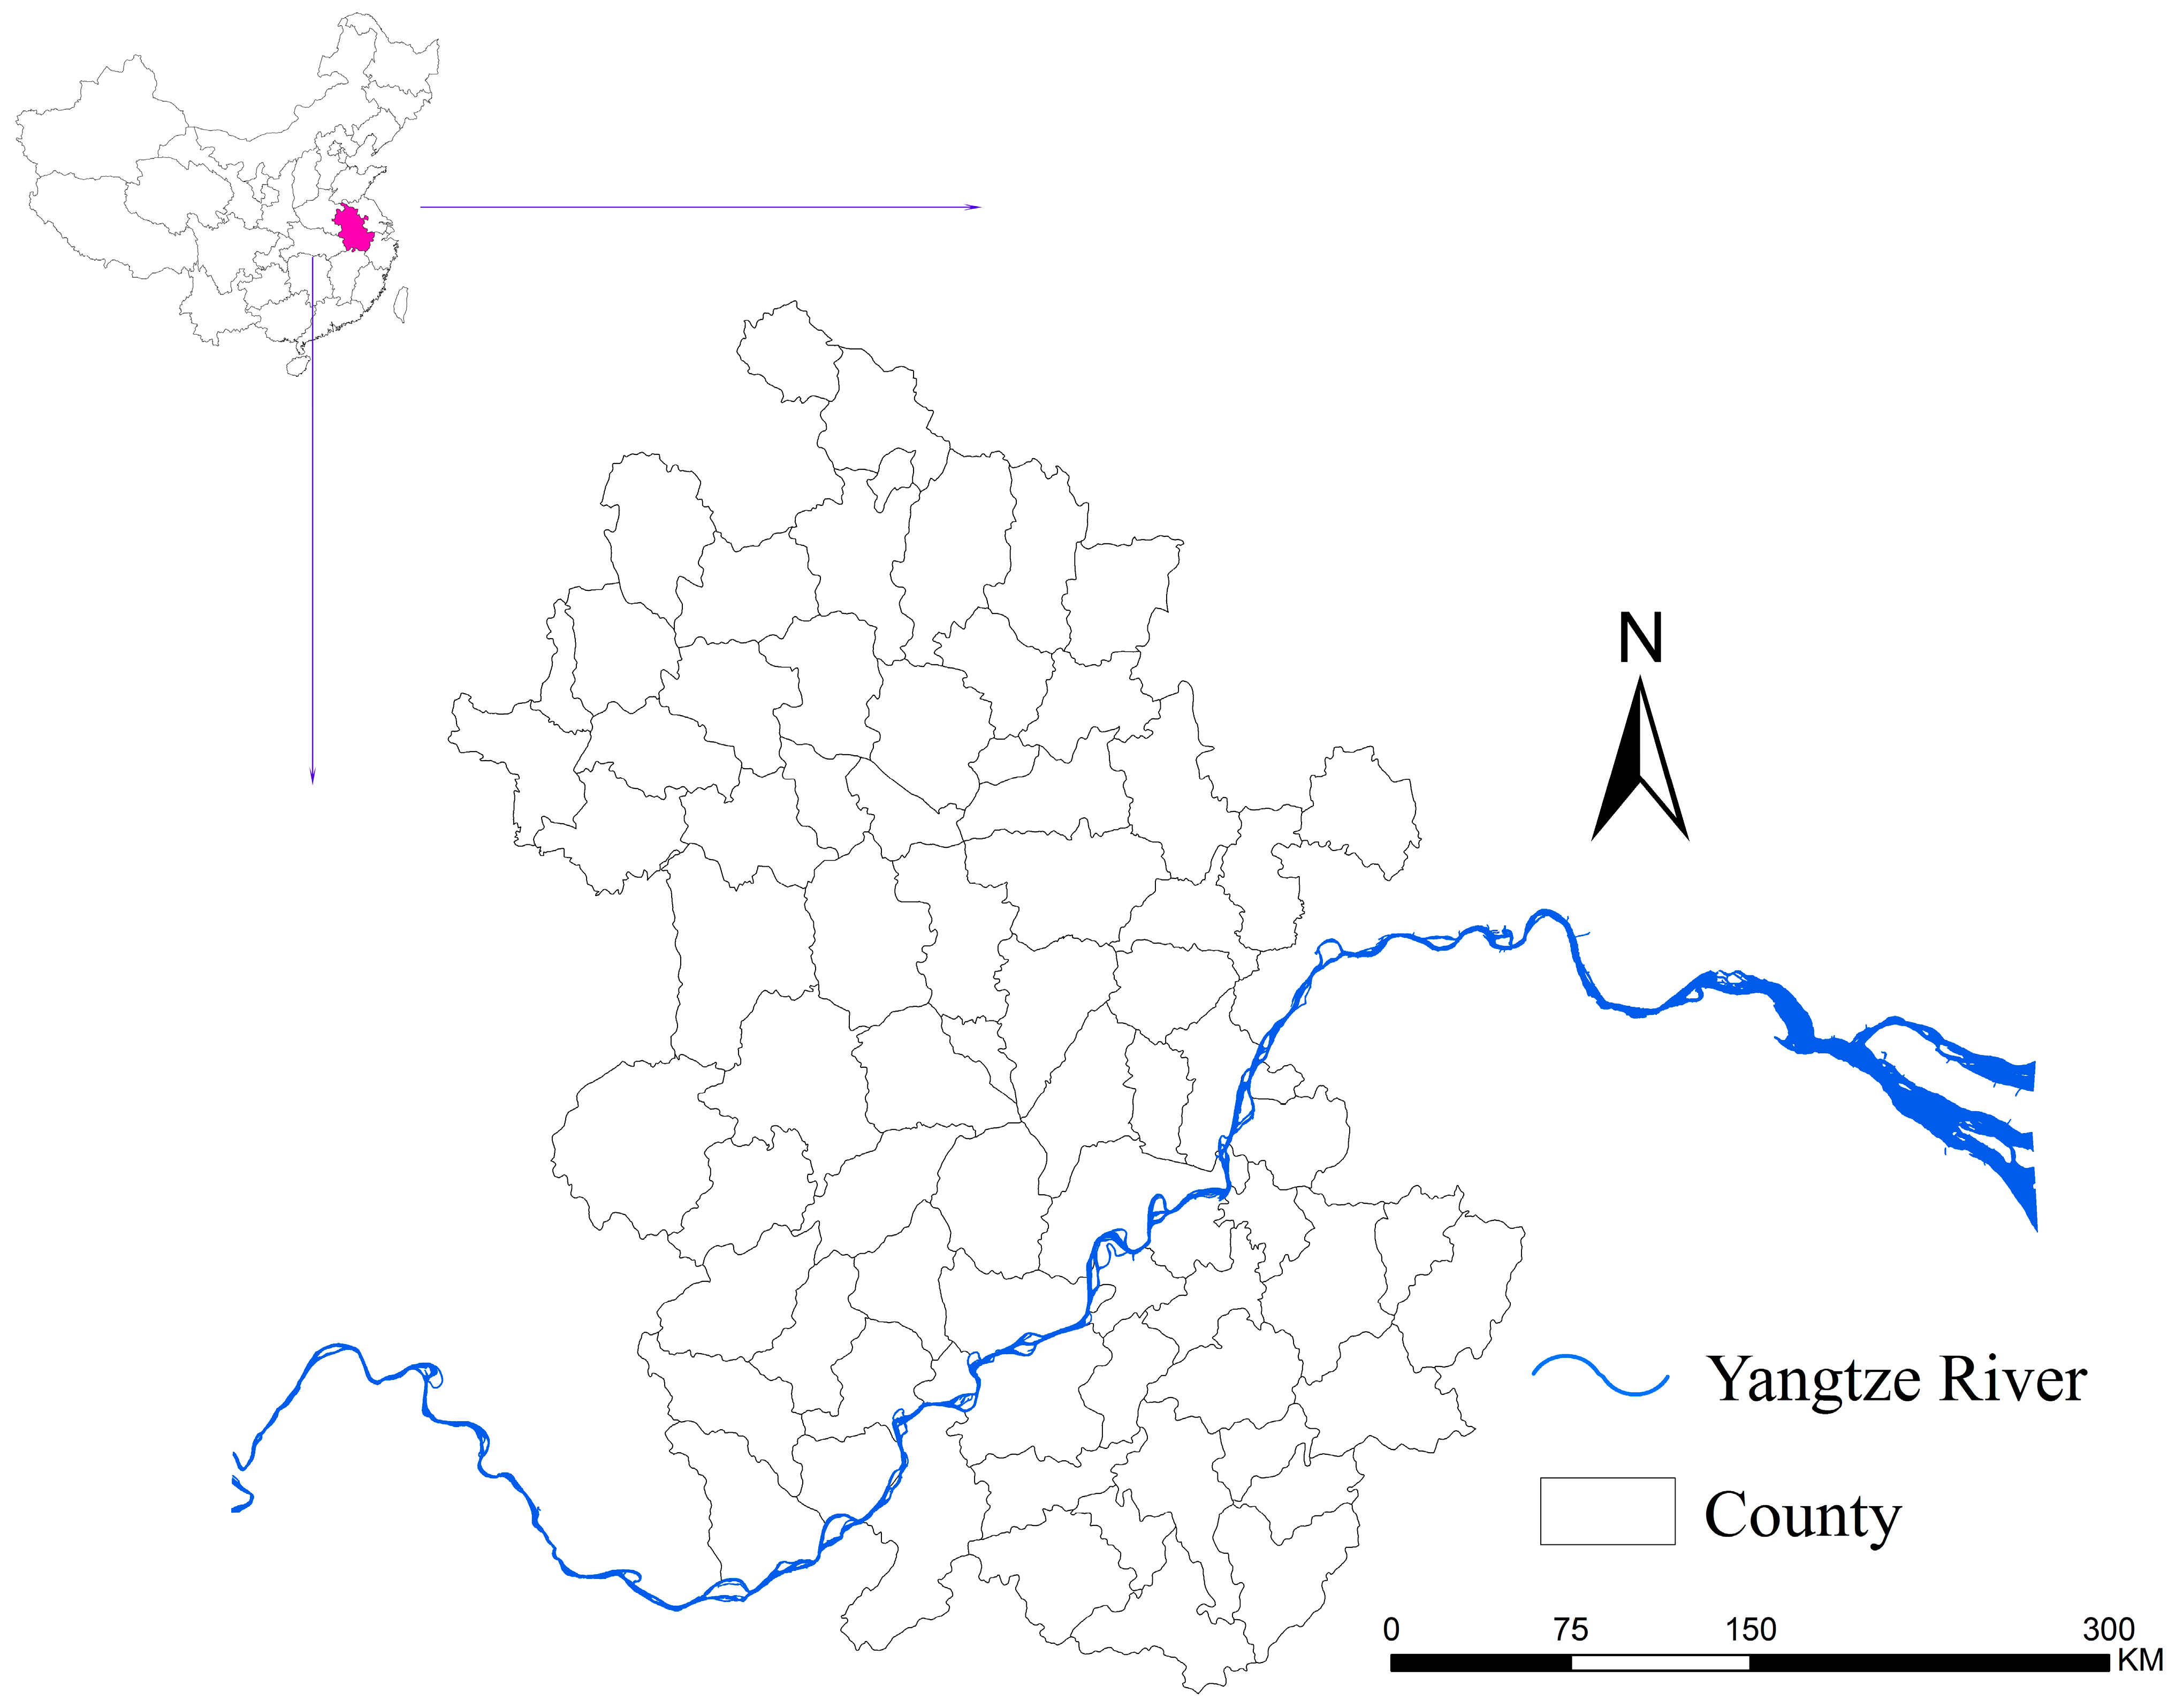
2.1. Study Area

2.2. Schistosomiasis Prevalence Data
2.3. Ethics Statement
2.4. Statistical Analysis
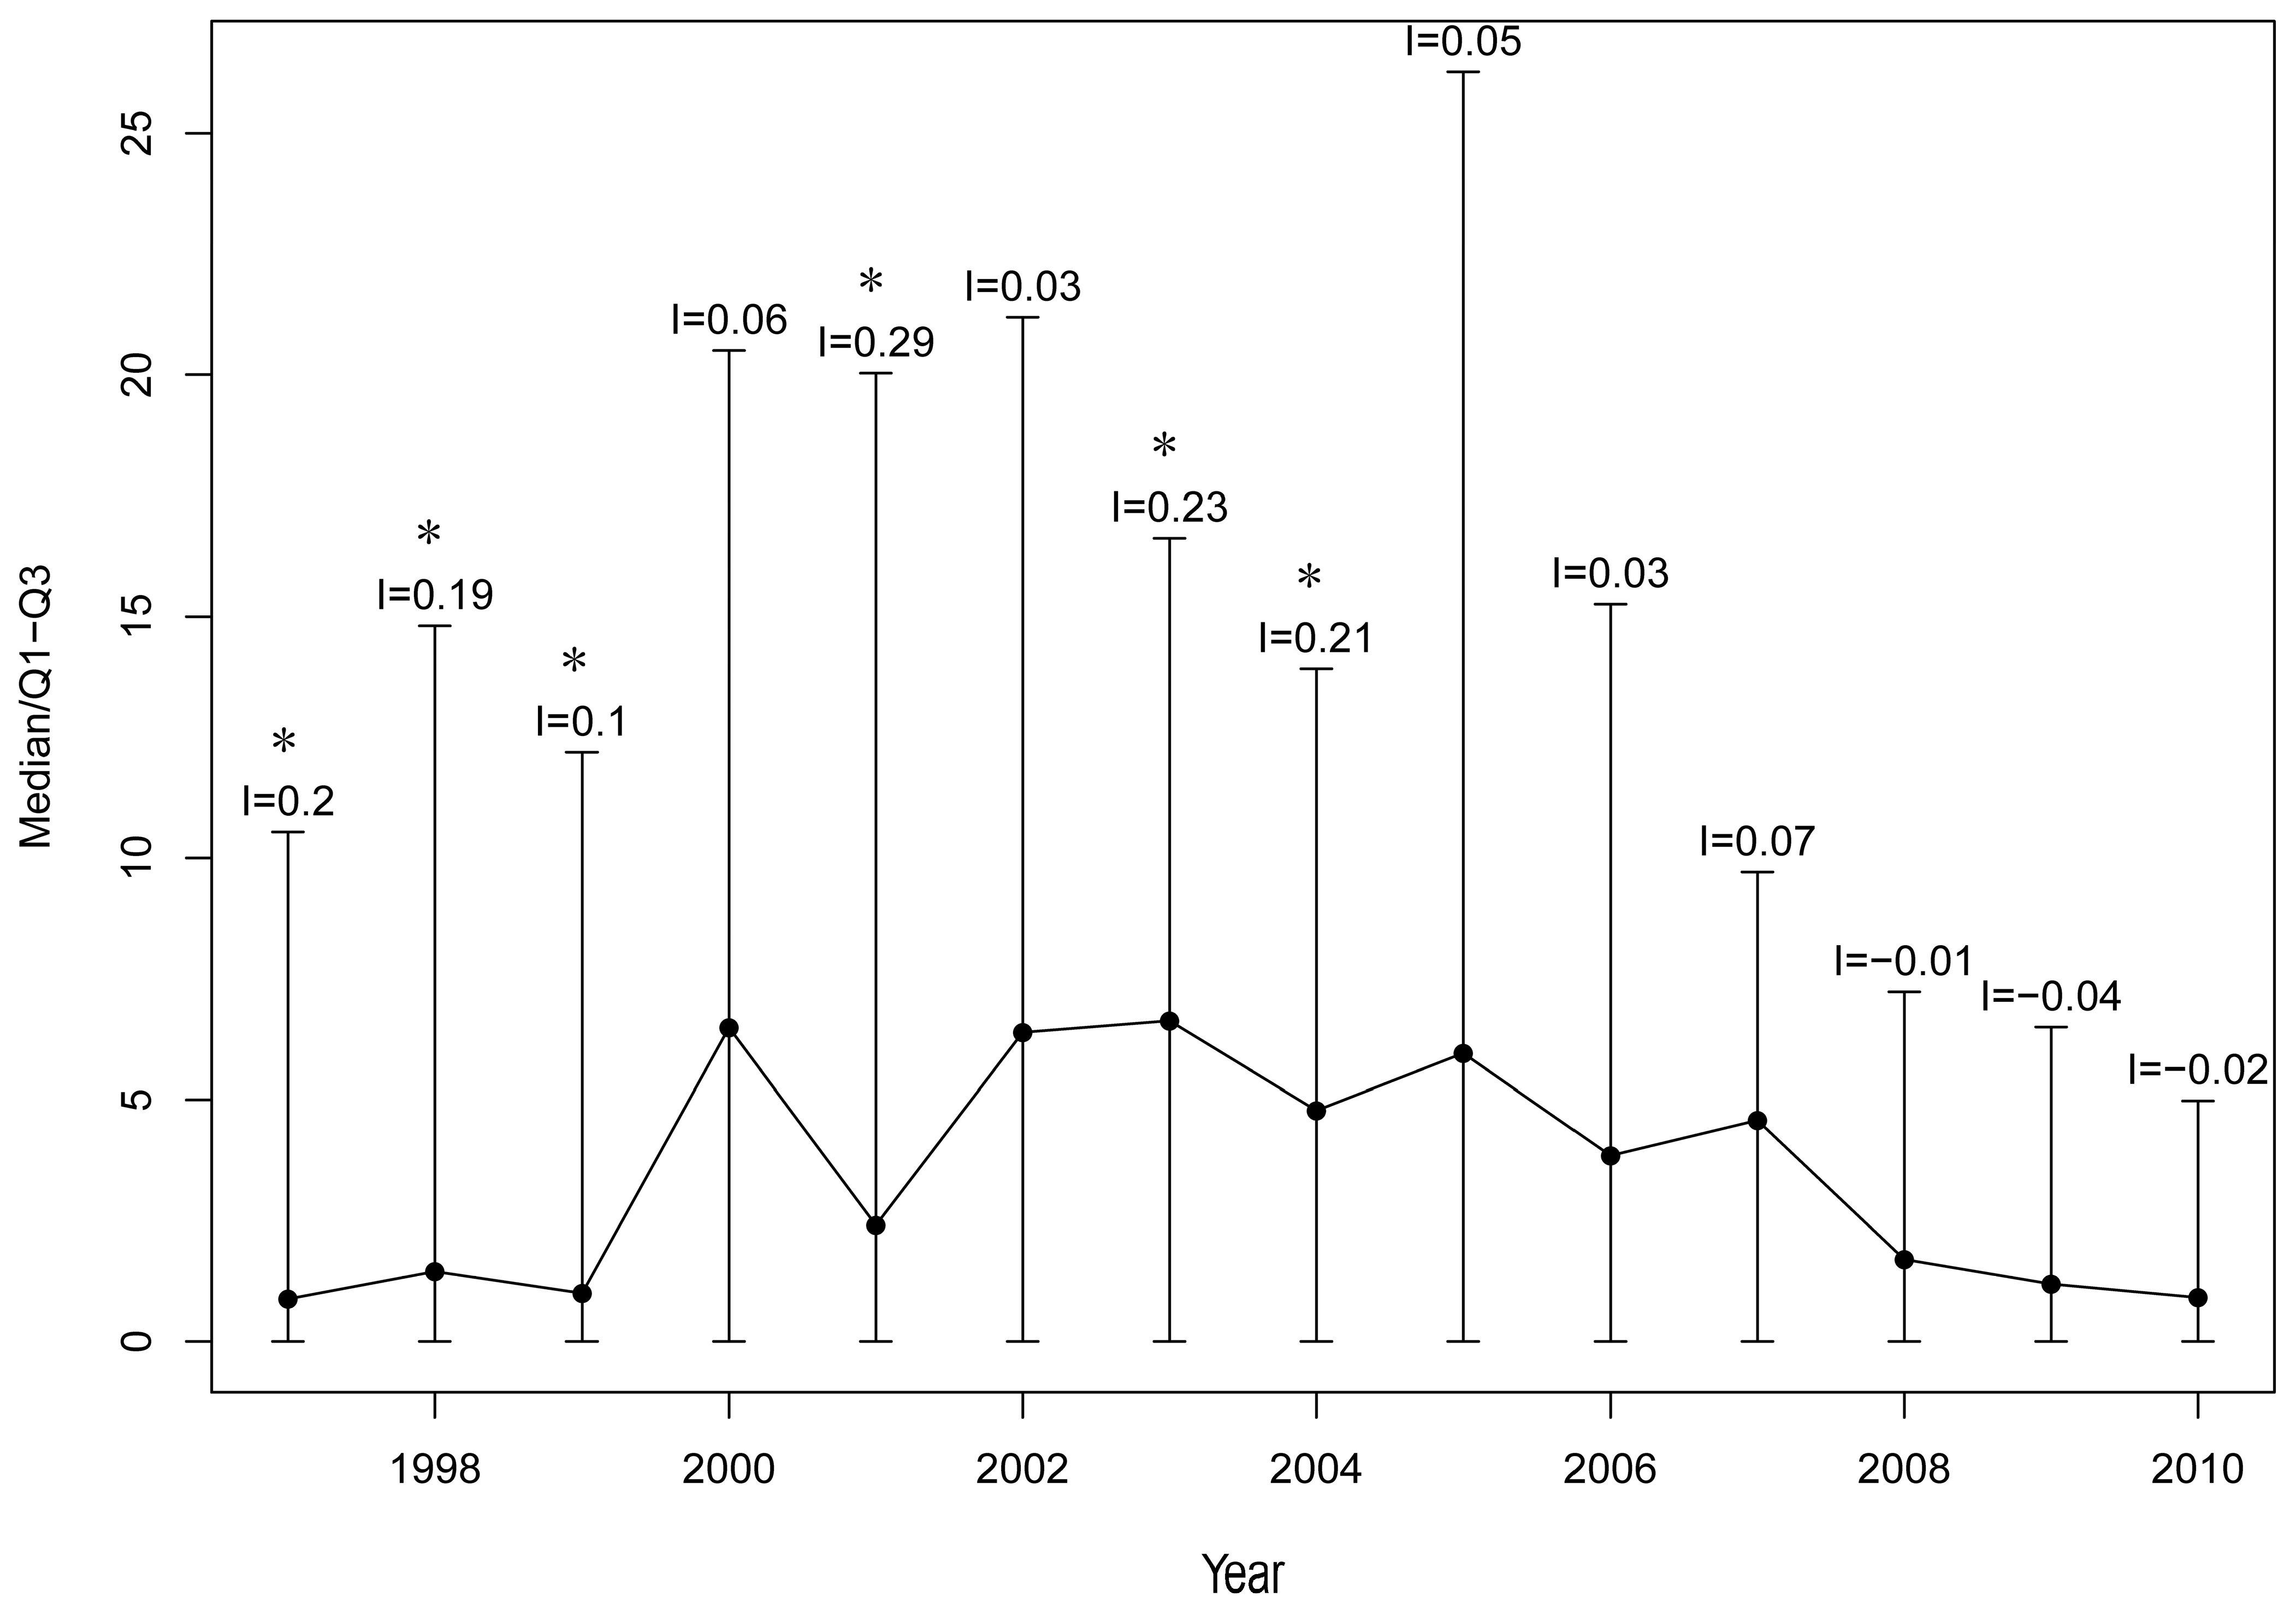
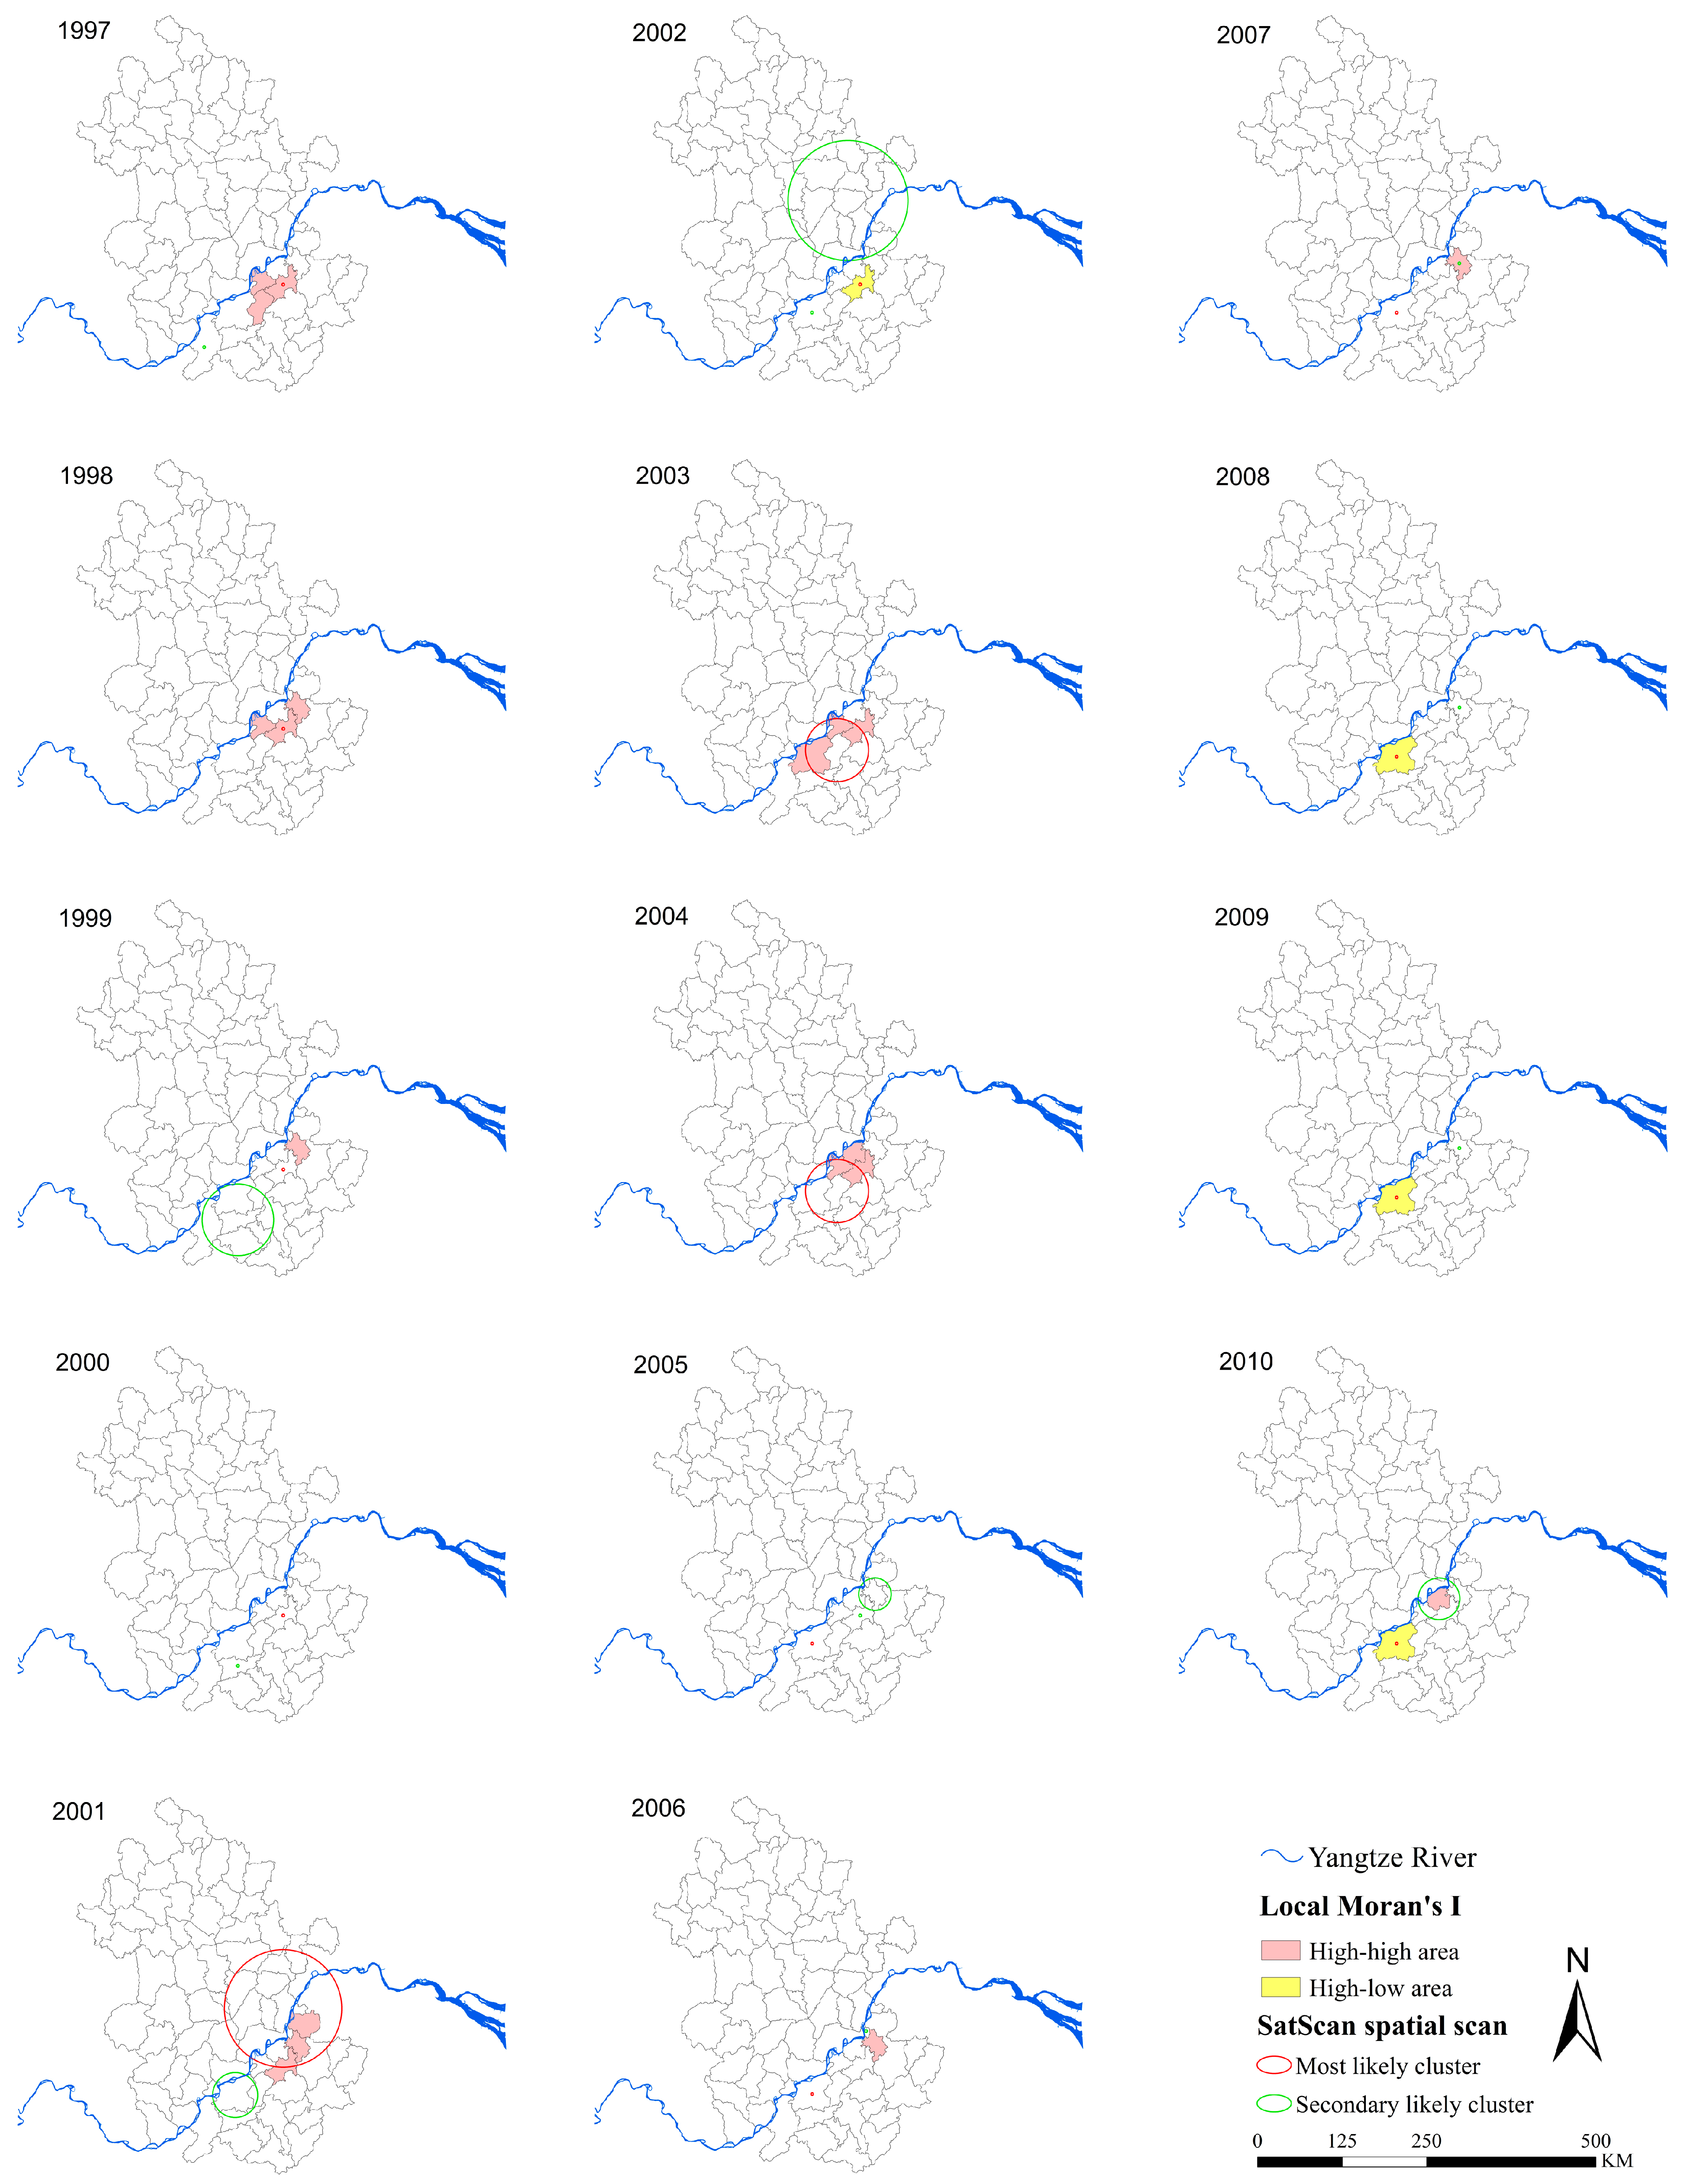
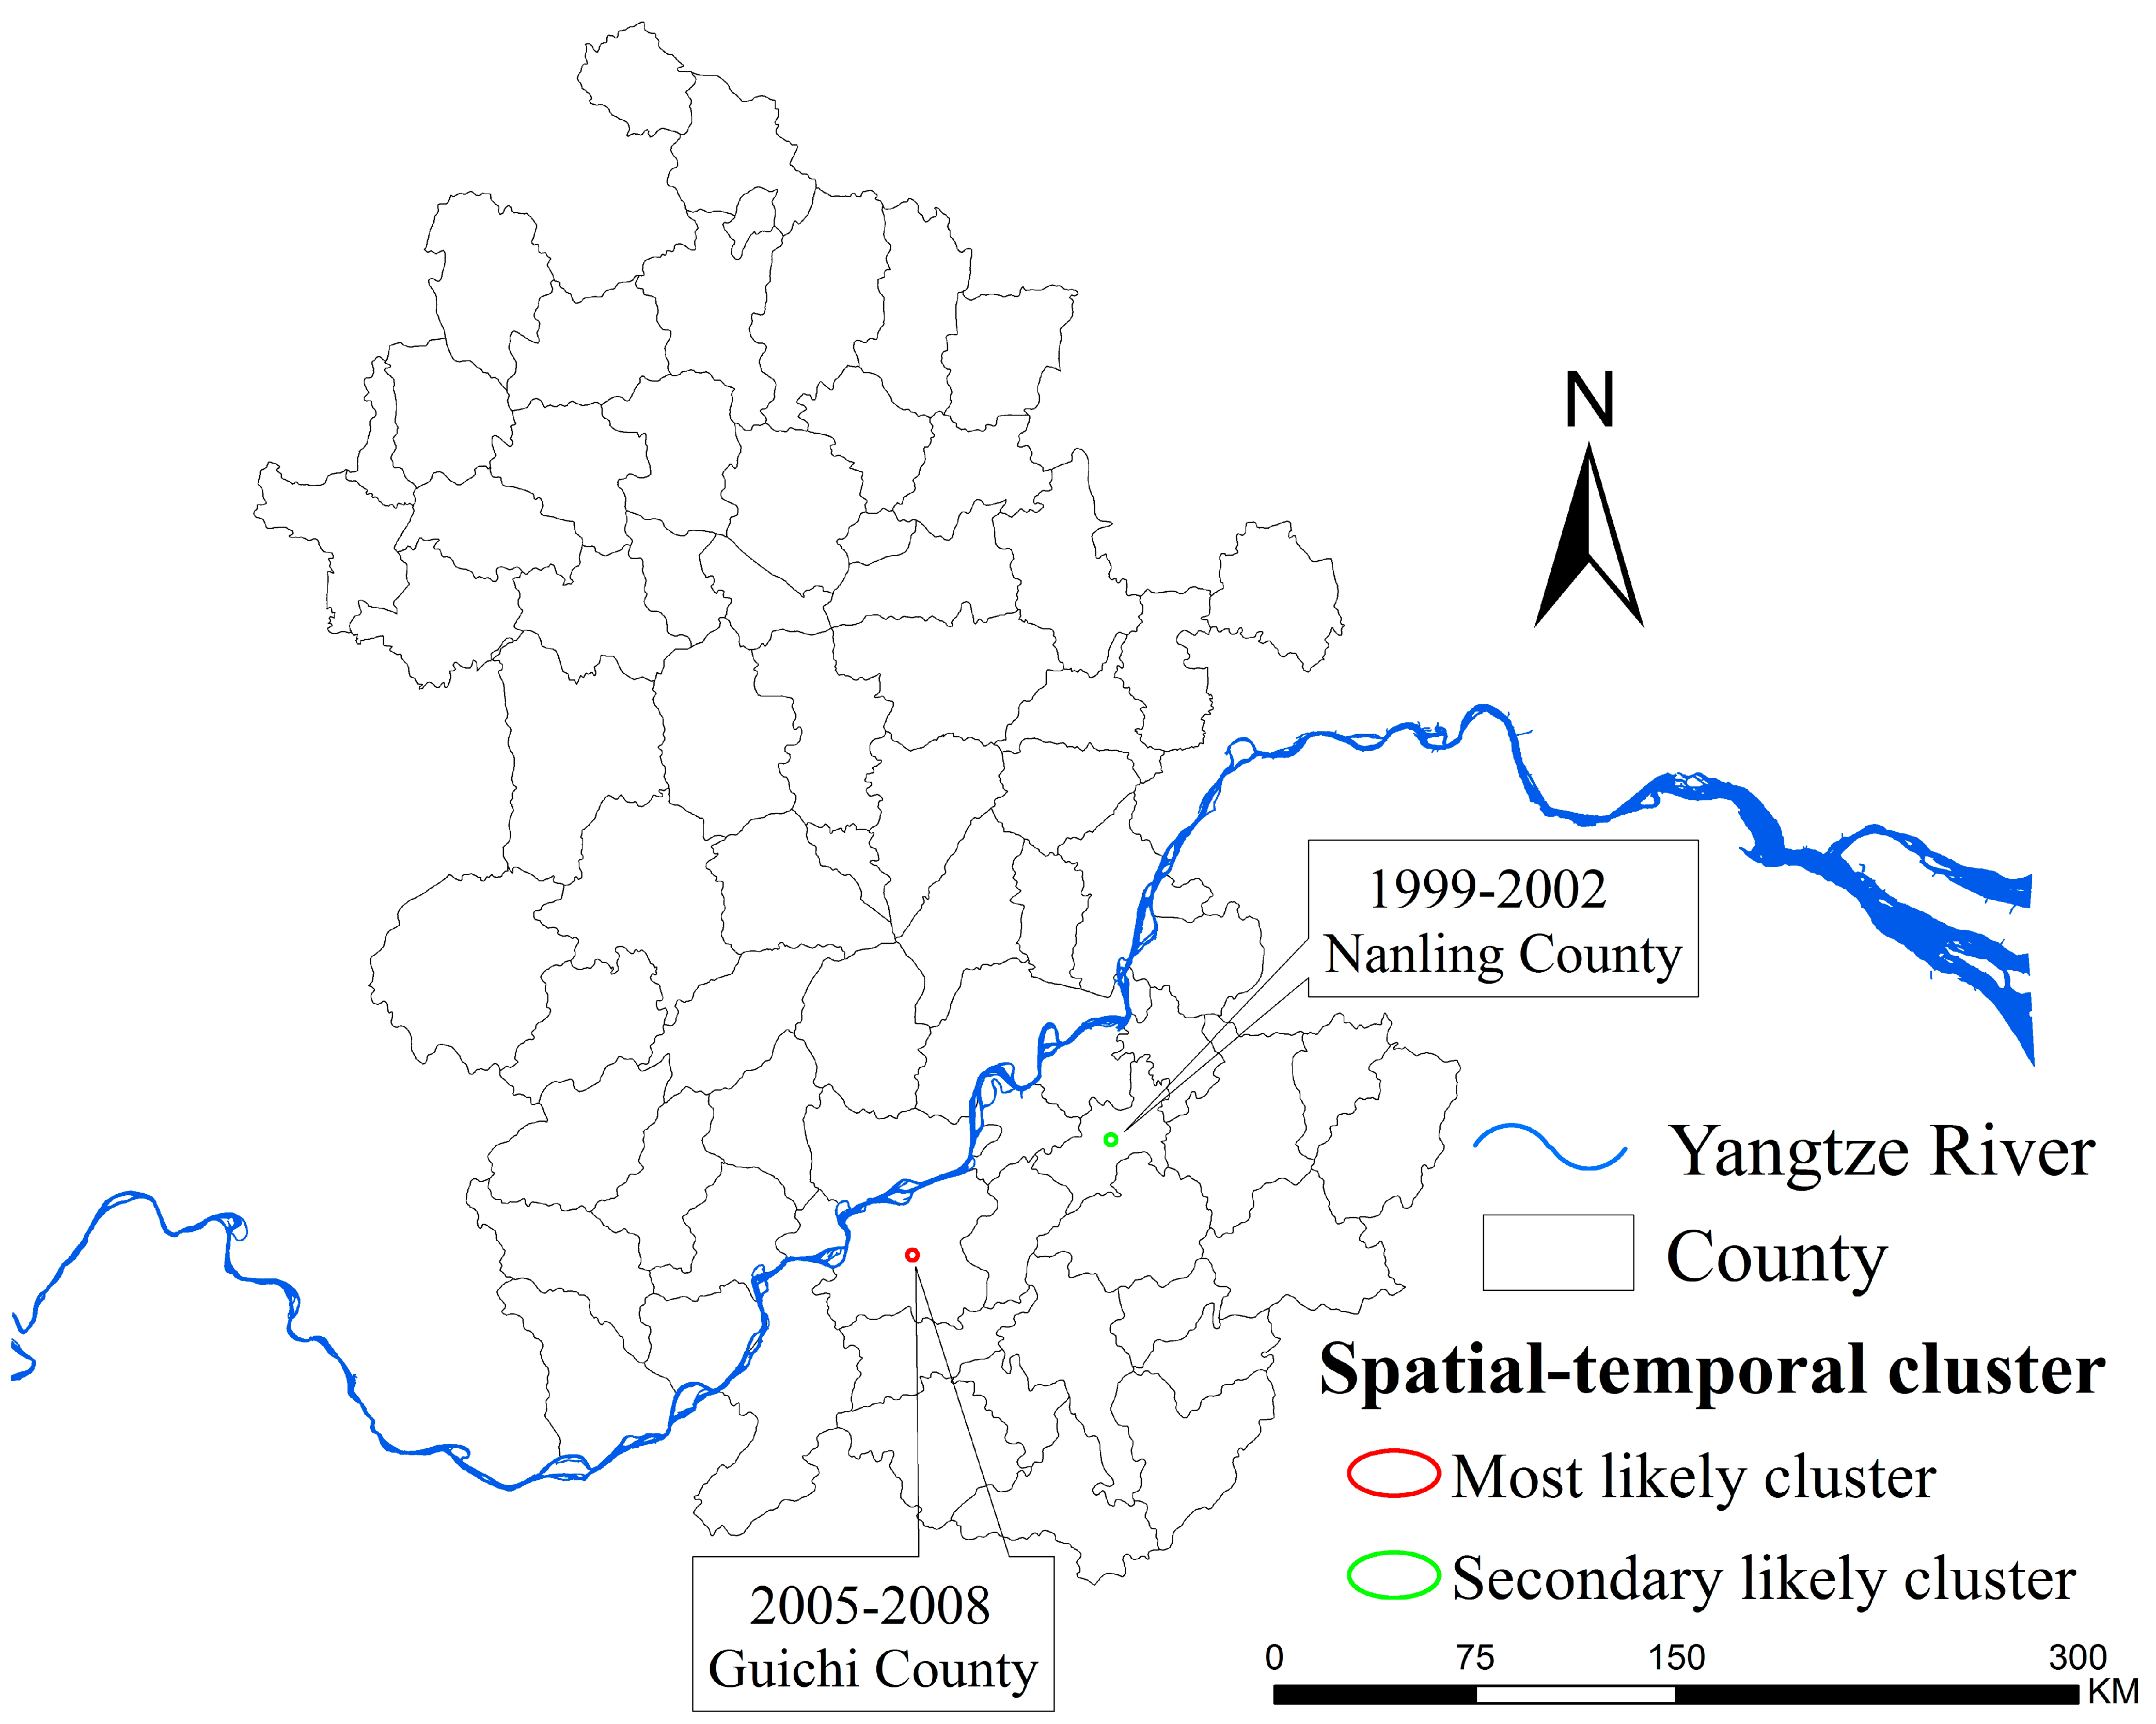
3. Results

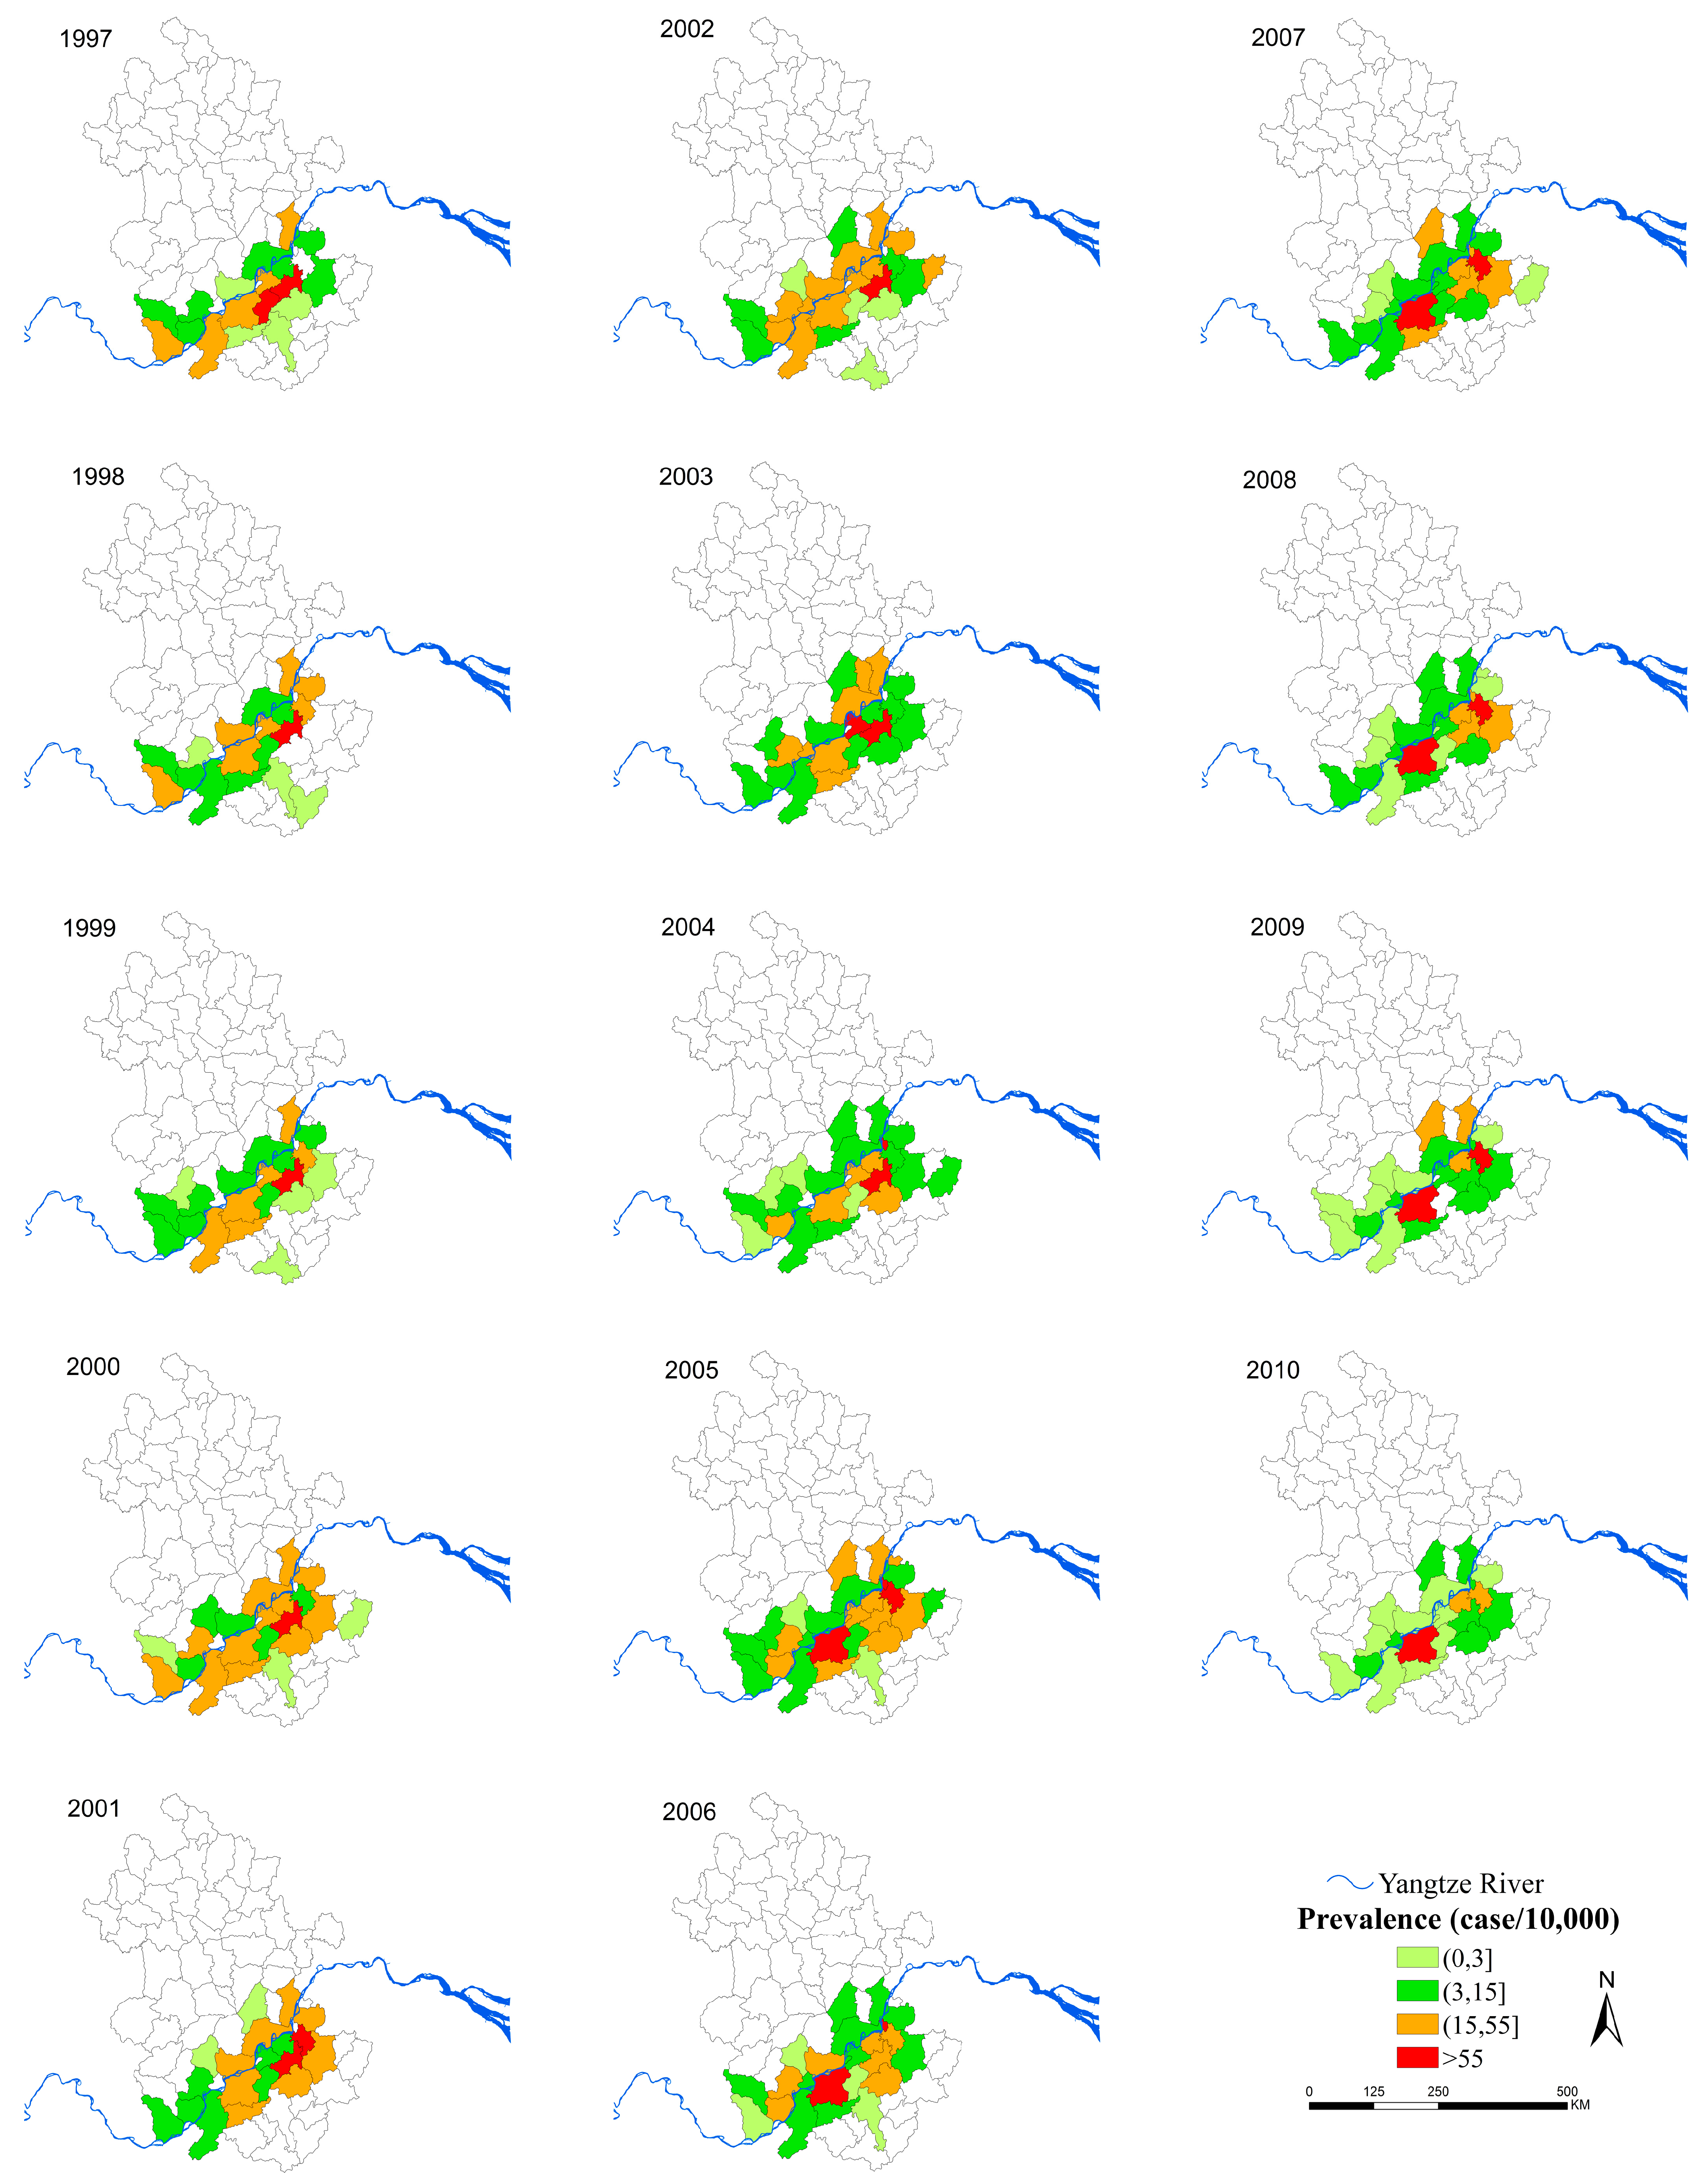
4. Discussion
5. Conclusions
Acknowledgments
Author Contributions
Conflicts of Interest
References
- Odhiambo, G.O.; Musuva, R.M.; Atuncha, V.O.; Mutete, E.T.; Odiere, M.R.; Onyango, R.O.; Alaii, J.A.; Mwinzi, P.N. Low levels of awareness despite high prevalence of schistosomiasis among communities in Nyalenda informal settlement, Kisumu city, western Kenya. PLoS Negl. Trop. Dis. 2014, 8. [Google Scholar] [CrossRef] [PubMed]
- Ladu, R. Schistosomiasis as a rare cause of recurrent acute appendicitis—A case report. Int. J. Surg. Case Rep. 2014, 5, 159–160. [Google Scholar] [CrossRef] [PubMed]
- Xu, B.; Gong, P.; Seto, E.; Liang, S.; Yang, C.H.; Wen, S.; Qiu, D.C.; Gu, X.G.; Spear, R. A spatial-temporal model for assessing the effects of intervillage connectivity in schistosomiasis transmission. Ann. Assoc. Am. Geogr. 2006, 96, 31–46. [Google Scholar] [CrossRef]
- Shan, C.; Zhou, X.; Zhu, H. The dynamics of growing islets and transmission of schistosomiasis Japonica in the Yangtze River. Bull. Math. Biol. 2014, 76, 1194–1217. [Google Scholar] [CrossRef] [PubMed]
- Krishnamurthi, R.V.; Feigin, V.L.; Forouzanfar, M.H.; Mensah, G.A.; Connor, M.; Bennett, D.A.; Moran, A.E.; Sacco, R.L.; Anderson, L.M.; Truelsen, T.; et al. Global and regional burden of first-ever ischaemic and haemorrhagic stroke during 1990–2010: Findings from the Global Burden of Disease Study 2010. Lancet Global Health 2013, 1, e259–e281. [Google Scholar] [CrossRef]
- Gryseels, B.; Polman, K.; Clerinx, J.; Kestens, L. Human schistosomiasis. Lancet 2006, 368, 1106–1118. [Google Scholar] [CrossRef]
- Ross, A.G.; Sleigh, A.C.; Li, Y.; Davis, G.M.; Williams, G.M.; Jiang, Z.; Feng, Z.; McManus, D.P. Schistosomiasis in the People’s Republic of China: Prospects and challenges for the 21st century. Clin. Microbiol. Rev. 2001, 14, 270–295. [Google Scholar] [CrossRef] [PubMed]
- Zhou, X.N.; Wang, L.Y.; Chen, M.G.; Wu, X.H.; Jiang, Q.W.; Chen, X.Y.; Zheng, J.; Utzinger, J. The public health significance and control of schistosomiasis in China—Then and now. Acta Trop. 2005, 96, 97–105. [Google Scholar] [CrossRef] [PubMed]
- Zhang, Z.; Carpenter, T.E.; Chen, Y.; Clark, A.B.; Lynn, H.S.; Peng, W.; Zhou, Y.; Zhao, G.; Jiang, Q. Identifying high-risk regions for schistosomiasis in Guichi, China: A spatial analysis. Acta Trop. 2008, 107, 217–223. [Google Scholar] [CrossRef] [PubMed]
- Yang, K.; Zhou, X.N.; Wu, X.H.; Steinmann, P.; Wang, X.H.; Yang, G.J.; Utzinger, J.; Li, H.J. Landscape pattern analysis and Bayesian modeling for predicting Oncomelania hupensis distribution in Eryuan County, People’s Republic of China. Amer. J. Trop. Med. Hyg. 2009, 81, 416–423. [Google Scholar]
- Zhou, X.N.; Bergquist, R.; Leonardo, L.; Yang, G.J.; Yang, K.; Sudomo, M.; Olveda, R. Schistosomiasis japonica control and research needs. Adv. Parasitol. 2010, 72, 145–178. [Google Scholar] [PubMed]
- Liu, J.; Yu, H.; Shi, Y.; Li, H.; He, L.; Li, J.; Dong, C.; Xie, Q.; Jin, Y.; Lu, K.; Lin, J. Seasonal dynamics of schistosoma japonicum infection in buffaloes in the Poyang Lake region and suggestions on local treatment schemes. Vet. Parasitol. 2013, 198, 219–222. [Google Scholar] [CrossRef]
- Mao, S.B. Recent progress in the control of schistosomiasis in China. Chin. Med. J. Engl. 1986, 99, 439–443. [Google Scholar] [PubMed]
- Chitsulo, L.; Engels, D.; Montresor, A.; Savioli, L. The global status of schistosomiasis and its control. Acta Trop. 2000, 77, 41–51. [Google Scholar] [CrossRef]
- Balen, J.; Liu, Z.; McManus, D.P.; Raso, G.; Utzinger, J.; Xiao, S.; Yu, D.; Zhao, Z.; Li, Y. Health access livelihood framework reveals potential barriers in the control of schistosomiasis in the Dongting lake area of Hunan province, China. PLoS Negl. Trop. Dis. 2013, 7. [Google Scholar] [CrossRef] [PubMed]
- Xianyi, C.; Liying, W.; Jiming, C.; Xiaonong, Z.; Jiang, Z.; Jiagang, G.; Xiaohua, W.; Engels, D.; Minggang, C. Schistosomiasis control in China: The impact of a 10-year World Bank Loan Project (1992–2001). Bull. WHO 2005, 83, 43–48. [Google Scholar]
- Chen, Y.Y.; Liu, J.B.; Huang, X.B.; Cai, S.X.; Su, Z.M.; Zhong, R.; Zou, L.; Miao, X.P. New integrated strategy emphasizing infection source control to curb schistosomiasis japonica in a marshland area of Hubei Province, China: Findings from an eight-year longitudinal survey. PLoS ONE 2014, 9. [Google Scholar] [CrossRef] [PubMed]
- Yuan, H.; Jiang, Q.; Zhao, G.; He, N. Achievements of schistosomiasis control in China. Mem. Inst. Oswaldo Cruz 2002, 97, 187–189. [Google Scholar] [CrossRef] [PubMed]
- Utzinger, J.; Zhou, X.N.; Chen, M.G.; Bergquist, R. Conquering schistosomiasis in China: The long march. Acta Trop. 2005, 96, 69–96. [Google Scholar] [PubMed]
- Zhao, G.M.; Zhao, Q.; Jiang, Q.W.; Chen, X.Y.; Wang, L.Y.; Yuan, H.C. Surveillance for schistosomiasis japonica in China from 2000 to 2003. Acta Trop. 2005, 96, 288–295. [Google Scholar] [CrossRef] [PubMed]
- McManus, D.P.; Gray, D.J.; Li, Y.; Feng, Z.; Williams, G.M.; Stewart, D.; Rey-Ladino, J.; Ross, A.G. Schistosomiasis in the People’s Republic of China: The era of the Three Gorges Dam. Clin. Microbiol. Rev. 2010, 23, 442–466. [Google Scholar] [CrossRef] [PubMed]
- Basch, P.F. Schistosomiasis in China: An update. Amer. J. Chin. Med. 1986, 14, 17–25. [Google Scholar] [CrossRef] [PubMed]
- Lu, D.B.; Wang, T.P.; Rudge, J.W.; Donnelly, C.A.; Fang, G.R.; Webster, J.P. Contrasting reservoirs for Schistosoma japonicum between marshland and hilly regions in Anhui, China—A two-year longitudinal parasitological survey. Parasitology 2010, 137, 99–110. [Google Scholar] [CrossRef] [PubMed]
- Liang, S.; Seto, E.; Remais, J.V.; Zhong, B.; Yang, C.H.; Hubbard, A.; Davis, G.M.; Gu, X.G.; Qiu, D.C.; Spear, R.C. Environmental effects on parasitic disease transmission exemplified by schistosomiasis in western China. Proc. Natl. Acad. Sci. USA 2007, 104, 7110–7115. [Google Scholar] [CrossRef] [PubMed]
- Liang, S.; Yang, C.; Zhong, B.; Qiu, D. Re-emerging schistosomiasis in hilly and mountainous areas of Sichuan, China. Bull. WHO 2006, 84, 139–144. [Google Scholar] [PubMed]
- Rahman, M.R.; Shi, Z.H.; Chongfa, C. Assessing regional environmental quality by integrated use of remote sensing, GIS, and spatial multi-criteria evaluation for prioritization of environmental restoration. Environ. Monit. Assess. 2014, 186, 6993–7009. [Google Scholar] [CrossRef] [PubMed]
- Gomes, E.C.; Leal-Neto, O.B.; de Oliveira, F.J.; Campos, J.V.; Souza-Santos, R.; Barbosa, C.S. Risk analysis for occurrences of schistosomiasis in the coastal area of Porto de Galinhas, Pernambuco, Brazil. BMC Infect. Dis. 2014, 14. [Google Scholar] [CrossRef]
- Martin, V.; Pfeiffer, D.U.; Zhou, X.; Xiao, X.; Prosser, D.J.; Guo, F.; Gilbert, M. Spatial distribution and risk factors of highly Pathogenic Avian Influenza (HPAI) H5N1 in China. PLoS Pathog. 2011, 7. [Google Scholar] [CrossRef] [PubMed]
- Feo, G.D.; Gisi, S.D. Using MCDA and GIS for hazardous waste landfill siting considering land scarcity for waste disposal. Waste Manag. 2014, 34, 2225–2238. [Google Scholar] [CrossRef] [PubMed]
- Paireau, J.; Girond, F.; Collard, J.; Mainassara, H.B.; Jusot, J. Analysing spatio-temporal clustering of meningococcal meningitis outbreaks in Niger reveals opportunities for improved disease control. PLoS. Negl. Trop. Dis. 2012, 6. [Google Scholar] [CrossRef] [PubMed]
- Liu, R.; Dong, H.; Jiang, M. The new national integrated strategy emphasizing infection sources control for schistosomiasis control in China has made remarkable achievements. Parasitol. Res. 2013, 112, 1483–1491. [Google Scholar] [CrossRef] [PubMed]
- Hu, Y.; Zhang, Z.; Chen, Y.; Wang, Z.; Gao, J.; Tao, B.; Jiang, Q.; Jiang, Q. Spatial pattern of schistosomiasis in Xingzi, Jiangxi province, China: The effects of environmental factors. Parasites Vectors 2013, 6. [Google Scholar] [CrossRef] [PubMed]
- Katz, N.; Chaves, A.; Pellegrino, J. A simple device for quantitative stool thick-smear tecnique in schistosomiasis mansoni. Rev. Inst. Med. Trop. Sao Paulo 1972, 14, 397–400. [Google Scholar] [PubMed]
- Yang, K.; Li, W.; Sun, L.; Huang, Y.; Zhang, J.; Wu, F.; Hang, D.; Steinmann, P.; Liang, Y. Spatio-temporal analysis to identify determinants of Oncomelania hupensis infection with Schistosoma japonicum in Jiangsu province, China. Parasites Vectors 2013, 6. [Google Scholar] [CrossRef] [PubMed] [Green Version]
- Anselin, L. Local indicators of spatial association—LISA. Geogr. Anal. 1995, 27, 93–115. [Google Scholar] [CrossRef]
- Kulldorff, M. A spatial scan statistic. Commun. Stat. Theory Methods 1997, 26, 1481–1496. [Google Scholar] [CrossRef]
- Wang, T.P.; Zhao, F.; Zhang, S.Q.; Zhang, Z.J.; Gao, F.H.; Zhou, Y.B.; He, J.X.; Jiang, Q.W. Spatial-temporal clustering analysis of schistosomiasis in Anhui from 2000 to 2008. J. Trop. Dis. Parasitol. 2011, 9, 127–130. [Google Scholar]
- Zhou, X.N.; Dandan, L.; Huiming, Y.; Honggen, C.; Leping, S.; Guojing, Y.; Qingbiao, H.; Brown, L.; Malone, J.B. Use of landsat TM satellite surveillance data to measure the impact of the 1998 flood on snail intermediate host dispersal in the lower Yangtze River Basin. Acta Trop. 2002, 82, 199–205. [Google Scholar] [CrossRef]
- Qi, L.; Cui, J.; Huang, T.; Ye, F.; Jiang, L. Mathematical model of schistosomiasis under flood in Anhui province. Abstr. Appl. Anal. 2014, 2014, 1–7. [Google Scholar] [CrossRef]
- Engels, D.; Wang, L.; Palmer, K. Control of schistosomiasis in China. Acta Trop. 2005, 96, 67–68. [Google Scholar] [CrossRef] [PubMed]
- Sun, L.P.; Wang, W.; Liang, Y.S.; Tian, Z.X.; Hong, Q.B.; Yang, K.; Yang, G.J.; Dai, J.R.; Gao, Y. Effect of an integrated control strategy for schistosomiasis japonica in the lower reaches of the Yangtze River, China: An evaluation from 2005 to 2008. Parasites Vectors 2011, 4. [Google Scholar] [CrossRef] [PubMed]
- Wang, L.D.; Guo, J.G.; Wu, X.H.; Chen, H.G.; Wang, T.P.; Zhu, S.P.; Zhang, Z.H.; Steinmann, P.; Yang, G.J.; Wang, S.P.; et al. China’s new strategy to block schistosoma japonicum transmission: Experiences and impact beyond schistosomiasis. Trop. Med. Int. Health 2009, 14, 1475–1483. [Google Scholar] [CrossRef] [PubMed]
- Wang, L.D.; Chen, H.G.; Guo, J.G.; Zeng, X.J.; Hong, X.L.; Xiong, J.J.; Wu, X.H.; Wang, X.H.; Wang, L.Y.; Xia, G.; et al. A strategy to control transmission of schistosoma japonicum in China. N. Engl. J. Med. 2009, 360, 121–128. [Google Scholar] [CrossRef] [PubMed]
- Wang, P.A.; Luo, W.H.; Bai, Y.P. Comparative analysis of aggregation detection based on spatial autocorrelation and spatial-temporal scan statistics. Hum. Geogr. 2012, 27, 119–127. [Google Scholar]
- Rainey, J.J.; Omenah, D.; Sumba, P.O.; Moormann, A.M.; Rochford, R.; Wilson, M.L. Spatial clustering of endemic Burkitt’s lymphoma in high-risk regions of Kenya. Int. J. Cancer 2007, 120, 121–127. [Google Scholar] [CrossRef] [PubMed]
- Hong, X.C.; Xu, X.J.; Chen, X.; Li, Y.S.; Yu, C.H.; Yuan, Y.; Chen, Y.Y.; Li, R.D.; Qiu, J.; Liu, Z.C.; et al. Assessing the effect of an integrated control strategy for schistosomiasis japonica emphasizing bovines in a marshland area of Hubei Province, China: A cluster randomized trial. PLoS Negl. Trop. Dis. 2013, 7. [Google Scholar] [CrossRef] [PubMed]
- Ofulla, A.V.; Adoka, S.O.; Anyona, D.N.; Abuom, P.O.; Karanja, D.; Vulule, J.M.; Okurut, T.; Matano, A.; Dida, G.O.; Jembe, T.; et al. Spatial distribution and habitat characterization of schistosomiasis host snails in lake and land habitats of western Kenya. Lakes Reserv. Res. Manag. 2013, 18, 197–215. [Google Scholar] [CrossRef]
- Hu, Y.; Xiong, C.L.; Zhang, Z.J.; Luo, C.; Cohen, T.; Gao, J.; Zhang, L.J.; Jiang, Q.W. Changing patterns of spatial clustering of schistosomiasis in Southwest China between 1999–2001 and 2007–2008: Assessing progress toward eradication after the World Bank Loan Project. Int. J. Environ. Res. Public Health 2014, 11, 701–712. [Google Scholar] [CrossRef] [PubMed]
- Jia, Y.H.; Dai, D.H.; Liu, Y. Performance Analyse and Evaluation of Freeway in China. J. Beijing Jiaotong Univ. 2005, 29, 1–5. [Google Scholar]
- Huang, Y.X.; Hong, Q.B.; Gao, Y.; Gao, Y.; Zhang, L.H.; Chen, H.; Guo, J.H.; Liang, Y.S. Impact of floodwater on schistosomiasis transmission in area of lower reaches of Yangtze River. Chin. J. Schistosomiasis Control 2006, 18, 401–405. [Google Scholar]
- Xu, J.; Xu, J.; Li, S.; Zhang, L.; Wang, Q.; Zhu, H.; Zhou, X. Integrated control programmes for schistosomiasis and other helminth infections in P.R. China. Acta Trop. 2015, 141, 332–341. [Google Scholar] [CrossRef] [PubMed]
- Lin, T.; Jiang, Q.W.; Lin, D.D.; Chen, H.G.; Zhao, G.M.; Liu, J.X.; Zhang, S.J. Classification study on the marshland in endemic areas of Schistosoma japonicum using satellite TM image data. Chin. J. Prev. Med. 2001, 35, 312–314. [Google Scholar]
© 2015 by the authors; licensee MDPI, Basel, Switzerland. This article is an open access article distributed under the terms and conditions of the Creative Commons Attribution license (http://creativecommons.org/licenses/by/4.0/).
Share and Cite
Sun, L.; Chen, Y.; Lynn, H.; Wang, Q.; Zhang, S.; Li, R.; Xia, C.; Jiang, Q.; Hu, Y.; Gao, F.; et al. Identifying Spatial Clusters of Schistosomiasis in Anhui Province of China: A Study from the Perspective of Application. Int. J. Environ. Res. Public Health 2015, 12, 11756-11769. https://doi.org/10.3390/ijerph120911756
Sun L, Chen Y, Lynn H, Wang Q, Zhang S, Li R, Xia C, Jiang Q, Hu Y, Gao F, et al. Identifying Spatial Clusters of Schistosomiasis in Anhui Province of China: A Study from the Perspective of Application. International Journal of Environmental Research and Public Health. 2015; 12(9):11756-11769. https://doi.org/10.3390/ijerph120911756
Chicago/Turabian StyleSun, Liqian, Yue Chen, Henry Lynn, Qizhi Wang, Shiqing Zhang, Rui Li, Congcong Xia, Qingwu Jiang, Yi Hu, Fenghua Gao, and et al. 2015. "Identifying Spatial Clusters of Schistosomiasis in Anhui Province of China: A Study from the Perspective of Application" International Journal of Environmental Research and Public Health 12, no. 9: 11756-11769. https://doi.org/10.3390/ijerph120911756