Article

Investigation of E. coli and Virus Reductions Using Replicate, Bench-Scale Biosand Filter Columns and Two Filter Media

by
Mark Elliott
1,*,
Christine E. Stauber
2,
Francis A. DiGiano
3,
Anna Fabiszewski De Aceituno
4 and
Mark D. Sobsey
3
1
Department of Civil, Construction and Environmental Engineering, University of Alabama, Tuscaloosa, AL 35487, USA
2
School of Public Health, Georgia State University, Atlanta, GA 30302, USA
3
Department of Environmental Sciences and Engineering, University of North Carolina, Chapel Hill, NC 27599, USA
4
Hubert Department of Global Health, Rollins School of Public Health, Emory University, Atlanta, GA 30322, USA
*
Author to whom correspondence should be addressed.
Int. J. Environ. Res. Public Health 2015, 12(9), 10276-10299; https://doi.org/10.3390/ijerph120910276
Submission received: 6 July 2015 / Revised: 11 August 2015 / Accepted: 12 August 2015 / Published: 25 August 2015

Abstract

:
The biosand filter (BSF) is an intermittently operated, household-scale slow sand filter for which little data are available on the effect of sand composition on treatment performance. Therefore, bench-scale columns were prepared according to the then-current (2006–2007) guidance on BSF design and run in parallel to conduct two microbial challenge experiments of eight-week duration. Triplicate columns were loaded with Accusand silica or crushed granite to compare virus and E. coli reduction performance. Bench-scale experiments provided confirmation that increased schmutzdecke growth, as indicated by decline in filtration rate, is the primary factor causing increased E. coli reductions of up to 5-log10. However, reductions of challenge viruses improved only modestly with increased schmutzdecke growth. Filter media type (Accusand silica vs. crushed granite) did not influence reduction of E. coli bacteria. The granite media without backwashing yielded superior virus reductions when compared to Accusand. However, for columns in which the granite media was first backwashed (to yield a more consistent distribution of grains and remove the finest size fraction), virus reductions were not significantly greater than in columns with Accusand media. It was postulated that a decline in surface area with backwashing decreased the sites and surface area available for virus sorption and/or biofilm growth and thus decreased the extent of virus reduction. Additionally, backwashing caused preferential flow paths and deviation from plug flow; backwashing is not part of standard BSF field preparation and is not recommended for BSF column studies. Overall, virus reductions were modest and did not meet the 5- or 3-log10 World Health Organization performance targets.

1. Introduction

The lack of safe drinking water leads to substantial adverse health and economic impacts in the developing world. Point-of-use (POU) drinking water treatment provides a feasible solution to achieve microbiologically safer water for those without available, sustainable and affordable access to safe water sources [1].
The biosand filter (BSF), a household-scale, intermittently operated slow sand filter (SSF), is among the most popular and promising POU technologies. Approximately 650,000 filters have been installed globally, serving approximately 4 million people [2]. Once installed in the home, the BSF has proven an exception to the low rates of sustained use found with most other POU technologies [3]. Data from the Dominican Republic, Cambodia and Haiti, for example, indicate that >85% of the BSFs are still in service one to eight years after their installation [4,5]. The ease of operation, relatively high flow rate and durability of the BSF make it plausible that much BSF use will be correct, consistent and sustainable, which are factors demonstrated to be essential to achieve substantial health impacts from POU interventions [6,7].
Microbial reductions by the BSF have been reported in a number of laboratory and field studies. The majority of these studies focused on reductions of bacteria (mostly E. coli and thermotolerant coliforms). Mean reductions of E. coli and thermotolerant coliforms ranging from <1 log to >2 log have been reported in field use and laboratory challenge studies and these findings have been summarized by CAWST [8]. Many operational and design parameters have been reported to impact bacterial reductions, including but not limited to: filter maturation and schmutzdecke development [9,10,11], daily charge volume and idle time [10,12,13], flow rate [12,14], physical disturbance of the filter housing [15,16] and media size/type [12,17,18,19]. This present study contributes further information on the roles of maturation, flow rate, and media size/type in E. coli reductions by the BSF.
Virus reductions by the BSF and the factors influencing treatment of viruses have been reported in fewer studies. Most studies have used MS2 coliphage as the challenge virus [11,12,20,21]; in addition to MS2, our research team has published on reductions of PRD-1 phage and the mammalian enteric virus echovirus 12 [10,22,23]. This study reports on the first investigation of the reductions of multiple viruses from water samples in replicate BSFs containing different granular media.
The objectives of this study were: (1) to compare for the first time in replicate BSF filter columns the treatment of the most common and recommended bacterial and viral indicators, E. coli and MS2, respectively, along with other challenge viruses (bacteriophage PRD-1 and the human enterovirus echovirus 12); (2) to evaluate the impact of flow rate and filter maturation on virus reductions based on effluent composite samples; and (3) to investigate the effect of media selection and composition (coarsely screened crushed granite gravel vs. narrowly sieved Accusand silica) on reduction of these challenge organisms. Additionally, the impacts of backwashing filter media prior to BSF operation are discussed.

2. Experimental Section

Two bench-scale tests (Column Tests No. 1 and No. 2) were conducted. Each of these tests lasted eight weeks and included a comparison of microbial reductions in columns filled with commercial Accusand and locally sourced and sieved granite media. The columns were designed and operated to simulate typical preparation and operation of the full-scale BSF based on the guidance that was current at the time of these experiments in 2006–2007. The guidance on BSF design and media preparation has changed since these experiments [24]; major deviations from current guidance are noted below.
The filter columns were designed and operated such that the following parameters were the same as in the full-scale plastic HydrAid BSF: (1) the maximum head; (2) the idle period between daily charges; and (3) the fraction of the daily charge stored within the filter media during the idle time. Granite media preparation was based on guidance from the BSF inventor that was current at the time [25].

2.1. Column Design, Preparation and Operation

The design of the filtration systems used in Column Test No. 1 and No. 2 are shown in Figure 1 and Figure 2, respectively. Characteristics of the columns and their operation are listed in Table 1.
Figure 1. Cross-section of bench-scale columns used in Column Test No. 1. Six columns of this design were used, three loaded with Accusand silica and three with crushed granite media.
Ijerph 12 10276 g001
Figure 2. Cross-section of bench-scale columns used in Column Test No. 2. Six columns of this design were used, three loaded with Accusand silica and three with crushed granite media.
Ijerph 12 10276 g002
Table 1. Characteristics of filter columns, media preparation and daily charge for Column Tests No. 1 and 2.
Experiment CodingColumns BackwashedExternal ReservoirDaily Charge Volume (mL)Charge-to-Pore Volume RatioDaily Charge Aliquots Maximum Head (cm)Media Depth (cm)Diffuser to Standing Water (cm)Standing Water (cm)
Column Test No. 1NoNo4301.3:12174023.5
Column Test No. 2YesYes4501.3:1117.54023.5
In each experiment, six columns were operated in parallel with media sourced and prepared according to the following procedure. Three columns were loaded with crushed granite from a local quarry in Pittsboro, NC and three loaded with standard Accusand silica (Unimin Corp., Le Sueur, MN, USA). The granite was sieved and washed with tap water according to field procedures for the BSF that were standard in 2006–2007 when the experiments were conducted [24]. Filter columns were designed for maximum filtration rates of 0.7–0.9 m/h. These filtration rates conformed to the BSF design guidance at the time of these experiments [26]; however, current guidance calls for a maximum of 0.4 m/h [24]. Accusand was selected because of its chemical purity, low organic matter content, and low uniformity coefficient [27] that make it an ideal choice for controlled laboratory studies of granular media filtration. The Accusand was pre-washed by 24-h exposure to 40% concentrated HCl, followed by a deionized water rinse to pH 5 [28]. Three Accusand sieve fractions (U.S. Standard Mesh 30/40, 40/60 and 50/70) were blended together to provide a relatively narrow range of grain size (d10 = 0.27 mm; d60/d10 = 1.4) compared to the granite media (d10 = 0.21 mm; d60/d10 = 4.0). The underdrain of each column was 8 cm of granite gravel topped with 2 cm of U.S. Standard Mesh 12/20 Accusand.
Sieve analysis and elemental analysis were used to characterize the media. Sieve analyses of the packed media were conducted following the completion of microbial challenge experiments; the delay was necessary because sieve analyses required destructive sampling of the media. Elemental analysis of the Accusand and granite filter media was conducted following EPA Method 3051 microwave-assisted strong acid digestion procedure [29]. The acid digestion procedure does not dissolve silicate-based minerals. Therefore, the elements found in the analysis were present in acid-soluble components on the surface of the sand grains and could likely affect the sorption characteristics of the filter media. The crushed granite media also appeared, unsurprisingly, to be much more angular than the Accusand.
The daily charge volume to each filter column in Column Tests No. 1 and No. 2 was selected to ensure that the maximum elevation head and charge-to-pore volume ratio (1.3) were similar to those in the full-scale BSFs at the time of the experiments (2006–2007); current BSF design recommendations include a charge-to-pore volume ratio of 1:1 or less [24]. The feed volume was slightly larger in Column Test No. 2 (450 mL) than in Column Test No. 1 (430 mL) to account for the increase in porosity caused by backwashing prior to the start of the test. The increase in porosity of the media was discovered through the tracer tests described below.
The total daily charge volume for all six columns (2.6–2.7 L) was distributed to six, 500 mL graduated cylinders so that the challenge organism concentrations were kept essentially the same in each filter column charge. Each graduated cylinder was mixed manually before introducing the test water charge to the column.
The daily charge to each column in Column Test No. 1 had to be introduced in two approximately equal aliquots. Charging the entire volume would have nearly doubled the elevation head of 17 cm used in previously conducted full-scale experiments. The elevation head must be kept the same in order for the initial daily filtration rates to be similar in both laboratory and full-scale BSFs. An external reservoir (a 250 mL polypropylene bottle) shown in Figure 2 was installed after Column Test No. 1 so that the entire daily charge volume (450 mL) could be introduced at one time (i.e., 250 mL above the filter media in addition to 200 mL from the bottle) while maintaining the maximum elevation head the same as in full-scale filters. This modification gave a more consistent pattern of decline in head that better replicated the pattern in full-scale operations.
A schmutzdecke developed and flow rate declined in the filter columns over weeks of daily operation. Therefore, a cleaning procedure equivalent to that used in a full-scale BSF was necessary to restore an adequate filtration rate. Filter operation was discontinued briefly when flow rate decreased to about 10% of the initial value. The schmutzdecke was then scoured by stirring the uppermost 1 cm of the media bed with a sterile pipette. The material suspended by this procedure was drawn into the pipette and discharged to waste. The filter column was then returned to daily operation.

2.2. Tracer Tests

Tracer tests were conducted to measure the deviation from plug flow behavior in each of the columns. A constant head of 17-cm (±0.5 cm) was maintained using peristaltic pumps; tracer tests on full-scale BSFs showed no difference between constant and falling head [10]. A step input of 200 mg/L sodium chloride was introduced prior to Column Tests No. 1 and 2. The conductivity in the exit stream from each column with volume-filtered following the beginning of the step input was used to calculate the Morrill Dispersion Index (MDI) [30]. The MDI is the ratio of T90 to T10, where T90 is the time to reach 90% and T10 is time to reach 10% of the feed concentration in the exit stream. A reactor that exhibits ideal plug flow would have an MDI of 1.0. An MDI of less than 2.0 is classified as “effective plug flow” by the US EPA [31].

2.3. Feed Water for Microbial Challenge Studies

Feed water was obtained from the Cane Creek Reservoir raw water sample taps of the water treatment plant of the Orange Water and Sewer Authority (OWASA) in Chapel Hill, NC. Cane Creek Reservoir does not receive point source wastewater discharges and is protected from non-point waste water sources by its rural location and undeveloped land buffers. Sufficient water was collected as a single batch before each column test to be fed daily for the duration of each experiment (54 to 56 days). The total daily charge volume was stored at 4 °C until daily use and then allowed to reach room temperature (approximately 20 °C) overnight. Thus, water temperature was nearly constant at about 20 °C in all experiments and did not influence the rate of ripening or test microbe stability. Stored water for each daily charge was amended with 1% to 2.5% by volume of pasteurized primary effluent (PE) from the OWASA wastewater treatment plant in Chapel Hill, NC to simulate the presence of wastewater in typical drinking water sources of developing countries and to accelerate the ripening process. The addition of wastewater increased the total organic carbon (TOC) concentration of the feed water by up to 50%, such that feed TOC was in the range of 7.5–12.5 mg/L. The daily charge was then spiked with known quantities of stock challenge bacteria and viruses to achieve the concentrations reported in Table 2.
Table 2. Characteristics of feed water and study length for Column Tests No. 1 and 2. Microbial concentrations are mean log10 measured concentration per mL and maximum log10 deviation from the mean.
Experiment CodingLength (Days)Source Water*Pasteurized PE **E. coli B log10MS2 log10PRD-1 log10Echovirus 12 log10
Column Test No. 154Cane Creek1.0%2.9 ± 1.13.5 ± 0.9-3.6 ± 1.1
Column Test No. 256Cane Creek2.5%2.8 ± 1.32.8 ± 0.33.1 ± 0.7-
* Cane Creek = Cane Creek Reservoir, Carrboro, NC; ** Pasteurized PE = pasteurized primary effluent from OWASA WWTP, Chapel Hill, NC.
To decrease possible systematic variability between columns related to dose preparation and dosing sequence, the daily feed water was spiked with PE and challenge microorganisms in 3-L aliquots and then mixed on a stir plate. Additionally, the order in which the columns were charged (i.e., left-to-right or right-to-left) was alternated each day.

2.4. Microbial Methods and Virus Characteristics

E. coli concentrations in water were quantified by membrane filtration on MI agar (BBL, Becton-Dickinson, Franklin Lakes, NJ, USA) using USEPA Method 1604 [32]. Samples with high bacteria concentrations were diluted in phosphate buffered saline and vortex mixed prior to membrane filtration. Bacteriophage MS2 and PRD-1 concentrations were assayed using the single agar layer method on hosts E. coli Famp and Salmonella typhimurium LT2, respectively [33]. A stock of echovirus 12 was propagated in FRhK-4 cell monolayers sustained in maintenance medium at 37 °C, followed by freeze-thaw, chloroform extraction and then virus enumeration by the plaque technique in FRhK-4 cell monolayers [34]. Chloroform extraction was used to further purify echovirus stock of macromolecular cell debris. Further details of the procedures used to grow and enumerate stocks of seeded viruses have been reported previously [10,22].
Log reductions in microbe concentration by passage through the BSF were calculated by Equation (1). All log-reduction values reported are log base 10.
Log-reduction = log (Feed Water Concentration) – log (Filtered Water Concentration)
The focus of this study was on the dynamic and relative behavior of microbial reductions as the filters with different media matured and achieved quasi-steady state conditions. For consistency, microbial reductions were measured after collecting the entire volume during each daily filtration cycle. The daily dynamic in microbial reductions has also been investigated by our group and reported elsewhere, both through collection of grab and composite samples within the daily cycle [10] and by direct sampling from the filter bed during the idle time [23]. The daily charge volumes in Column Tests No. 1 and No. 2 (430 mL and 450 mL, respectively) were approximately 1.3 times greater than the pore volume of the filter.
An aliquot of feed water from the charge of the previous day was stored at room temperature until microbial samples were analyzed the following day in order to serve as a control for the effects of time and temperature on E. coli and virus survival. Mean die-off rates for MS2 and PRD-1 bacteriophages after overnight storage were less than 25% (about 0.4 log10) per 24 h and for E. coli and echovirus 12 they were about 50% (about 0.7 log10) per 24 h.
Characteristics of the three challenge viruses are included in Table 3. All test viruses are approximately spherical with capsids composed of protein subunits. Isoelectric point has been reported to be the most important single parameter for predicting the adsorption of viruses in granular media filters, at least for smaller viruses [35]. The isoelectric points listed in Table 3 show that the viruses are expected to carry net-negative charges at the pH of the column tests (mean 6.9; range 6.6–7.3). Silica also carries a net-negative charge in this pH range. Because MS2 and PRD-1 have much lower isoelectric points than echovirus 12, it is anticipated that their adsorption would be impeded by net electrostatic repulsion to a greater extent than that of echovirus 12. It is possible that the granite filter media also used in this study possibly offers a more attractive surface for virus adsorption due to the presence of electropositive Al and Fe oxides, as will be discussed.
Table 3. Physico-chemical characteristics of filter test viruses.
Virus/PhageSize (nm)Isoelectric PointGenetic Material
MS2263.5–3.9ss-RNA
PRD-1624.2ds-DNA
Echovirus 1228–305.0–6.4 *ss-RNA
* IEP listed for echovirus 12 is the range of values found in the literature for all echovirus types. Source: [36]
However, the isoelectric point can also depend on the characteristics of the solution in which the microbe is suspended [37,38,39]. For this reason, the net surface charge and its magnitude carried by a virus particle will be specific to the feed water and will also be affected by virus preparation methods. Ideally, zeta potential would be determined for each challenge virus stock in the feed water of the experiment to give an estimate of both the sign and the magnitude of charge on each virus in the relevant feed water for the applicable pH range. However, such zeta potential measurements were not made in thus study due to the complexity of the analytical methods.

2.5. Statistical Methods

The data for log reductions in filtered samples did not conform to a Gaussian distribution by the Kolmogorov-Smirnov test. Therefore, the Mann-Whitney U test (also known as the Wilcoxon rank-sum test), a non-parametric method, was used to compare log reductions. The resulting p-values are for unpaired, two-tailed tests with significance level α = 0.05.
Box plots of log microbial reductions were produced in DeltaGraph version 5.6.4 to display the central tendencies and dispersions of the data. The whiskers represent the 5th- and 95th-percentiles and the box spans the 25th- to 75th-percentiles. The median value is represented by a horizontal line through the box and the mean is indicated by a square symbol.
Most box plots include outliers, marked as individual points outside the whiskers. Points outside the 5th and 95th percentiles are not included here. In the BSF, outlier log reductions are most likely due to variability in the day-to-day concentration of the challenge organisms and are not truly representative of filter performance.

3. Results and Discussion

3.1. Comparison of Filter Media Characteristics

The inorganic composition of the granite and Accusand filter media is presented in Table 4. Concentrations (mg/kg) of metals (Ca, Mg, Mn, Al, and Fe) were two orders of magnitude higher on granite than on Accusand. Granite is generally composed of only 72% SiO2, with substantial quantities of Al2O3 (14.4%), CaO (1.82%), FeO (1.68%), Fe2O3 (1.22%), MgO (0.71%) and MnO (0.05%) [40].
The large difference in media composition, especially of Al and Fe, could have implications for virus attachment. Aluminum and ferric oxyhydroxide surfaces tend to carry a net positive charge at near-neutral pH conditions and thus adsorb viruses that are negatively charged. The region of pH where surface charge is positive is quantified by the point of zero charge (PZC) value. The PZC is about 2.0 for SiO2 in contrast to 9.1 for Al oxides (α-Al2O3), 6.7 for γ-Fe2O3 and 8.5 for amorphous Fe(OH)3 [41]. These differences in PZC would suggest less reduction of viruses in filtration through pure SiO2 (Accusand) than granite. Whether elemental composition influences microbial reduction is discussed in Section 3.3 and Section 3.4.
Table 4. Elemental analysis of the two media used in filter tests.
Granite (mg/kg)Accusand (mg/kg)
Calcium (Ca)12,27090
Magnesium (Mg)14,87560
Manganese (Mn)9200
Iron (Fe)23,25055
Aluminum (Al)17.0390

3.2. Effects of Backwashing on Grain Size Distribution and Hydraulic Characteristics

Visual inspection of the media packing during Column Test No. 1 revealed considerable variation in the grain size composition of the topmost layer among those columns filled with granite. Differences in grain size were not a major concern from the standpoint of hydraulic performance given that clean-bed head loss and starting filtration rate were similar in all columns. Nevertheless, these factors could reduce replicability among columns loaded with granite media and could affect particle trapping and microbial attachment near the media surface, potentially leading to variability in the rate of schmutzdecke development. Therefore, all six columns were backwashed prior to Column Test No. 2 and before measurement of the grain size distributions. The backwashing procedure consisted of 20%–30% expansion for 20 min. Visual observation showed removal of a substantial amount of very fine silty material from the granite loaded columns. The mass of the silty material that was backwashed out could not be quantified directly. However, a sieve analysis of pre-backwashed granite media showed that silt (grains <0.0625 mm) constituted <1.4% of the total granite media mass (following the washing steps described in [25]).
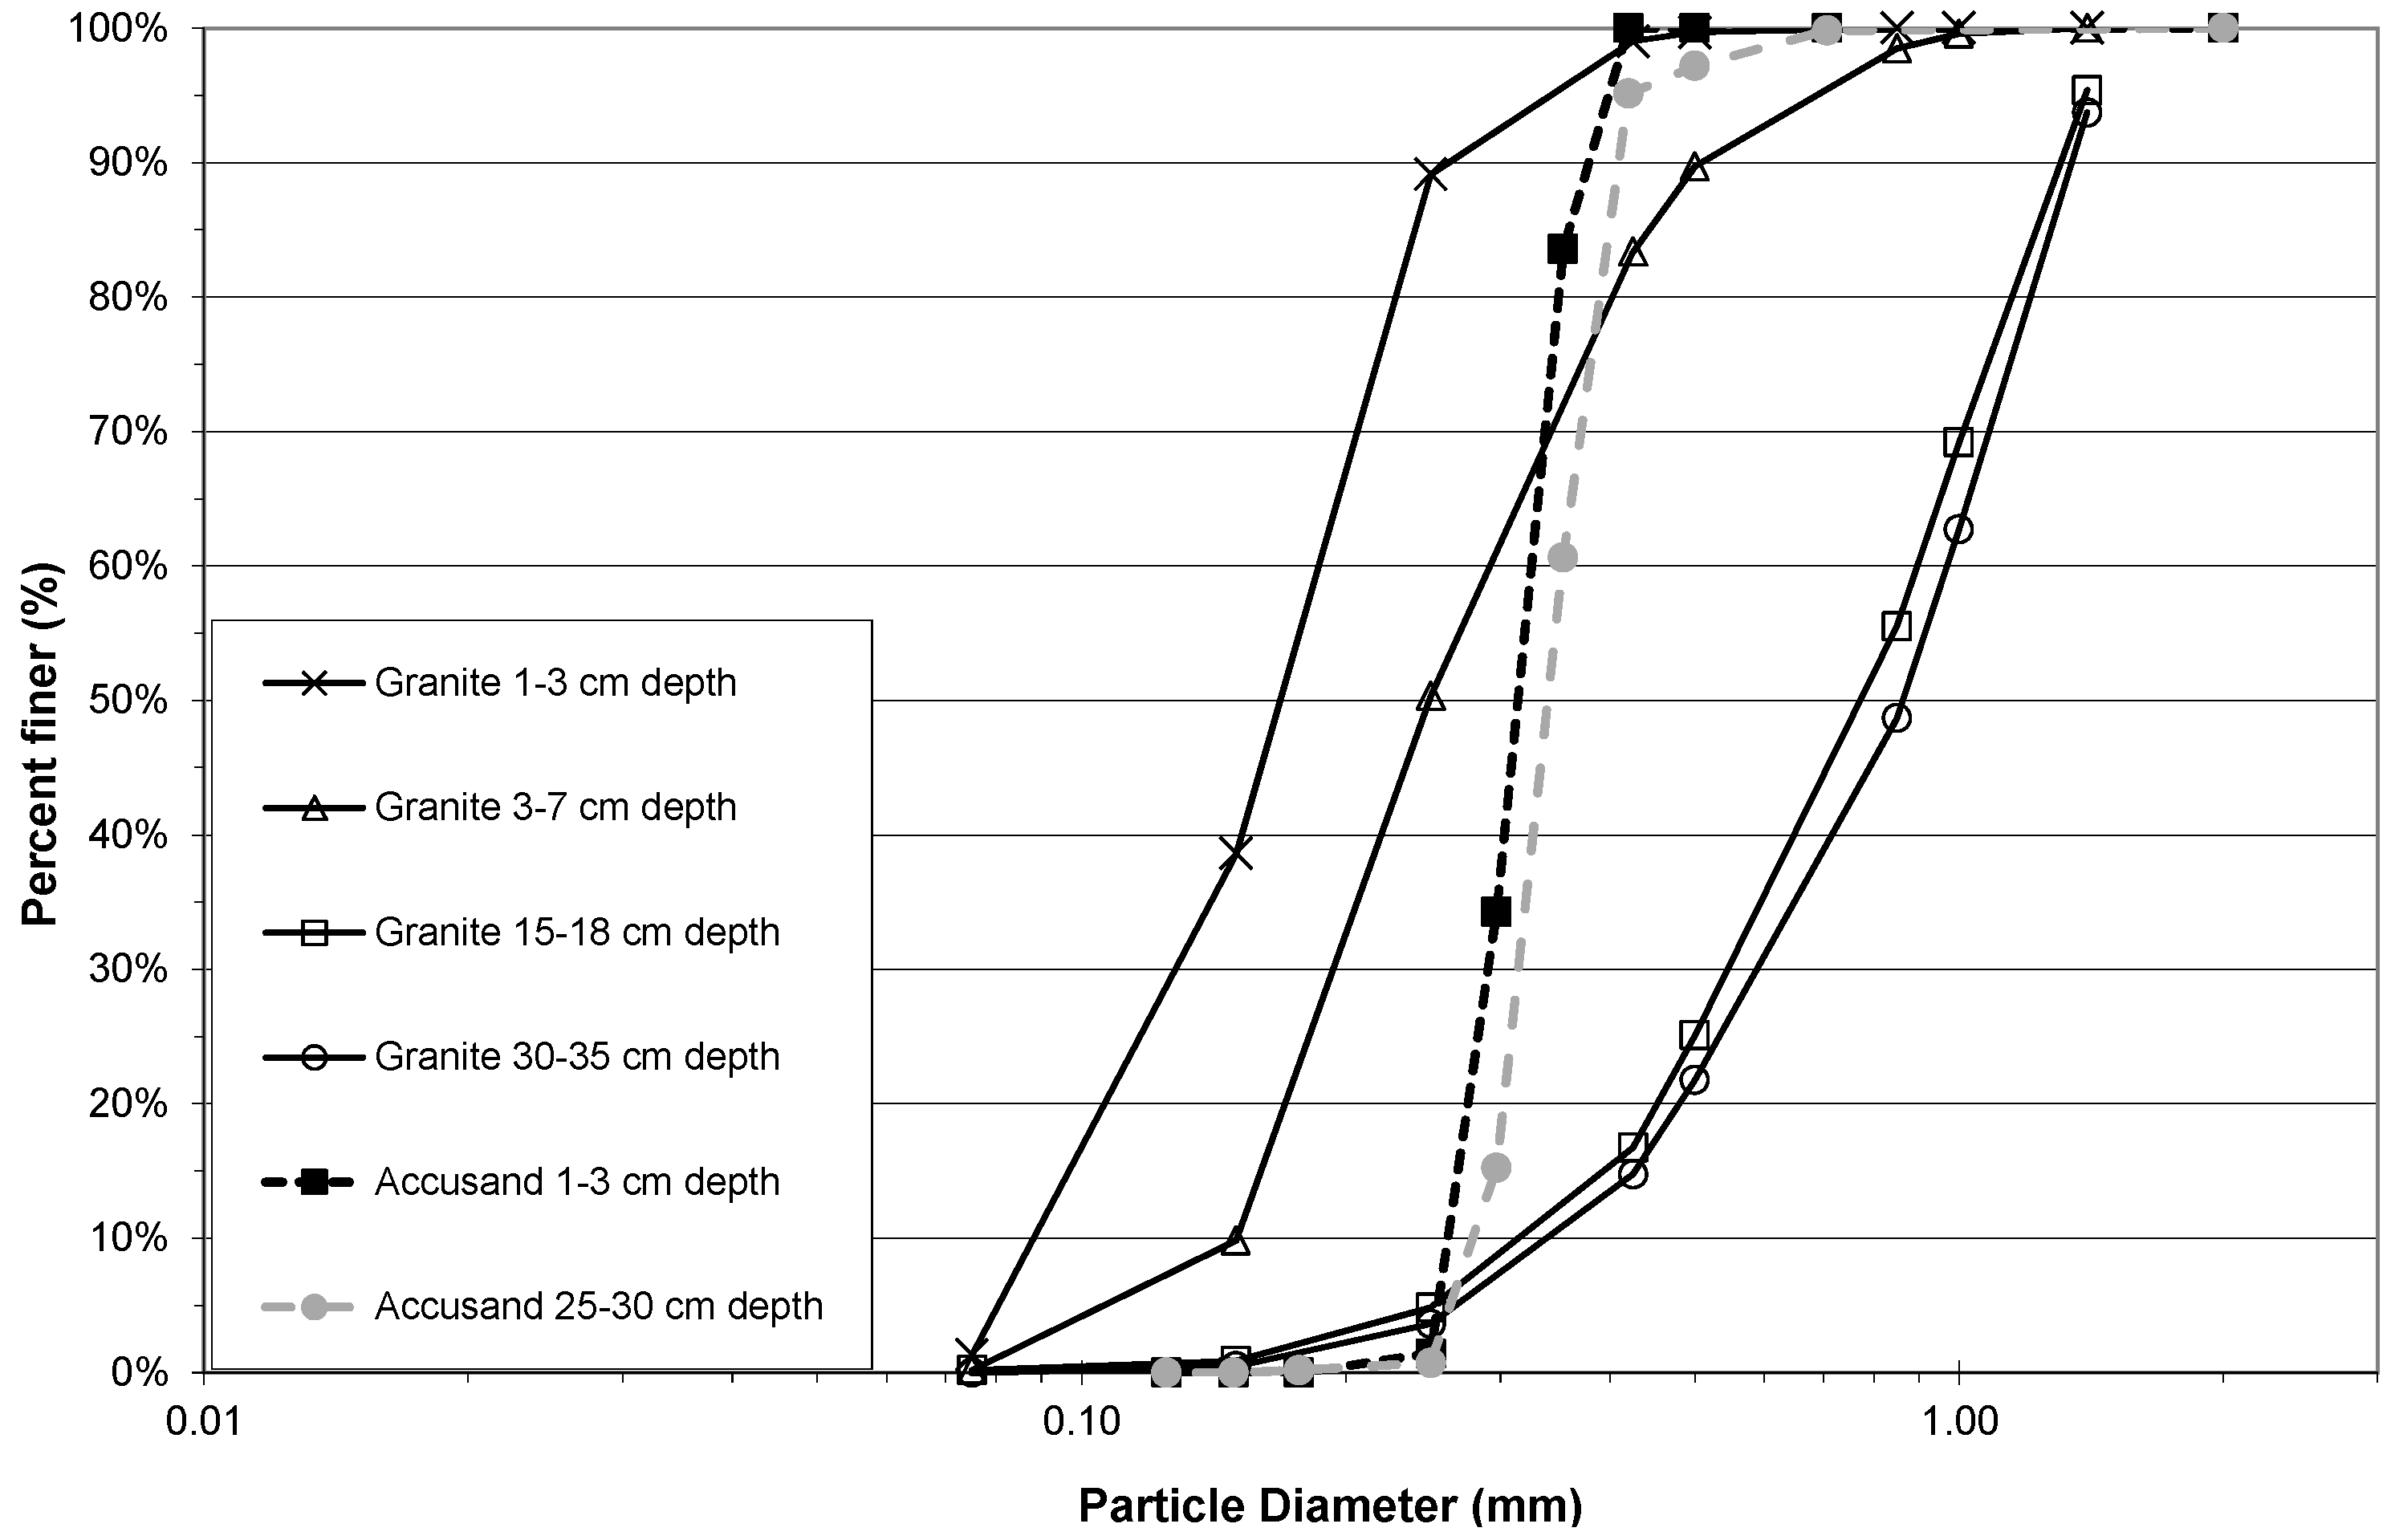
The Column Test No. 2 grain size distributions of granite and Accusand media at different filter depths after backwashing are compared in Figure 3. The effect of backwashing of the columns filled with granite medium was to cause substantial depth stratification of grain sizes. The cumulative distribution showed that 90% of those near the top of the media were <0.2 mm in diameter compared with <1.3 mm near the bottom of the media. A large difference in grain size distributions between granite and Accusand media was still apparent (Figure 3) even though the backwash procedure had removed much of the silty fraction from the granite loaded columns. This was to be expected because the granite was crushed and then sieved following the crude procedure that was recommended at that time for field installation of BSF [25]. In contrast, the Accusand was carefully sieved by Unimin Corp. into narrow size fractions that were then blended together by the manufacturer [27].
Besides removing silty fines, backwashing of the granite media changed the hydraulic characteristics as shown by comparison of MDI values in Table 5. In Column Test No. 1, the MDI was close to 1.0 in both granite-filled and Accusand-filled columns and this indicates conditions very close to perfect plug flow (i.e., very little longitudinal dispersion). The same was observed from tracer tests on full-scale BSFs [10]. However, the MDI obtained for the granite-filled columns after backwashing increased from 1.3 to greater than 2.2 while it remained the same for the Accusand filled columns. The increase in MDI was most likely due to the development of preferential flow paths as the packing configuration shifted from unstratified (not shown) to stratified (Figure 3).
Figure 3. Sieve analysis of backwashed Accusand and granite media from Column Test No. 2.
Ijerph 12 10276 g003
Table 5. Morrill Dispersion Index (MDI) for tracer tests conducted prior to Column Tests No. 1 and No. 2. MDI of 1.0 corresponds to perfect plug flow; <2.0 is effective plug flow according to EPA (1996).
Replicate
Columns inColumnColumn
Each TestTest No. 1Test No. 2
Granite #11.312.24
Granite #21.312.66
Granite #31.293.10
Accusand #11.161.19
Accusand #21.221.36
Accusand #31.161.25
Backwashing was intended to improve the replicability between parallel columns; it made no discernable difference in replicability and brought a number of other disadvantages. Backwashing caused preferential flow paths through the granite filter bed, causing the filters to operate at hydraulic conditions much further from plug flow than conventionally loaded BSFs. Much of the finest fraction of media was eliminated by backwashing the granite columns; this may have adversely impacted virus reductions as described below. Additionally, stratification of media is not recommended in the current guidance on BSF construction. Backwashing is not recommended for BSF laboratory studies.

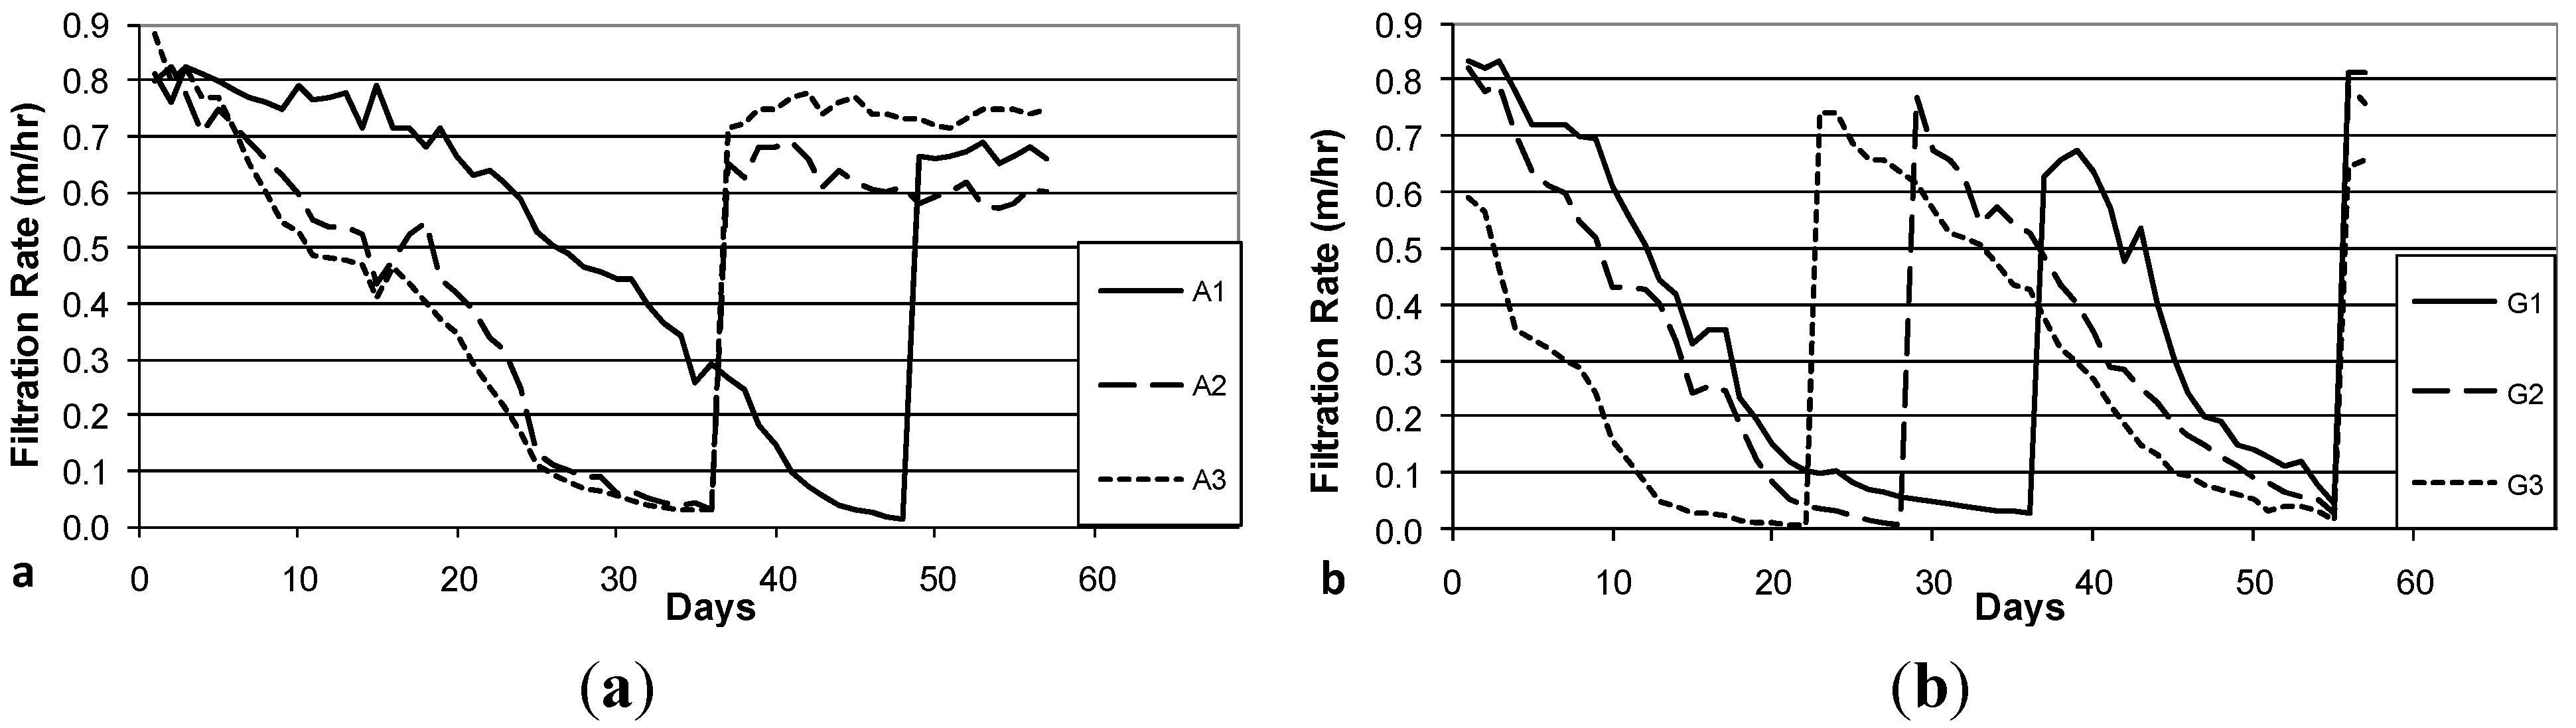
3.3. Decline in Filtration Rate with Filter Operation

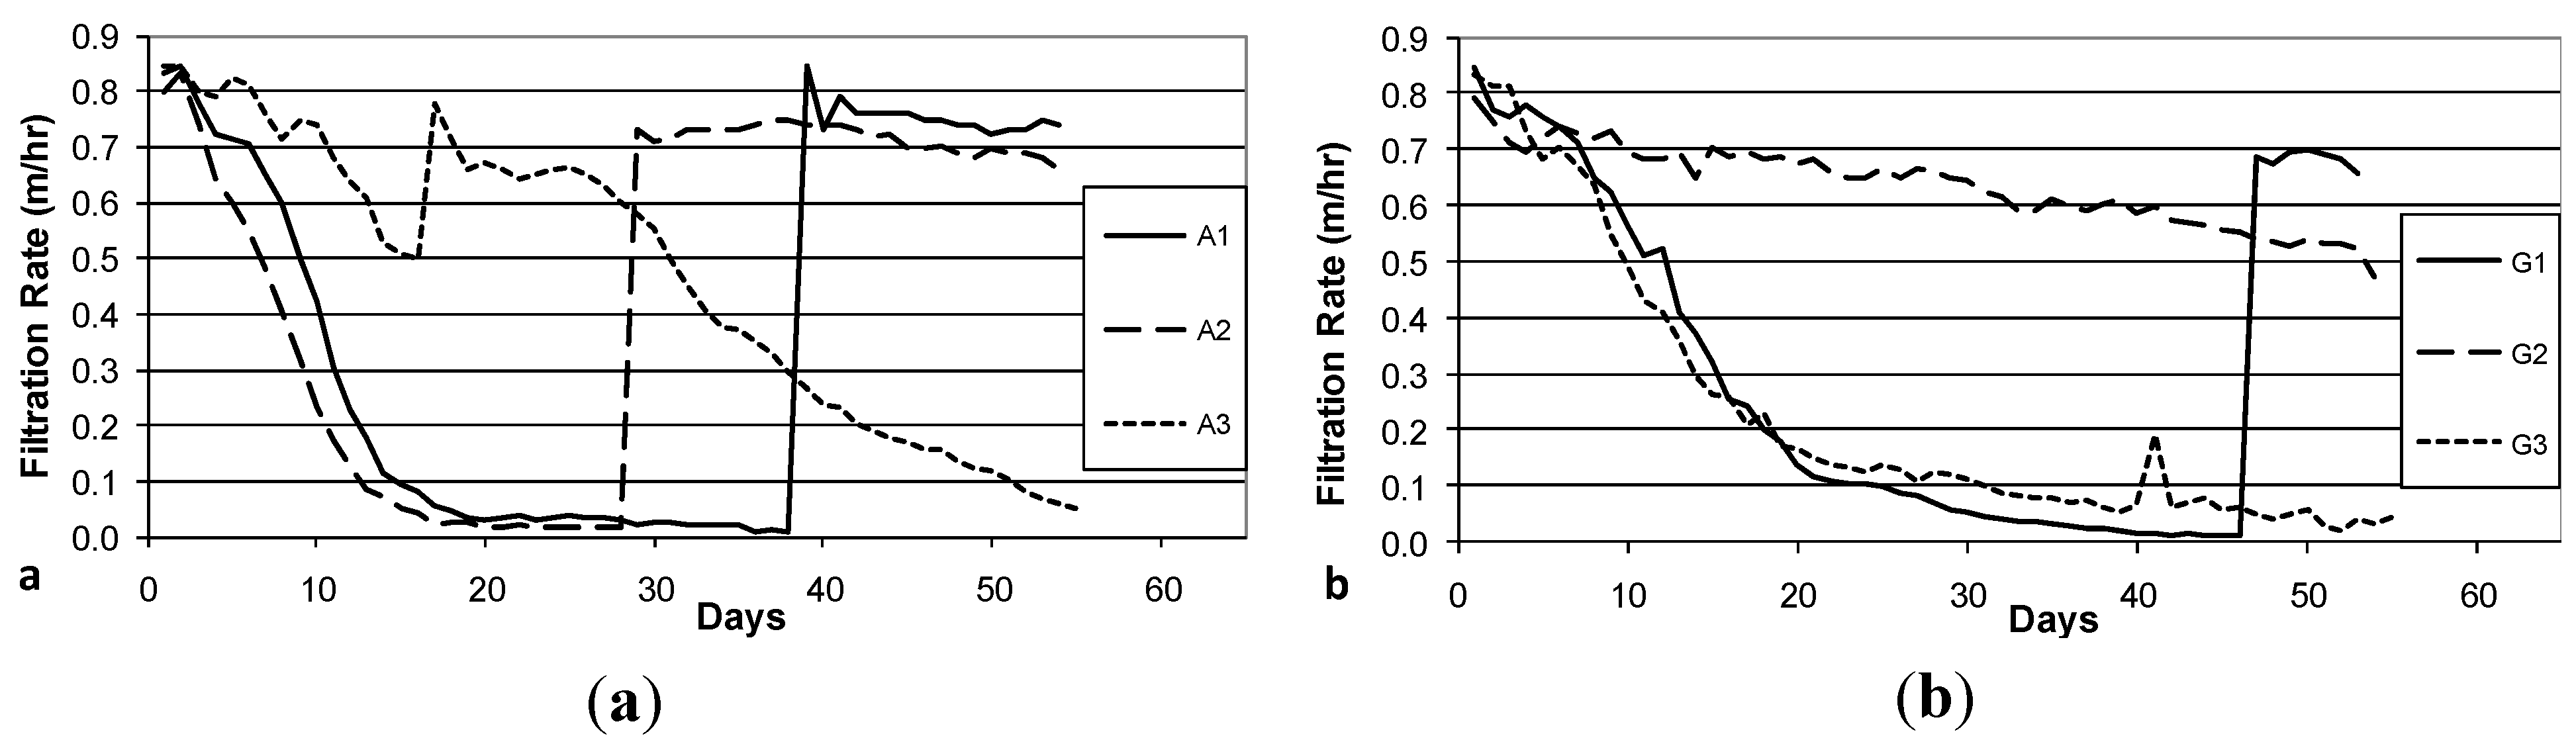
The decline in filtration rate during Column Test No. 1 is presented in Figure 4a (Accusand media) and 4b (granite media). Filter maturation due to growth of the schmutzdecke and particle trapping increases head loss and thus decreases filtration rate. However, head loss did not develop at the same rates in each of the three parallel columns with the same media: the decline was far more rapid in Columns A1 and A2 than in Column A3 and in Columns G1 and G3 than in Column G2. In fact, the filtration rate in Columns A3 and G3 increased briefly (Days 16 and 41, respectively) due to unintentional disturbance of the schmutzdecke during filter charging (this disturbance may have been caused by the shallow depth of standing water, as noted in the Methods section). The surface of the media bed in columns A1, A2 and G1 were intentionally scoured to remove the schmutzdecke when the filtration rate decreased to approximately 10% of the initial maximum. This cleaning procedure produced a rapid increase in filtration rate from less than 0.1 m/h to 0.6–0.9 m/h. As noted in the Methods section, current BSF design guidance calls for filtration rates no greater than 0.4 m/h [24]; these experiments were conducted using the BSF design standards at the time [26].
Figure 4. Initial daily filtration rate during Column Test No. 1. Accusand-loaded filter columns A1-A3 (a); and Granite-loaded filter columns G1-G3 (b). Spikes in filtration rate are due to either intentional removal (cleaning) of the schmutzdecke (A1 day 39, A2 day 29, G1 day 47) or unintentional disturbance of the schmutzdecke during filter loading (A3 day 17, G3 day 41).
Ijerph 12 10276 g004
Figure 5. Initial daily filtration rate during Column Test No. 2. Accusand-loaded filter columns A1-A3 (a); and Granite-loaded filter columns G1-G3 (b). Spikes in filtration rate are due to intentional removal (cleaning) of the schmutzdecke (A1 day 49; A2 day 37; A3 day 37; G1 days 37 and 56; G2 days 29 and 56; G3 days 23 and 56).
Ijerph 12 10276 g005
The decline in filtration rate for each filter column during Column Test No. 2 is presented in Figure 5a (Accusand media), 5b (granite media). The reproducibility of filtration rate decline improved among replicate columns containing the granite media over that observed in Column Test No. 1 (Figure 4b). The improvement could be due to backwashing which may have made the media size more consistent. Filtration rates also seem more reproducible among replicate columns containing Accusand than seen in Column Test No. 1 (Figure 4b) although this may not be explained by backwashing as the grain size for Accusand was relatively uniform (Figure 3).
Despite some variability still evident in Column Test No. 2, the filtration rate decline for columns filled with the granite media appears faster than with the decline for Accusand columns. Head loss development may be more rapid in the granite than Accusand media due to smaller grains sizes of granite near the surface of the column where particles are efficiently entrapped. Particle entrapment may not influence head loss development in the Accusand columns due to larger and more uniform grain size. Instead, head loss development may be caused mainly by microbial growth in the schmutzdecke.
The filtration rate decline, particularly for columns containing Accusand (Figure 4a and Figure 5a), appears slower following the scouring of the schmutzdecke. The implication is retarded regrowth of the schmutzdecke compared to startup of the column test. Microorganisms that contribute to schmutzdecke growth are derived from the feed water. Therefore, one possible explanation for retarded schmutzdecke growth could be microbial inactivation that may have occurred during storage of the feed water for many weeks at 4 °C prior to the scouring event. The granite columns in Test No. 2 recovered head loss after scouring at a similar rate to startup (Figure 5b); it is possible that the much finer grains in the top layer of the backwashed granite (Figure 3) were better able to retain, during scouring, the organisms responsible for schmutzdecke growth.

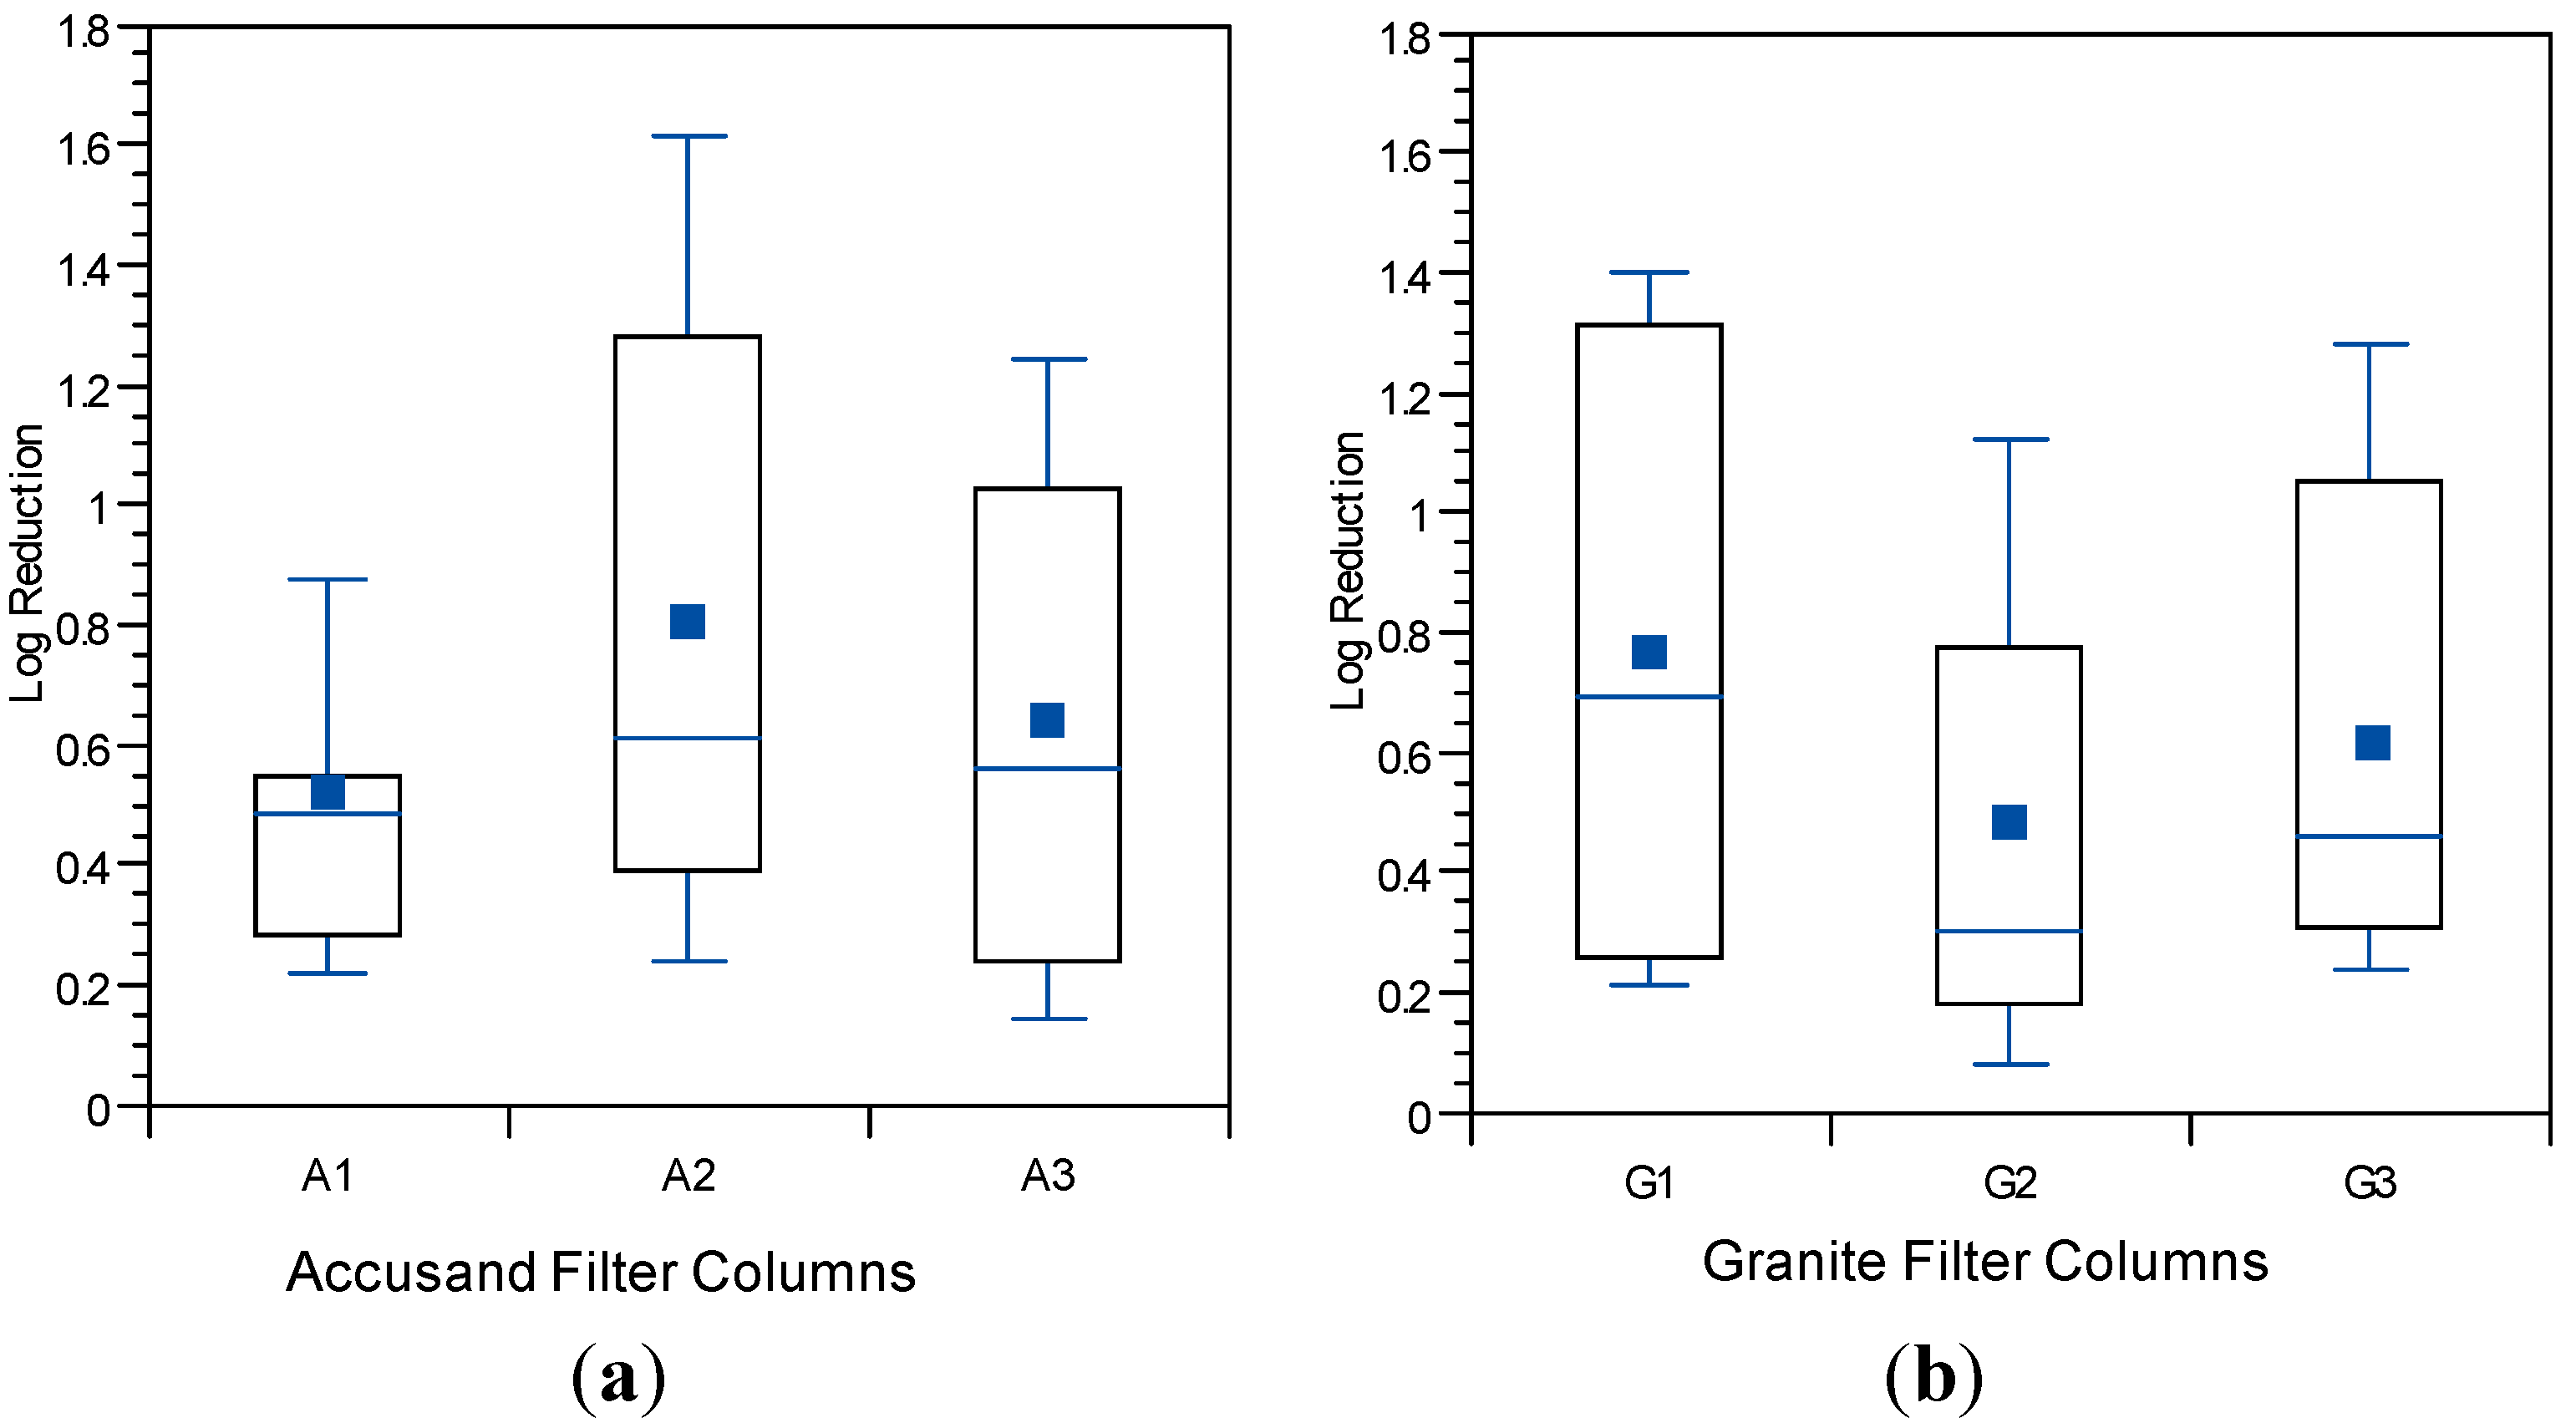
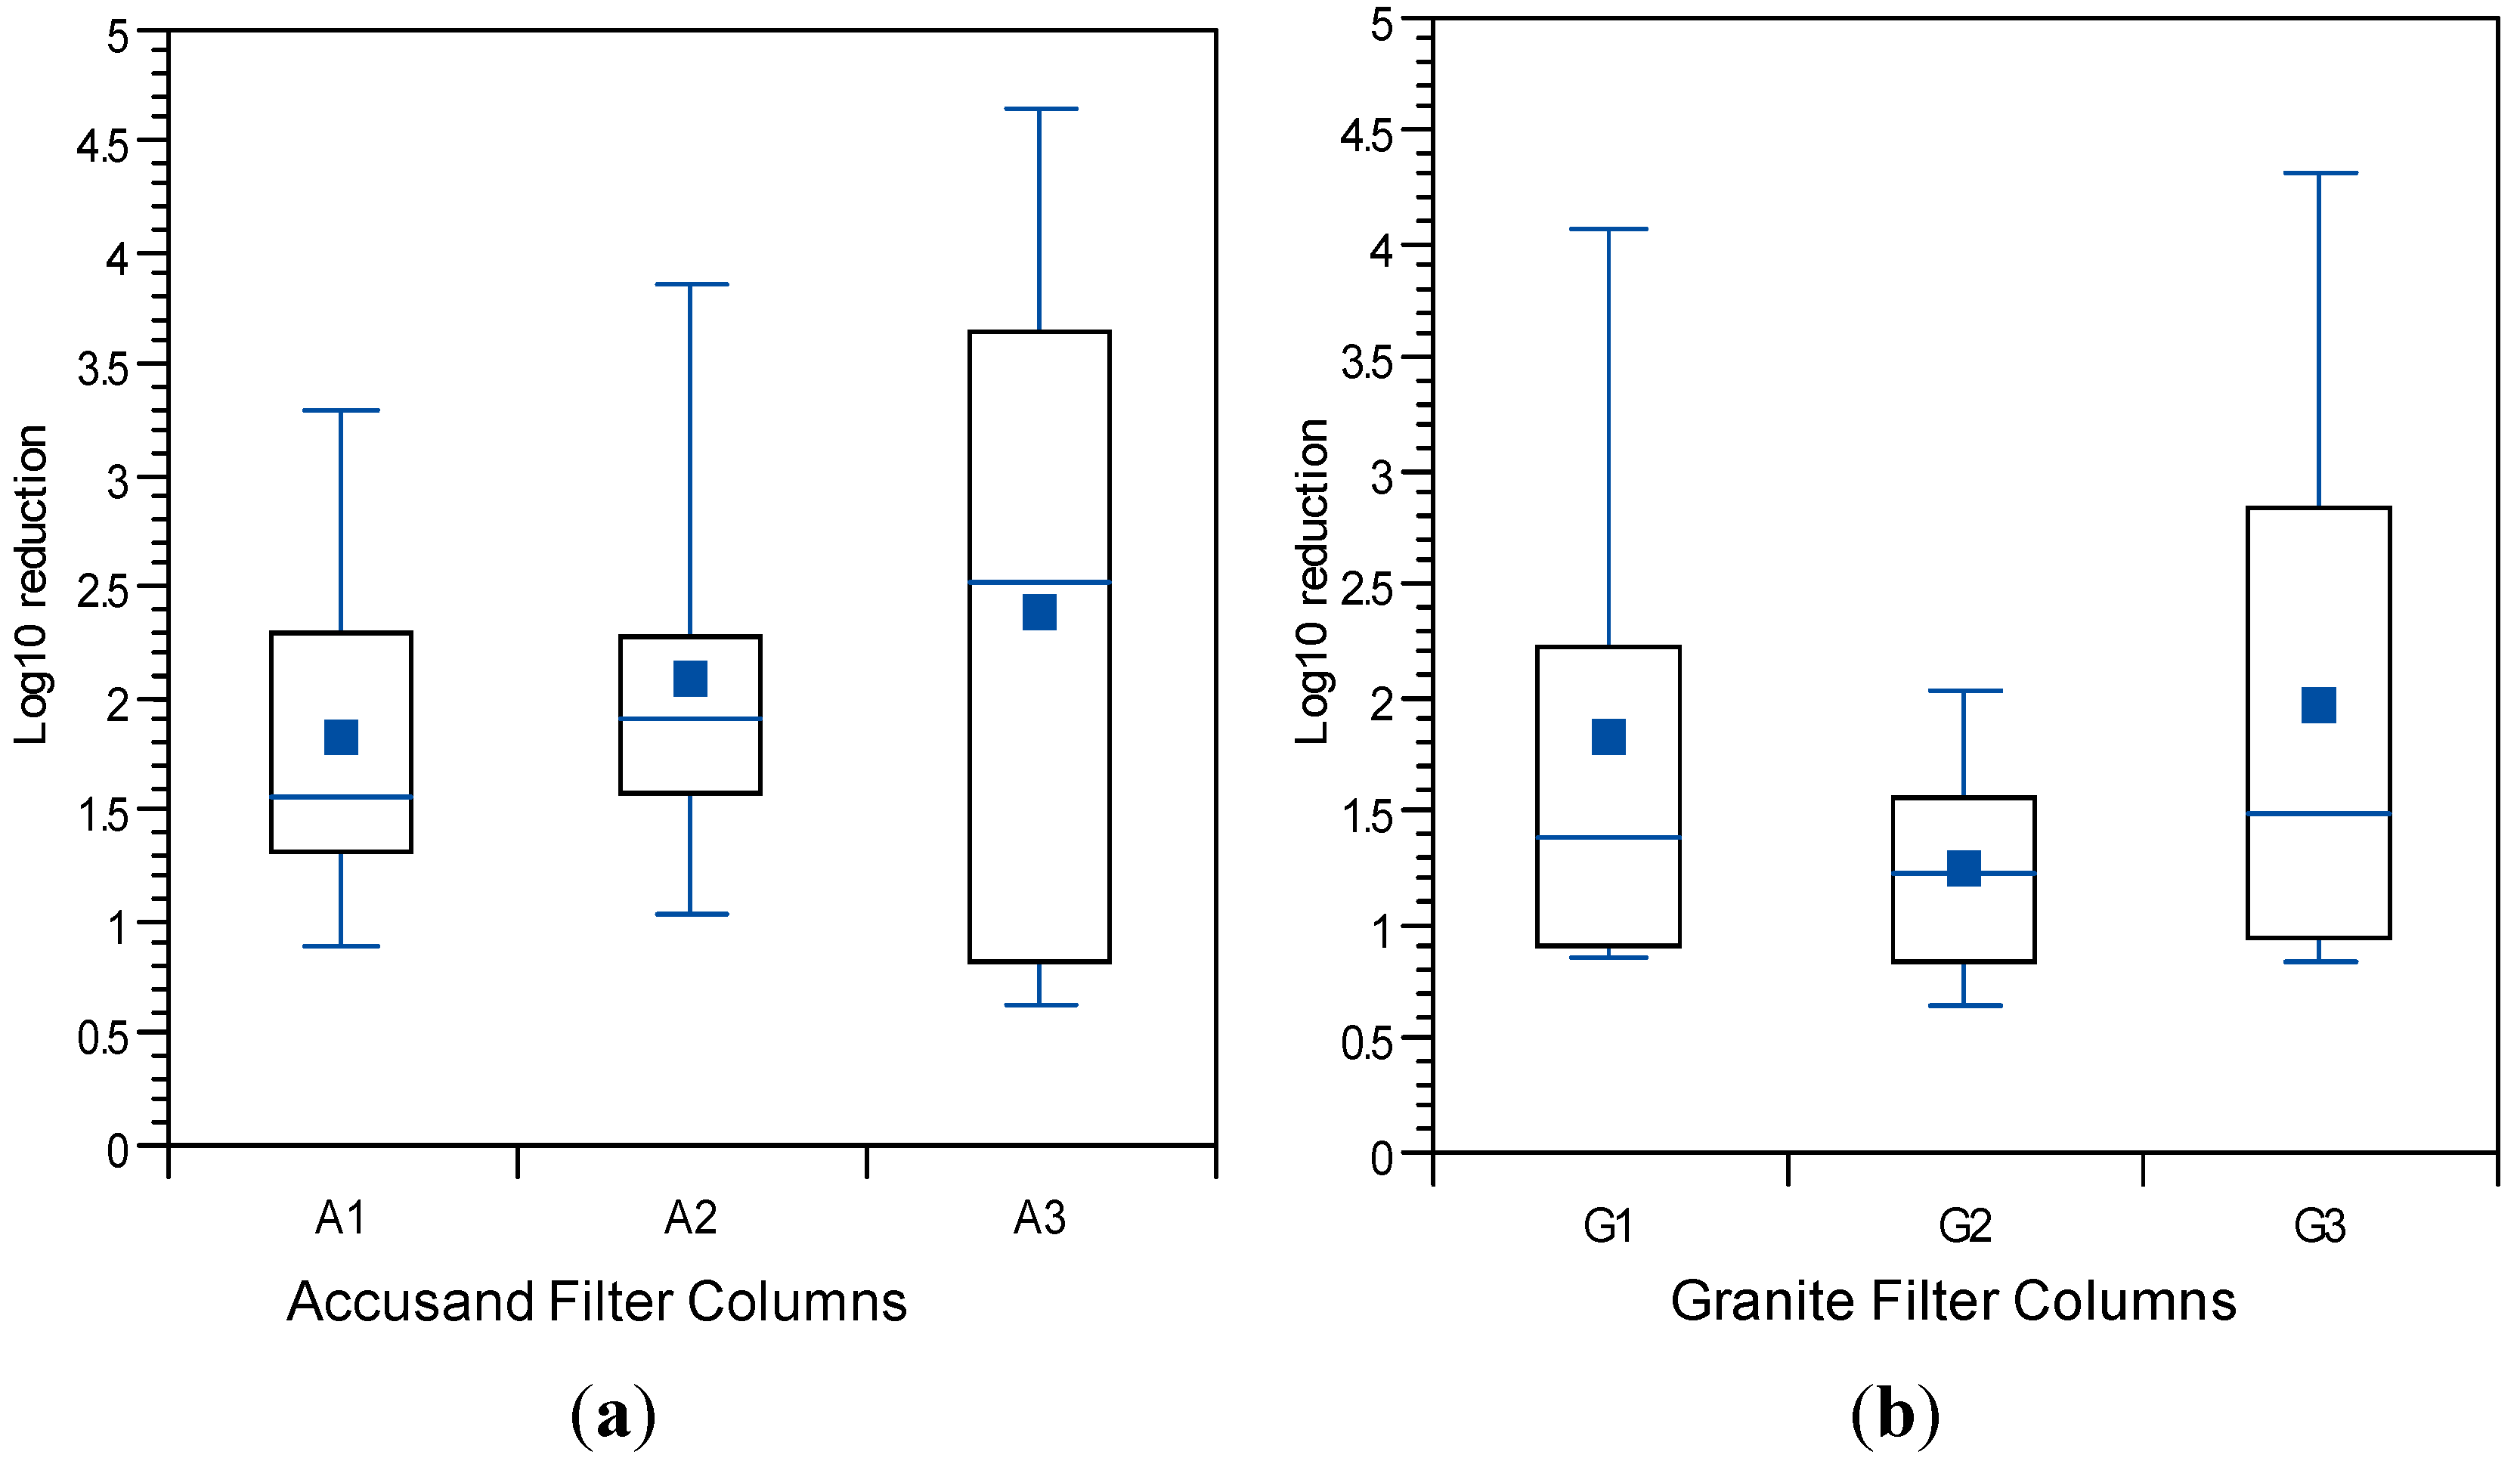
3.4. Reductions in Challenge E. coli

The E. coli reductions from each column over the eight weeks of operation in Column Tests No. 1 and Test No. 2 are summarized in the box and whisker plots shown in Figure 6a (Accusand media) and Figure 6b (granite media) in Column Test No. 1 and in Figure 7a (Accusand media) and Figure 7b (granite media) in Column Test No. 2. Reductions ranged from less than 1-log to greater than 5-log and the variability is both within each column and among replicate columns. Maturation is primarily responsible for variability within each column. Variability among columns containing the same media could be due to differences in head loss development, as indicated by differences in filtration rate decline (Figure 4 and Figure 5); increases in filtration rate indicate either intentional removal or unintentional disturbance of the schmutzdecke as noted in the figures.
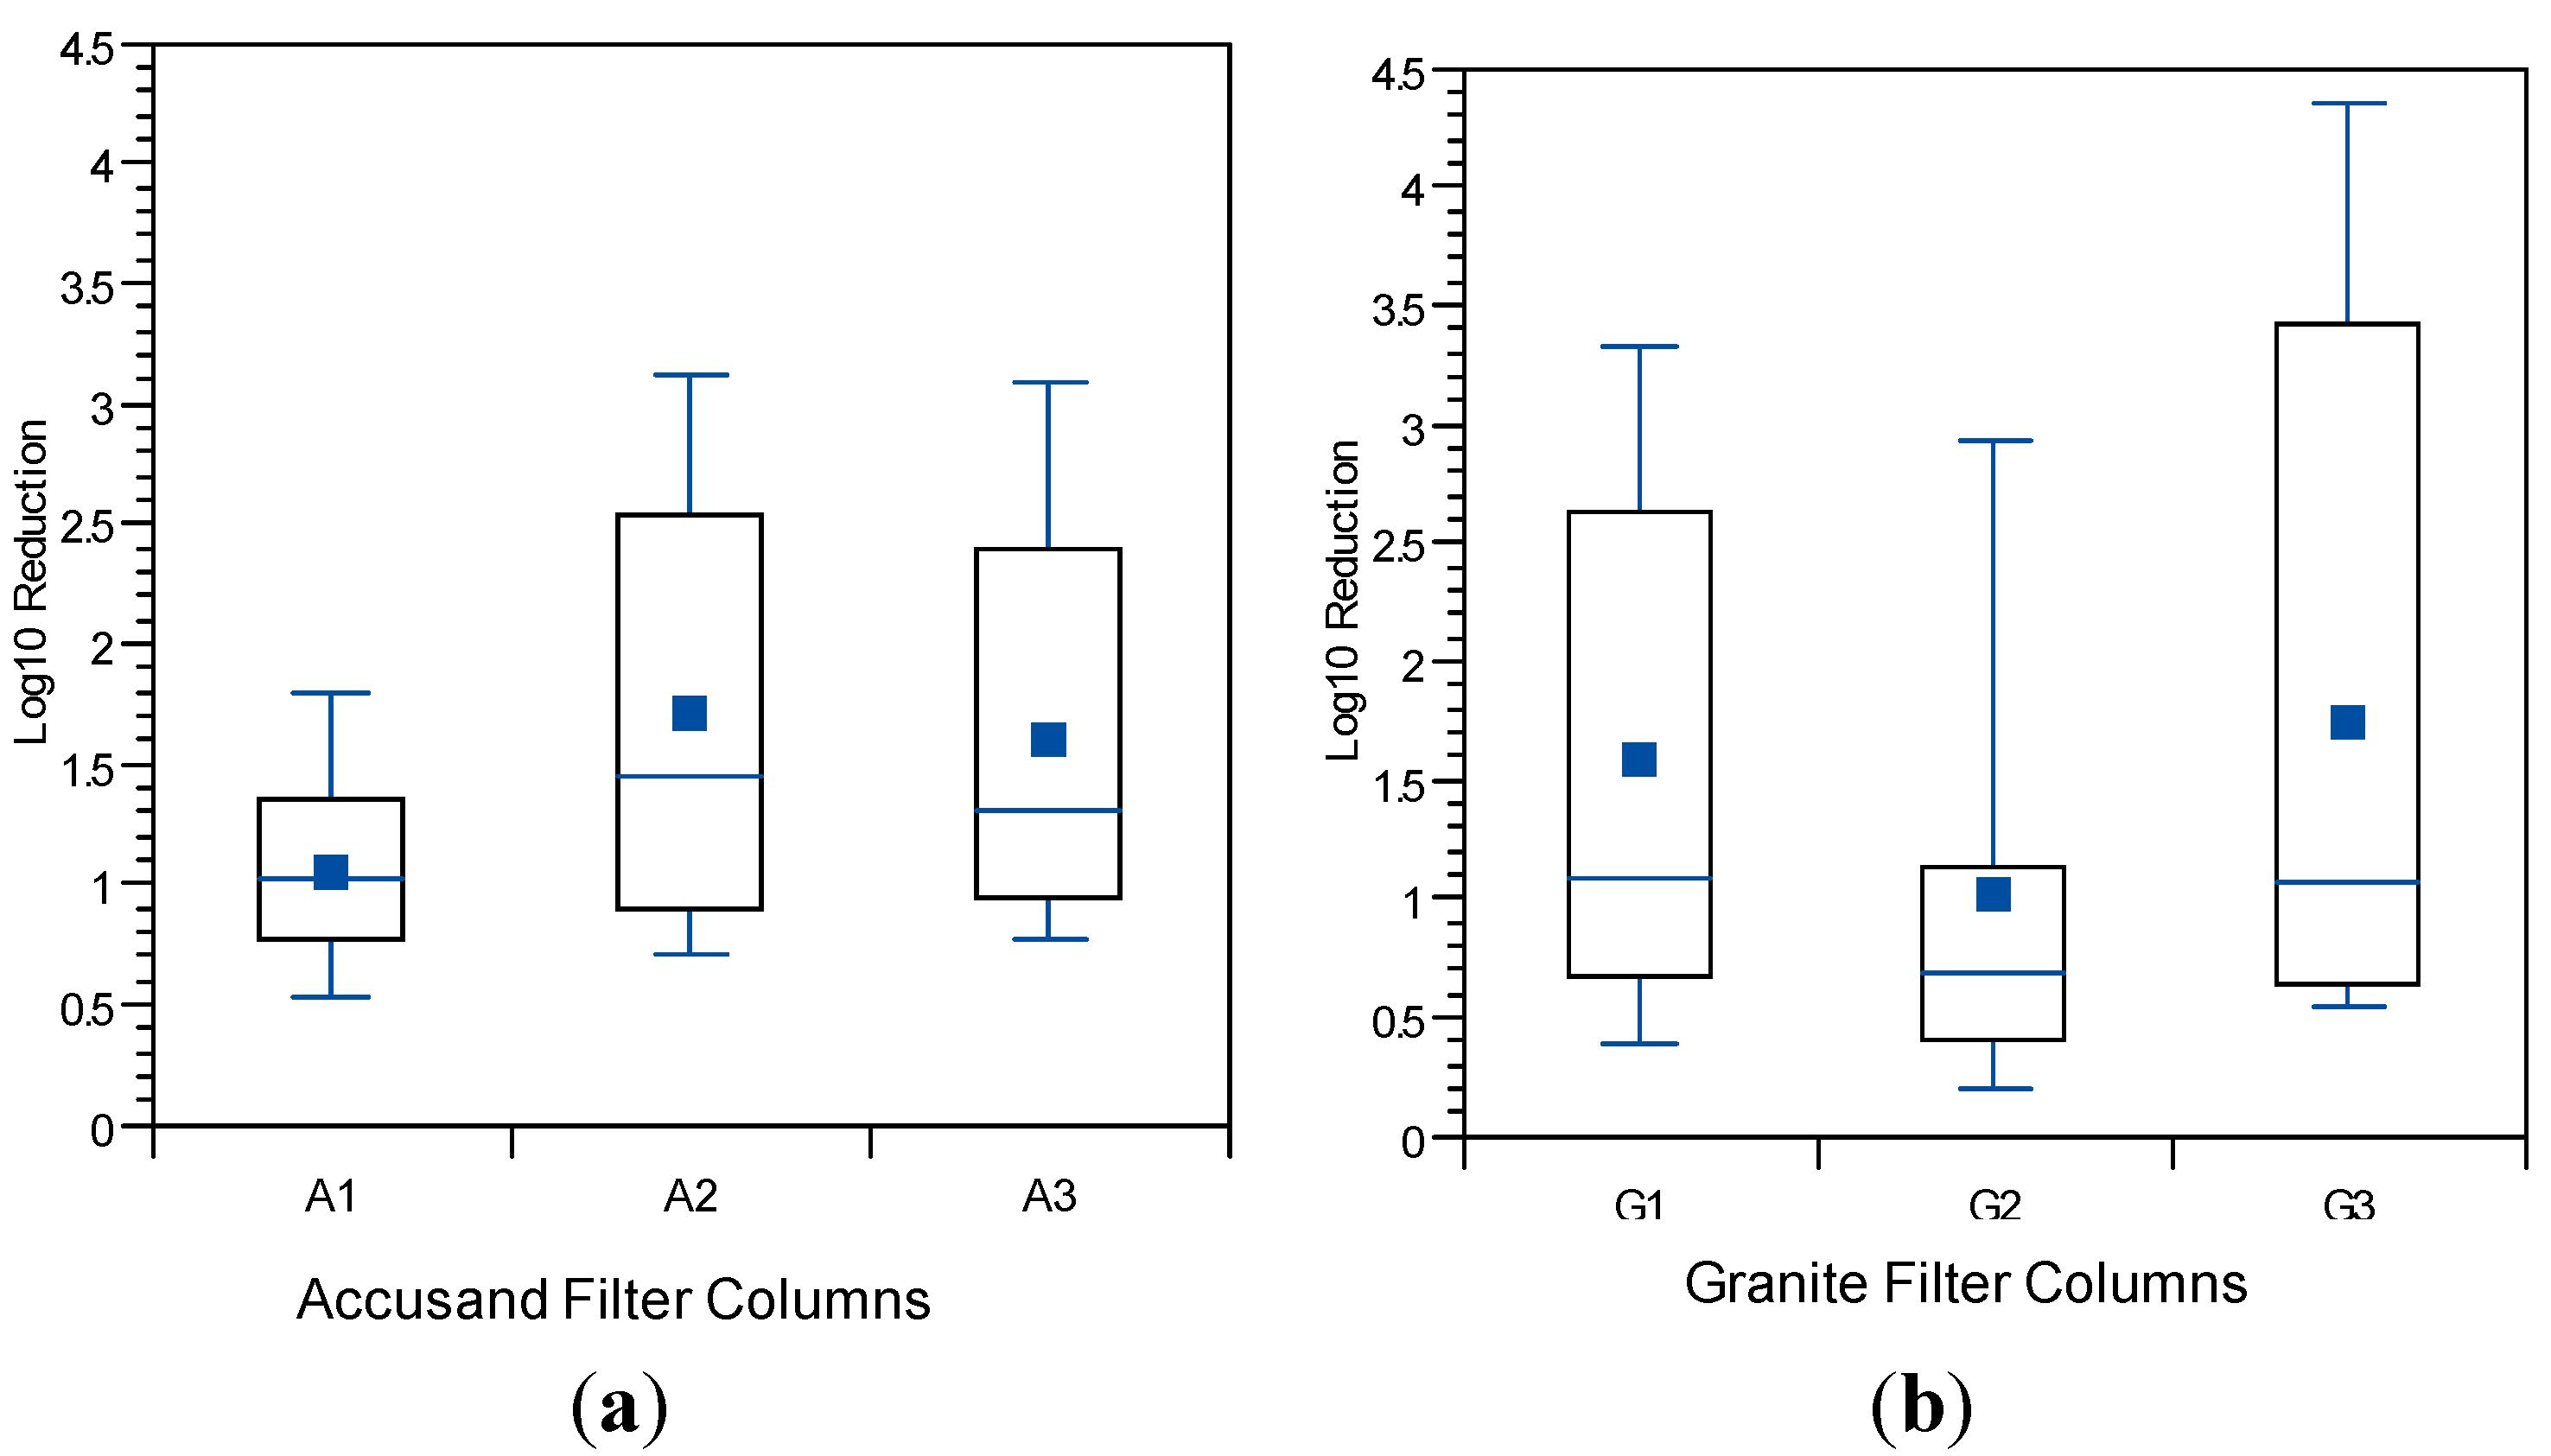
The effect of filtration media on E. coli reduction can be qualitatively compared through box and whisker plots in Figure 6a,b (Column Test No. 1) and in Figure 7a,b (Column Test No. 2). No significant differences in E. coli reductions were found between the two media types in either Column Test No. 1 (p = 0.11) or Test No. 2 (p = 0.965). The box and whisker plots show that the range in reductions over each column experiment were similar for the Accusand and granite media despite the fact that the (1) the granite was much more angular and (2) metals content was at least two orders of magnitude higher for granite than the Accusand media (Table 4). Increased angularity can lead to increased straining and wedging of colloids in saturated media [42]. Metals in the form of iron and aluminum oxide as well as hydroxide coatings have been shown to enhance bacterial reductions [43,44]. However, the chemical form of the iron and aluminum on the surface of the granite media is unknown. Additionally, dissolved organic matter commonly found in surface waters has been shown to block the metal oxide and hydroxide sites that can sorb E. coli [45]. Therefore, while enhanced bacterial reduction due to metal oxides and hydroxides is possible, it likely to be short-lived and sensitive to feed water quality.
Figure 6. E. coli reductions for (a) Accusand-filled columns; and (b) granite-filled columns in Column Test No. 1 for samples collected throughout the eight-week experiment. N = 10 for G3; 11 for A1, A2 and G1; 12 for A3; 13 for G2.
Ijerph 12 10276 g006
Figure 7. E. coli reductions for (a) Accusand-filled columns; and (b) granite-filled columns in Column Test No. 2 for samples collected throughout the eight-week experiment. N = 17 for G2; 18 for A1; 19 for A2; 20 for G1, G3 and A3.
Ijerph 12 10276 g007
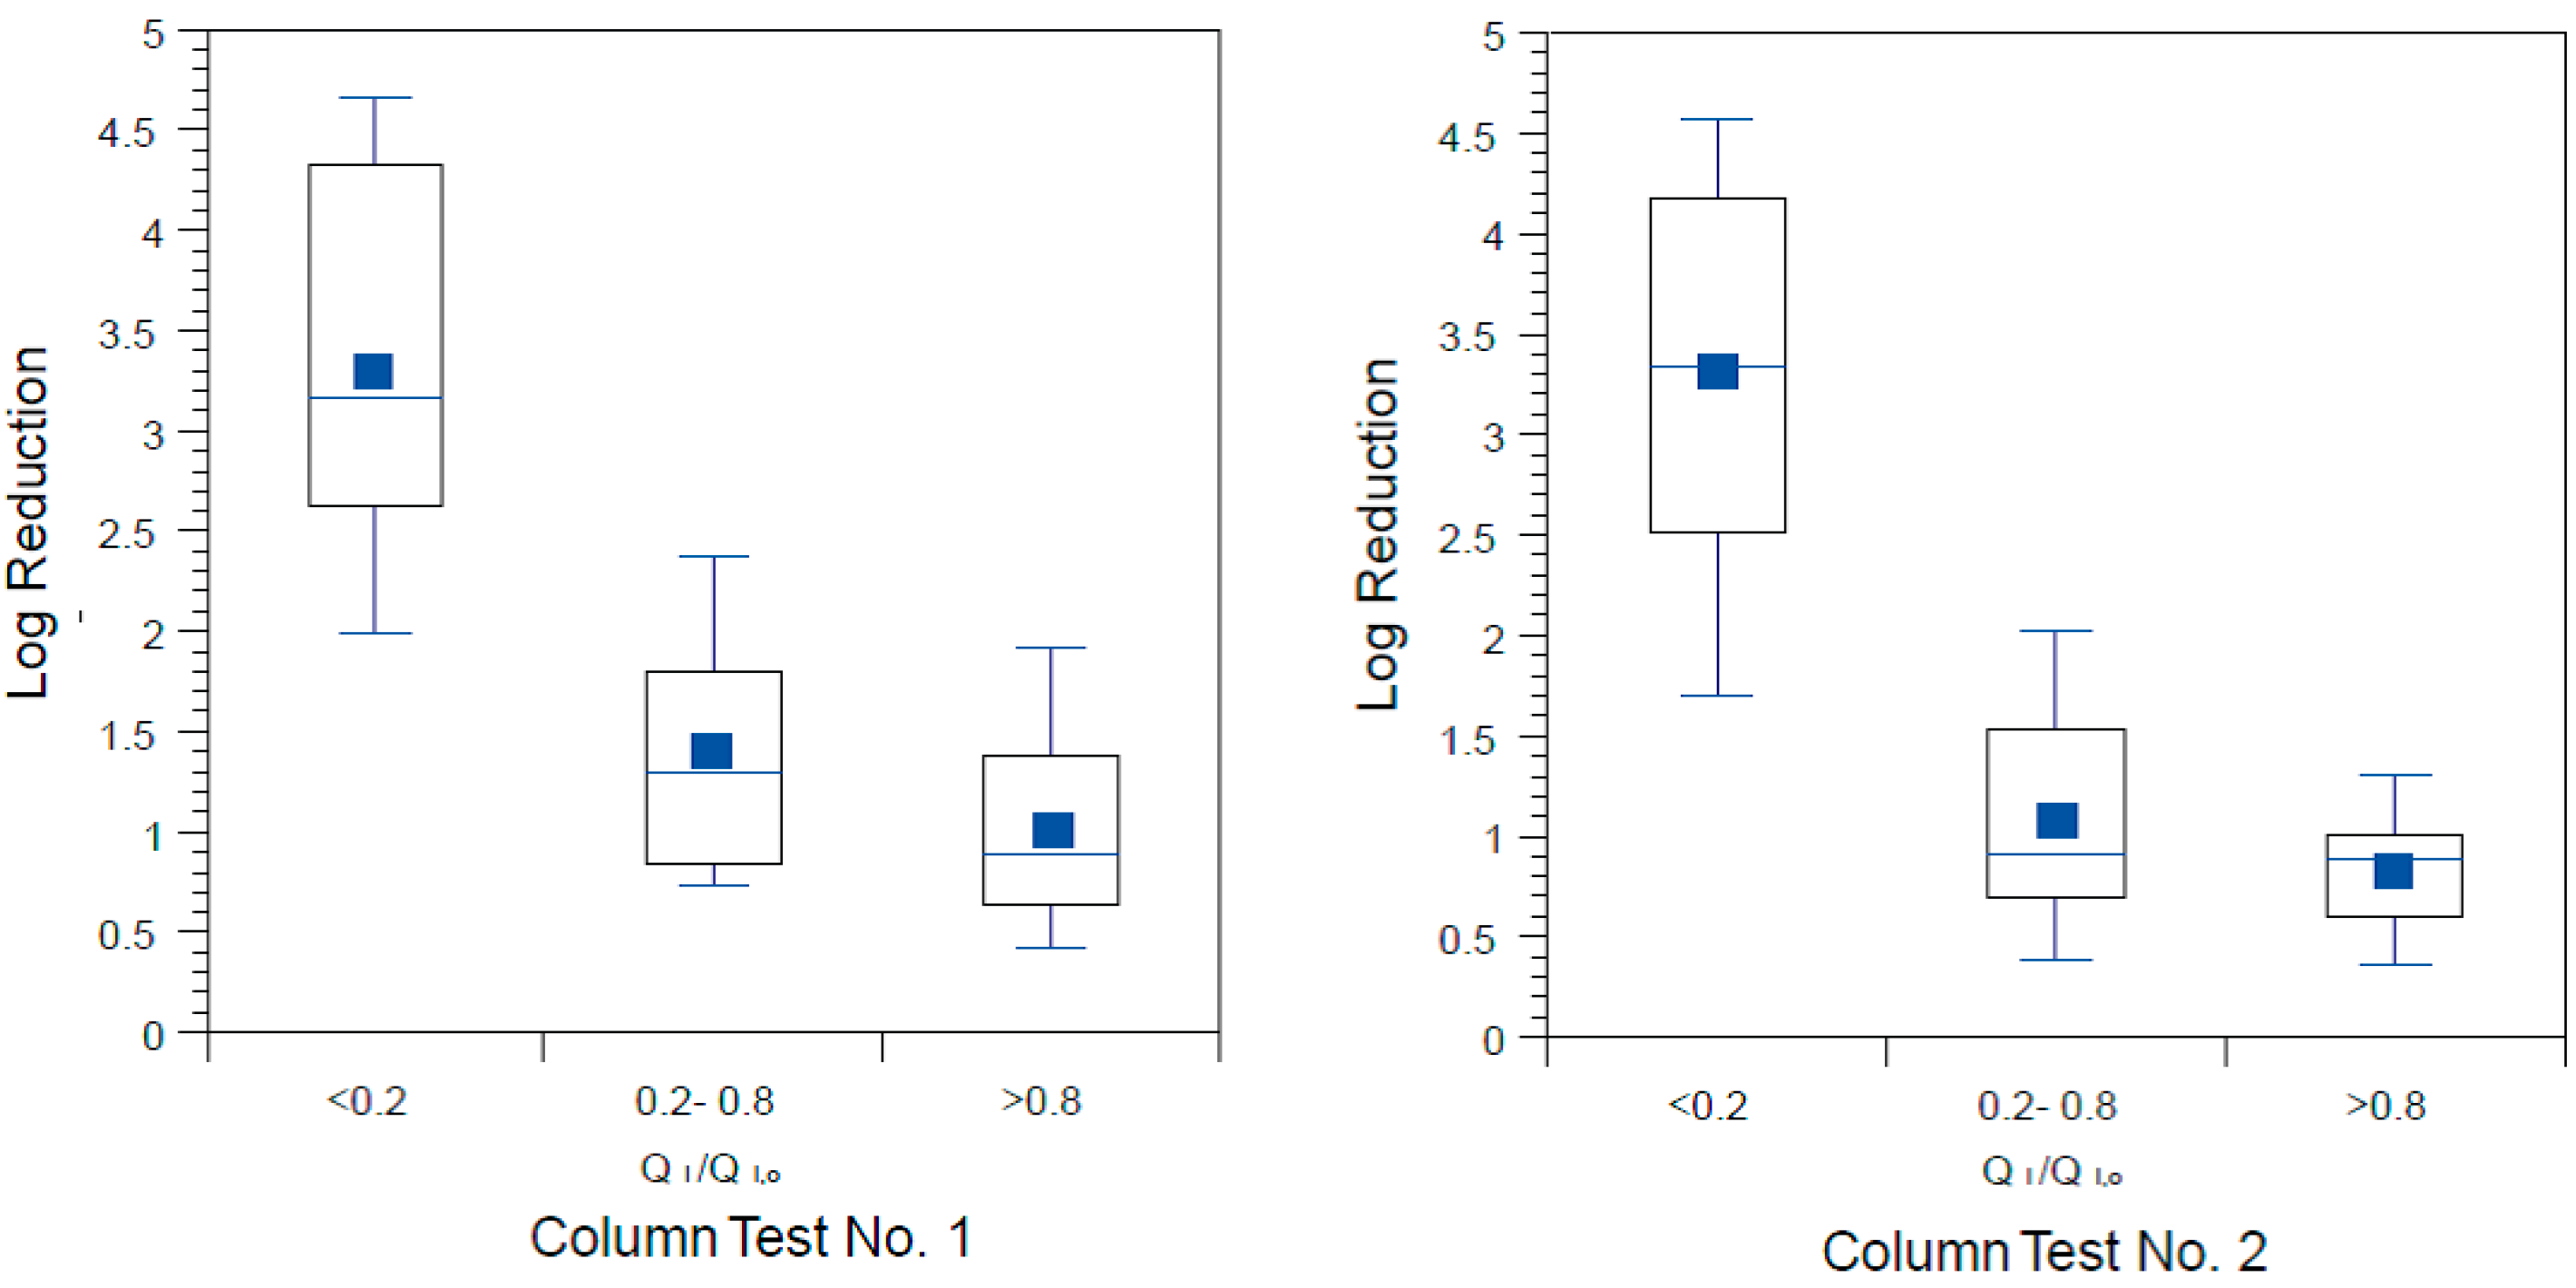
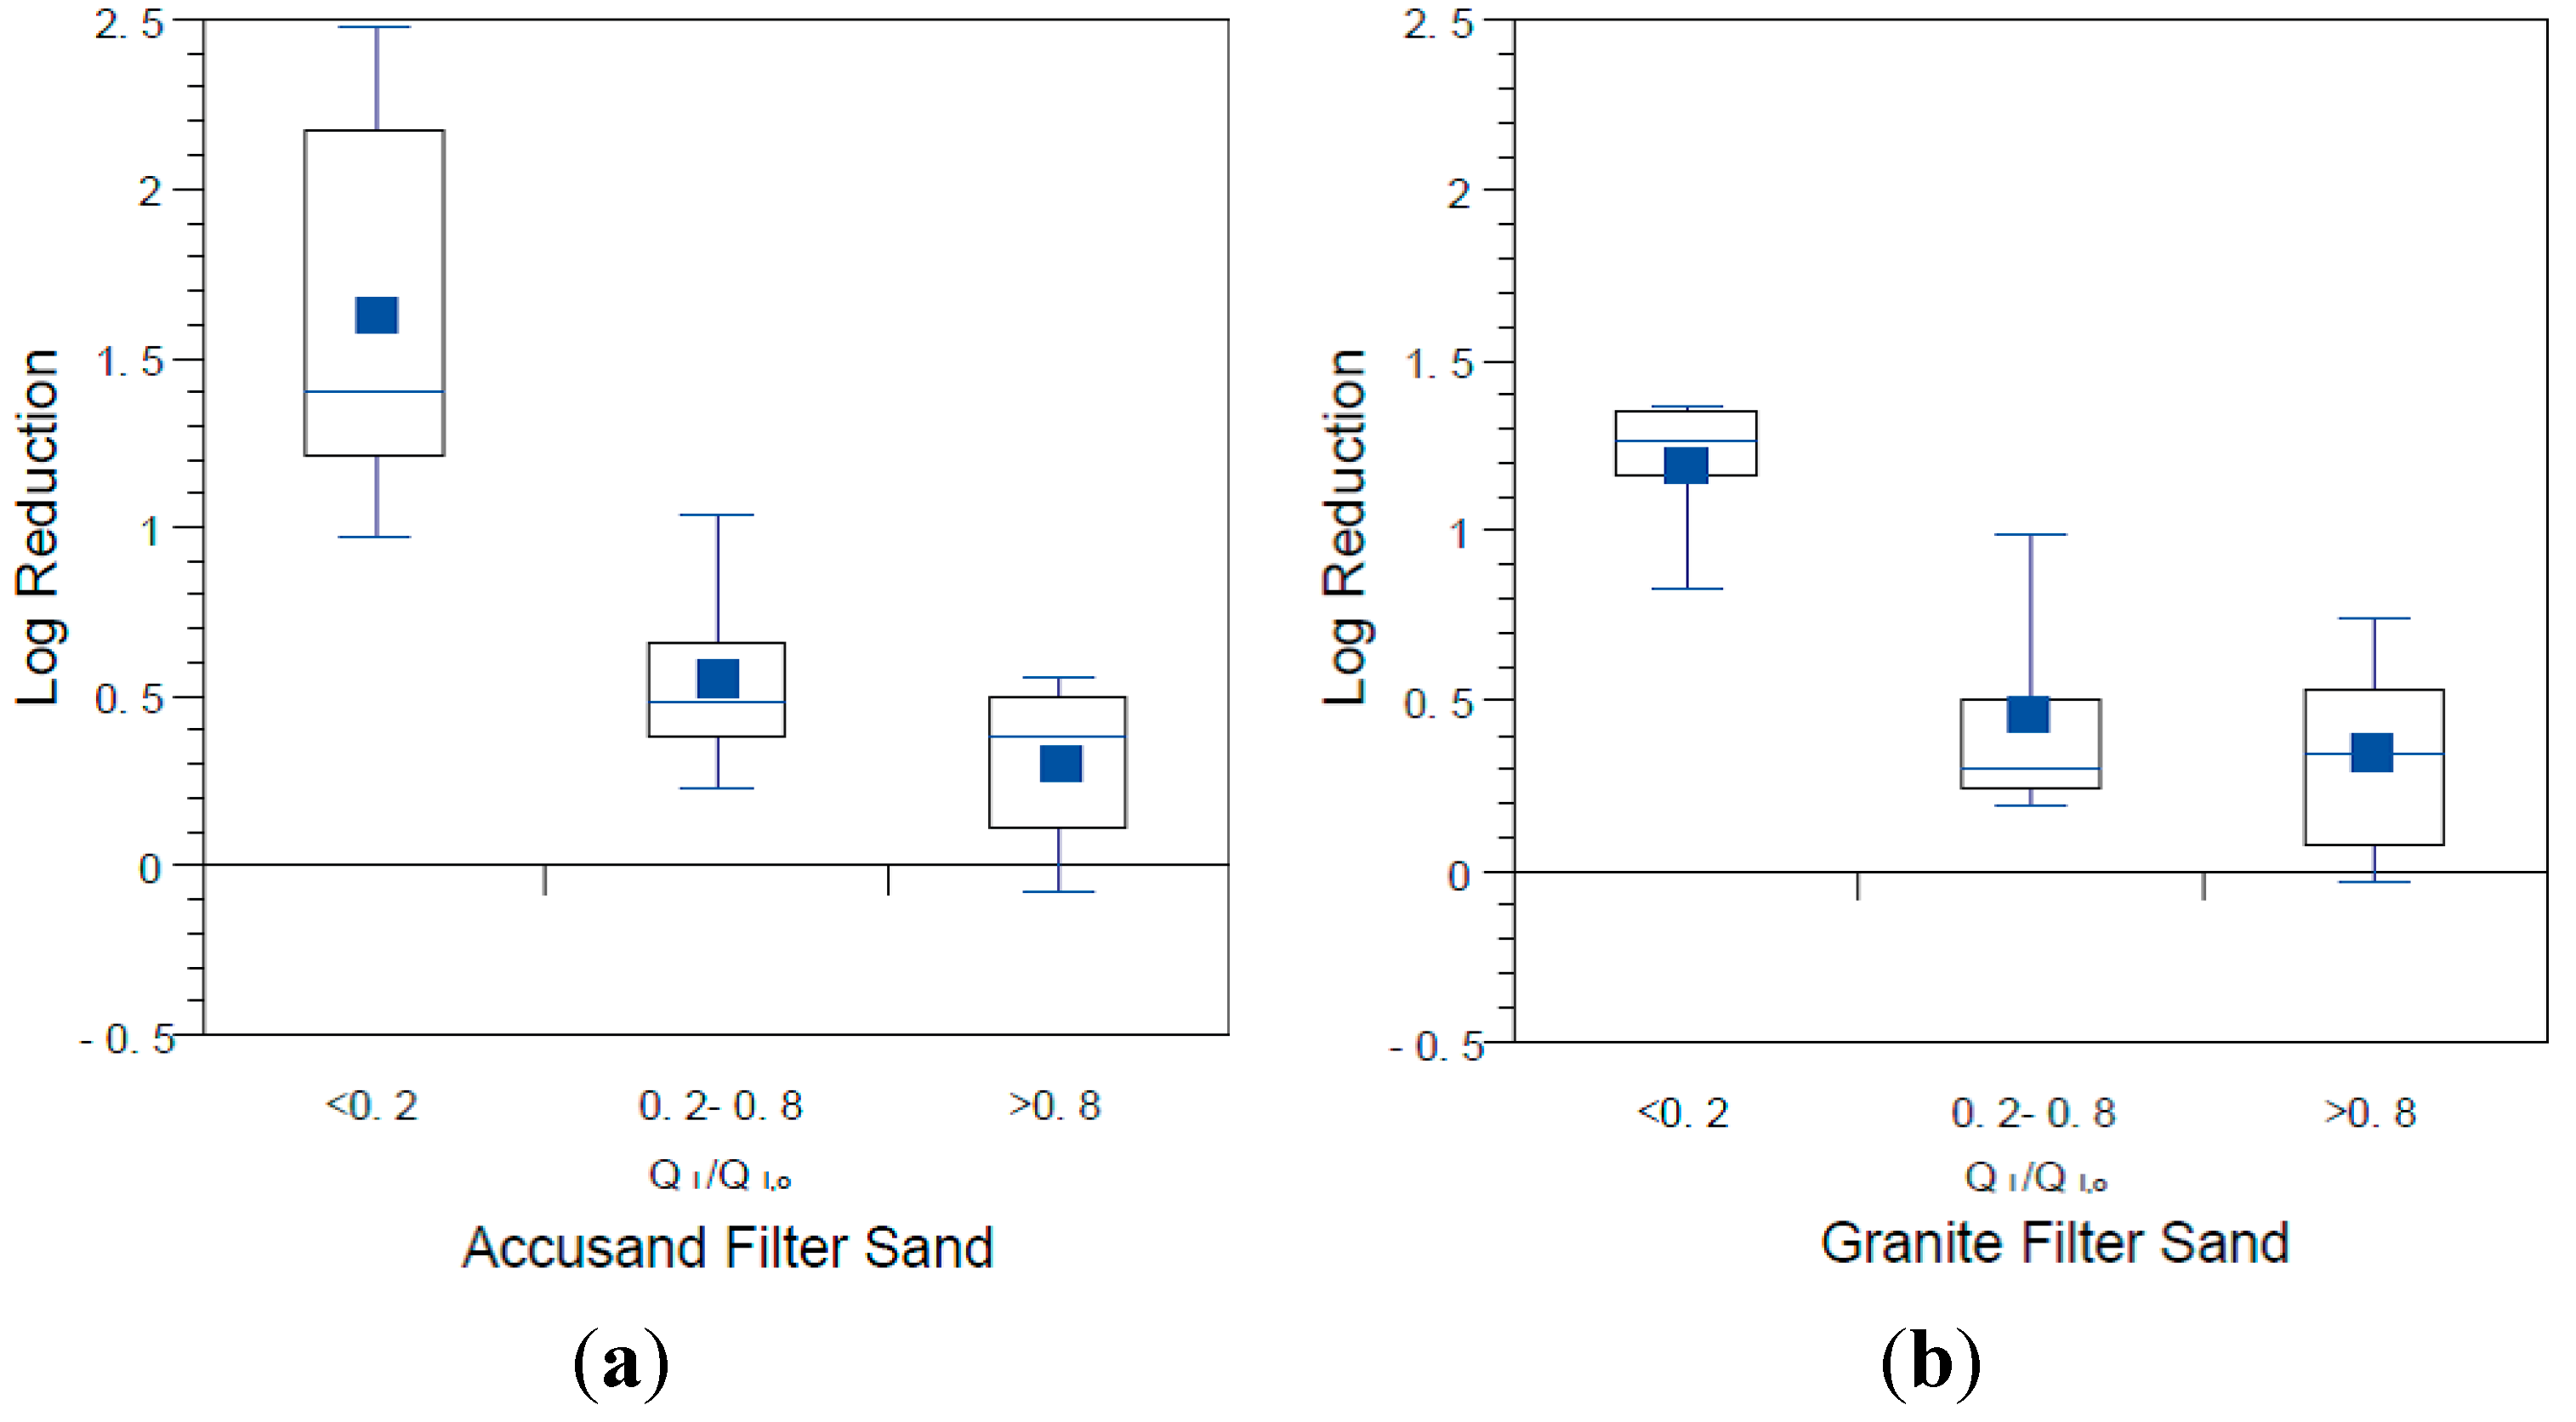
The influence of schmutzdecke development on E. coli reductions in Column Tests No. 1 and No. 2 is shown in Figure 8a,b, respectively. In these box and whisker plots, the extent of schmutzdecke development is expressed by normalized filtration rate, QI/QI,o where QI is the initial daily filtration rate (i.e., upon introduction of the daily charge) for each day and QI,o is the initial daily filtration rate on the first day of operation. Normalized filtration rates during the eight weeks of operation were classified into three bins as shown in the figures. The largest QI/QI,o bin (values greater than 0.8) represents samples taken during the stages of column operation without a substantial schmutzdecke (the earliest samples and those shortly after schmutzdecke scouring) while the smallest QI/QI,o bin (values less than 0.2) represents stage of column operation when the schmutzdecke is fully formed. Log reductions of E. coli increased substantially as QI/QI,o declined, as illustrated in Figure 8; comparing samples collected on days with QI/QI,o > 0.2 to those < 0.2 yielded a highly significant difference for both Accusand and granite columns (p < 0.0001). These results demonstrate the importance of schmutzdecke growth for increasing microbial reductions through (1) physical straining and/or (2) decreasing flow rate (caused by increased head loss) leading to more efficient depth filtration. Physical straining is likely to be important given that the top few centimeters of media surface where the schmutzdecke develops has been shown to be responsible for enhanced bacterial reductions [46,47]. Furthermore, it has been reported that slowing the flow rate by using an outlet valve also improved E. coli reductions [14]. However, the relative contributions of these two mechanisms of bacterial reductions require further investigation.
Figure 8. E. coli reductions in Column Test No. 1 and Column Test No. 2 organized by bins of normalized filtration rate where QI is the initial daily filtration rate on each day of charging the column and QI,o is the comparable initial filtration rate on the first day. N for Column Test No. 1: 14 for <0.2, 13 for 0.2–0.8, 23 for >0.8. N for Column Test No. 2: 15 for <0.2, 34 for 0.2–0.8, 30 for >0.8.
Ijerph 12 10276 g008

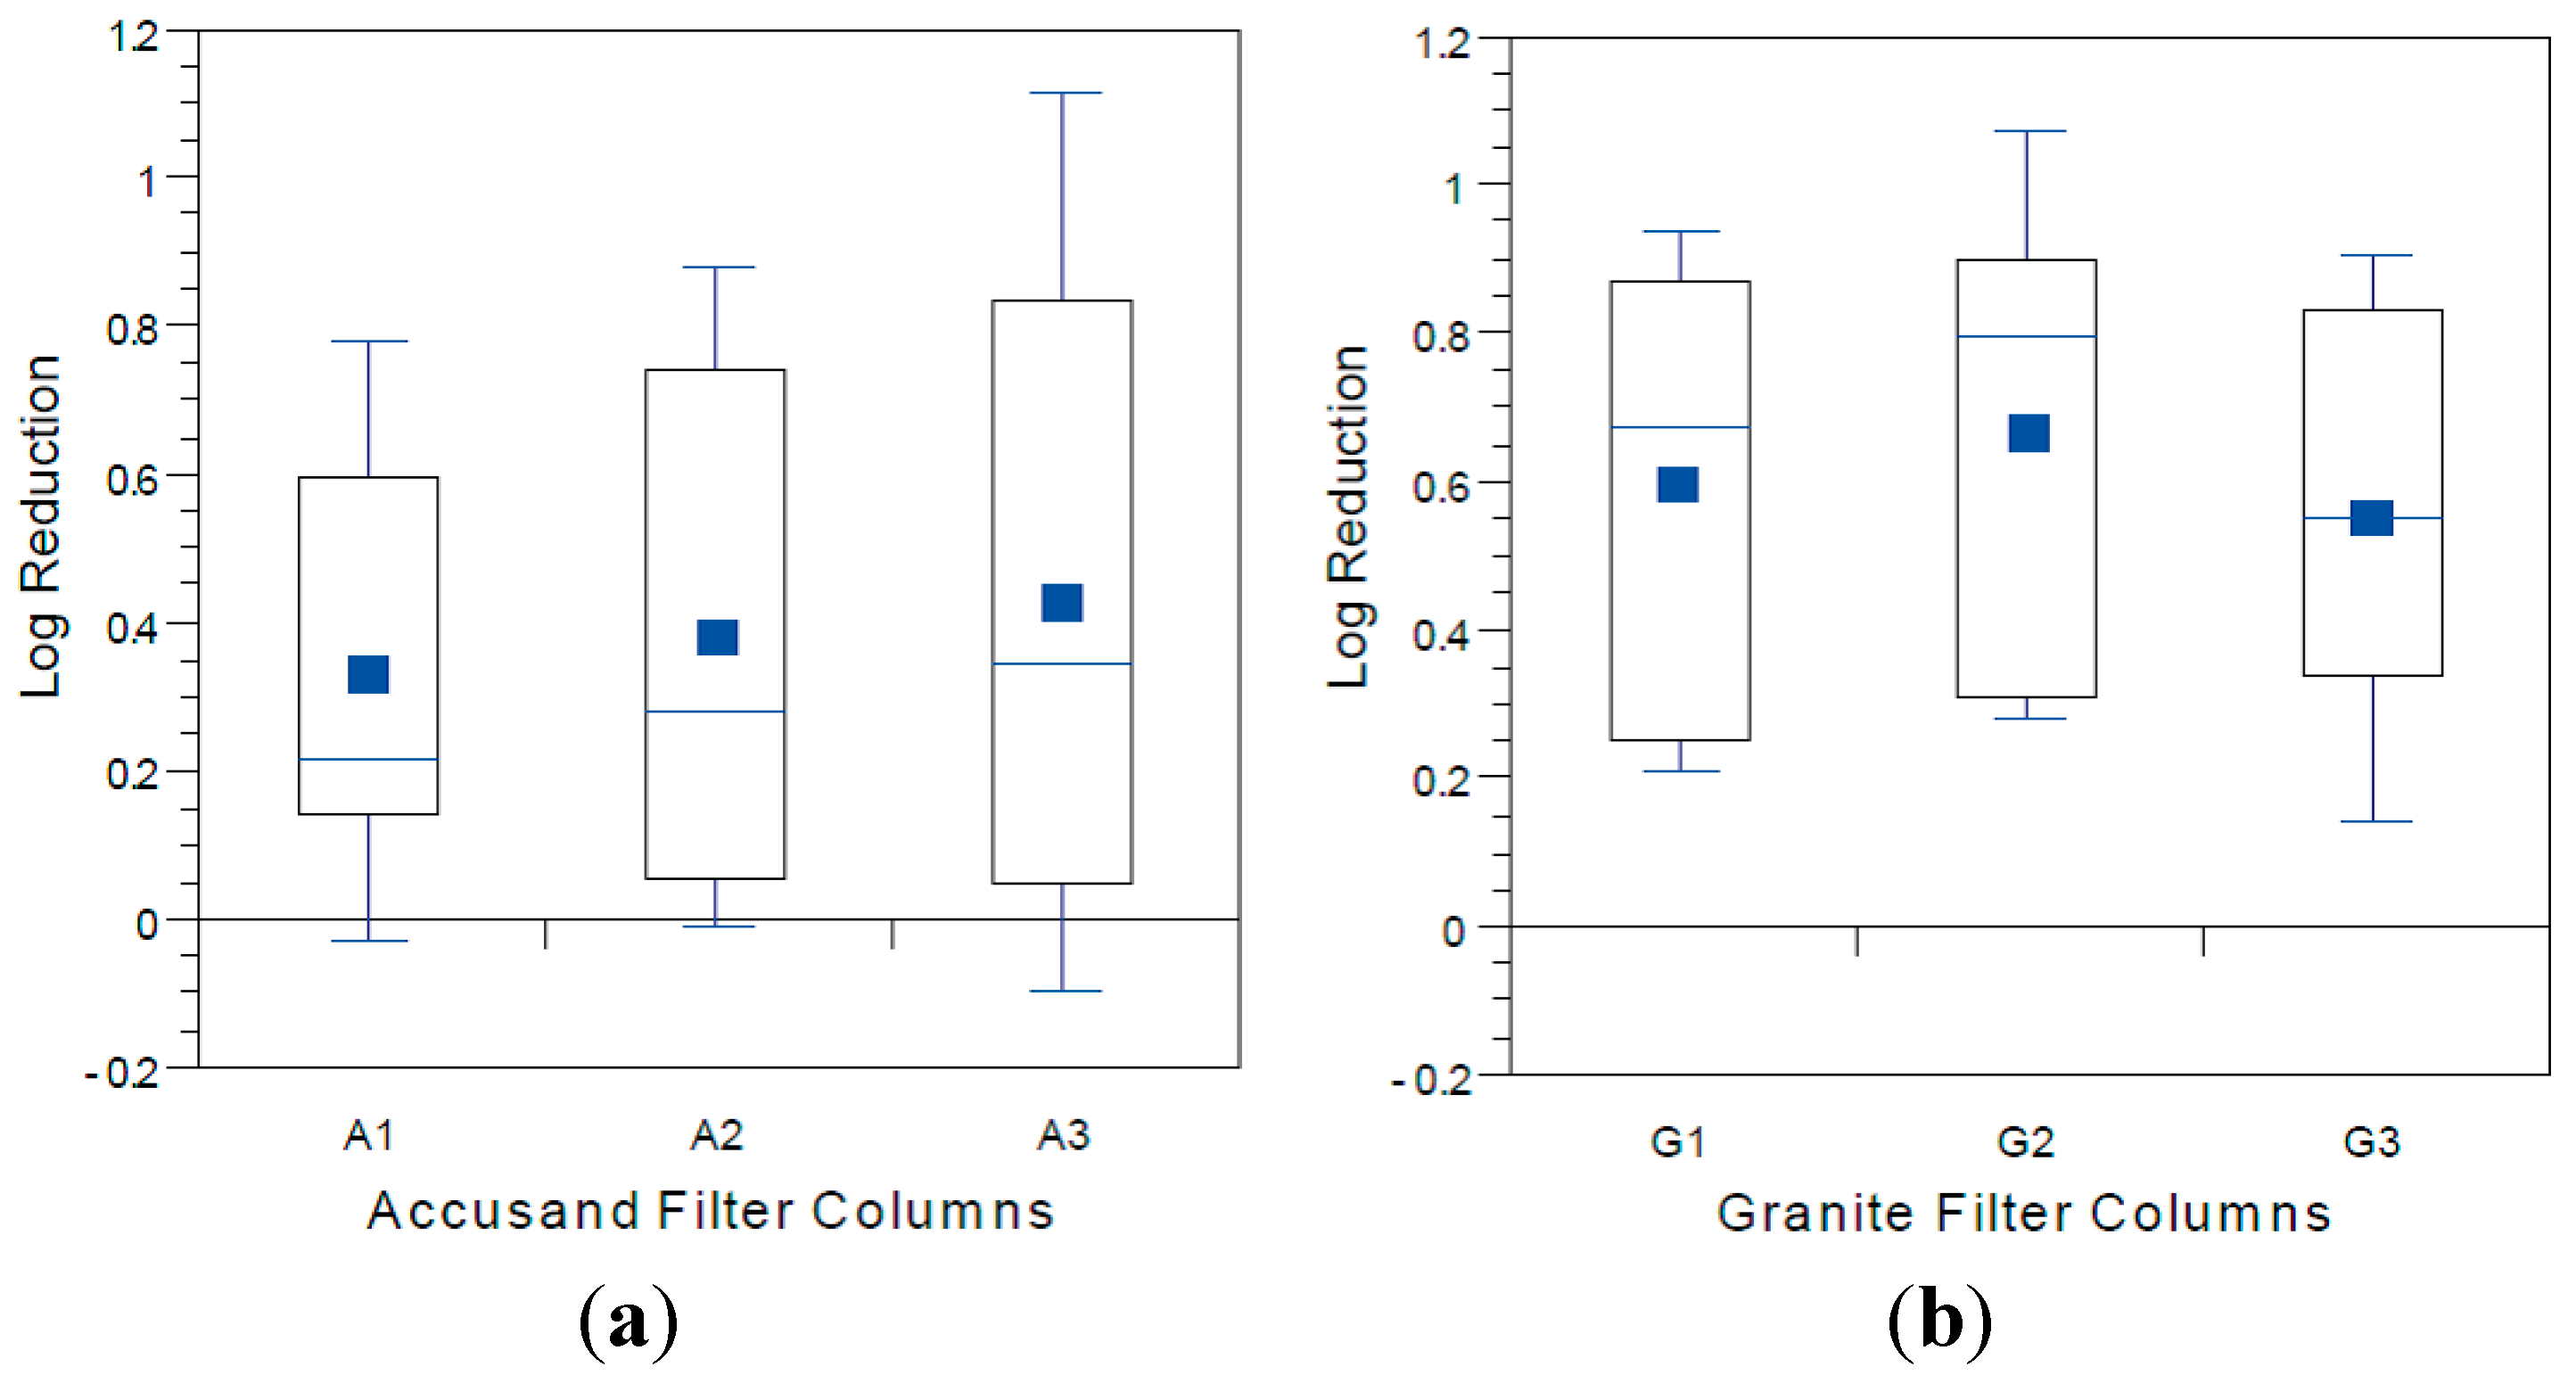
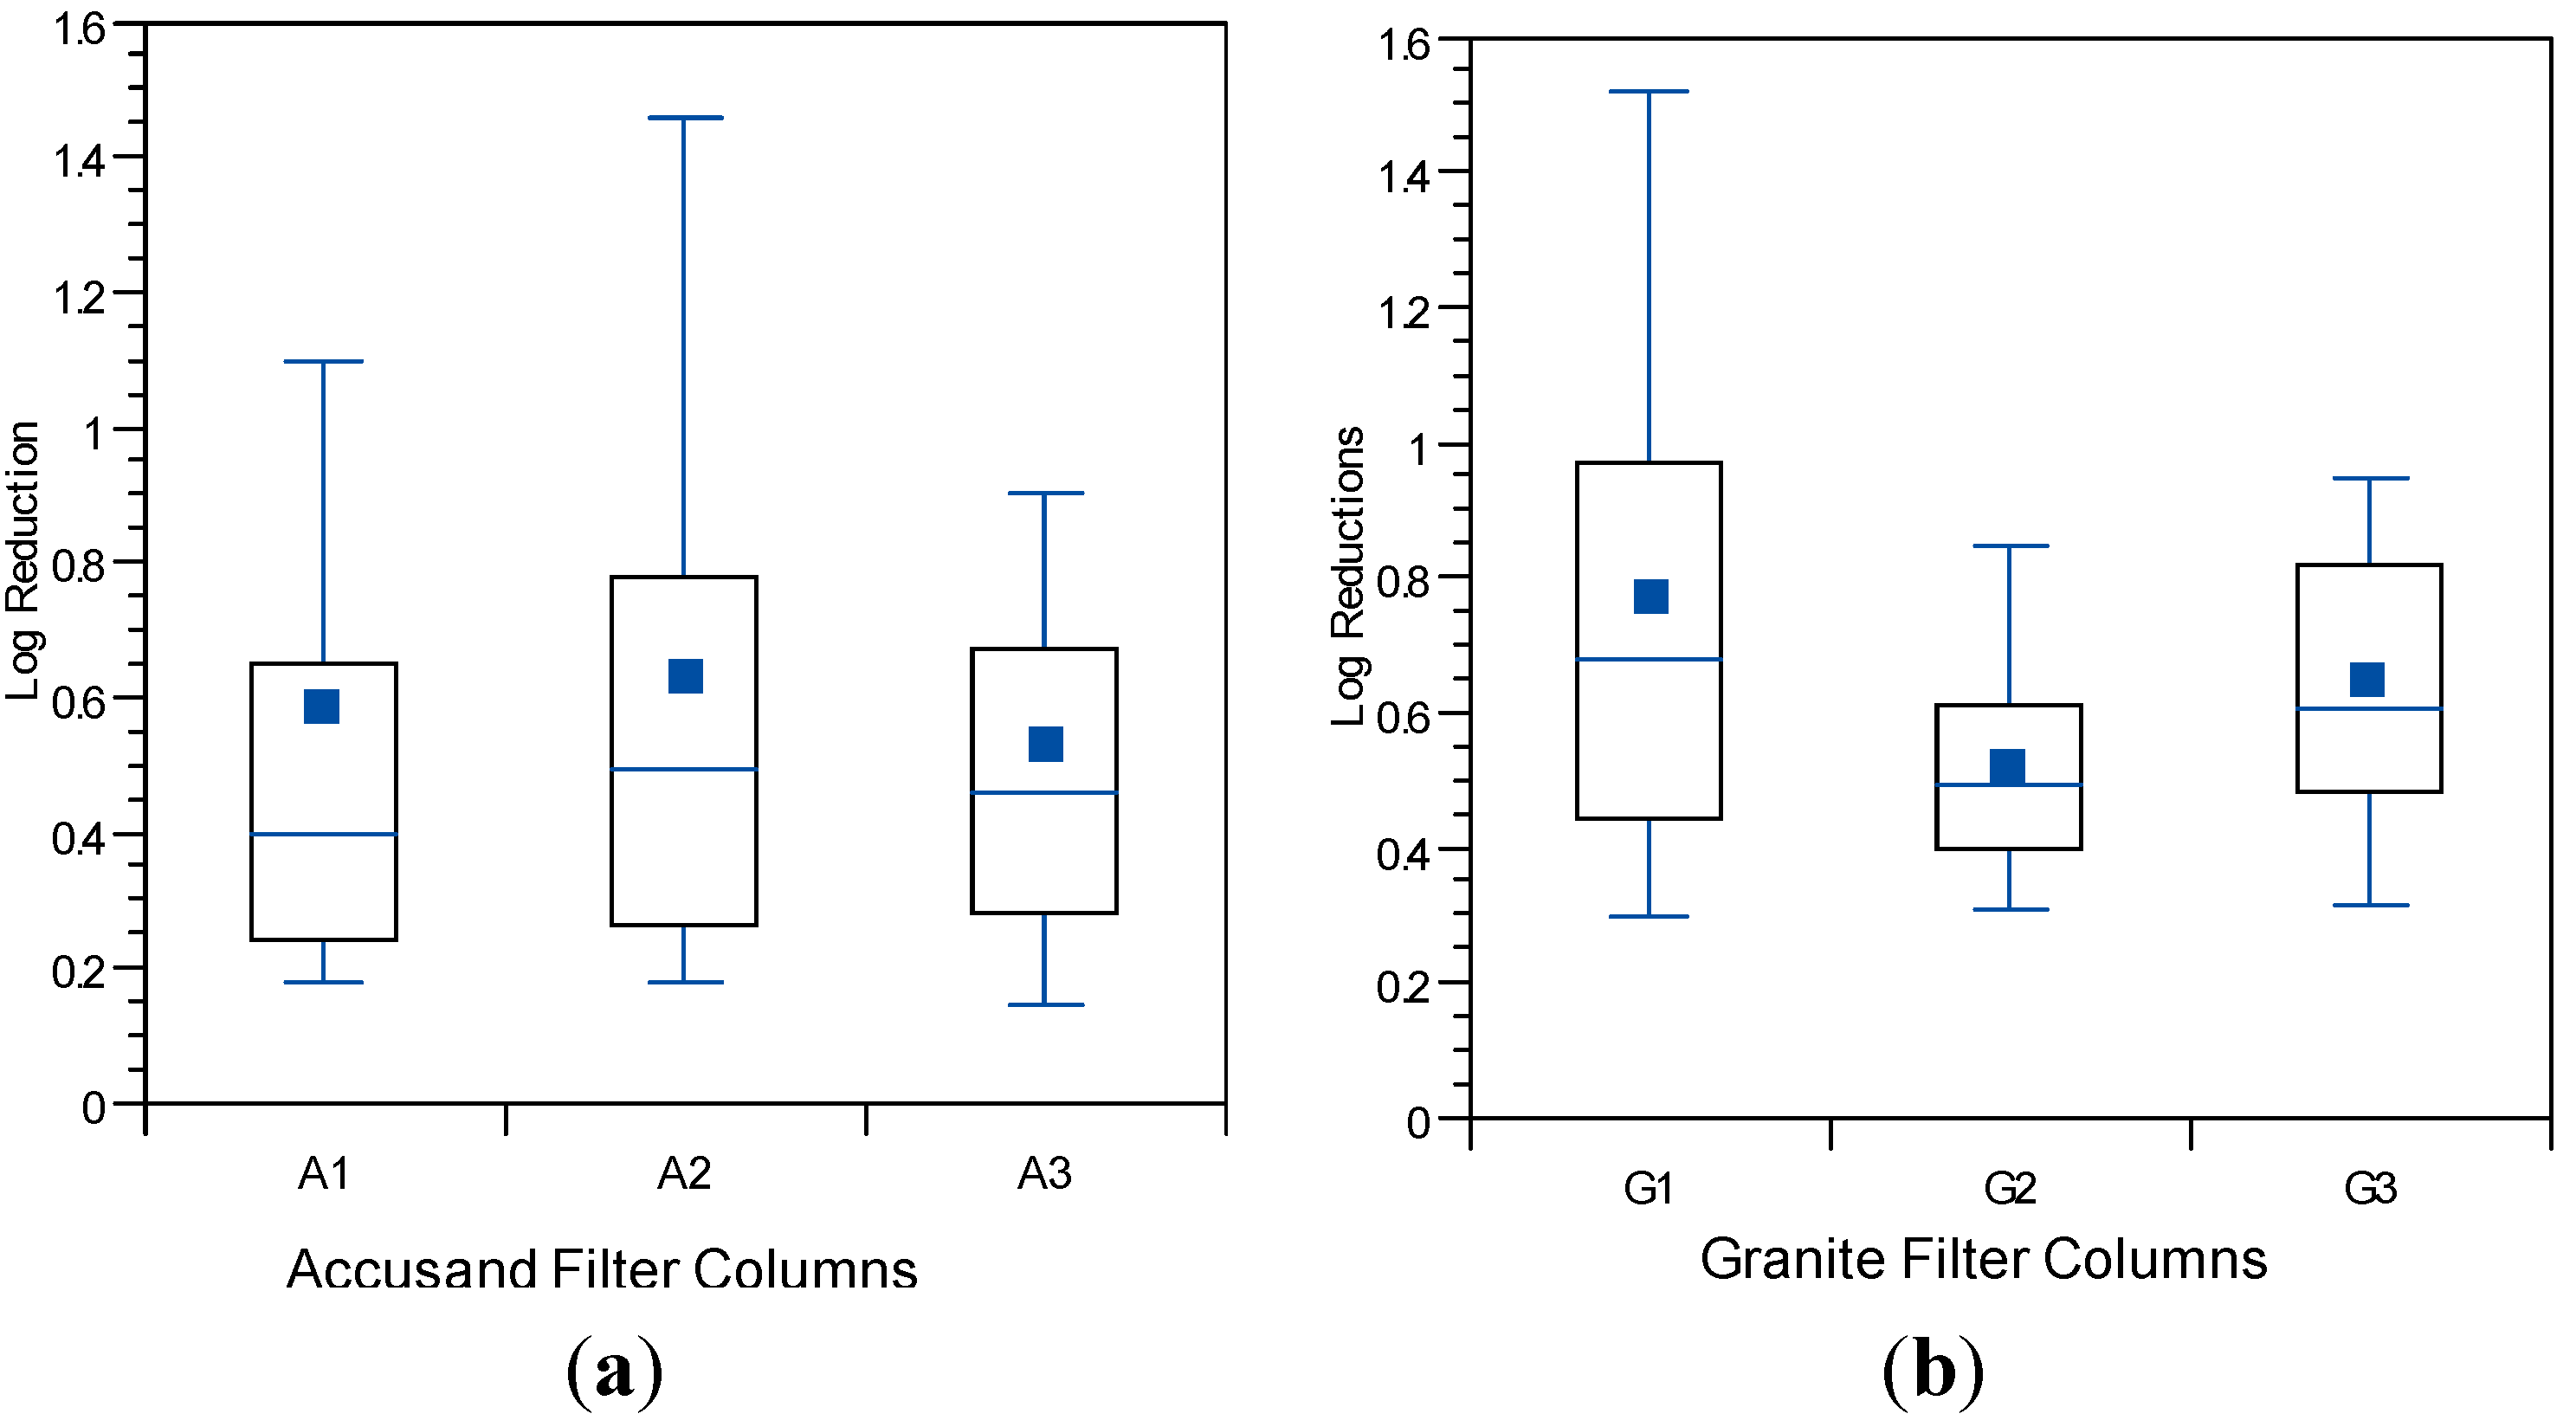
3.5. Reductions in Challenge Viruses

Box and whisker plots of log reduction of MS2 coliphage are given in Figure 9a (Accusand media) and Figure 9b (granite media) for Column Test No. 1 and in Figure 10a (Accusand media) and Figure 10b (granite media) for Column Test No. 2. Reductions were generally less than about 1-log (90%) although varied throughout the eight weeks of operation. The extents of virus reductions in these bench-scale tests were similar to those observed previously in full-scale tests [10].
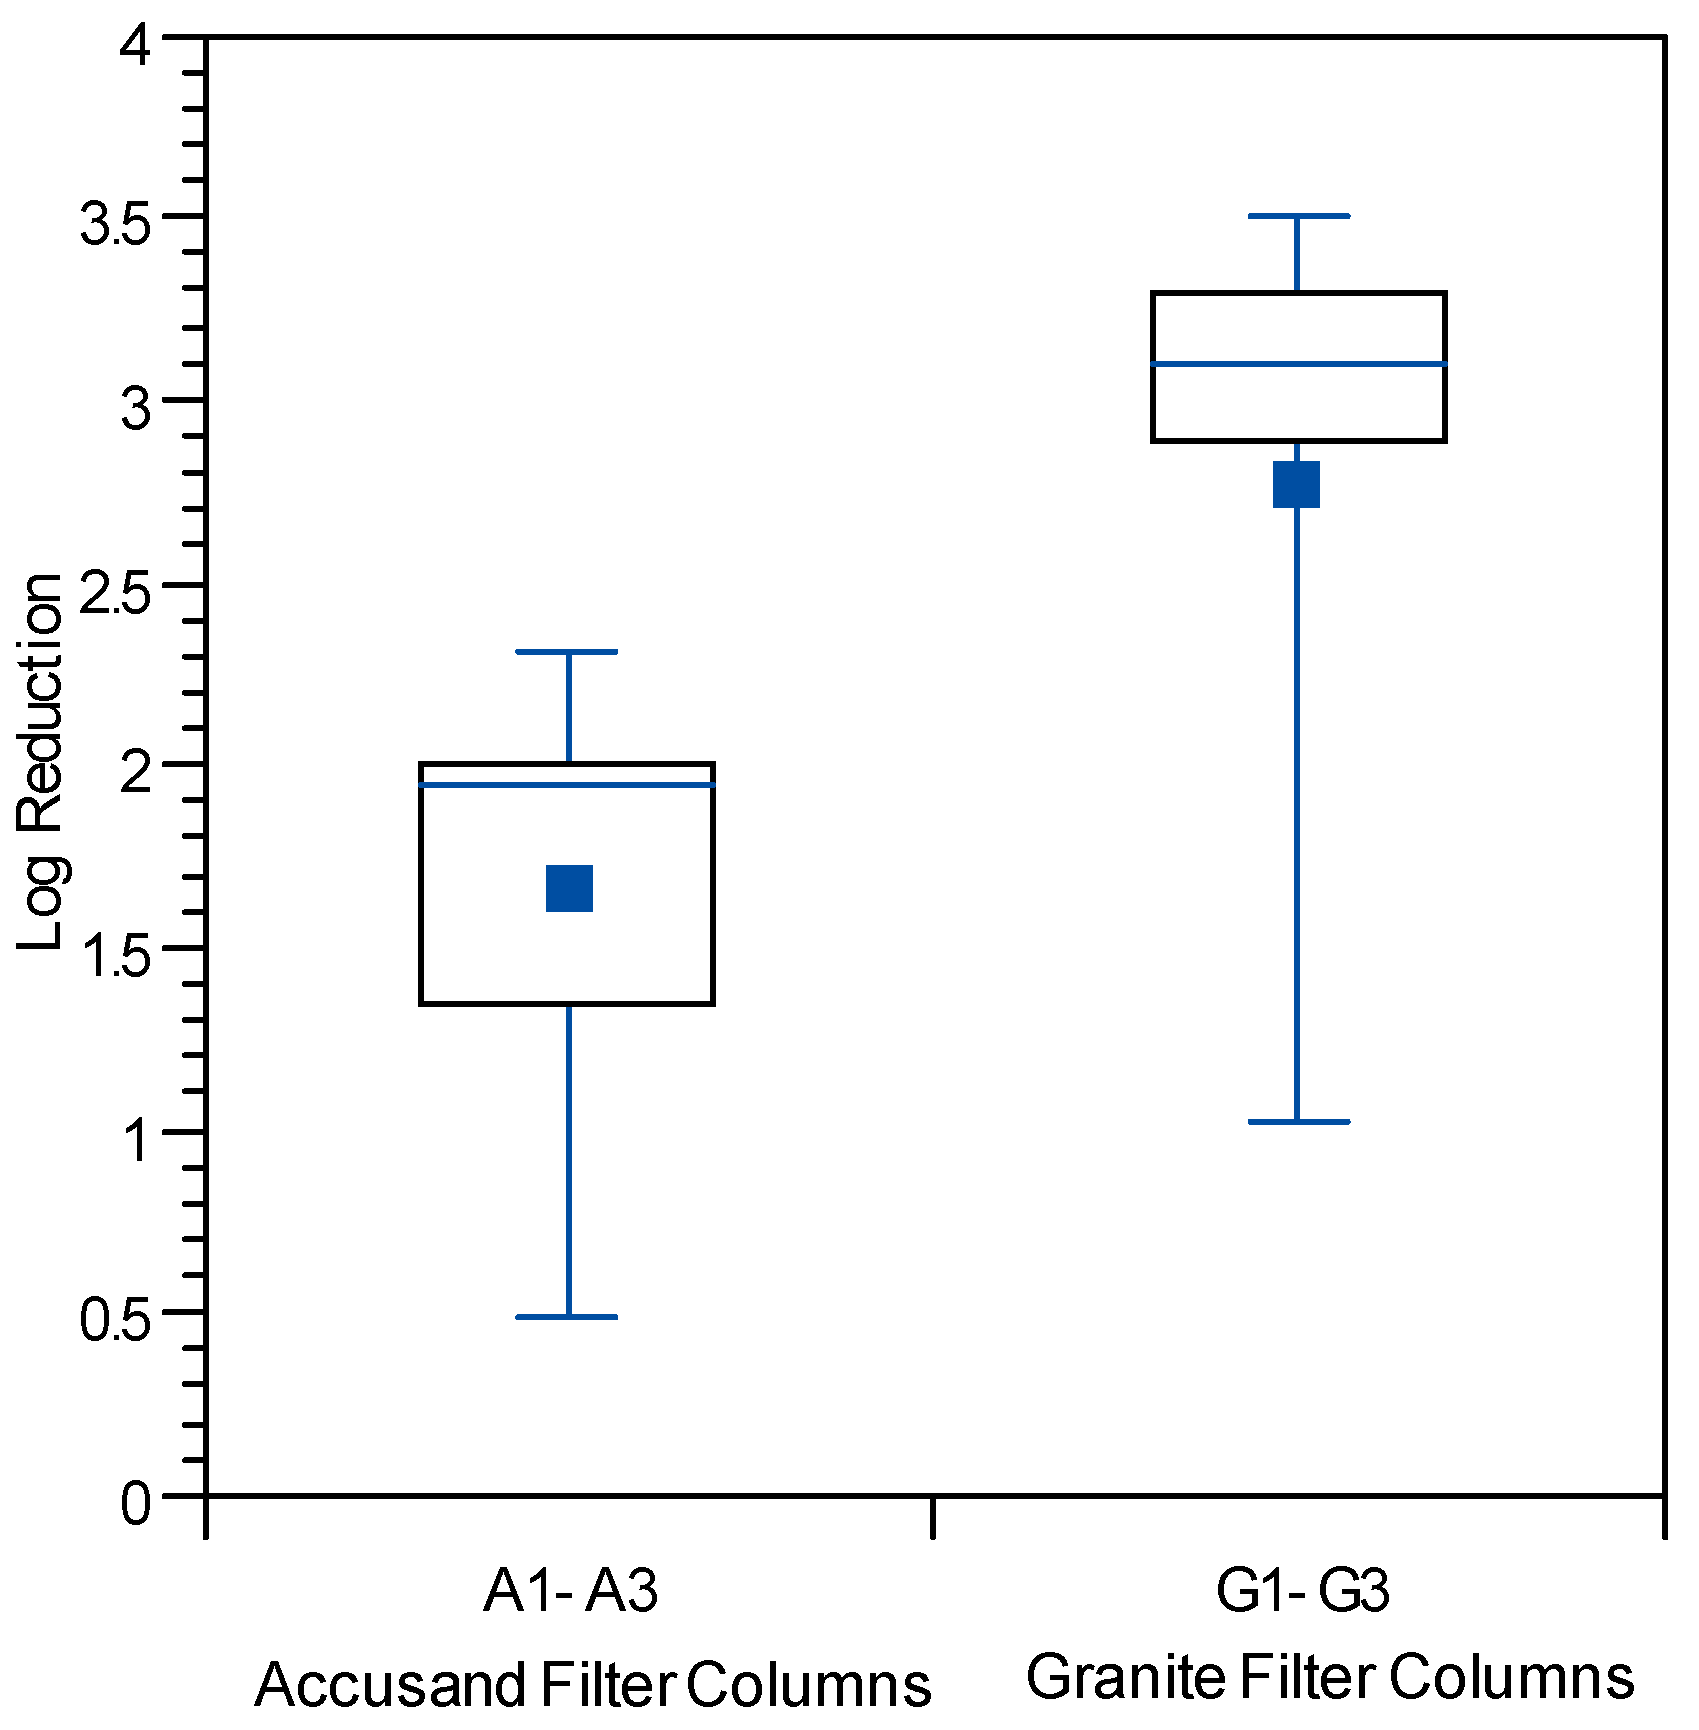
Because less data were available on reductions of PRD-1 phage and echovirus 12, combined log reduction results for all three columns having the same media are presented in box and whisker plots. Log reductions for echovirus 12 are shown in Figure 10 as box and whisker plots for Column Test No. 1 only as this was not used during Column Test No. 2. Likewise log reductions for PRD-1 are shown in Figure 11 as box and whisker plots for Column Test No. 2 only as it was not used in Column Test No. 1. Mean PRD-1 reductions of about 0.64 log (range 0-to-2.5 log) were not significantly different from those for MS2 at 0.57 log (range 0-to-2.7 log), whereas mean reduction for echovirus 12 was much greater at 2.21 (range 0.35-to-3.69) (p < 0.0001 for comparison with MS2). Direct comparisons between PRD-1 and echovirus 12 reductions were not possible in this experiment.
Figure 9. MS2 reductions for (a) Accusand media columns; and (b) granite media columns in Column Test No. 1 for samples collected throughout the eight-week experiment. N = 7 for G3; 8 for A1; 9 for G1, G2, A2 and A3.
Ijerph 12 10276 g009
Figure 10. Echovirus 12 reductions for Accusand media columns and granite media columns in Column Test No. 1 for samples collected throughout the eight-week experiment. N = 11 for Accusand and 11 for granite media.
Ijerph 12 10276 g010
However, echovirus 12 reductions have been reported to be of greater magnitude than those of MS2 and PRD-1 previously [10].
Although the effect of media type on reductions of all three challenge viruses was investigated, the results should be interpreted with caution due to difference in the experimental conditions of Column Tests No. 1 and 2. Mean reductions of both challenge viruses were significantly greater in the granite than in Accusand media in Column Test No. 1; MS2 mean reductions were 0.62-log in granite vs. 0.37-log in Accusand (p < 0.01) and echovirus 12 reductions were likewise greater in the granite than Accusand (2.8-log vs. 1.6-log) (p < 0.01). However, log reductions of viruses did not always differ between granite and Accusand media, with no significant differences found in Column Test No. 2 reductions of MS2 (Figure 11a,b) or PRD-1 (Figure 12a,b). Thus, the effect of column media type on virus reductions was not consistent among the different viruses tested or across the two column tests.
Figure 11. MS2 reductions for (a) Accusand media columns; and (b) granite media columns in Column Test No. 2 for samples collected throughout the eight-week experiment. N = 13 for G2; 14 for A1–A3; 15 for G1 and G2.
Ijerph 12 10276 g011
Figure 12. PRD-1 reductions for (a) Accusand media columns; and (b) granite media columns in Column Test No. 2 for samples collected throughout the eight-week experiment. N = 13 for G2; 14 for A1–A3; 15 for G1 and G2.
Ijerph 12 10276 g012
The initial hypothesis, virus reductions would be greater in columns containing the granite than Accusand media because of increased virus attachment to more positively charged sites on the granite surface [48,49], are consistent with the results for MS2 and Echo 12 in Column Test No. 1. However, this hypothesis was not supported by virus reductions in Column Test No. 2 wherein there was no significant difference between columns filled with granite and Accusand. The likely explanation for the observed differences in results is that the large surface area of fine silty material present in the granite media during Column Test No. 1 was lost during the backwashing procedure prior to Column Test No. 2. Increased surface area could enhance virus reduction by adsorption mechanisms or possibly through biological mechanisms. Possible mechanisms of virus reduction related to depth filtration and maturation are discussed in more detail by Elliott et al. [10] and Wang et al. [21].
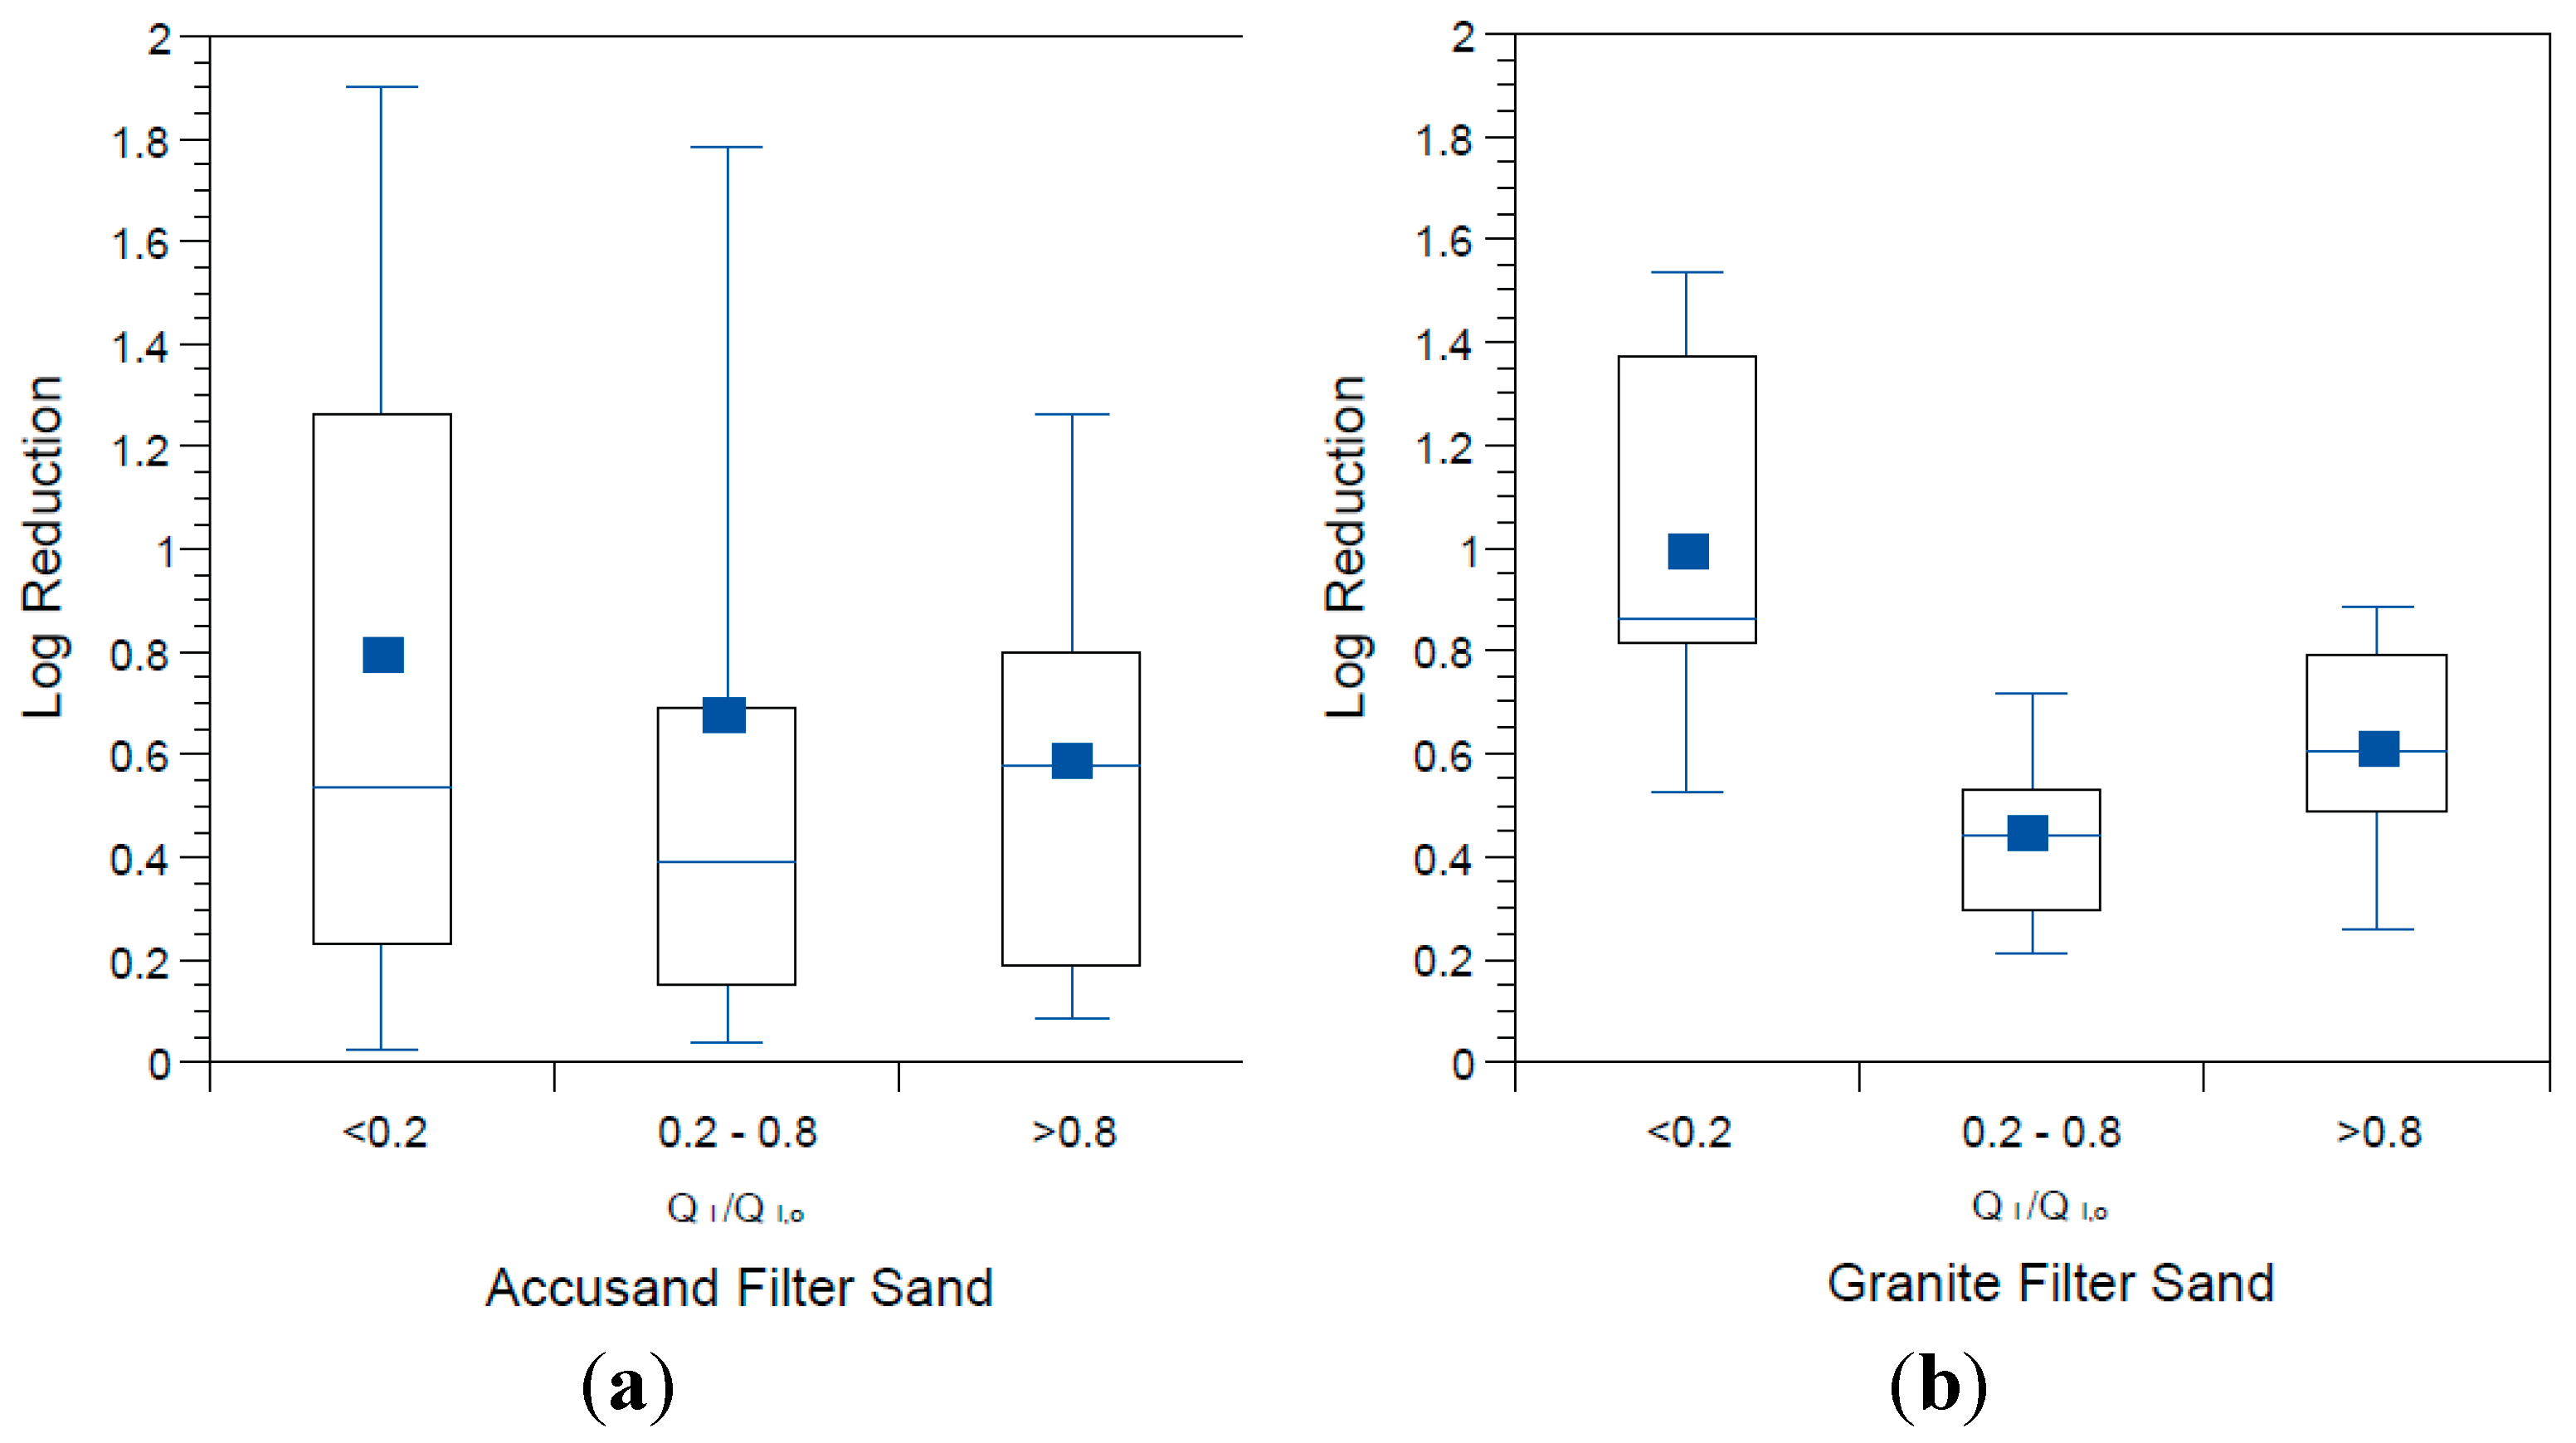
The influence of filter maturation on MS2 and PRD-1 log reductions was investigated by grouping the data by normalized, initial daily filtration rate (QI/QI,o). There were insufficient data for echovirus 12 reductions to do the same analysis. The results for MS2 and PRD-1, which are shown in Figure 13 and Figure 14, respectively, indicate that greater reductions are associated with lower values of QI/QI,o, (p < 0.0001 for MS2 and PRD-1) as was also noted for E. coli reductions (Figure 8). These results indicate that filter maturation, directly or indirectly, contributed to enhanced virus reductions.
Figure 13. MS2 reductions for (a) Accusand media columns; and (b) granite media columns in Column Tests No. 1 and No. 2 organized by bins of normalized filtration rate, where QI is the initial daily filtration rate on each day of charging the column and QI,o is the initial filtration rate on the first day. N for Accusand: 16 for <0.2, 17 for 0.2–0.8, 17 for >0.8. N for granite: 12 for <0.2, 25 for 0.2–0.8, 11 for >0.8.
Ijerph 12 10276 g013
The log virus reductions observed in the granular media BSF column experiments of this study and presented in Figure 9, Figure 10, Figure 11, Figure 12, Figure 13 and Figure 14 raise questions concerning the responsible mechanism(s). Physical straining of viruses by the schmutzdecke is unlikely to be an important mechanism of virus reduction because of their small particle size (see Table 3). However, the schmutzdecke could increase viral reductions by decreasing flow rate, leading to more efficient depth filtration by physical-chemical mechanisms. Wang and colleagues found that rates of MS2 reduction per depth in the top 5 cm of the filter bed were nearly 10× those in the rest of the bed, indicating that the schmutzdecke zone contributes greatly to virus reductions [21]. However, several reports of virus reduction in conventional SSF suggest no effect or only a small effect by removing the schmutzdecke while not allowing the flow rate to increase [46,50,51]. Schmutzdecke growth also occurs in parallel with other biological maturation processes that have been shown to affect depth filtration of viruses in SSF through “media aging” [23,51,52]. Therefore, while the active microbial community in the top layers of the BSF almost certainly plays a major role in virus reductions, the presence of a physically intact schmutzdecke may contribute to virus reductions primarily by slowing flow and increasing residence time throughout the media bed.
Figure 14. PRD-1 reductions for (a) Accusand media columns and (b) granite media columns in Column Tests No. 2 organized by bins of normalized filtration rate where QI is the initial daily filtration rate on each day of charging the column and QI,o is the initial filtration rate on the first day. N for Accusand: 6 for <0.2, 10 for 0.2–0.8, 9 for >0.8. N for granite: 6 for <0.2, 15 for 0.2–0.8, 6 for >0.8.
Ijerph 12 10276 g014

3.6. Microbial Reductions in Context

The absolute microbial reductions reported here may not be representative of those in BSFs that meet current design guidelines [24]. As discussed in Section 2, column design and media preparation were based on the guidelines at the time of these experiments [25,26]. Additionally, log reductions reported here include data from the first few weeks of operation, whereas other researchers may report microbial reductions only after a period of ripening. However, these results do provide useful comparisons between the design parameters and microorganisms studied here.
Log reductions of E. coli were typical of those reported in the literature [8,9,10,12]; 1–2 log10 reductions were observed following a period of ripening and increased to 4-log10 or greater when the schmutzdecke became clogged and flow rates declined to a small fraction (<1/10th) of those seen with newly loaded sand.
MS2 reductions were modest (0.3–1.0 log10), similar to those reported by most other research groups [9,10,11,12,23]. In contrast, one group has reported 3-to-6 log reductions of MS2 in BSFs with sand media [20,21]. While the reason for these differences are not clear from the literature, Bradley and colleagues reported modest MS2 reductions averaging around 1-log10 for the first 75 days of their experiment, with MS2 reductions increasing to 3-to-5 log10 after 150–300 days of operation. This length of operation is not typical of the other studies referenced. Possible explanations include: (1) that BSF maturation can continue to improve treatment of viruses beyond the typical duration of laboratory challenge experiments; and/or (2) variable experimental conditions or characteristics (e.g., feed water, media, microbial community) led to the increased MS2 reductions reported by Bradley et al., and Wang et al. [20,21]. These questions warrant further research.
PRD-1 and echovirus 12 have not been tested by other research groups. As reported above, PRD-1 reductions were similar to those of MS2 whereas echovirus 12 reductions were significantly greater. MS2 and PRD-1 have a lower isoelectric point than echovirus 12 (Table 3); thus, all things being equal, greater physical-chemical removal of echovirus would be expected. Further investigation of physical-chemical virus reduction mechanisms in BSF is warranted.
Although it is often stated that BSFs are more effective at treating bacteria than viruses, this is not always true. Comparison of E. coli reductions with virus reductions (for experiments and days on which both were tested) did show that E. coli reductions were significantly greater than those of MS2 and PRD-1 (p < 0.0001 for both comparisons). However, E.coli and echovirus 12 reductions were not significantly different (p = 0.22). Additionally, BSF challenge experiments have only been conducted using members of the coliform group (E. coli, thermotolerant coliforms, total coliforms). Further investigation of BSF performance using different bacteria is warranted.

4. Conclusions

Challenges with replicability in the properties of replicate granular media filters and the process of biological maturation yielded variability in flow rate and microbial reductions; replicability between parallel columns was especially challenging when using granite filter media. The rate of schmutzdecke development, as measured by the decline in filtration rate over eight-week experiments, varied widely across replicate columns in these studies. One possible explanation for this variability is difficulty in controlling the media size of the topmost layer of the filter column where the schmutzdecke develops. This effect was particularly evident for the granite media because of the large fraction of fines and a very wide grain size distribution. Backwashing prior to Column Test No. 2 was attempted to improve the reproducibility and consistency of the column properties (backwashing had a number of drawbacks and is not recommended for BSF column studies). However, variation in microbial reductions was also observed among replicates of columns packed with the Accusand media, which comprised a very narrow range of grain sizes. It is possible that this variability in schmutzdecke development is simply a by-product of a biological filtration process that relies on colonization by the indigenous microbial community. Despite the lack of reproducibility observed in their properties, the mean log microbial reductions over the entire course of the study challenge period were similar for replicate columns in both column tests (Figure 9, Figure 11 and Figure 12).
E. coli reductions did not differ significantly between Accusand silica and crushed granite despite the striking differences in inorganic composition (two orders of magnitude higher Al and Fe on granite surface), angularity (granite was much more angular) and grain size distribution (much wider distribution for granite). However, during Column Test No. 1 a greater reduction of viruses was achieved by granite than Accusand filtration. The much higher surface concentrations of Al and Fe observed on the granite media were believed to produce a positive surface charge that could better attract viruses electrostatically. However, this explanation was not supported by the virus log reductions of Column Test No. 2, which were not significantly different when using backwashed granite and Accusand media. The improved virus reductions associated with fine positively charged particles as observed in Column Test No. 1 suggest that the purposeful use of other positively charged media and ions could possibly be used to enhance virus reductions sustainably in the BSF as reported by others [17,20]. However, an alternative or supplementary explanation for the observed log virus reduction results is that backwashing eliminated the very fine fraction of particles from the granite media that could have provided a large surface area for more virus sorption or enhanced biological activity.
Reductions of E. coli, MS2 and PRD-1 increased as filtration rate declined, which corresponded to the maturation of the schmutzdecke. The most likely mechanism for E. coli reduction was physical straining through the schmutzdecke layer. However, increased head loss leads to slower pore velocities, which could enhance depth filtration. Because of the small size of viruses, straining is unlikely. Therefore, other maturation processes that influence depth filtration of viruses occur simultaneously with schmutzdecke development. Deep-bed biological maturation processes have been shown to enhance virus reductions during idle time in the BSF [21,23] but a number of studies of conventional SSF showed little to no effect of a physically intact schmutzdecke on virus reductions [46,50,51]. Therefore, it is most likely that the primary role of an intact schmutzdecke in enhancing virus reductions in BSF is through slowing flow and increasing residence time throughout the media bed. However, further studies are recommended to better identify and quantify the different mechanisms by which viruses are retained in and become inactivated by biosand filters containing granular media having different properties.
Topics recommended for further research on the BSF include: (1) mechanistic investigation of the variability of virus reductions reported for different viruses and for MS2 reductions reported by different research groups; (2) the importance of physical-chemical mechanisms of virus reduction; (3) investigation of bacterial reductions for bacteria outside the coliform group; and (4) mechanistic investigation into the impacts of media characteristics on BSF performance.

Acknowledgments

This work was financially supported by an EPA P3 Phase II award (#SU832463), an EPA STAR Fellowship to Mark Elliott (#F5A20163), and International Aid. We thank Stephanie Kuhn, Lily Clark and Alice Wang for technical and analytical assistance in the lab and Douglas Wait, Chip Simmons, Randy Goodman and Glenn Walters for their expertise and logistical support in laboratory work, experimental design and filter construction.

Author Contributions

Mark Elliott, Christine E. Stauber, Francis A. DiGiano, Anna Fabiszewski de Aceituno and Mark D. Sobsey designed the experiments. Mark Elliott, Christine E. Stauber and Anna Fabiszewski de Aceituno conducted the experiments. Mark Elliott analyzed the data. Mark Elliott, Christine E. Stauber, Francis A. DiGiano and Mark D. Sobsey wrote the manuscript.

Conflicts of Interest

The authors declare no conflict of interest.

References

  1. Sobsey, M.D. Managing Water in the Home: Accelerated Health Gains from Improved Water Supply; World Health Organization (WHO): Geneva, Switzerland, 2002. [Google Scholar]
  2. Ngai, T.; Coff, B.; Baker, D.; Lentz, R. Global review of the adoption, use and performance of biosand filter. In Progess in Slow Sand and Alternative Biofiltration Processes; Nakamoto, N., Graham, N., Collins, M., Gimbel, R., Eds.; International Water Association: London, UK, 2014; pp. 309–317. [Google Scholar]
  3. Sobsey, M.; Stauber, C.; Casanova, L.; Brown, J.; Elliott, M. Point of use household drinking water filtration: A practical, effective solution for providing sustained access to safe drinking water in the developing world. Environ. Sci. Technol. 2008, 42, 4261–4267. [Google Scholar] [CrossRef] [PubMed]
  4. Aiken, B.; Stauber, C.; Ortiz, G.; Sobsey, M. An assessment of continued use and health impact of the concrete biosand filter in Bonao, Dominican Republic. Am. J. Trop. Med. Hyg. 2011, 85, 309–317. [Google Scholar] [CrossRef] [PubMed]
  5. Liang, K.R.; Stauber, C.E.; Sobsey, M.D. Independent Evaluation of the Biosand Water Filter in Rural Cambodia: Sustainability, Health Impact and Water Quality Improvement; World Bank: Washington, DC, USA, 2009. [Google Scholar]
  6. Brown, J.; Clasen, T. High adherence is necessary to realize health gains from water quality interventions. PLoS ONE 2012, 7. [Google Scholar] [CrossRef] [PubMed]
  7. Enger, K.; Nelson, K.; Rose, J.; Eisenberg, J. The joint effects of efficacy and compliance: A study of household water treatment effectiveness against childhood diarrhea. Water Res. 2013, 47, 1181–1190. [Google Scholar] [CrossRef] [PubMed]
  8. CAWST. Biosand Filter Literature Summary; CAWST: Calgary, Canada, 2012. [Google Scholar]
  9. Stauber, C.E.; Elliot, M.A.; Koksal, F.; Ortiz, G.M.; DiGiano, F.A.; Sobsey, M.D. Characterisation of the biosand filter for E. coli reductions from household drinking water under controlled laboratory and field use conditions. Water Sci. Technol. 2006, 54, 1–7. [Google Scholar] [CrossRef] [PubMed]
  10. Elliott, M.; Stauber, C.; Koksal, F.; DiGiano, F.; Sobsey, M. Reductions of E. coli, echovirus type 12 and bacteriophages in an intermittently operated household-scale slow sand filter. Water Res. 2008, 42, 2662–2670. [Google Scholar] [CrossRef] [PubMed]
  11. Young-Rojanschi, C.; Madramootoo, C. Intermittent versus continuous operation of biosand filters. Water Res. 2014, 49, 1–10. [Google Scholar] [CrossRef] [PubMed]
  12. Jenkins, M.W.; Tiwari, S.K.; Darby, J. Bacterial, viral and turbidity removal by intermittent slow sand filtration for household use in developing countries: Experimental investigation and modeling. Water Res. 2011, 45, 6227–6239. [Google Scholar] [CrossRef] [PubMed]
  13. Lynn, T.J.; Wanjugi, P.; Harwood, V.J.; Ergas, S.J. Dynamic Performance of Biosand Filters. J. Am. Water Works Assoc. 2013, 105, E587–E595. [Google Scholar] [CrossRef]
  14. Kennedy, T.J.; Hernandez, E.A.; Morse, A.N.; Anderson, T.A. Hydraulic Loading Rate Effect on Removal Rates in a BioSand Filter: A Pilot Study of Three Conditions. Water Air Soil Pollut. 2012, 223, 4527–4537. [Google Scholar] [CrossRef]
  15. Napotnik, J.; Jellison, K. Transport effects on hydraulic loading rate and microbial removal performance in biosand filters. J. Water Health 2014, 12, 686–691. [Google Scholar] [CrossRef] [PubMed]
  16. Mahaffy, N.C.; Dickson, S.; Cantwell, R.E.; Lucier, K.; Schuster-Wallace, C.J. Effects of physical disturbances on media and performance of household-scale slow sand (BioSand) filters. J. Water Supply Res. Technol. 2015, 64, 250–259. [Google Scholar] [CrossRef]
  17. Ngai, T.K.K.; Shrestha, R.R.; Dangol, B.; Maharjan, M.; Murcott, S.E. Design for sustainable development—Household drinking water filter for arsenic and pathogen treatment in Nepal. J. Environ. Sci. Health A Tox. Hazard. Subst. Environ. Eng. 2007, 42, 1879–1888. [Google Scholar] [CrossRef] [PubMed]
  18. Tellen, V.; Nkeng, G.; Dentel, S. Improved filtration technology for pathogen reduction in rural water supplies. Water 2010, 2, 285–306. [Google Scholar] [CrossRef]
  19. Ghebremichael, K.; Wasala, L.D.; Kennedy, M.; Graham, N.J.D. Comparative treatment performance and hydraulic characteristics of pumice and sand biofilters for point-of-use water treatment. J. Water Supply Res. Technol. 2012, 61, 201–209. [Google Scholar] [CrossRef]
  20. Bradley, I.; Straub, A.; Maraccini, P.; Markazi, S.; Nguyen, T.H. Iron oxide amended biosand filters for virus removal. Water Res. 2011, 45, 4501–4510. [Google Scholar] [CrossRef] [PubMed]
  21. Wang, H.; Narihiro, T.; Straub, A.P.; Pugh, C.R.; Tamaki, H.; Moor, J.F.; Bradley, I.M.; Kamagata, Y.; Liu, W.-T.; Nguyen, T.H. MS2 Bacteriophage Reduction and Microbial Communities in Biosand Filters. Environ. Sci. Technol. 2014, 48, 6702–6709. [Google Scholar] [CrossRef] [PubMed]
  22. Elliott, M.A.; Stauber, C.E.; Koksal, F.; Liang, K.R.; Huslage, D.K.; DiGiano, F.A.; Sobsey, M.D. The operation, flow conditions and microbial reductions of an intermittently operated, household scale slow sand filter. In Recent Progress in Slow Sand and Alternative Biofiltration Processes; Gimbel, R., Graham, N.J.D., Collins, M.R., Eds.; International Water Association: London, UK, 2006. [Google Scholar]
  23. Elliott, M.A.; Digiano, F.A.; Sobsey, M.D. Virus attenuation by microbial mechanisms during the idle time of a household slow sand filter. Water Res. 2011, 45, 4092–4102. [Google Scholar] [CrossRef] [PubMed]
  24. CAWST. Biosand Filter Construction Manual (CAWST); CAWST: Calgary, Canada, 2012. [Google Scholar]
  25. Manz, D.H. Preparation of Media for the Biosand Water Filter; Manz Water Info: Calgary, AB, Canada, 2007. [Google Scholar]
  26. Manz, D.H. BioSand Water Filter Technology; Manz Water Info: Calgary, AB, Canada, 2007. [Google Scholar]
  27. Schroth, M.; Istok, J.; Ahearn, S.; Selker, J. Characterization of Miller-similar silica sands for laboratory hydrologic studies. Soil Sci. Soc. Am. J. 1996, 60, 1331–1339. [Google Scholar] [CrossRef]
  28. Litton, G.M.; Olson, T.M. Colloid deposition rates on silica bed media and artifacts related to collector surface preparation methods. Environ. Sci. Technol. 1993, 27, 185–193. [Google Scholar] [CrossRef]
  29. US EPA. Method 3051: Microwave Assisted Acid Digestion of Sediments, Sludges, Soils, and Oils; US Environmental Protection Agency: Washington, DC, USA, 2007.
  30. Tchobanoglous, G.; Burton, F.L.; Stensel, H.D. Wastewater Engineering: Treatment and Reuse; McGraw-Hill: New York, NY, USA, 2003. [Google Scholar]
  31. US EPA. Design Manual, Municipal Wastewater Disinfection. EPA/625/1-86/021; US Environmental Protection Agency: Cincinnati, OH, USA, 1986.
  32. US EPA. Method 1604: Total Coliforms and Escherichia coli in Water by Membrane Filtration Using Simultaneous Detection Technique (MI Medium); US Environmental Protection Agency: Washington, DC, USA, 2002.
  33. US EPA. Method 1602: Male-specific (F +) and Somatic Coliphage in Water by Single Agar Layer (SAL) Procedure April 2001. EPA Document 821-R-01-029; US Environmental Protection Agency: Washington, DC, USA, 2001.
  34. Cromeans, T.; Sobsey, M.D.; Fields, H.A. Development of a plaque assay for a cytopathic, rapidly replicating isolate of hepatitis A virus. J. Med. Virol. 1987, 22, 45–56. [Google Scholar] [CrossRef] [PubMed]
  35. Dowd, S.E.; Pillai, S.D.; Wang, S.; Corapcioglu, M.Y. Delineating the specific influence of virus isoelectric point and size on virus adsorption and transport through sandy soils. Appl. Environ. Microbiol. 1998, 64, 405–410. [Google Scholar] [PubMed]
  36. Collins, K.; Cronin, A.; Rueedi, J.; Pedley, S.; Joyce, E.; Humble, P.; Tellam, J. Fate and transport of bacteriophage in UK aquifers as surrogates for pathogenic viruses. Eng. Geol. 2006, 85, 33–38. [Google Scholar] [CrossRef]
  37. Mesquita, M.M.F.; Stimson, J.; Chae, G.-T.; Tufenkji, N.; Ptacek, C.J.; Blowes, D.W.; Emelko, M.B. Optimal preparation and purification of PRD1-like bacteriophages for use in environmental fate and transport studies. Water Res. 2010, 44, 1114–1125. [Google Scholar] [CrossRef] [PubMed]
  38. Daniels, S. Mechanisms Involved in Sorption of Microorganisms to Solid Surfaces. In Adsorption of Microorganisms to Surfaces; Bitton, G., Marshall, K., Eds.; Wiley-Interscience: New York, NY, USA, 1980. [Google Scholar]
  39. Glassman, H.N. Surface Active Agents and their Application in Bacteriology. Bacteriol. Rev. 1948, 12, 105–148. [Google Scholar] [PubMed]
  40. Blatt, H.; Tracy, R.J. Petrology Igneous, Sedimentary, and Magmatic, 2nd ed.; Prentice-Hall: New York, NY, USA, 1996. [Google Scholar]
  41. Stumm, W.; Morgan, J.J. Aquatic Chemistry: Chemical Equilibria and Rates in Natural Waters; Wiley: Hoboken, NJ, USA, 1996. [Google Scholar]
  42. Knappett, P.S.K.; Emelko, M.B.; Zhuang, J.; McKay, L.D. Transport and retention of a bacteriophage and microspheres in saturated, angular porous media: Effects of ionic strength and grain size. Water Res. 2008, 42, 4368–4378. [Google Scholar] [CrossRef] [PubMed]
  43. Lukasik, J.; Cheng, Y.-F.; Lu, F.; Tamplin, M.; Farrah, S.R. Removal of microorganisms from water by columns containing sand coated with ferric and aluminum hydroxides. Water Res. 1999, 33, 769–777. [Google Scholar] [CrossRef]
  44. Truesdail, S.; Lukasik, J.; Farrah, S.; Shah, D.; Dickinson, R. Analysis of Bacterial Deposition on Metal (Hydr)oxide-Coated Sand Filter Media. J. Colloid Interface Sci. 1998, 203, 369–378. [Google Scholar] [CrossRef] [PubMed]
  45. Foppen, J.W.; Liem, Y.; Schijven, J. Effect of humic acid on the attachment of Escherichia coli in columns of goethite-coated sand. Water Res. 2008, 42, 211–219. [Google Scholar] [CrossRef] [PubMed]
  46. Hijnen, W.A.M.; Schijven, J.F.; Bonné, P.; Visser, A.; Medema, G.J. Elimination of viruses, bacteria and protozoan oocysts by slow sand filtration. Water Sci. Technol. 2004, 50, 147–154. [Google Scholar] [PubMed]
  47. Unger, M.; Collins, M.R. Assessing Escherichia coli Removal in the Schmutzdecke of Slow-Rate Biofilters. J. Am. Water Works Assoc. 2008, 100, 60–73. [Google Scholar]
  48. Ryan, J.N.; Harvey, R.W.; Metge, D.; Elimelech, M.; Navigato, T.; Pieper, A.P. Field and Laboratory Investigations of Inactivation of Viruses (PRD1 and MS2) Attached to Iron Oxide-Coated Quartz Sand. Environ. Sci. Technol. 2002, 36, 2403–2413. [Google Scholar] [CrossRef] [PubMed]
  49. Zhuang, J.; Jin, Y. Virus retention and transport through Al-oxide coated sand columns: Effects of ionic strength and composition. J. Contam. Hydrol. 2003, 60, 193–209. [Google Scholar] [CrossRef]
  50. Dullemont, Y.; Schijven, J.; Hijnen, W.; Colin, M.; Magic-Knezev, A. Removal of microorganisms by slow sand filtration. In Recent Progress in Slow Sand and Alternative Biofiltration Processes; Gimbel, R., Graham, N., Collins, M., Eds.; International Water Association: London, UK, 2006; pp. 12–20. [Google Scholar]
  51. Poynter, S.; Slade, J. The removal of viruses by slow sand filtration. Prog. Water Technol. 1977, 9, 75–88. [Google Scholar]
  52. Wheeler, D.; Bartram, J.; Lloyd, B.; Graham, N. Removal of viruses by filtration through sand. In Slow Sand Filtration: Recent Developments in Water Treatment Technology; Graham, N., Ed.; Ellis Horwood Ltd.: Chichester, UK, 1988; pp. 207–229. [Google Scholar]

