1. Field Investigations
Earthquake-induced landslides [
1,
2,
3,
4,
5,
6] can result in great damages and losses [
7], such as the 2008 Wenchuan earthquake in China [
8,
9], 1999 Chi-Chi earthquake in Taiwan [
10], and 1994 Northridge earthquake in California (USA) [
11],
etc. On 12 of May in 2008, the Ms 7.9 Wenchuan earthquake occurred in the Longmenshan region at the eastern margin of the Tibetan Plateau, adjacent to the Sichuan Basin (See
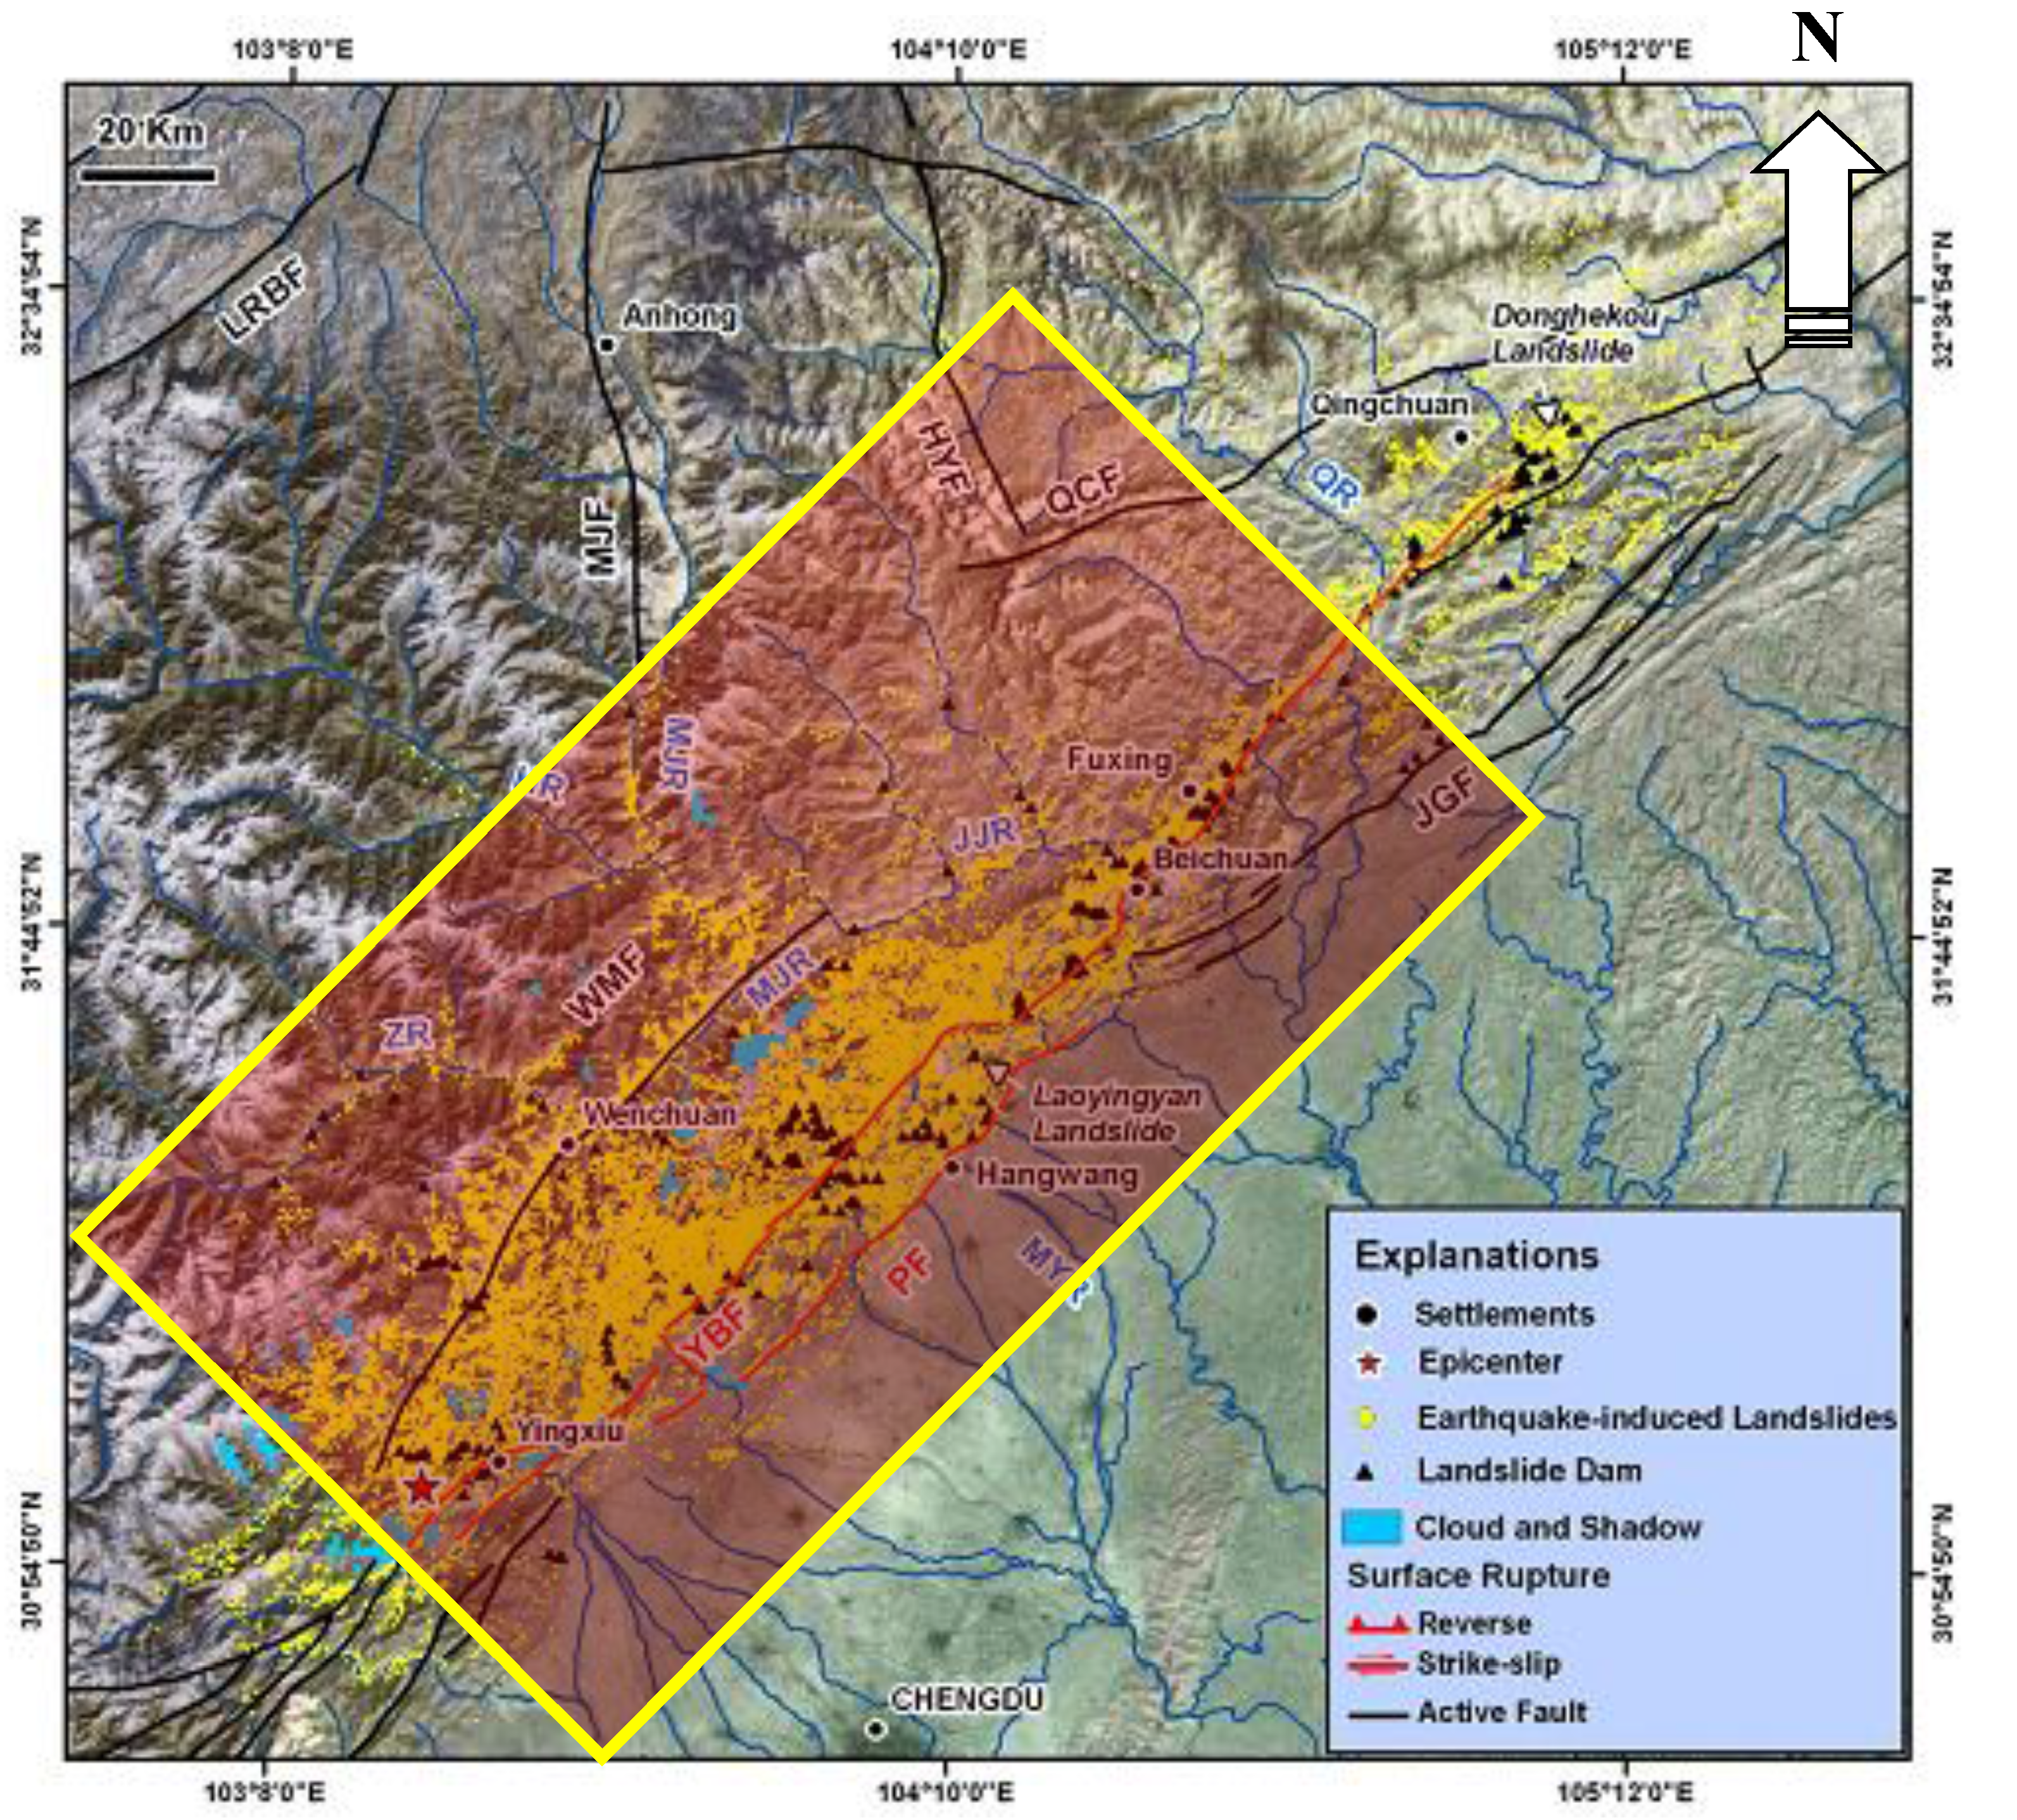
Figure 1), which directly led to 69,200 recorded deaths and 18,195 people are still missing, 21,426,600 homes that badly damaged and more than five million people left homeless [
12,
13,
14]. The earthquake also triggered a large number of landslides, rock avalanches,
etc.
Figure 1.
Location and 12 May 2008 Wenchuan earthquake fault surface rupture map.
Figure 1.
Location and 12 May 2008 Wenchuan earthquake fault surface rupture map.
According to the distribution of the hazards and the landscape conditions, a twenty-three person team headed to disaster zone and a field investigation area was established. The field investigation area (see
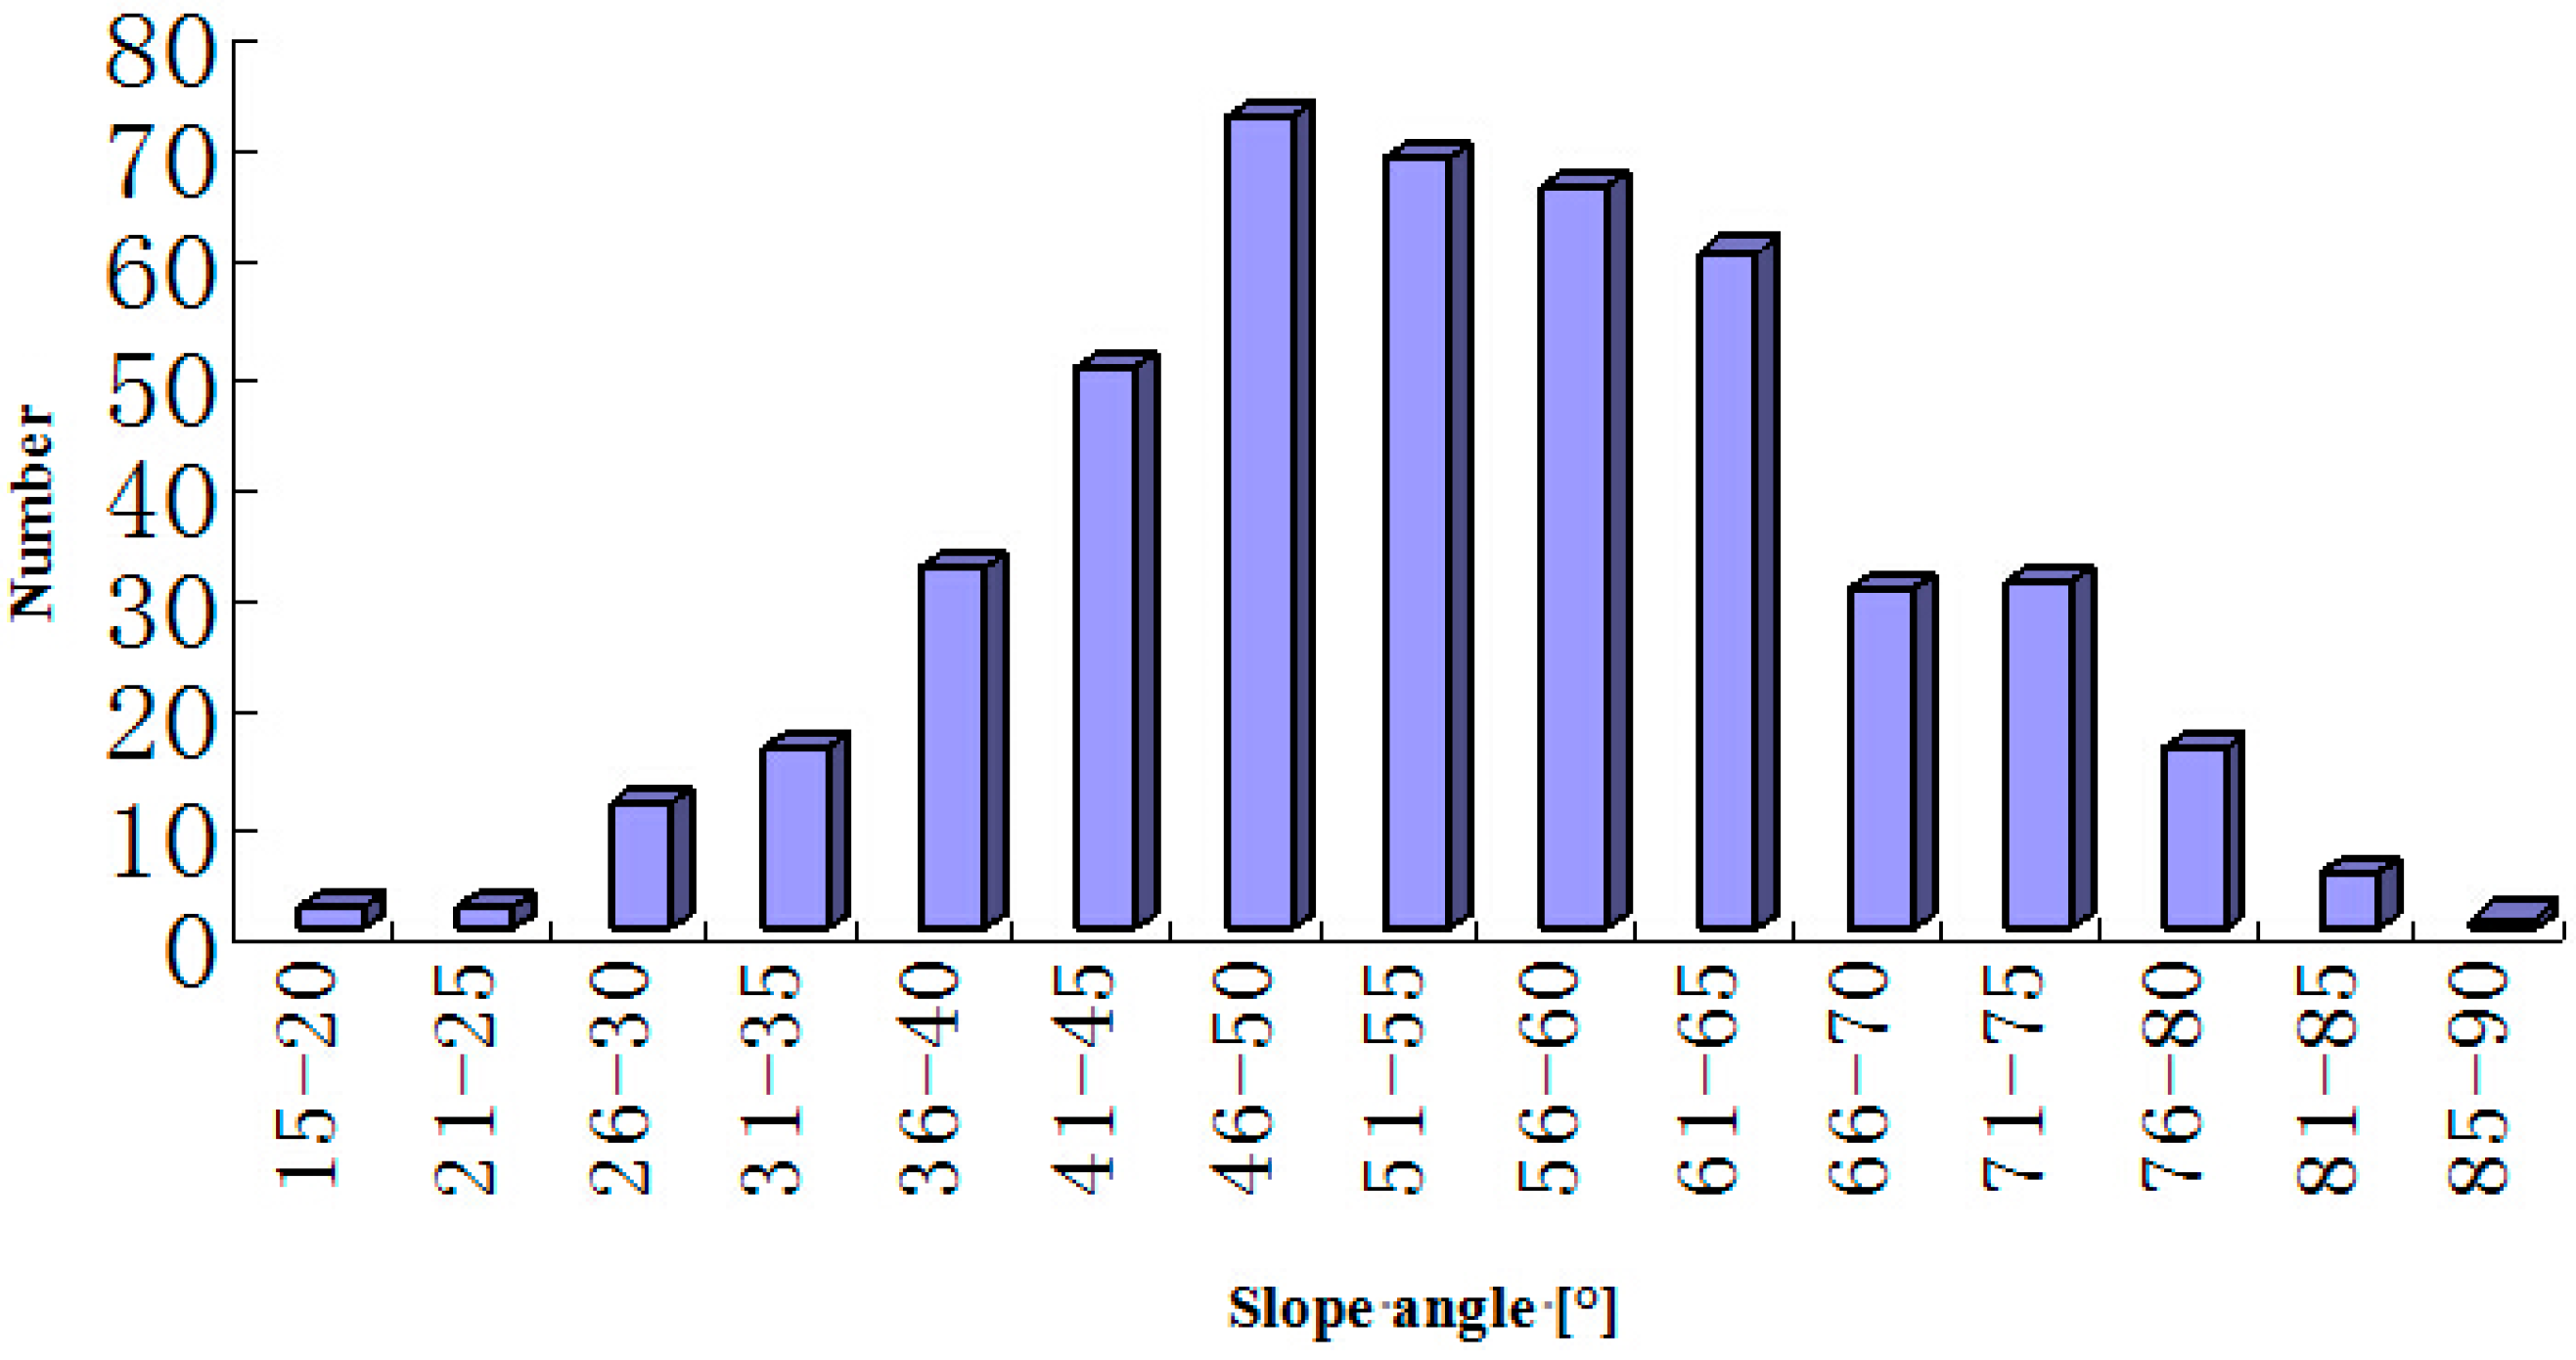
Figure 1), with a total area of thousands of square kilometers, was carefully investigated. However, because of the traffic, there were some areas that we could not reach, so a total of 1104 large hazards were investigated in detail. Among these hazards, there are 538 collapses, 462 landslides and 104 debris flows, and then a statistical analysis for the landslides according to the slope angle and slope type was made, as shown in
Figure 2 and
Figure 3.
Figure 2 and
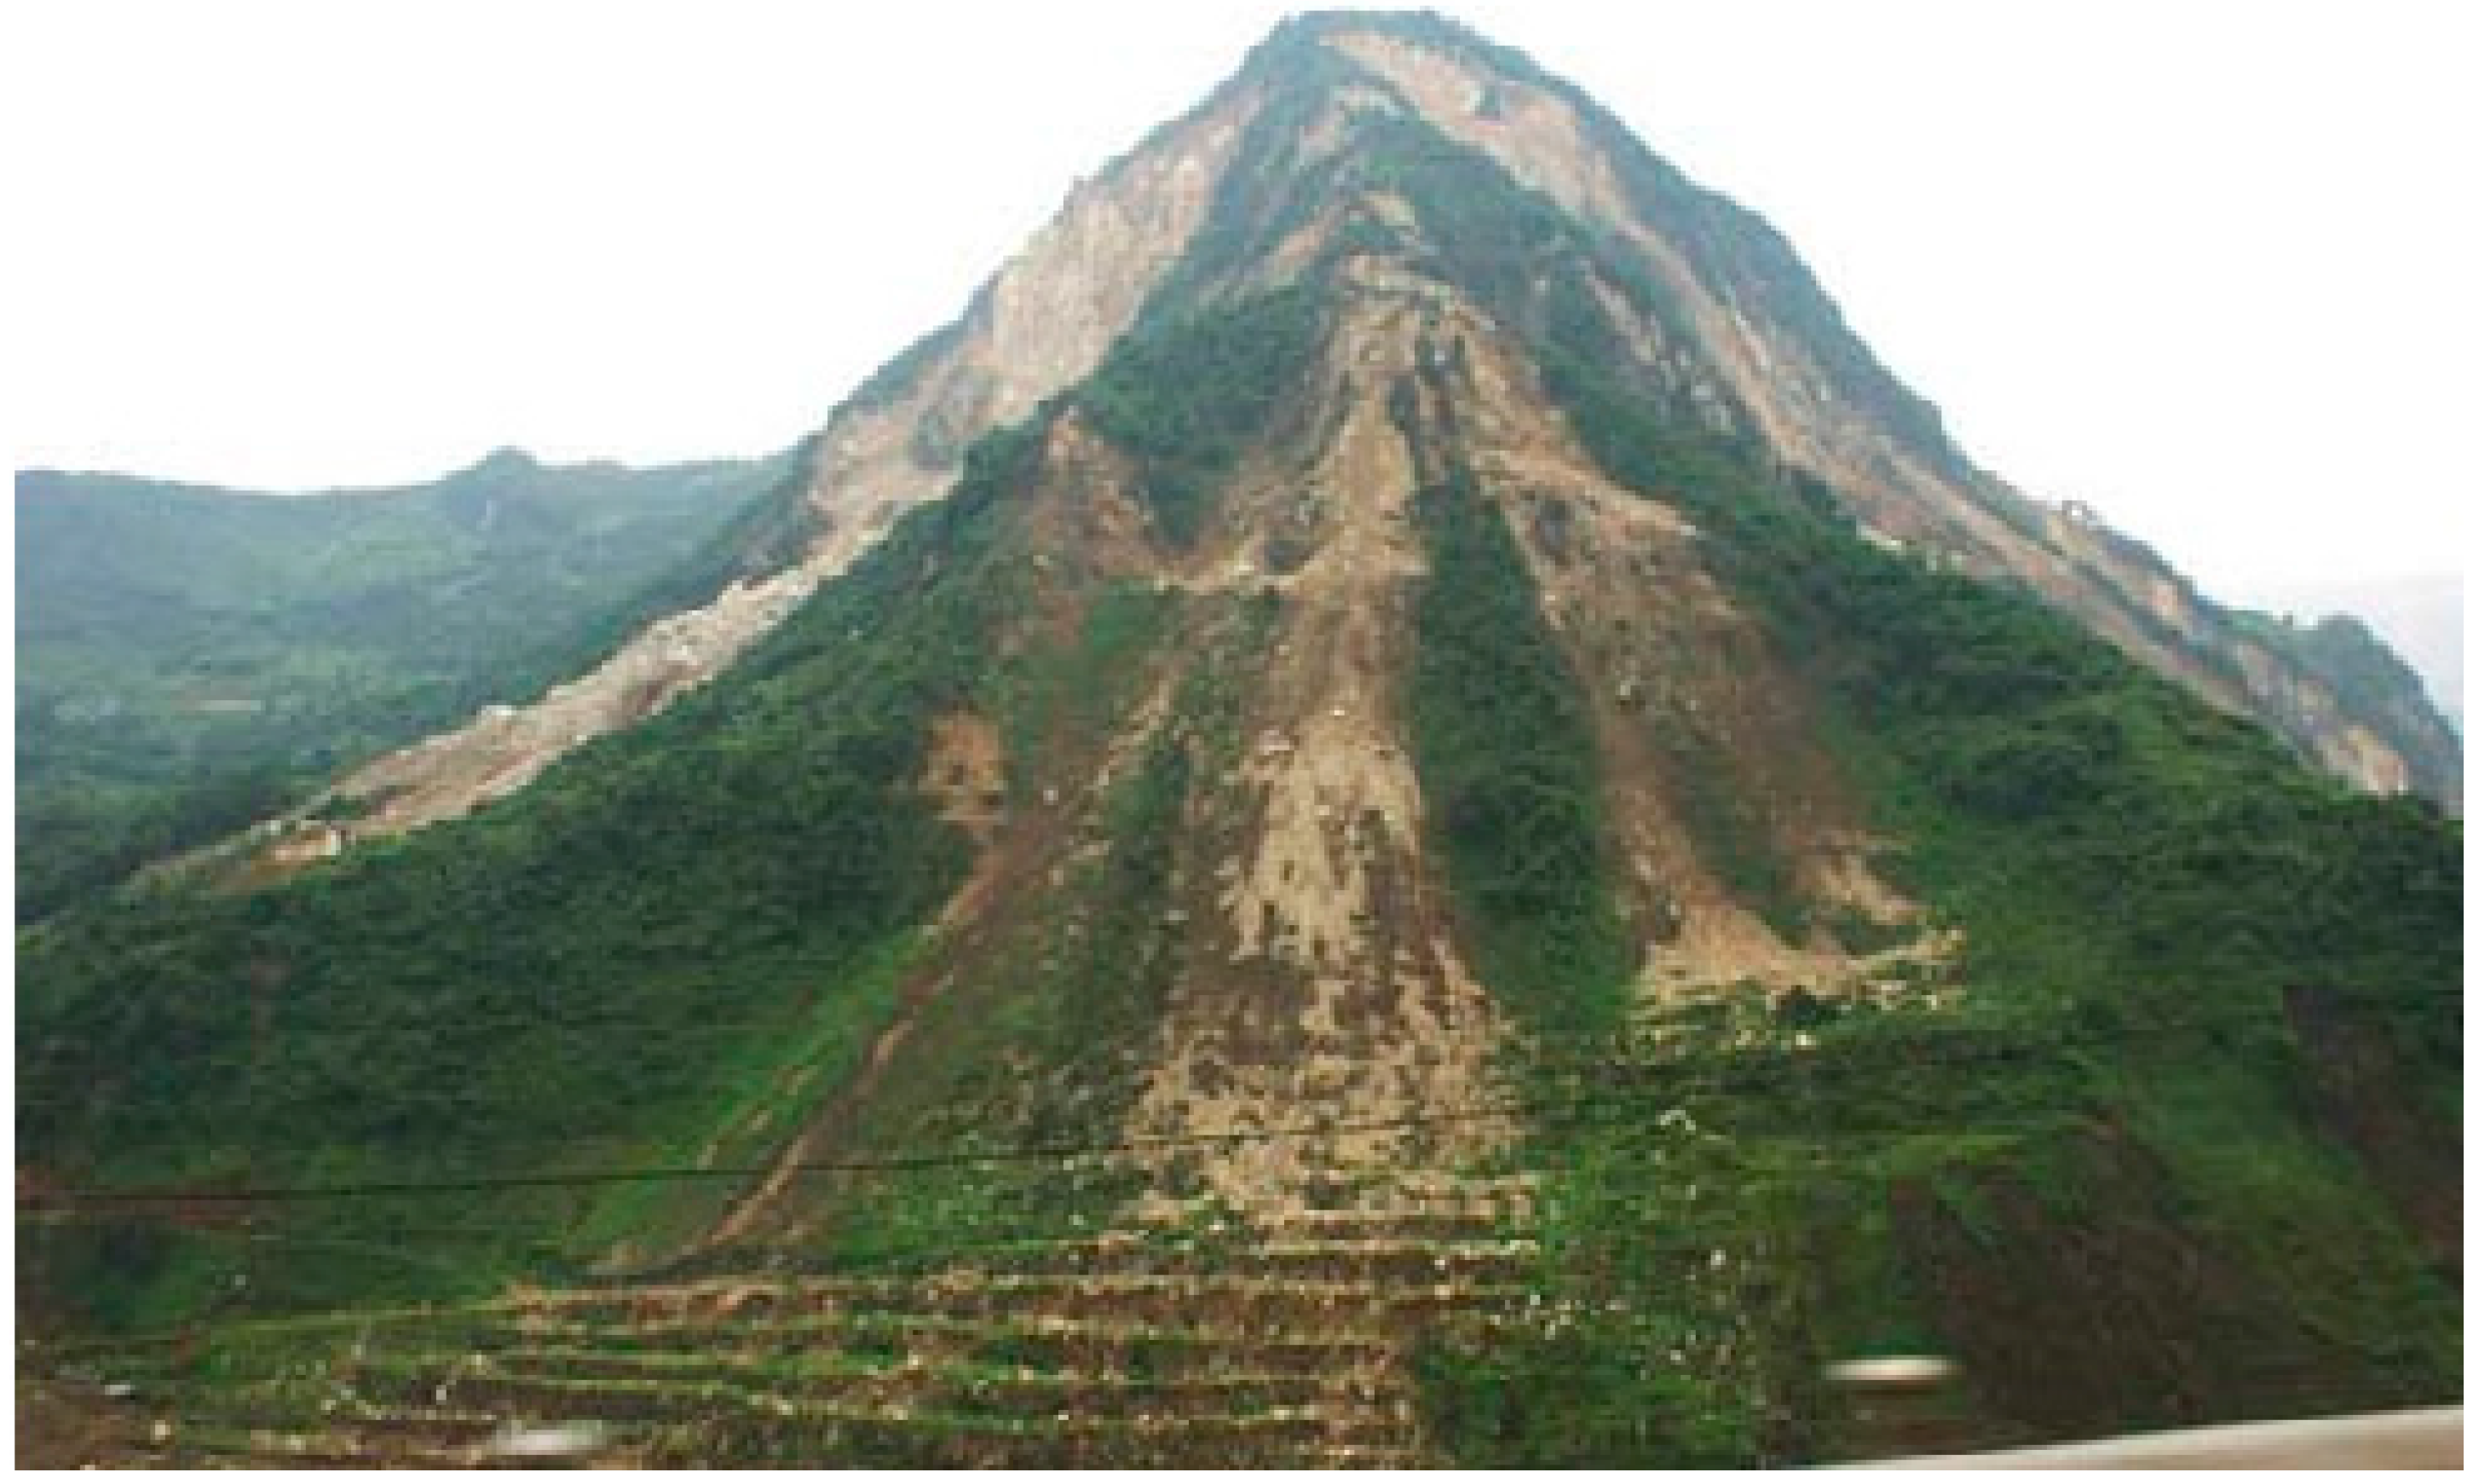
Figure 3 show that the multi-aspect terrain facing empty isolated mountains and thin ridges was seriously damaged, and the slope angles of most landslides was larger than 45°, which shows that there is some effect of slope type and slope angle on the earthquake responses of slopes, especially acceleration responses, which is the immediate cause triggering landslides.
Figure 2.
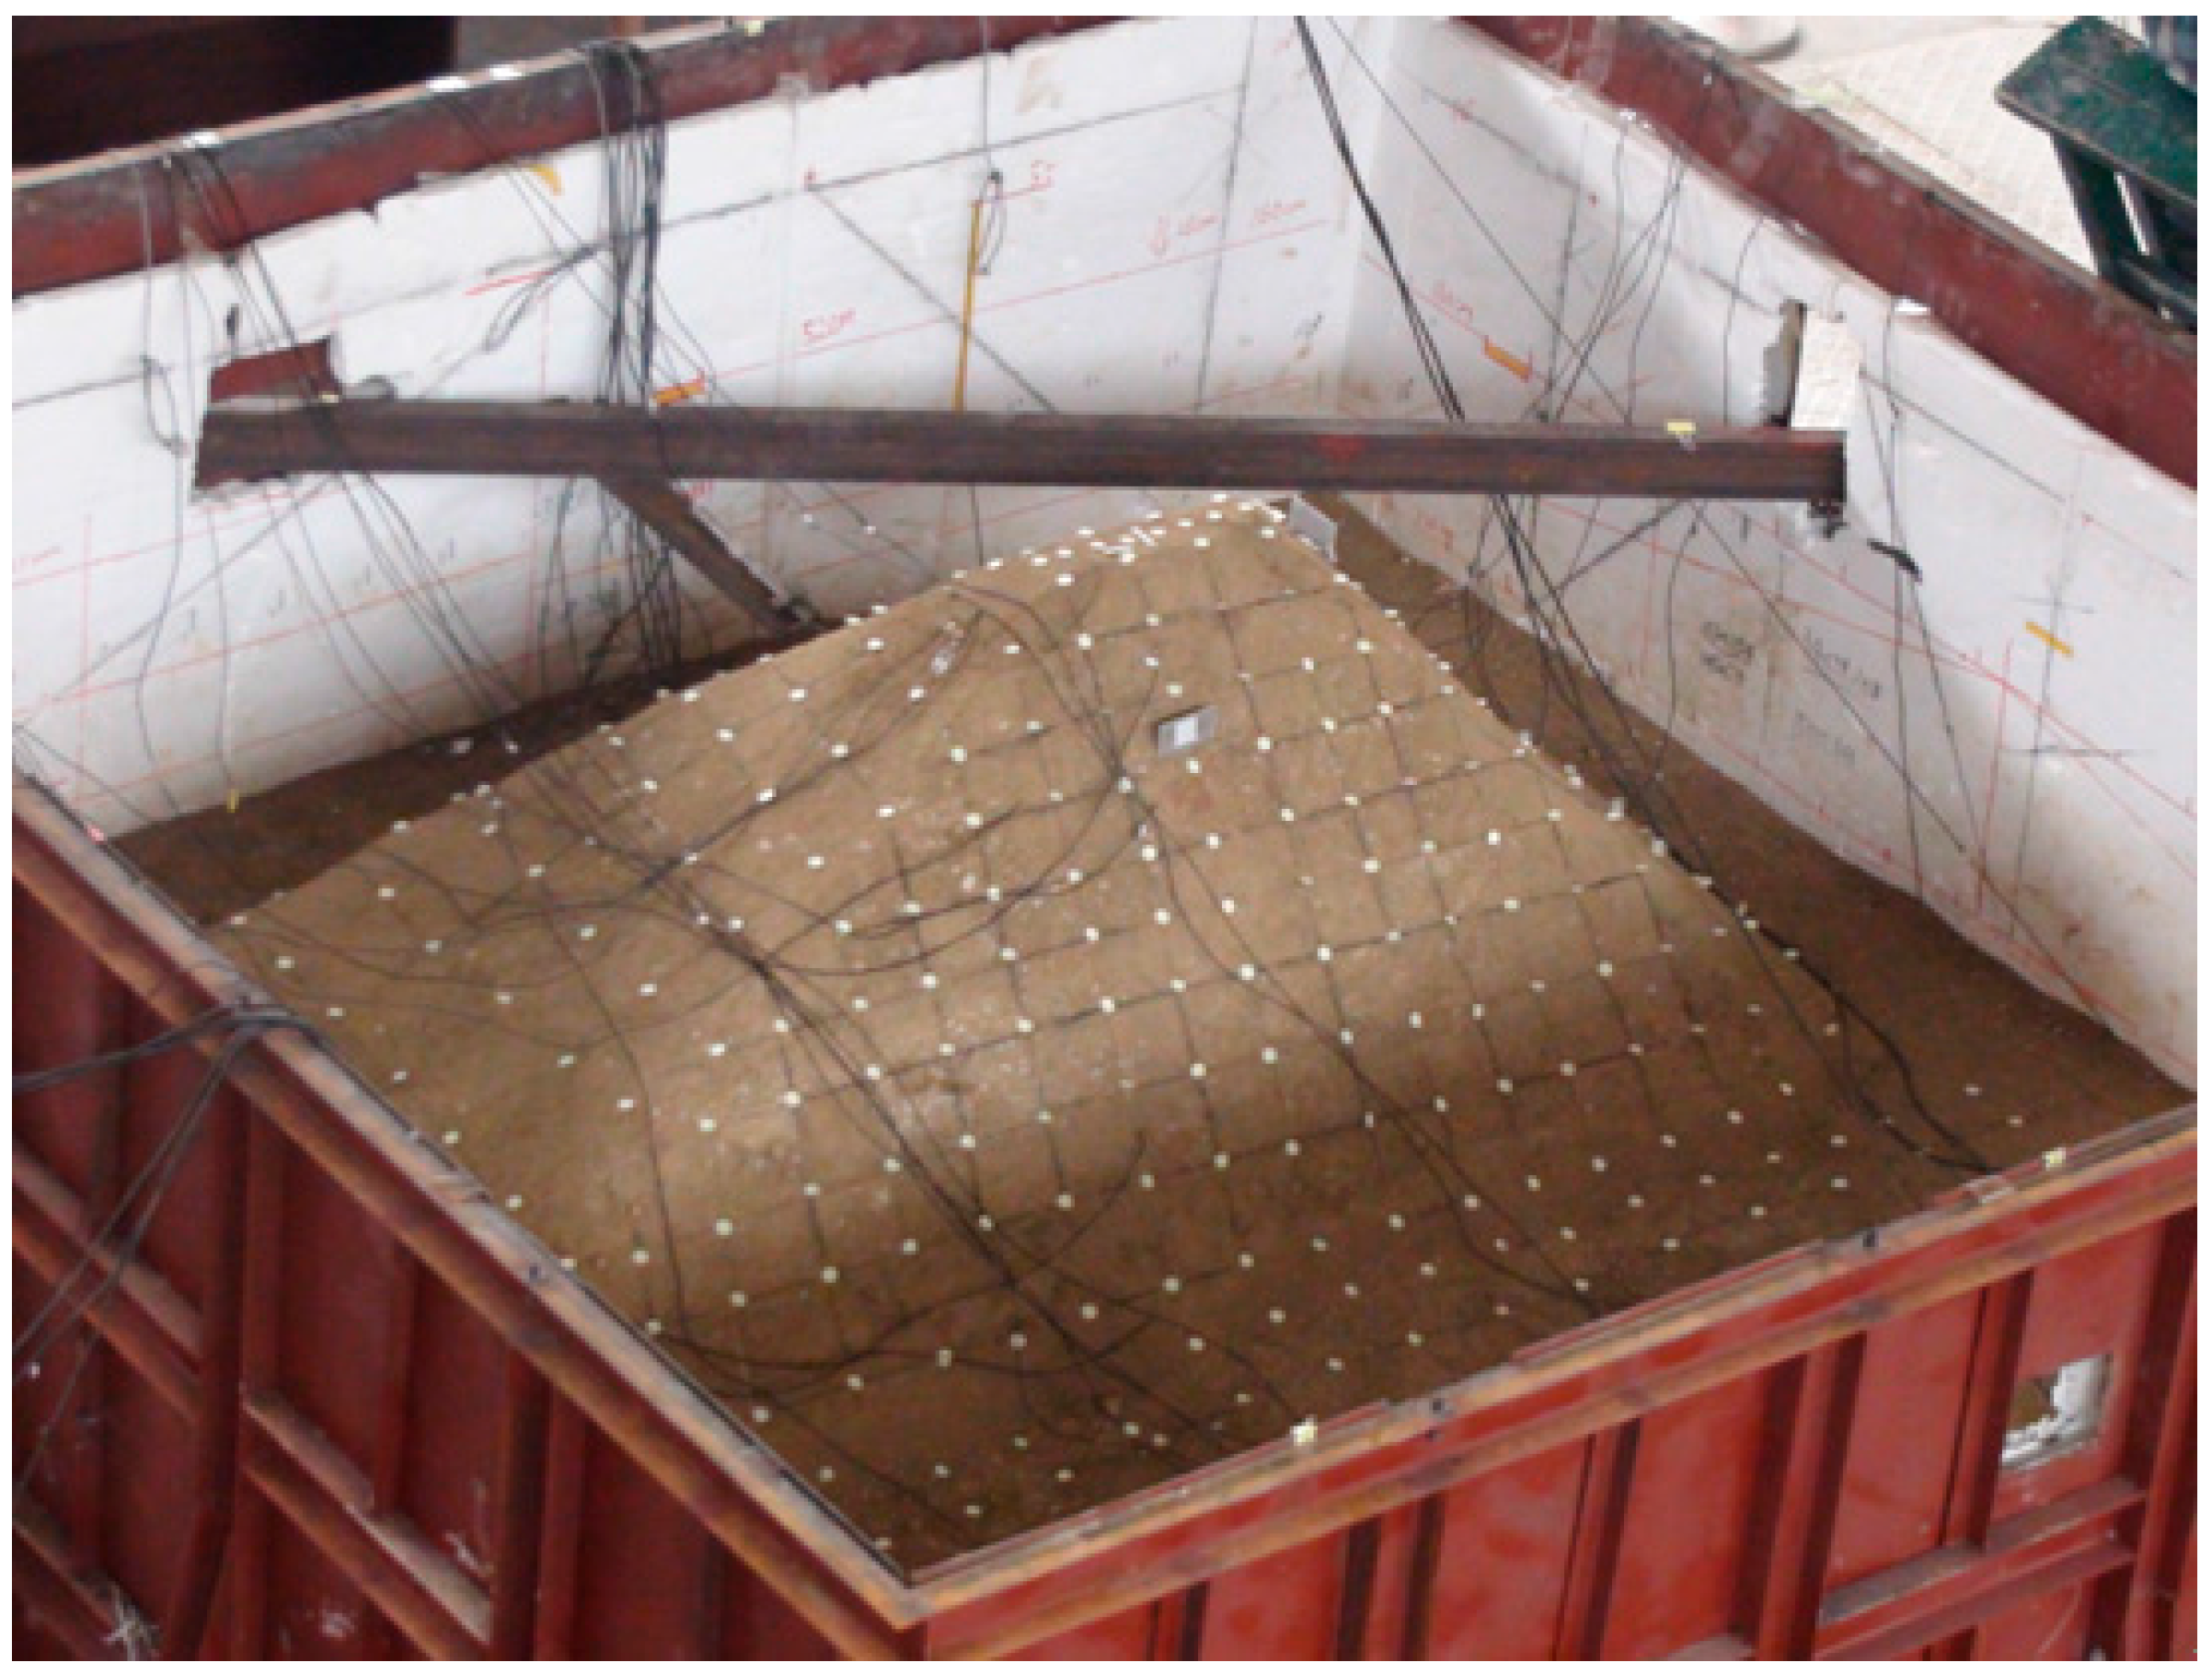
Distribution of landslide points.
Figure 2.
Distribution of landslide points.
Figure 3.
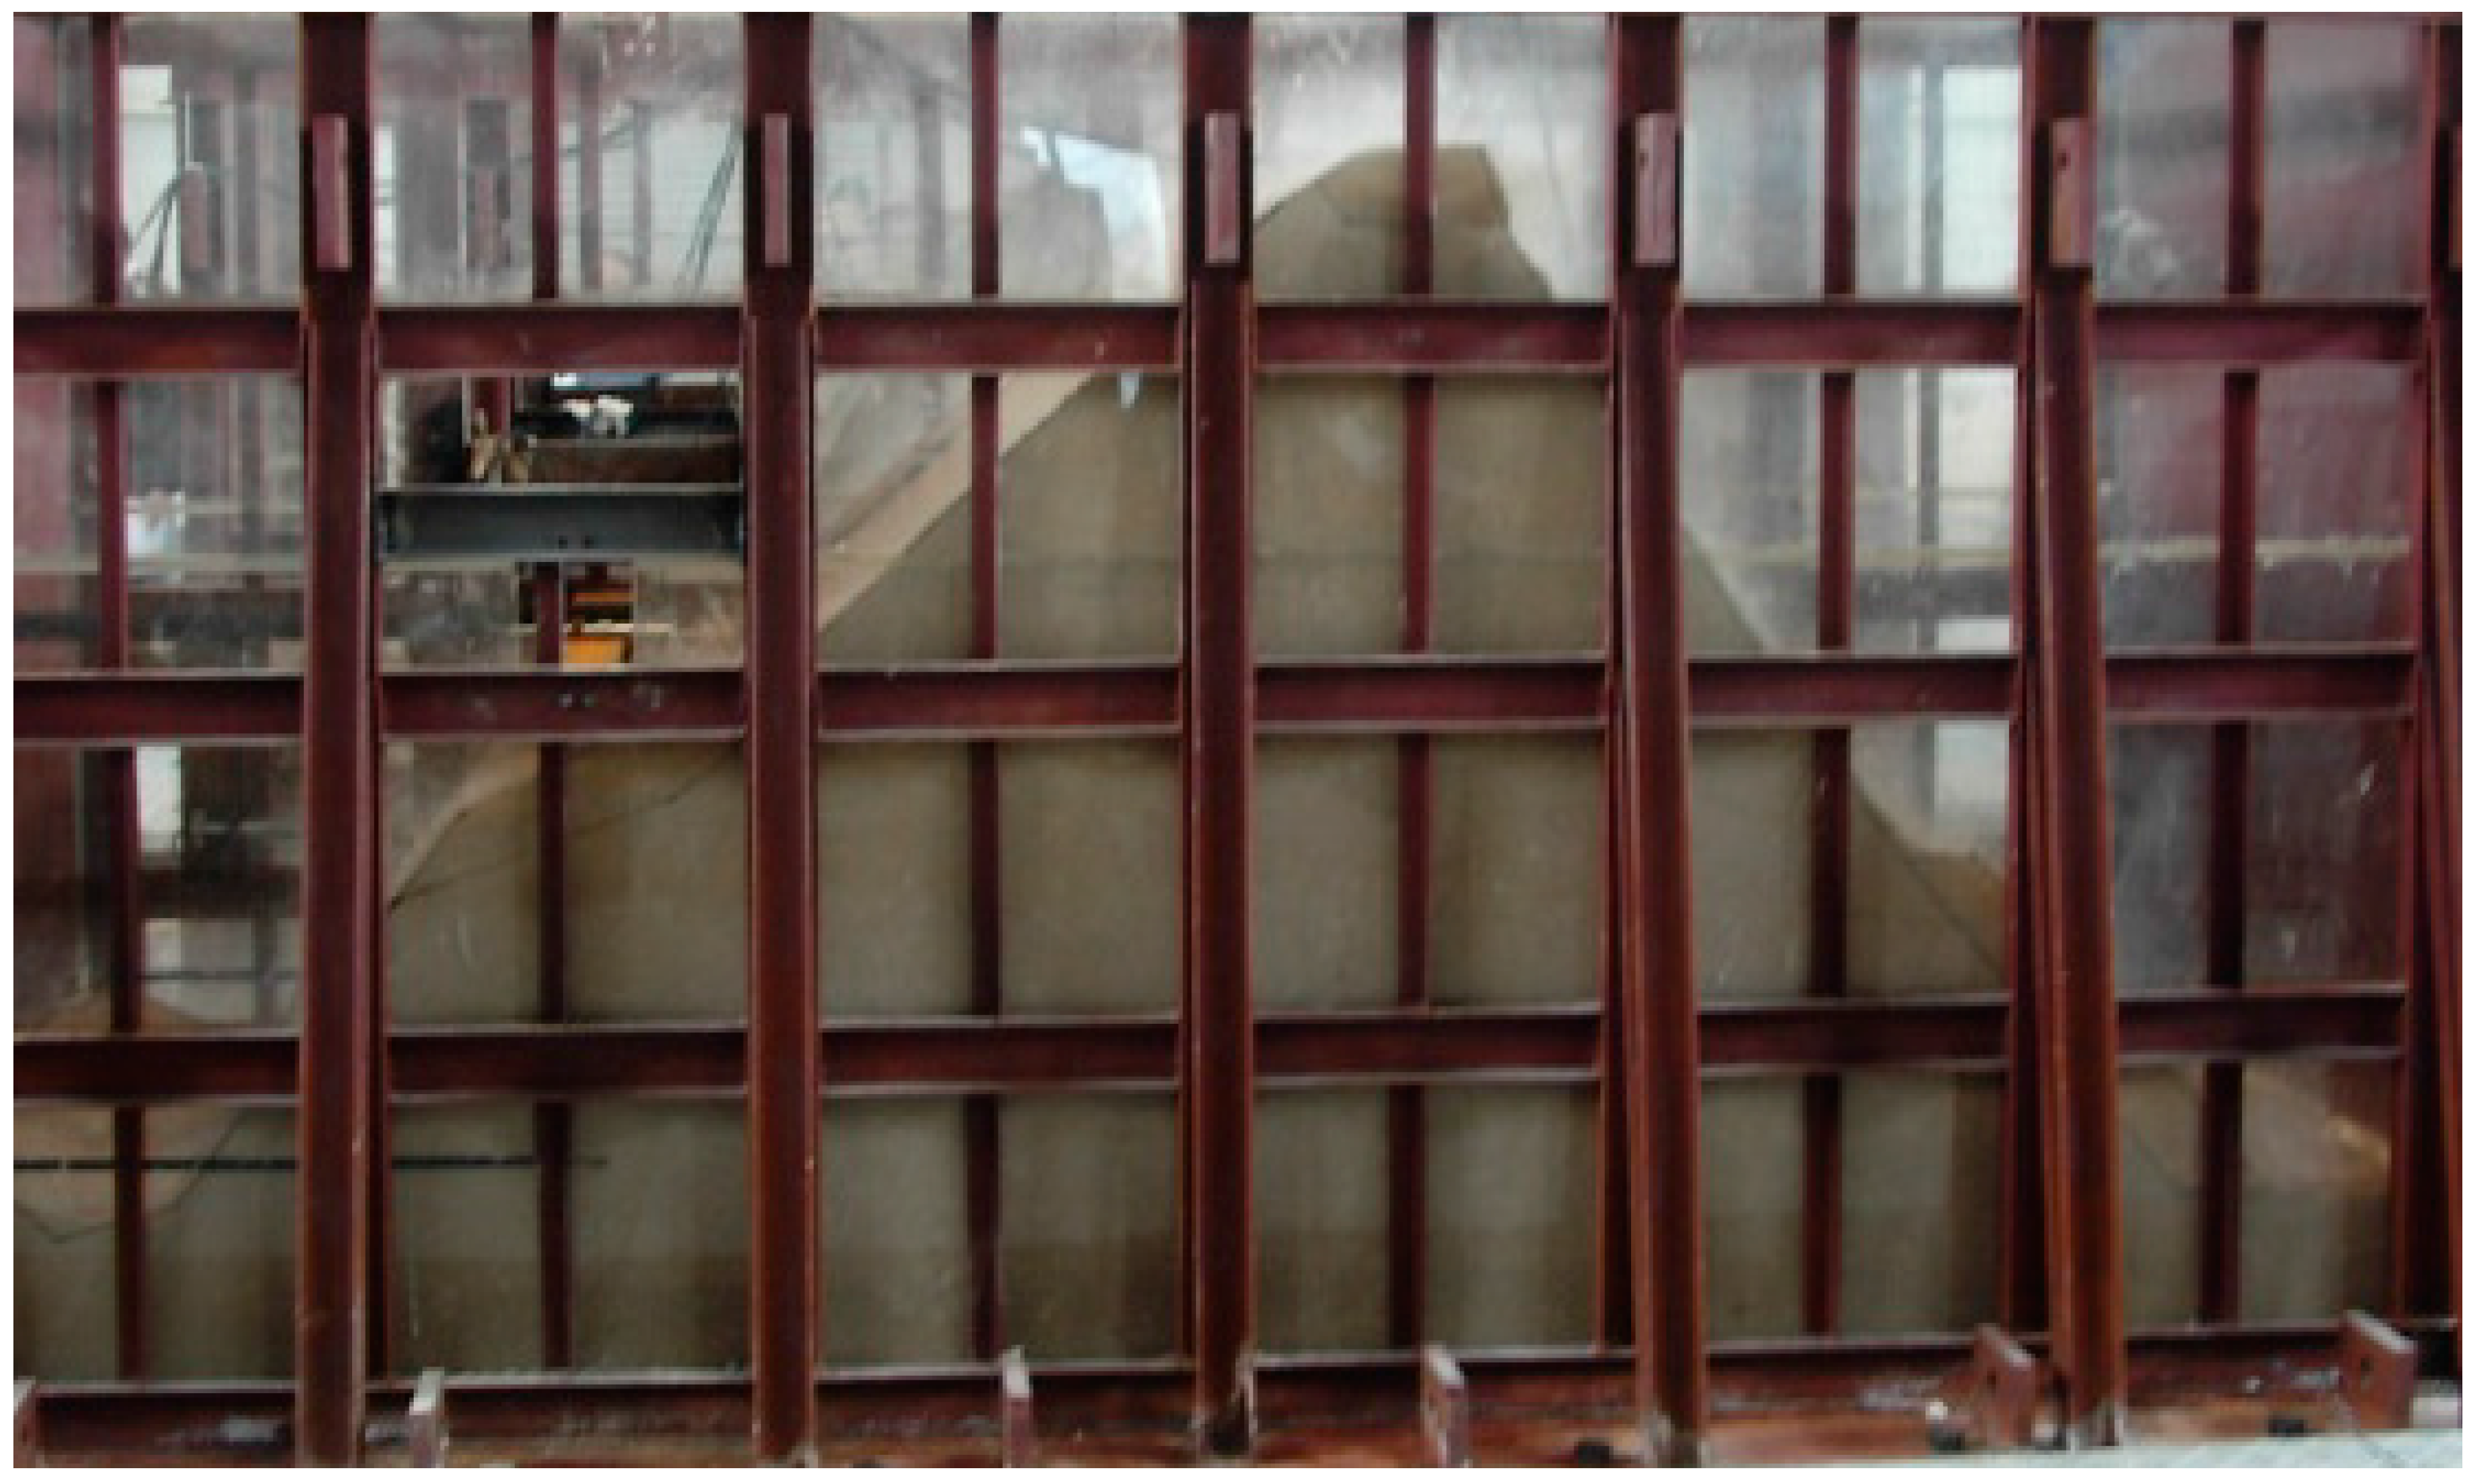
Damage phenomenon of a four sided rock slope in the Wenchuan earthquake.
Figure 3.
Damage phenomenon of a four sided rock slope in the Wenchuan earthquake.
Aiming at the above disaster phenomena, abundant scientific research has been conducted and abundant findings have been achieved [
15,
16,
17,
18,
19]. However, this research just focused on the fission laws of single slopes or statistical analyses of the disaster phenomena. Therefore, this article will study the phenomena based on the results from the field investigation and three groups of shaking table tests, in theh hope that the results will help us understand the disaster results.
3. Effect of Slope Type on Elevation Amplification of Acceleration
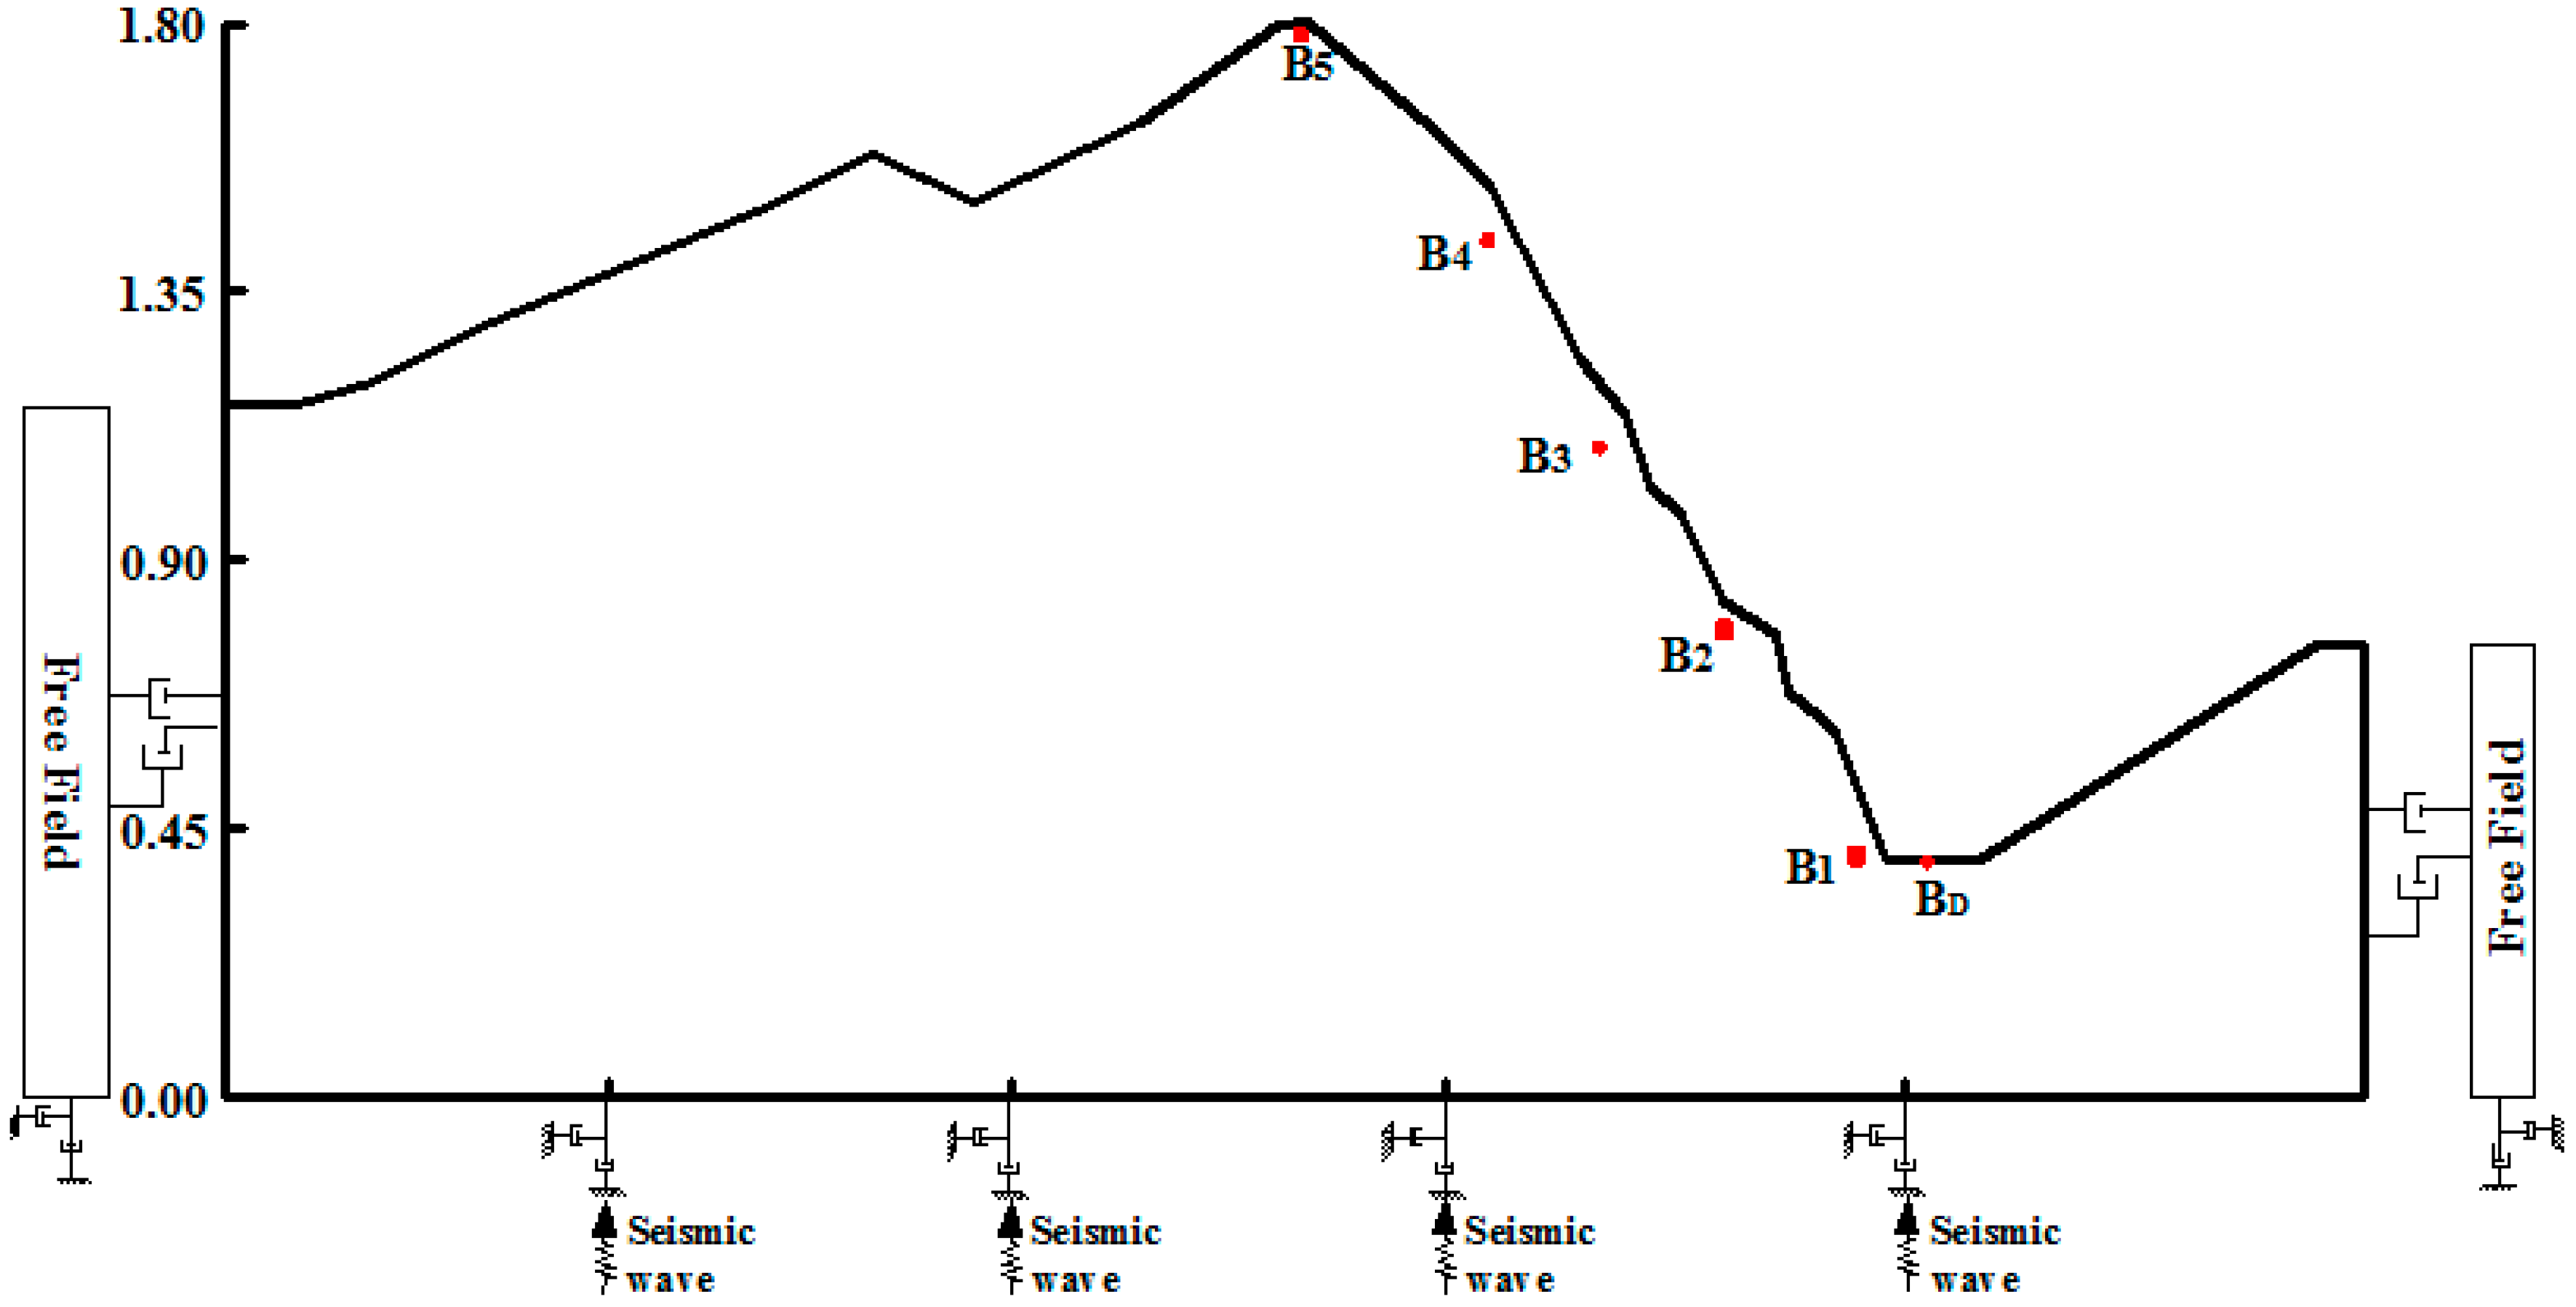
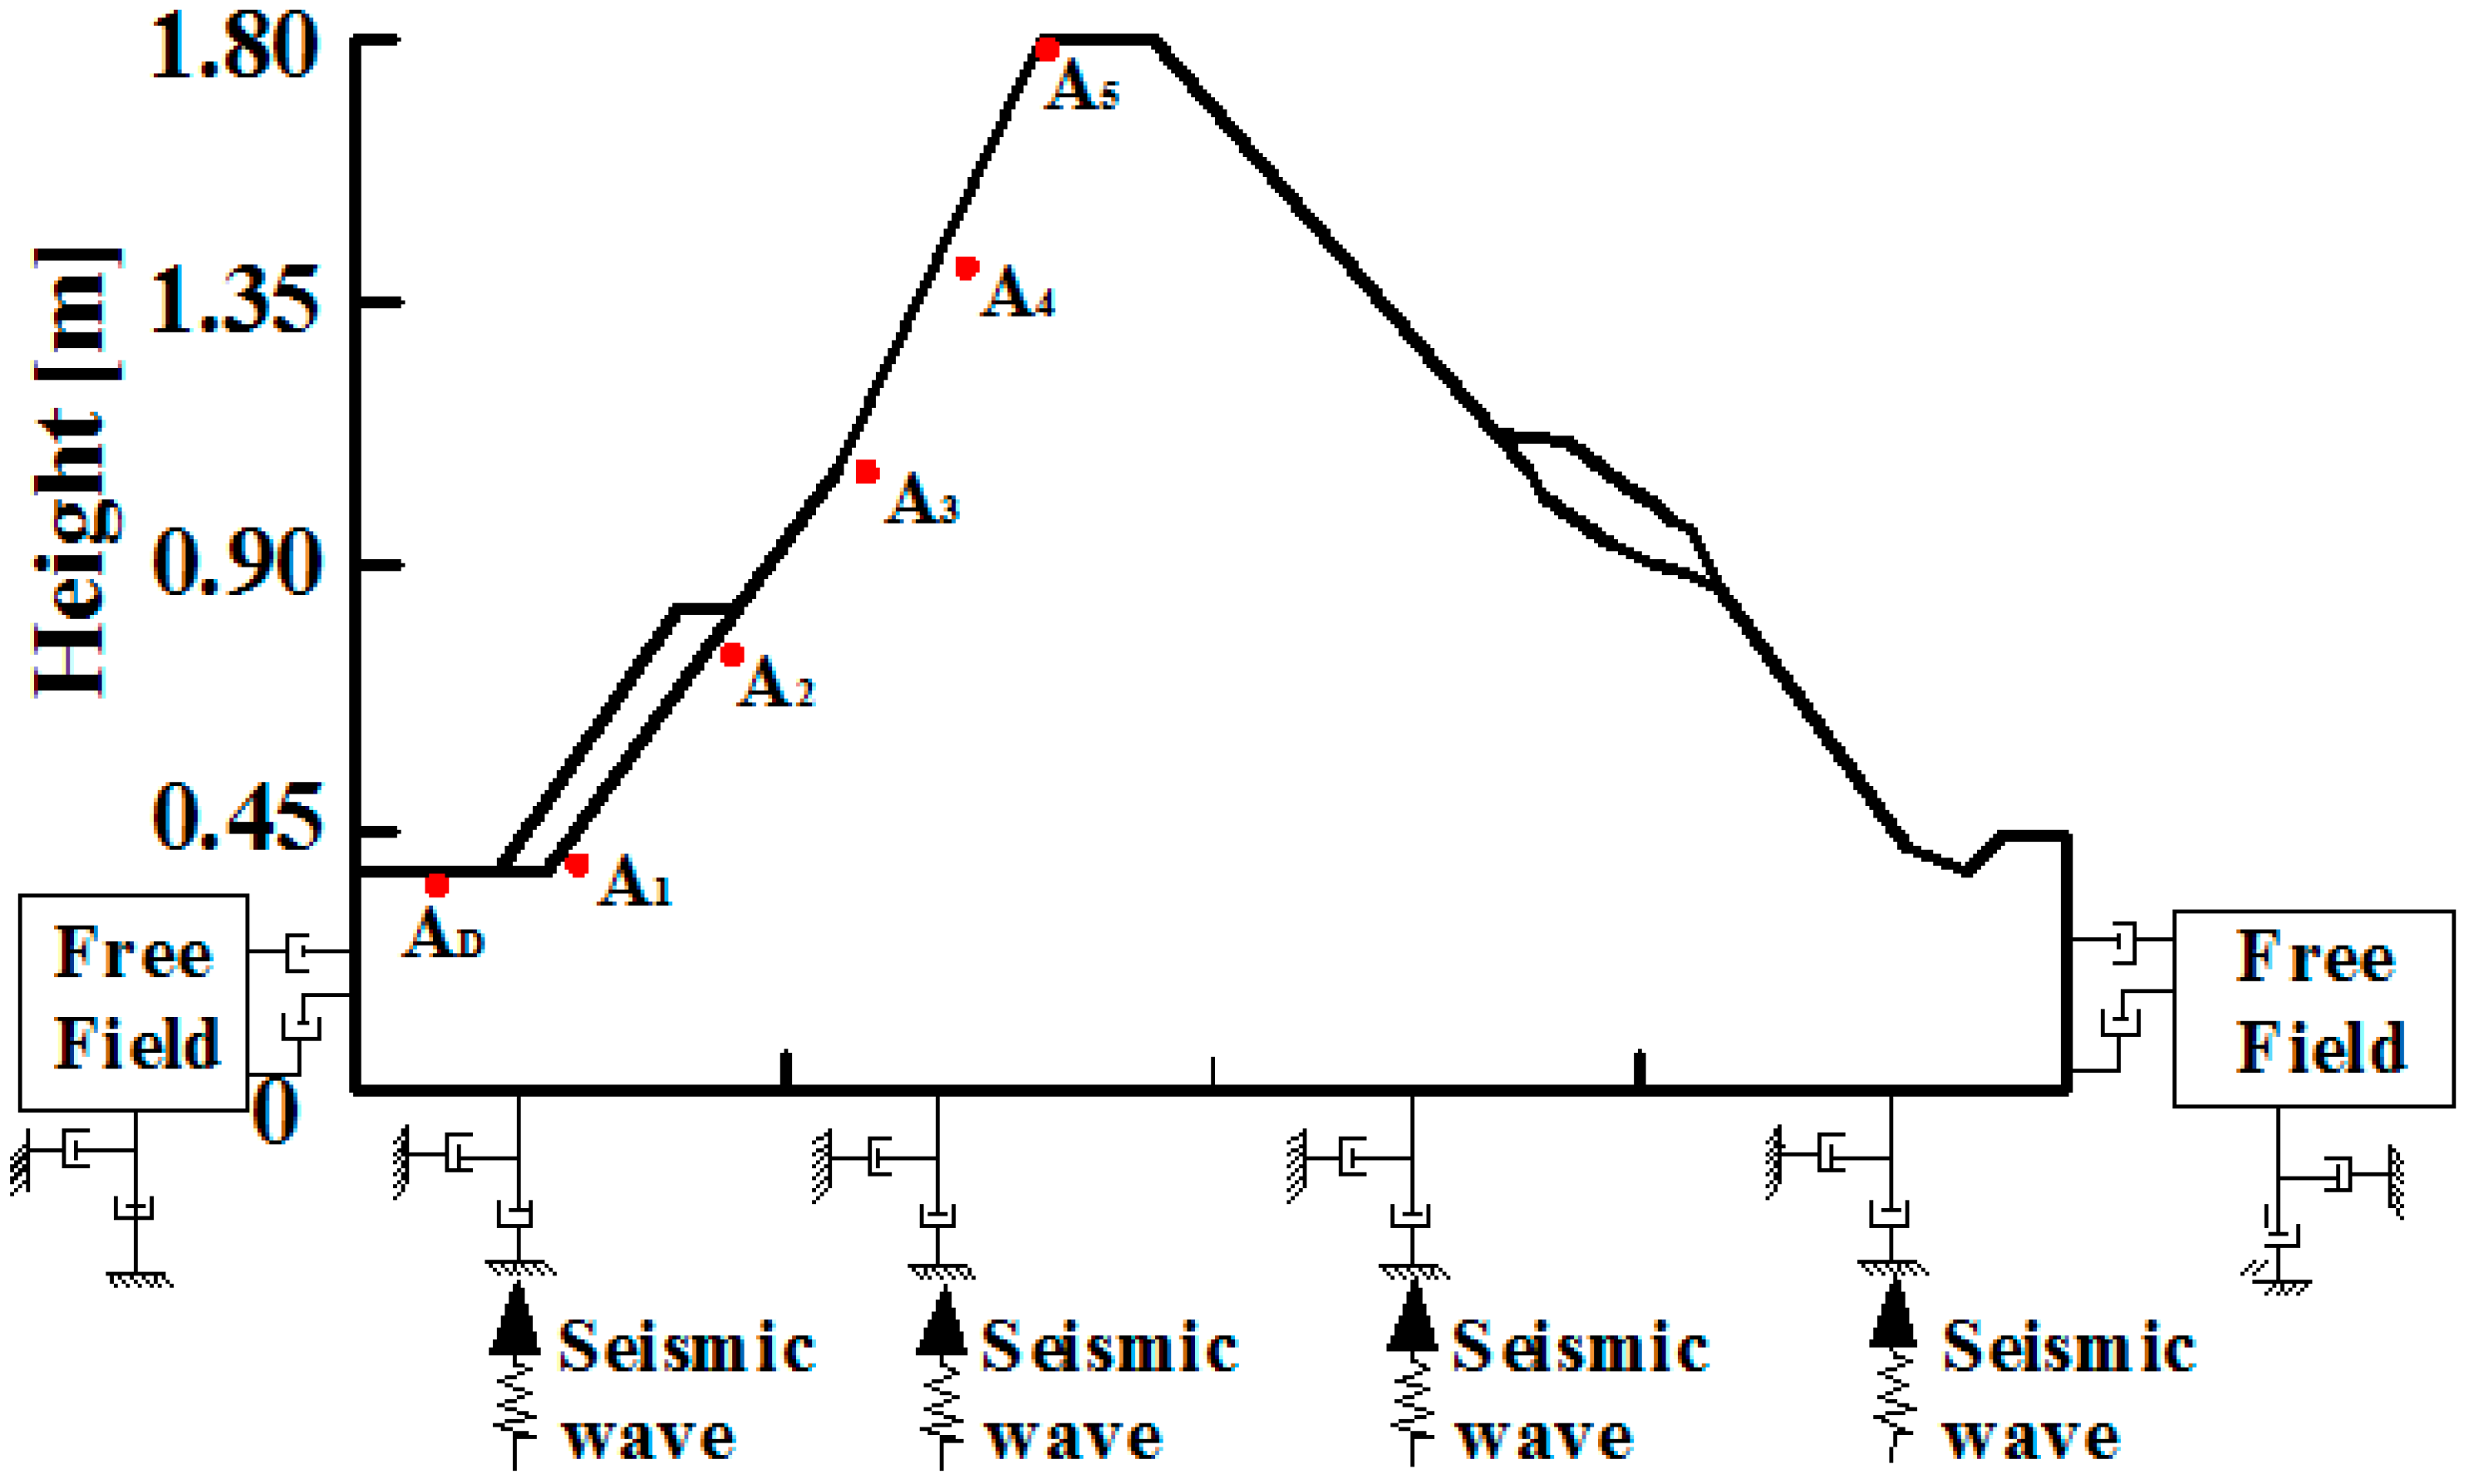
The amplification coefficient of acceleration is defined as the ratio of acceleration amplitude in the slope and acceleration amplitude at free field and horizontal acceleration, illustrated as follows: for the one-sided slope model, for example (
Figure 10) the x-direction acceleration amplitude of any point A
5 in the slope is A
X5, and that of point A
D in the free field is A
XD, then the x-direction acceleration amplification coefficient δ
X is written as: δ
X = A
X5/A
XD. In order to express the influences of the different type slopes on the elevation acceleration amplification effect intuitively, the elevation of each slope is normalized. In addition, the four-sided slope contains four slopes, the gradient of the one-sided slope is nearly equivalent to that of two-sided slope, and nearly equal to 50°, so a slope with 50° gradient is suitable for this analysis, thus slope type is the only influencing factor taken into consideration, ignoring the impact of slope gradient.
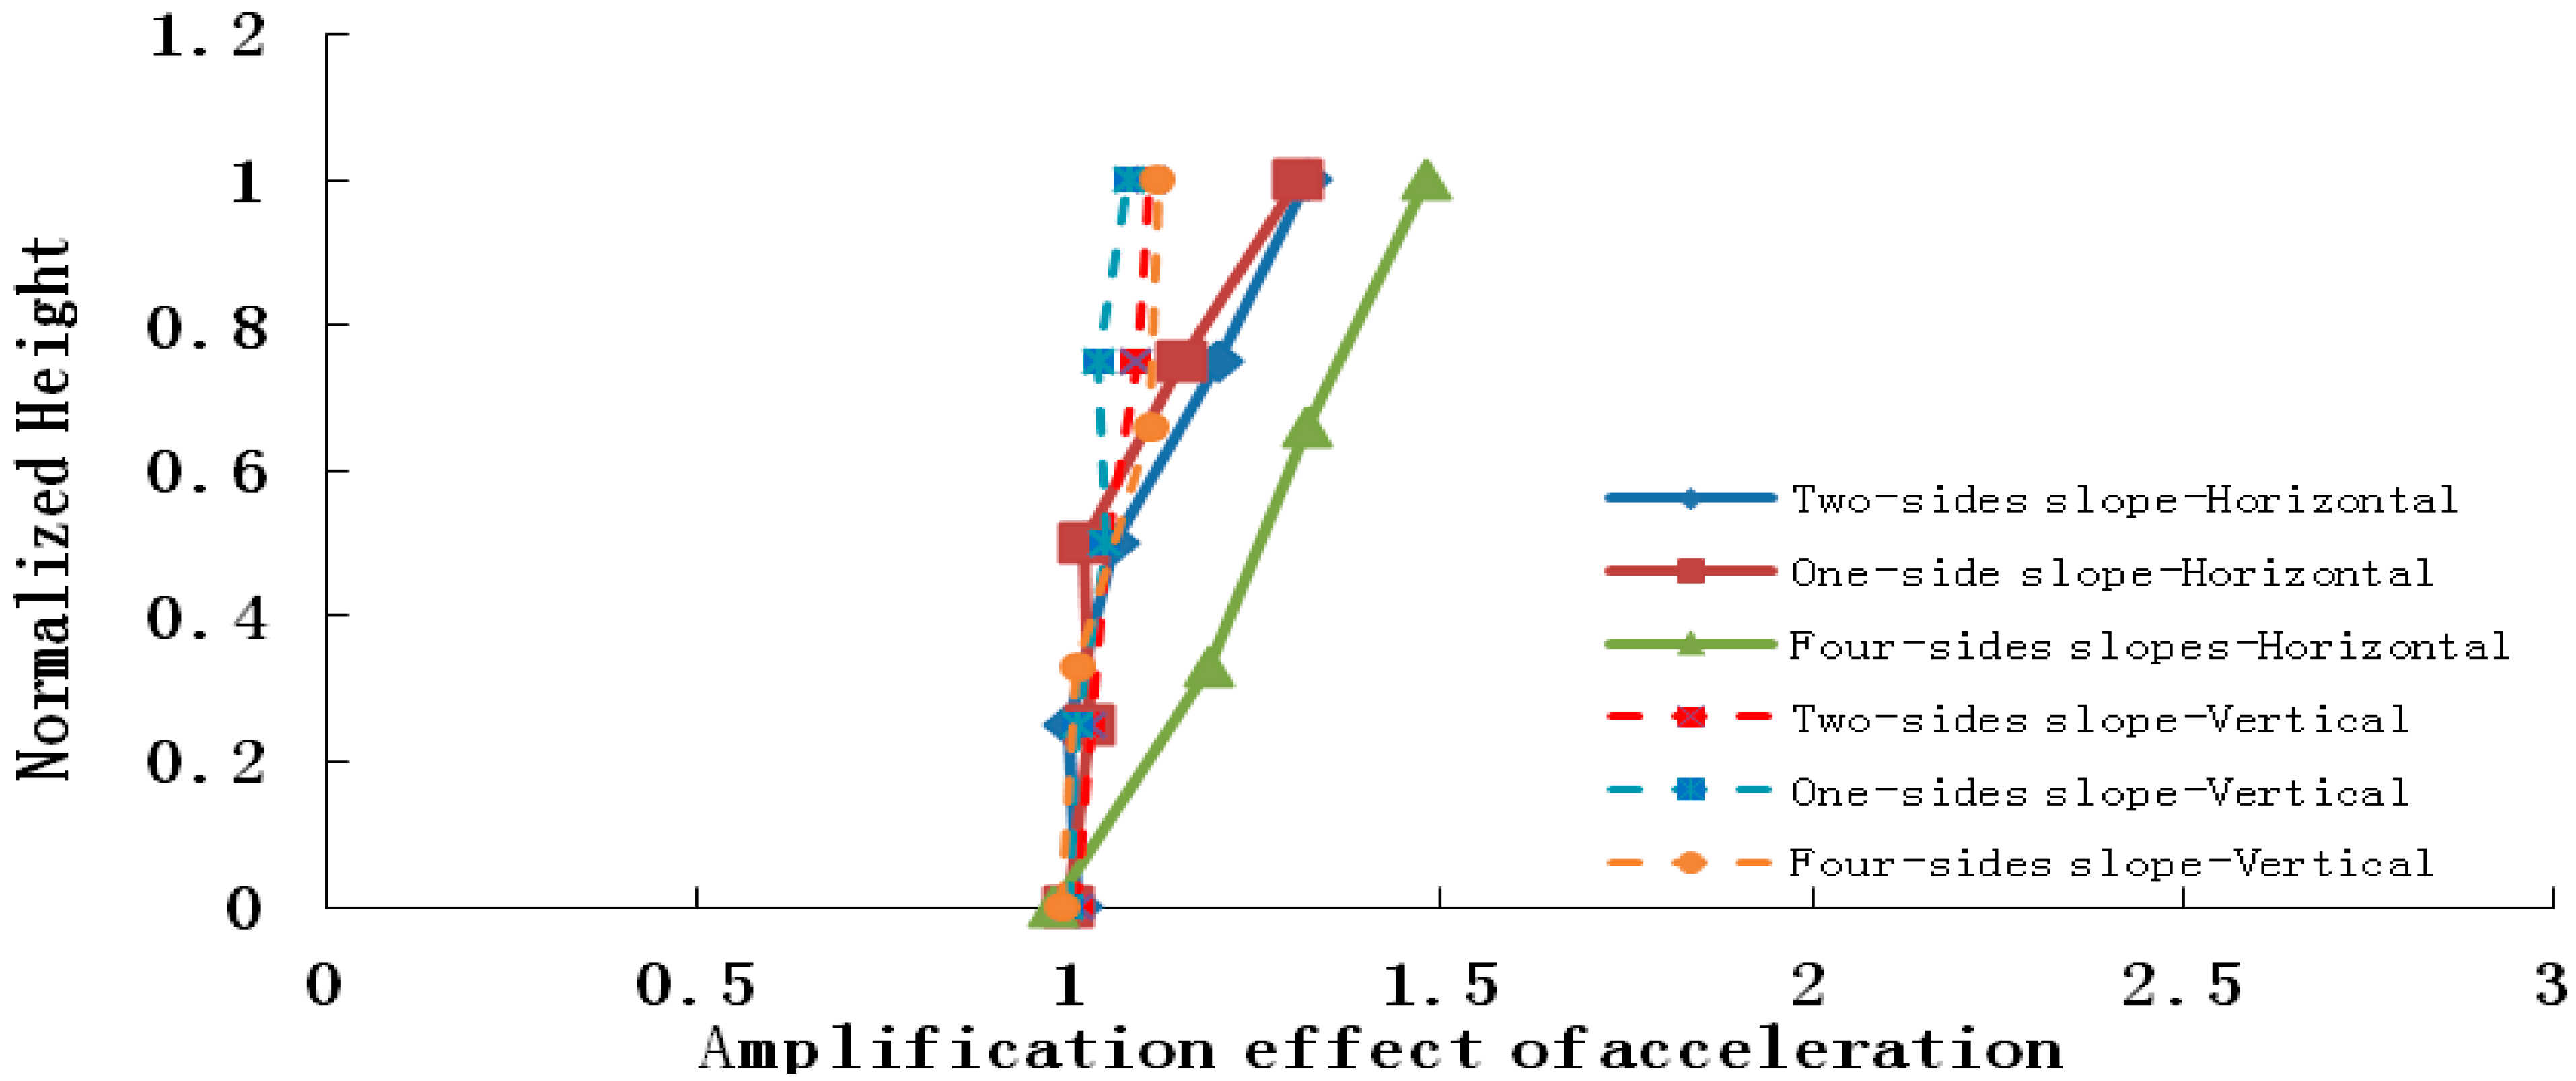
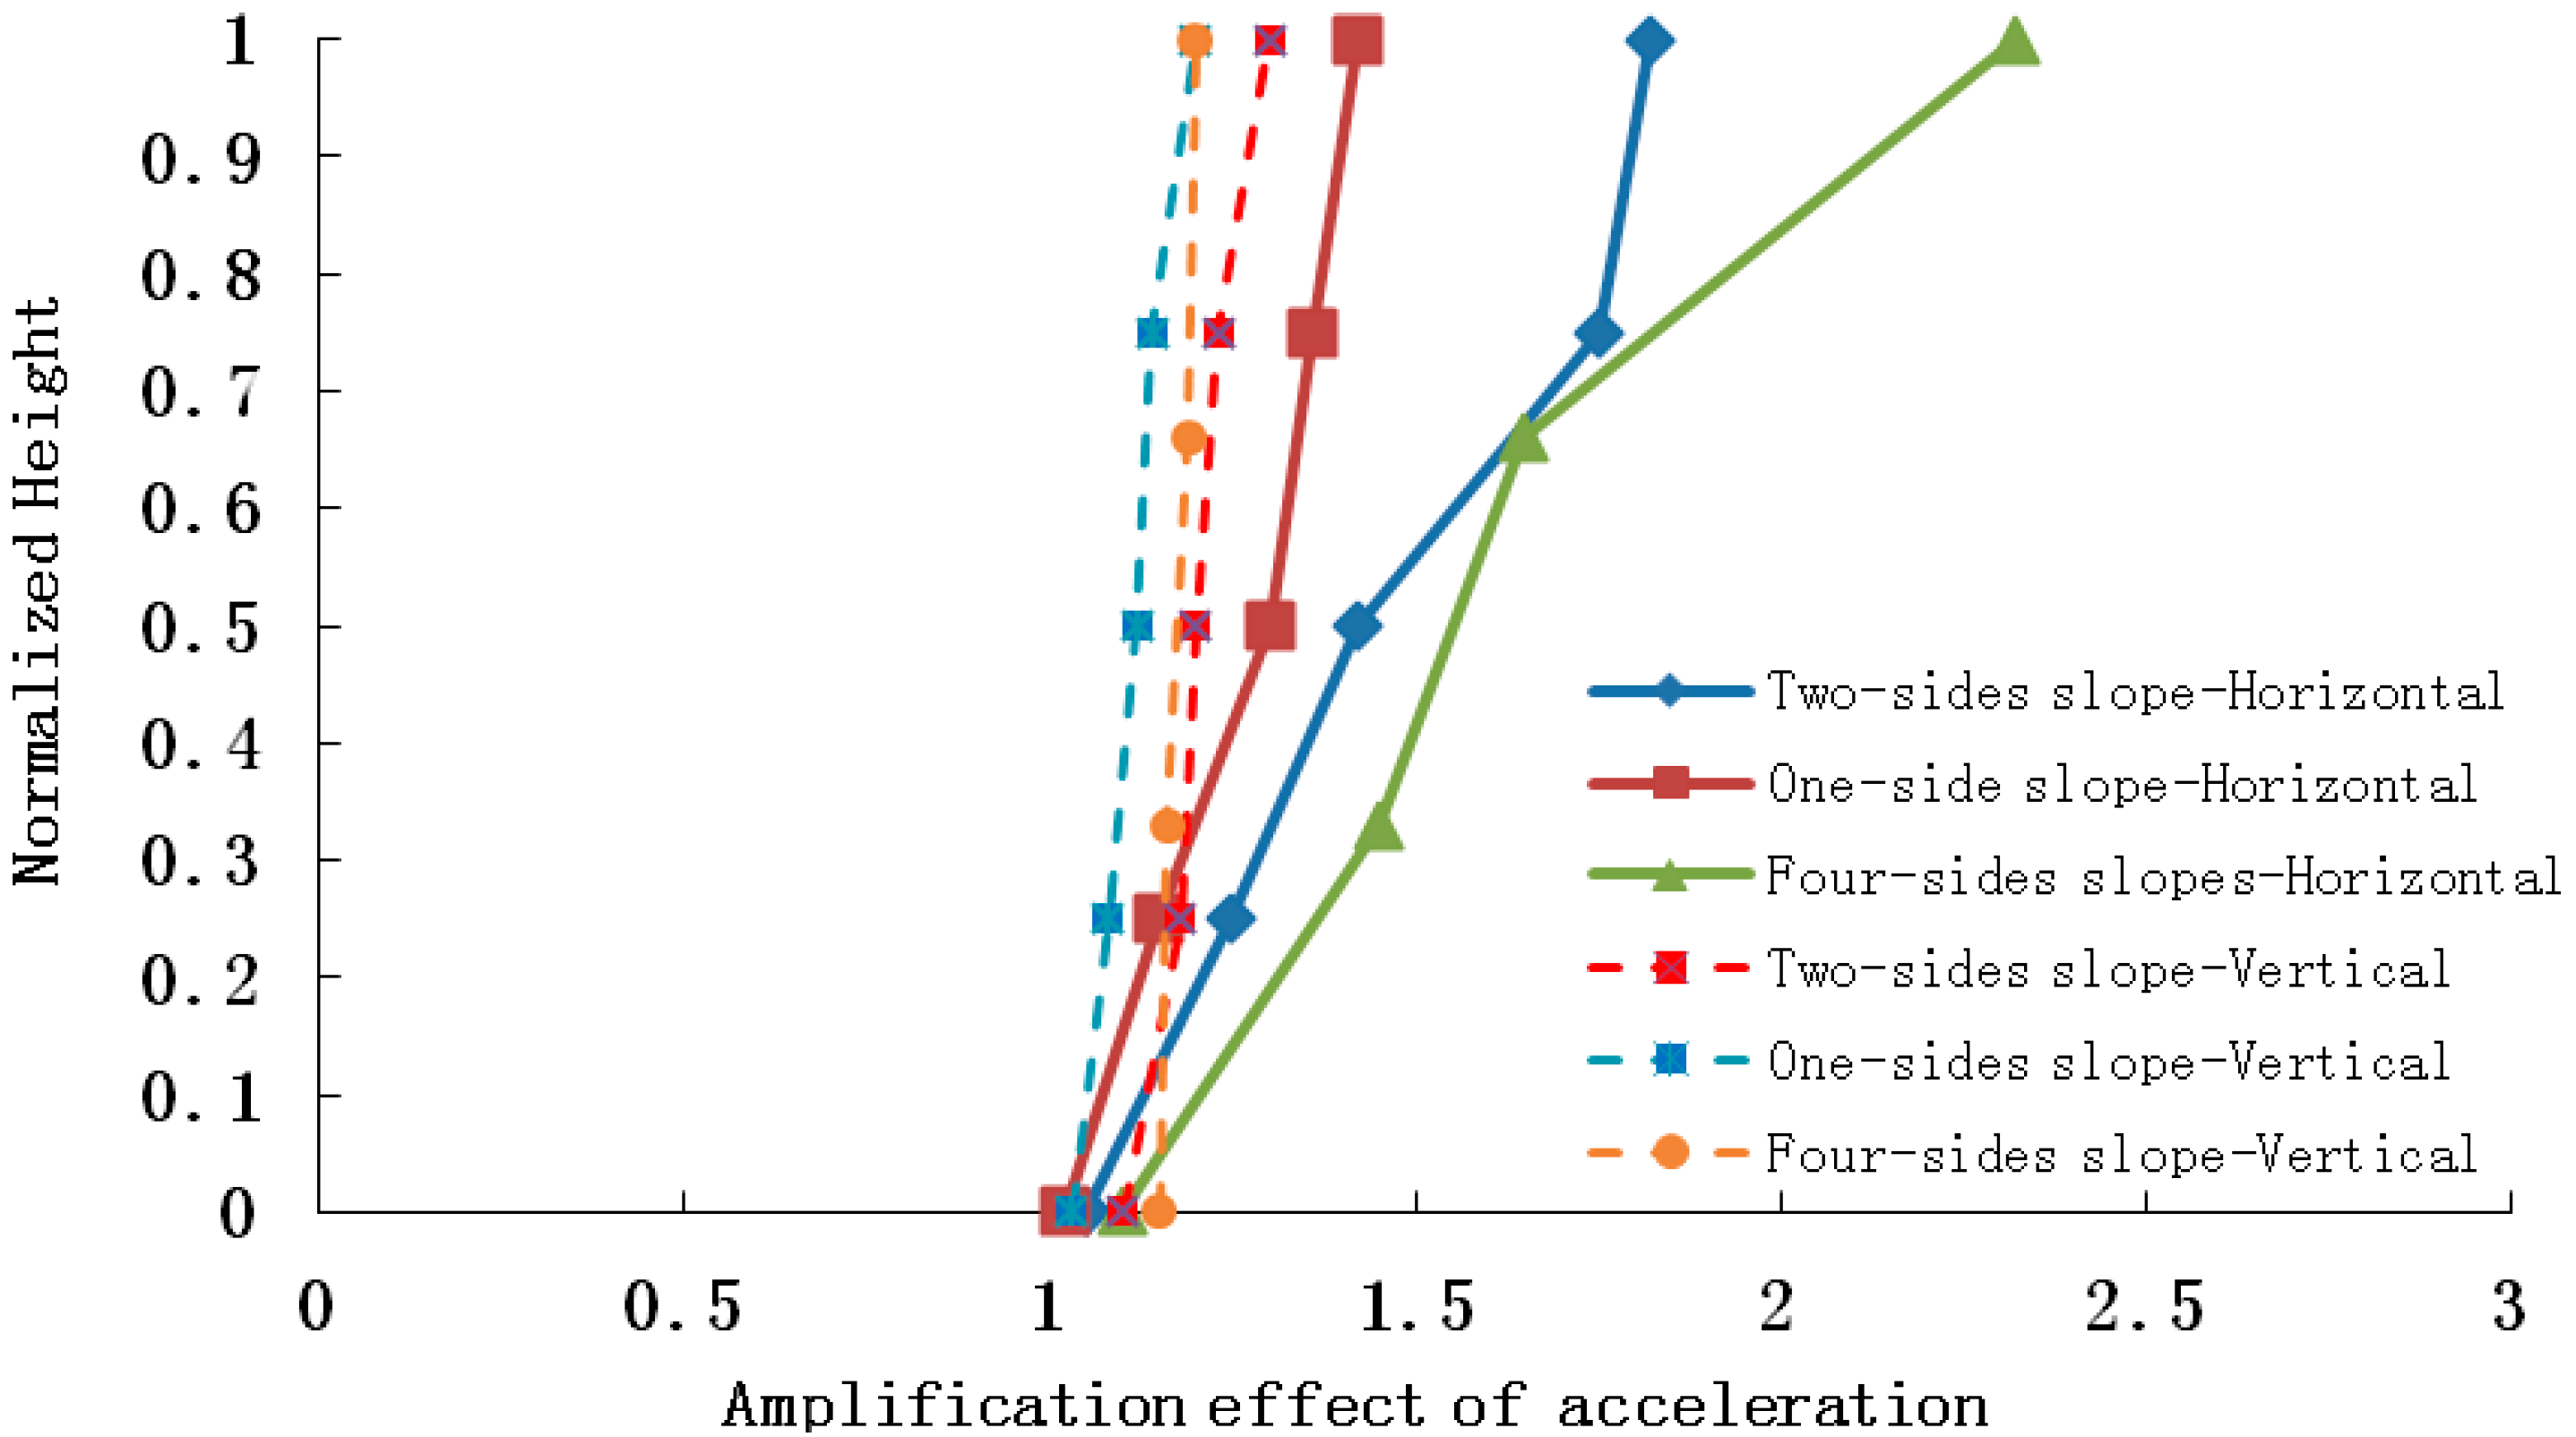
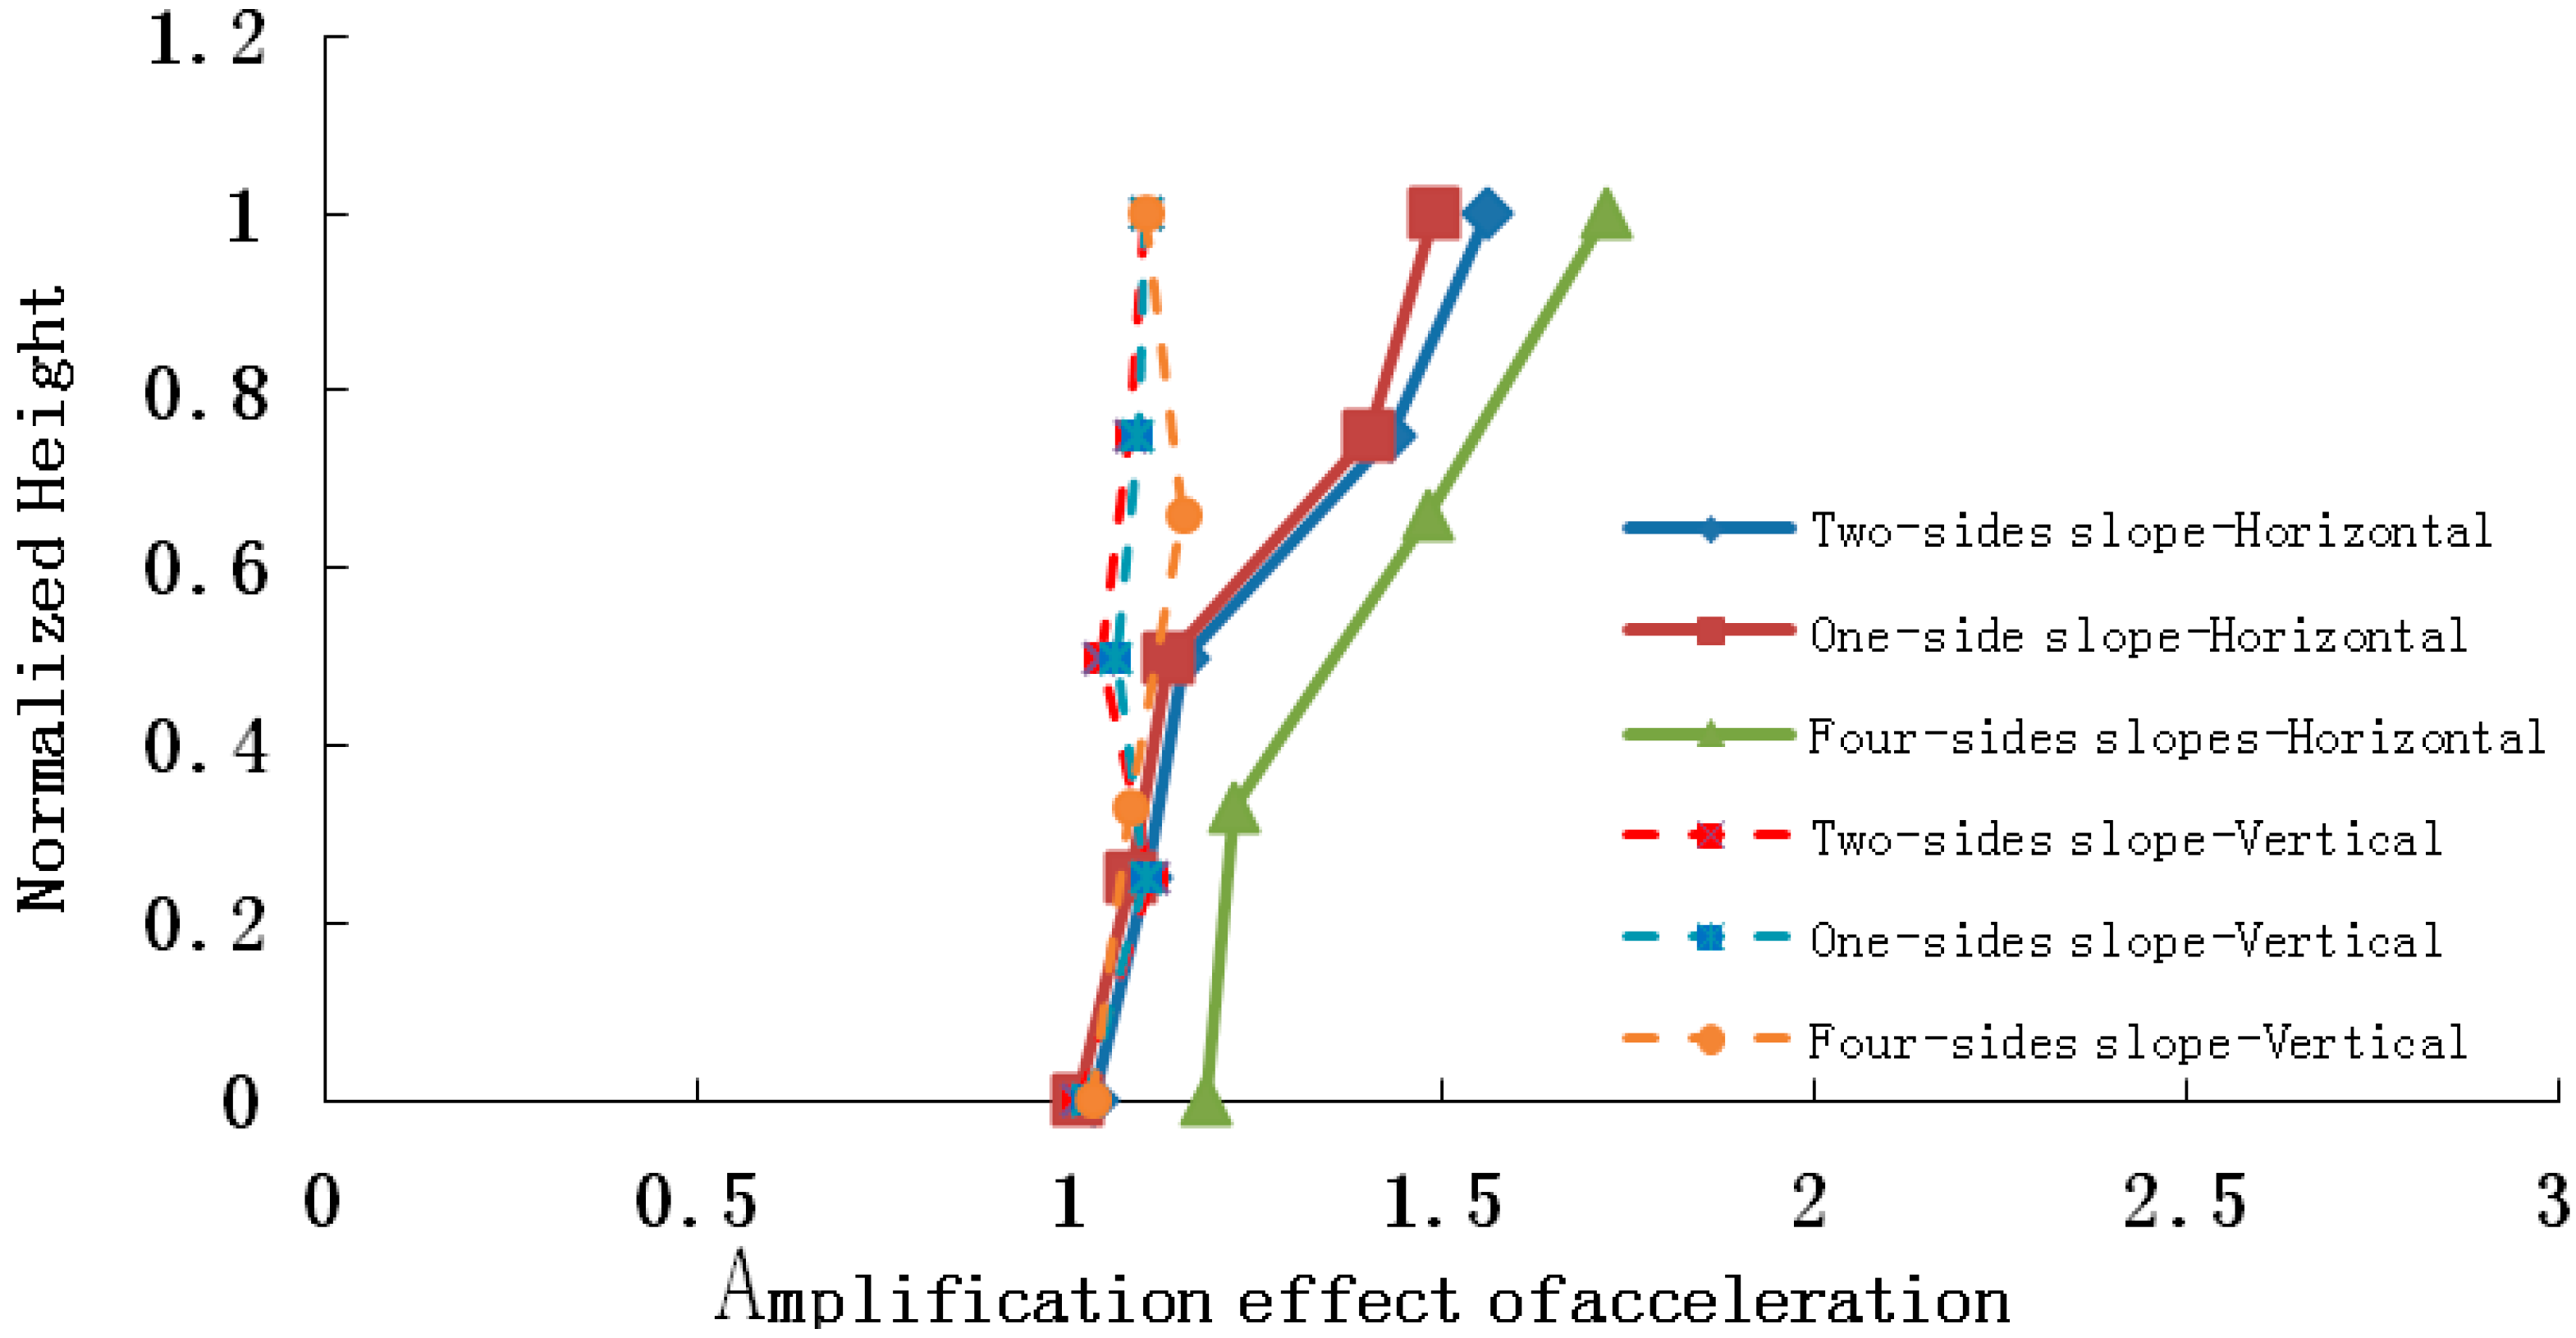
The conclusion drawn from the shaking table test results is that elevation acceleration amplification effect appears not only in the horizontal peak acceleration, but also the vertical peak acceleration, which is shown in
Figure 12,
Figure 13 and
Figure 14.
Figure 12.
Horizontal and vertical acceleration amplifications when the input is PGA = 0.2 g.
Figure 12.
Horizontal and vertical acceleration amplifications when the input is PGA = 0.2 g.
Figure 13.
Horizontal and vertical acceleration amplifications when the input is PGA = 0.4 g.
Figure 13.
Horizontal and vertical acceleration amplifications when the input is PGA = 0.4 g.
Figure 14.
Horizontal and vertical acceleration amplifications when the input is PGA = 0.7 g.
Figure 14.
Horizontal and vertical acceleration amplifications when the input is PGA = 0.7 g.
As the four pictures above show, when 0.2 g, 0.4 g and 0.7 g seismic waves are input into the slope models, the amplification coefficients of the horizontal acceleration of a four-sided rock steep slope varies in the range 1.04–2.15, 1.15–1.89 and 1.00–1.48, respectively, and those of a two-sided rock steep slope are 1.05–1.95, 1.08–1.76 and 1.01–1.32, and those of a one-sided rock steep slope are 1.01–1.60, 1.03–1.62 and 1.00–1.13, while the vertical acceleration amplification coefficients of the four-sided rock steep slope vary in the range 1.05–1.28 ,1.03–1.20 and 1.02–1.12, respectively, and those of the two-sided rock steep slope are 1.05–1.26 , 1.02–1.18 and 1.01–1.11, and those of the one-sided rock steep slope are 1.01–1.15, 1.01–1.16 and 1.01–1.08.Therefore, whatever the slope type, the peak acceleration of the slope increases as elevation increases, and the amplification effect of horizontal acceleration is stronger than that of vertical acceleration, and the amplification effects of a four-sided slope, a two-sided slope and a one-sided slope are ranked in the following order: four-sided slope > two-sided slope > one-sided slope, which explains the phenomenon that two-sided slopes and isolated slopes suffered more serious damage than one-side slopes in the 5.12 Wenchuan earthquake. The primary reasons may be listed as follows: (1) reflected wave splits when the seismic wave propagates to the slope surface, for example: a P wave splits into a P wave and a SV wave after reflection, and a SV wave splits into a SV wave and a P wave after reflection, thus a complex wave field is generated by superposition of reflected waves from different waves, and this causes amplification of the acceleration; (2) the wave field is most evidently split in the four-sided rock steep slope surface, and the weakest in a one-sided slope surface, with the two-sided slope surface laying in between.
4. Effect of Slope Angle on Elevation Amplification of Acceleration
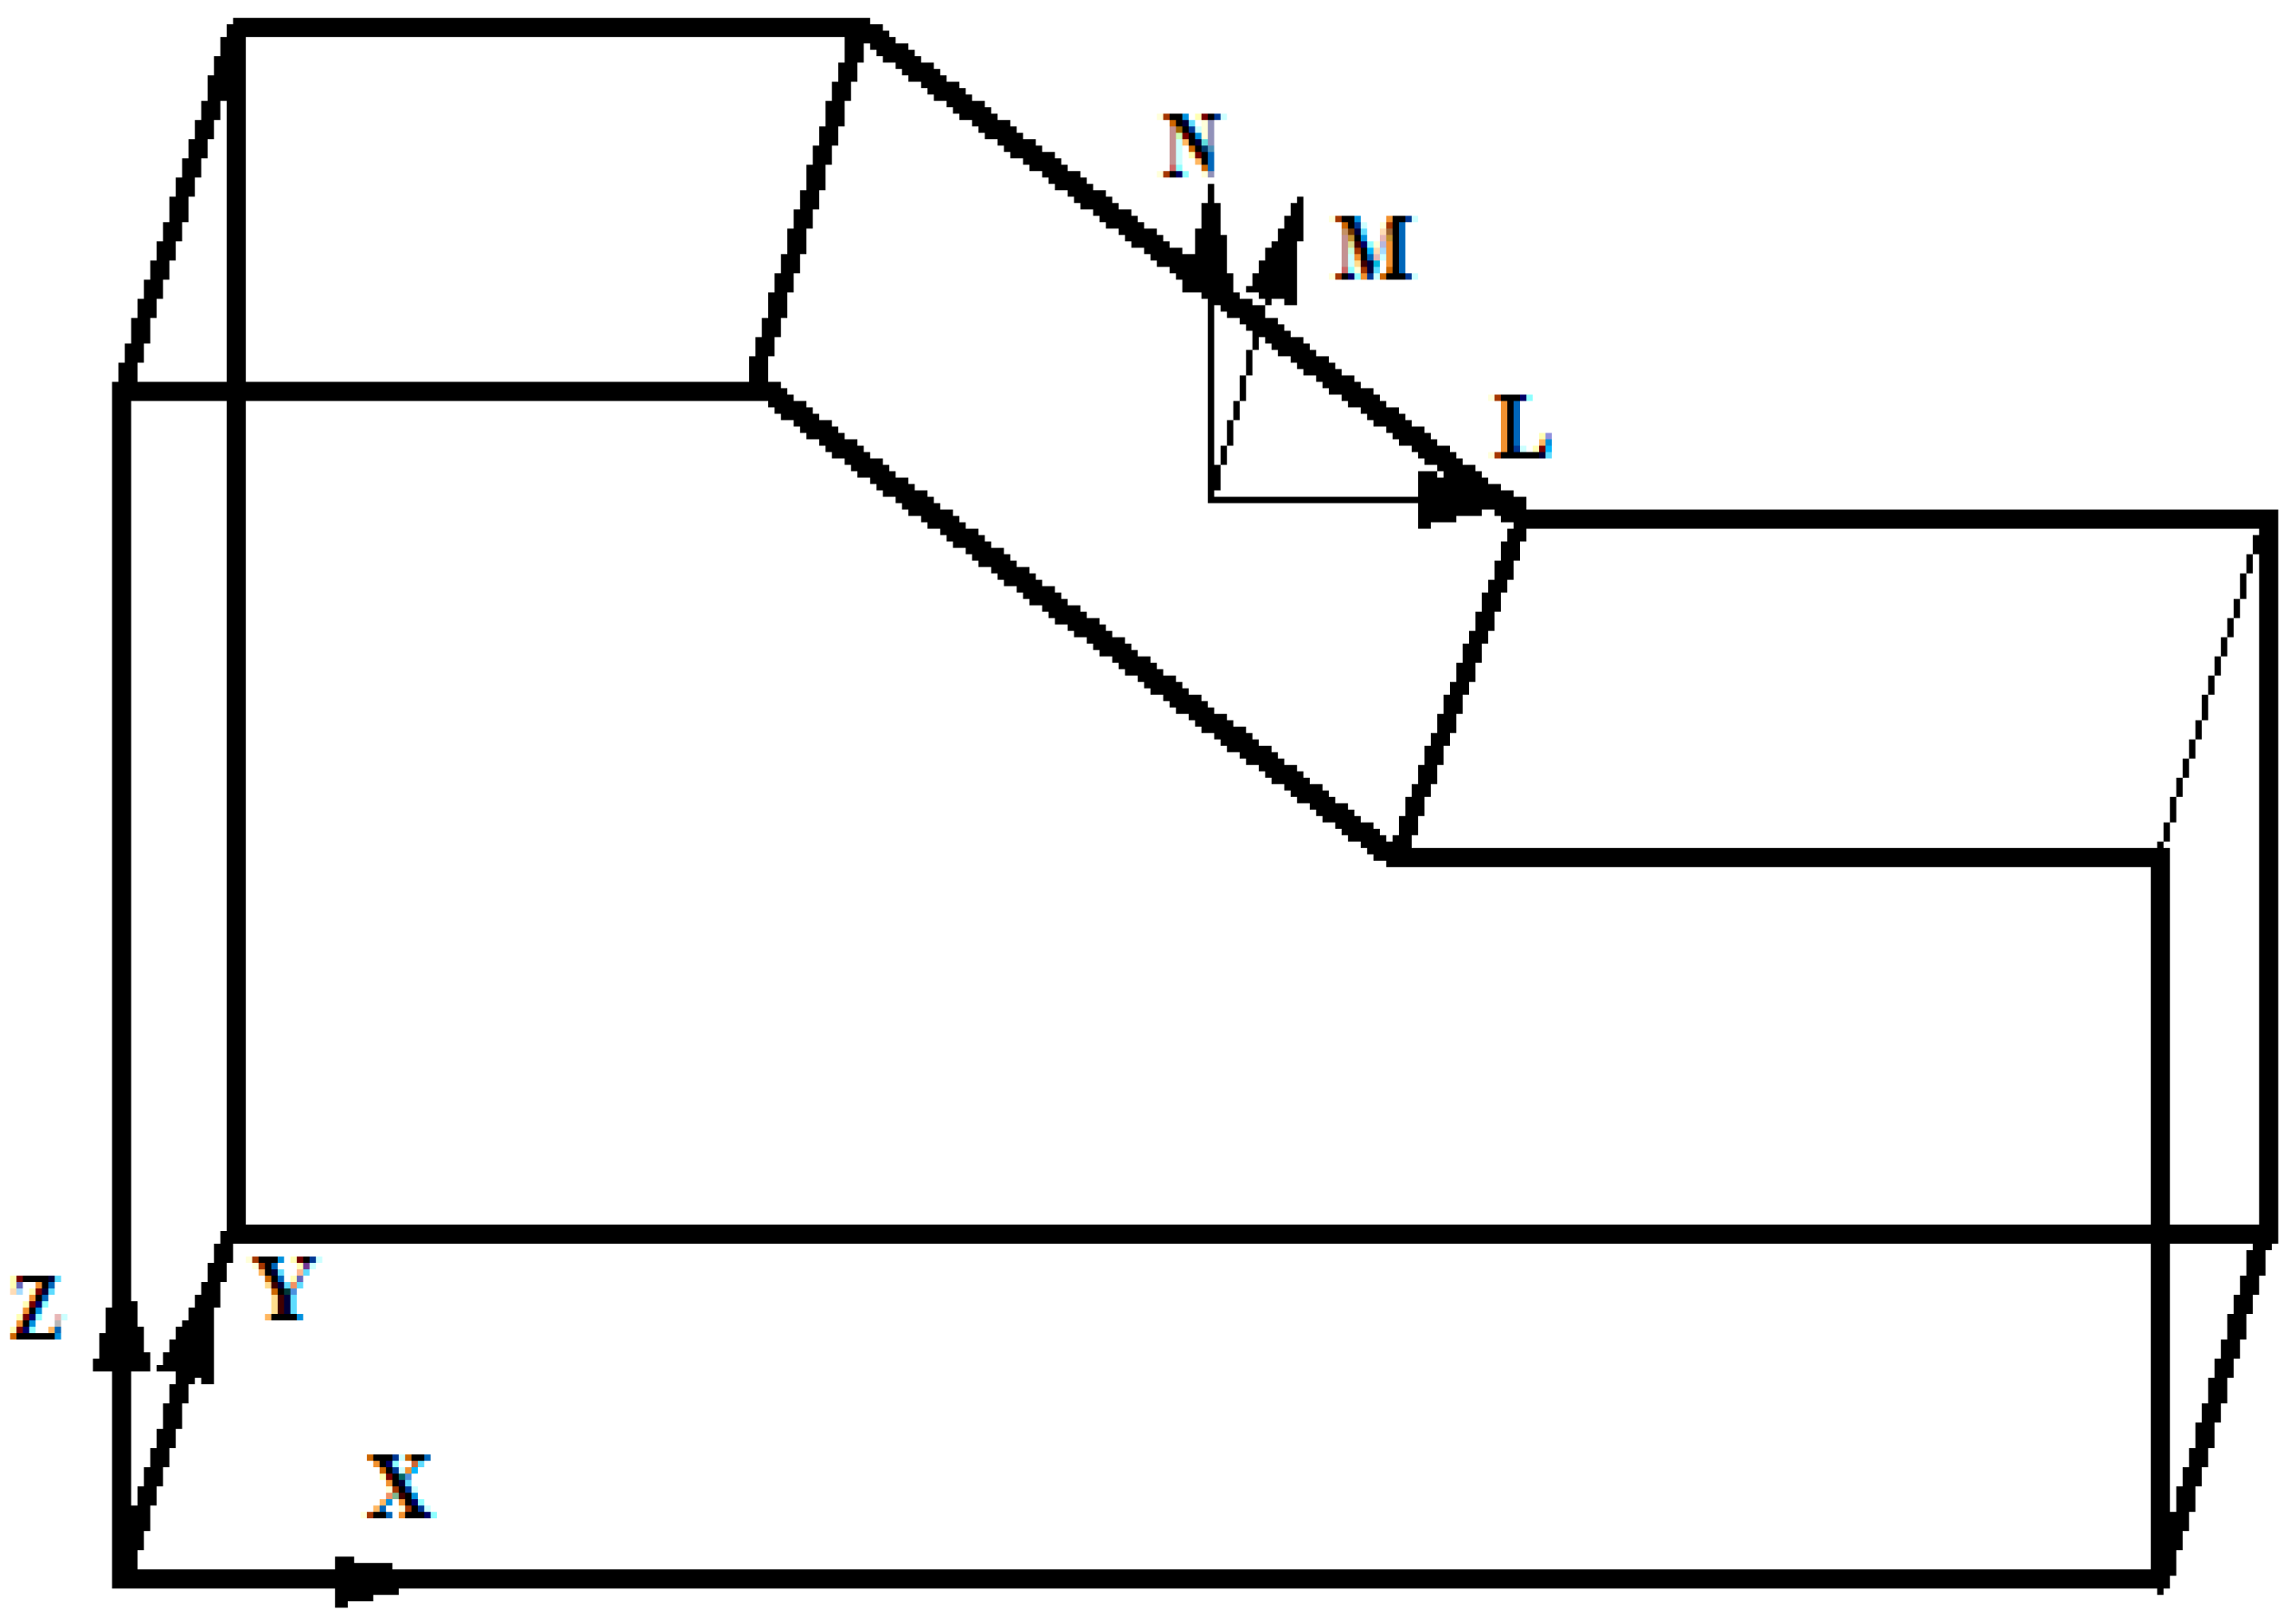
In order to illustrate the effect of slope angle on elevation amplification of acceleration, this paper uses the shaking table test results from the four-sided slope to perform some analysis (Note: if we use X-Y-Z global coordinates for our analysis, which will lead the some problems because this model has four sides, therefore, this paper selects local coordinates that use the surface face direction L, slope strike direction M and vertical direction N to analyze the effect of slope angle on elevation amplification of acceleration, as shown in
Figure 15. The results are shown in
Figure 16.
Figure 15.
Coordinate system transformation.
Figure 15.
Coordinate system transformation.
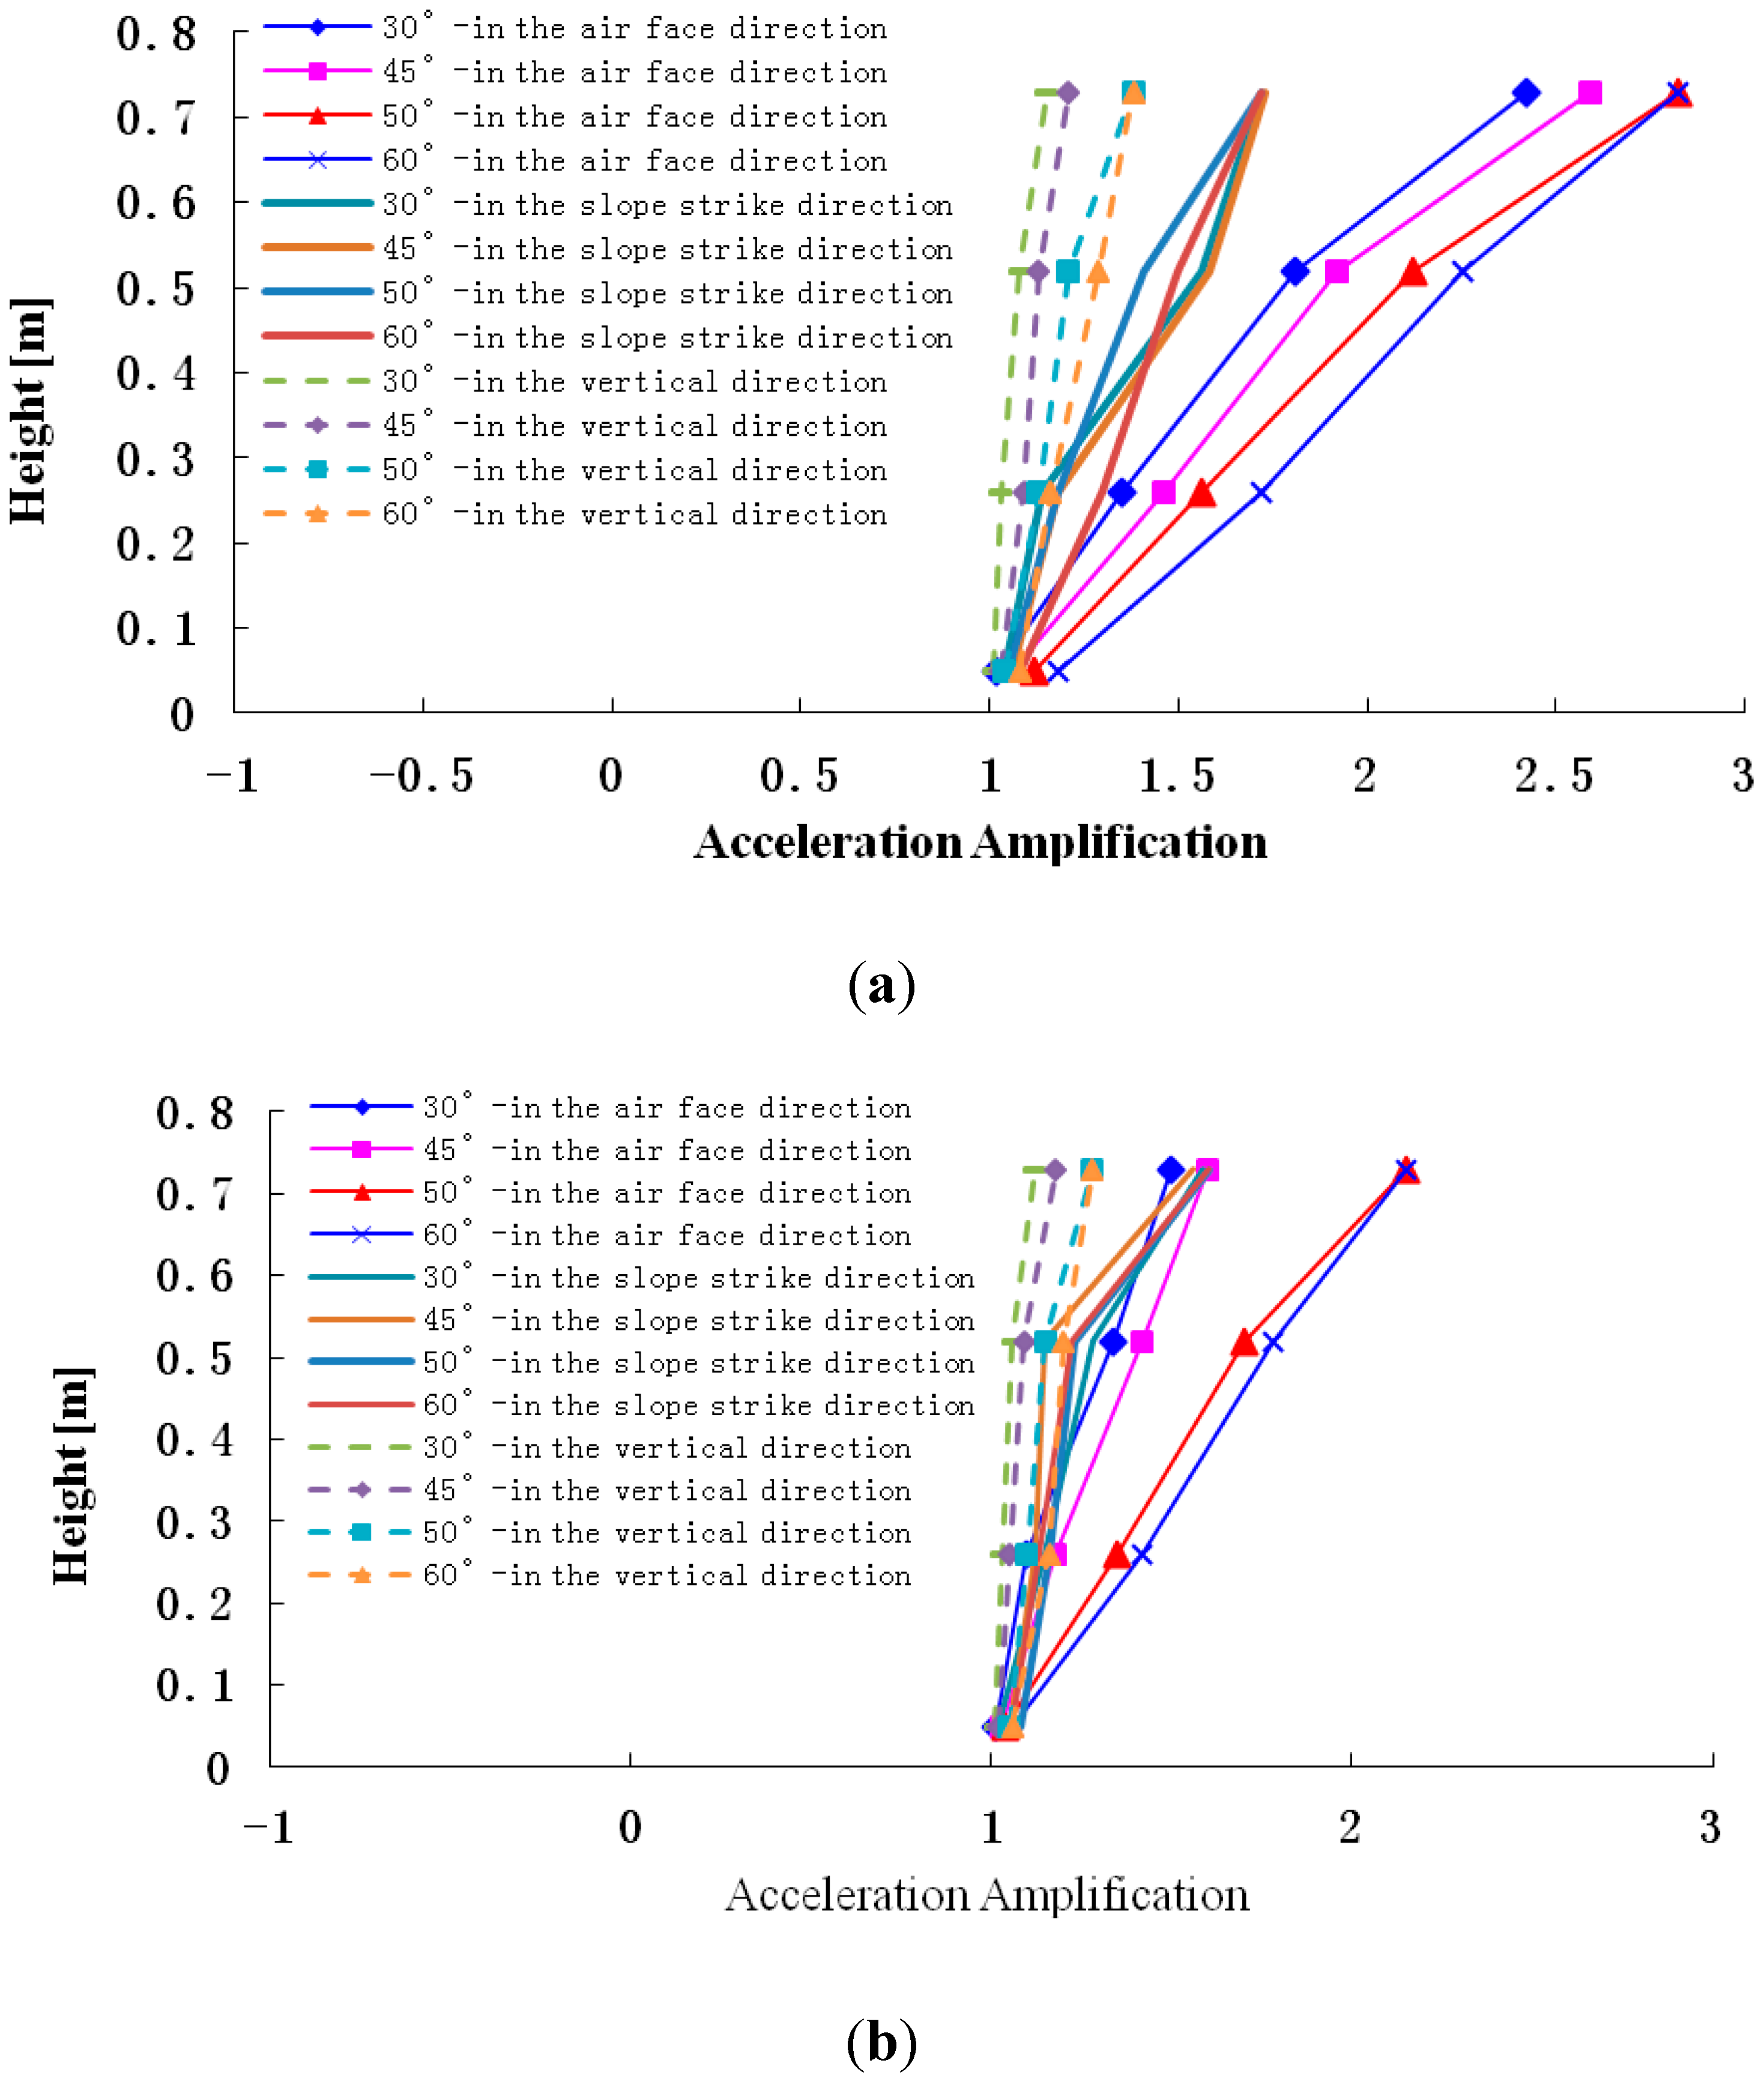
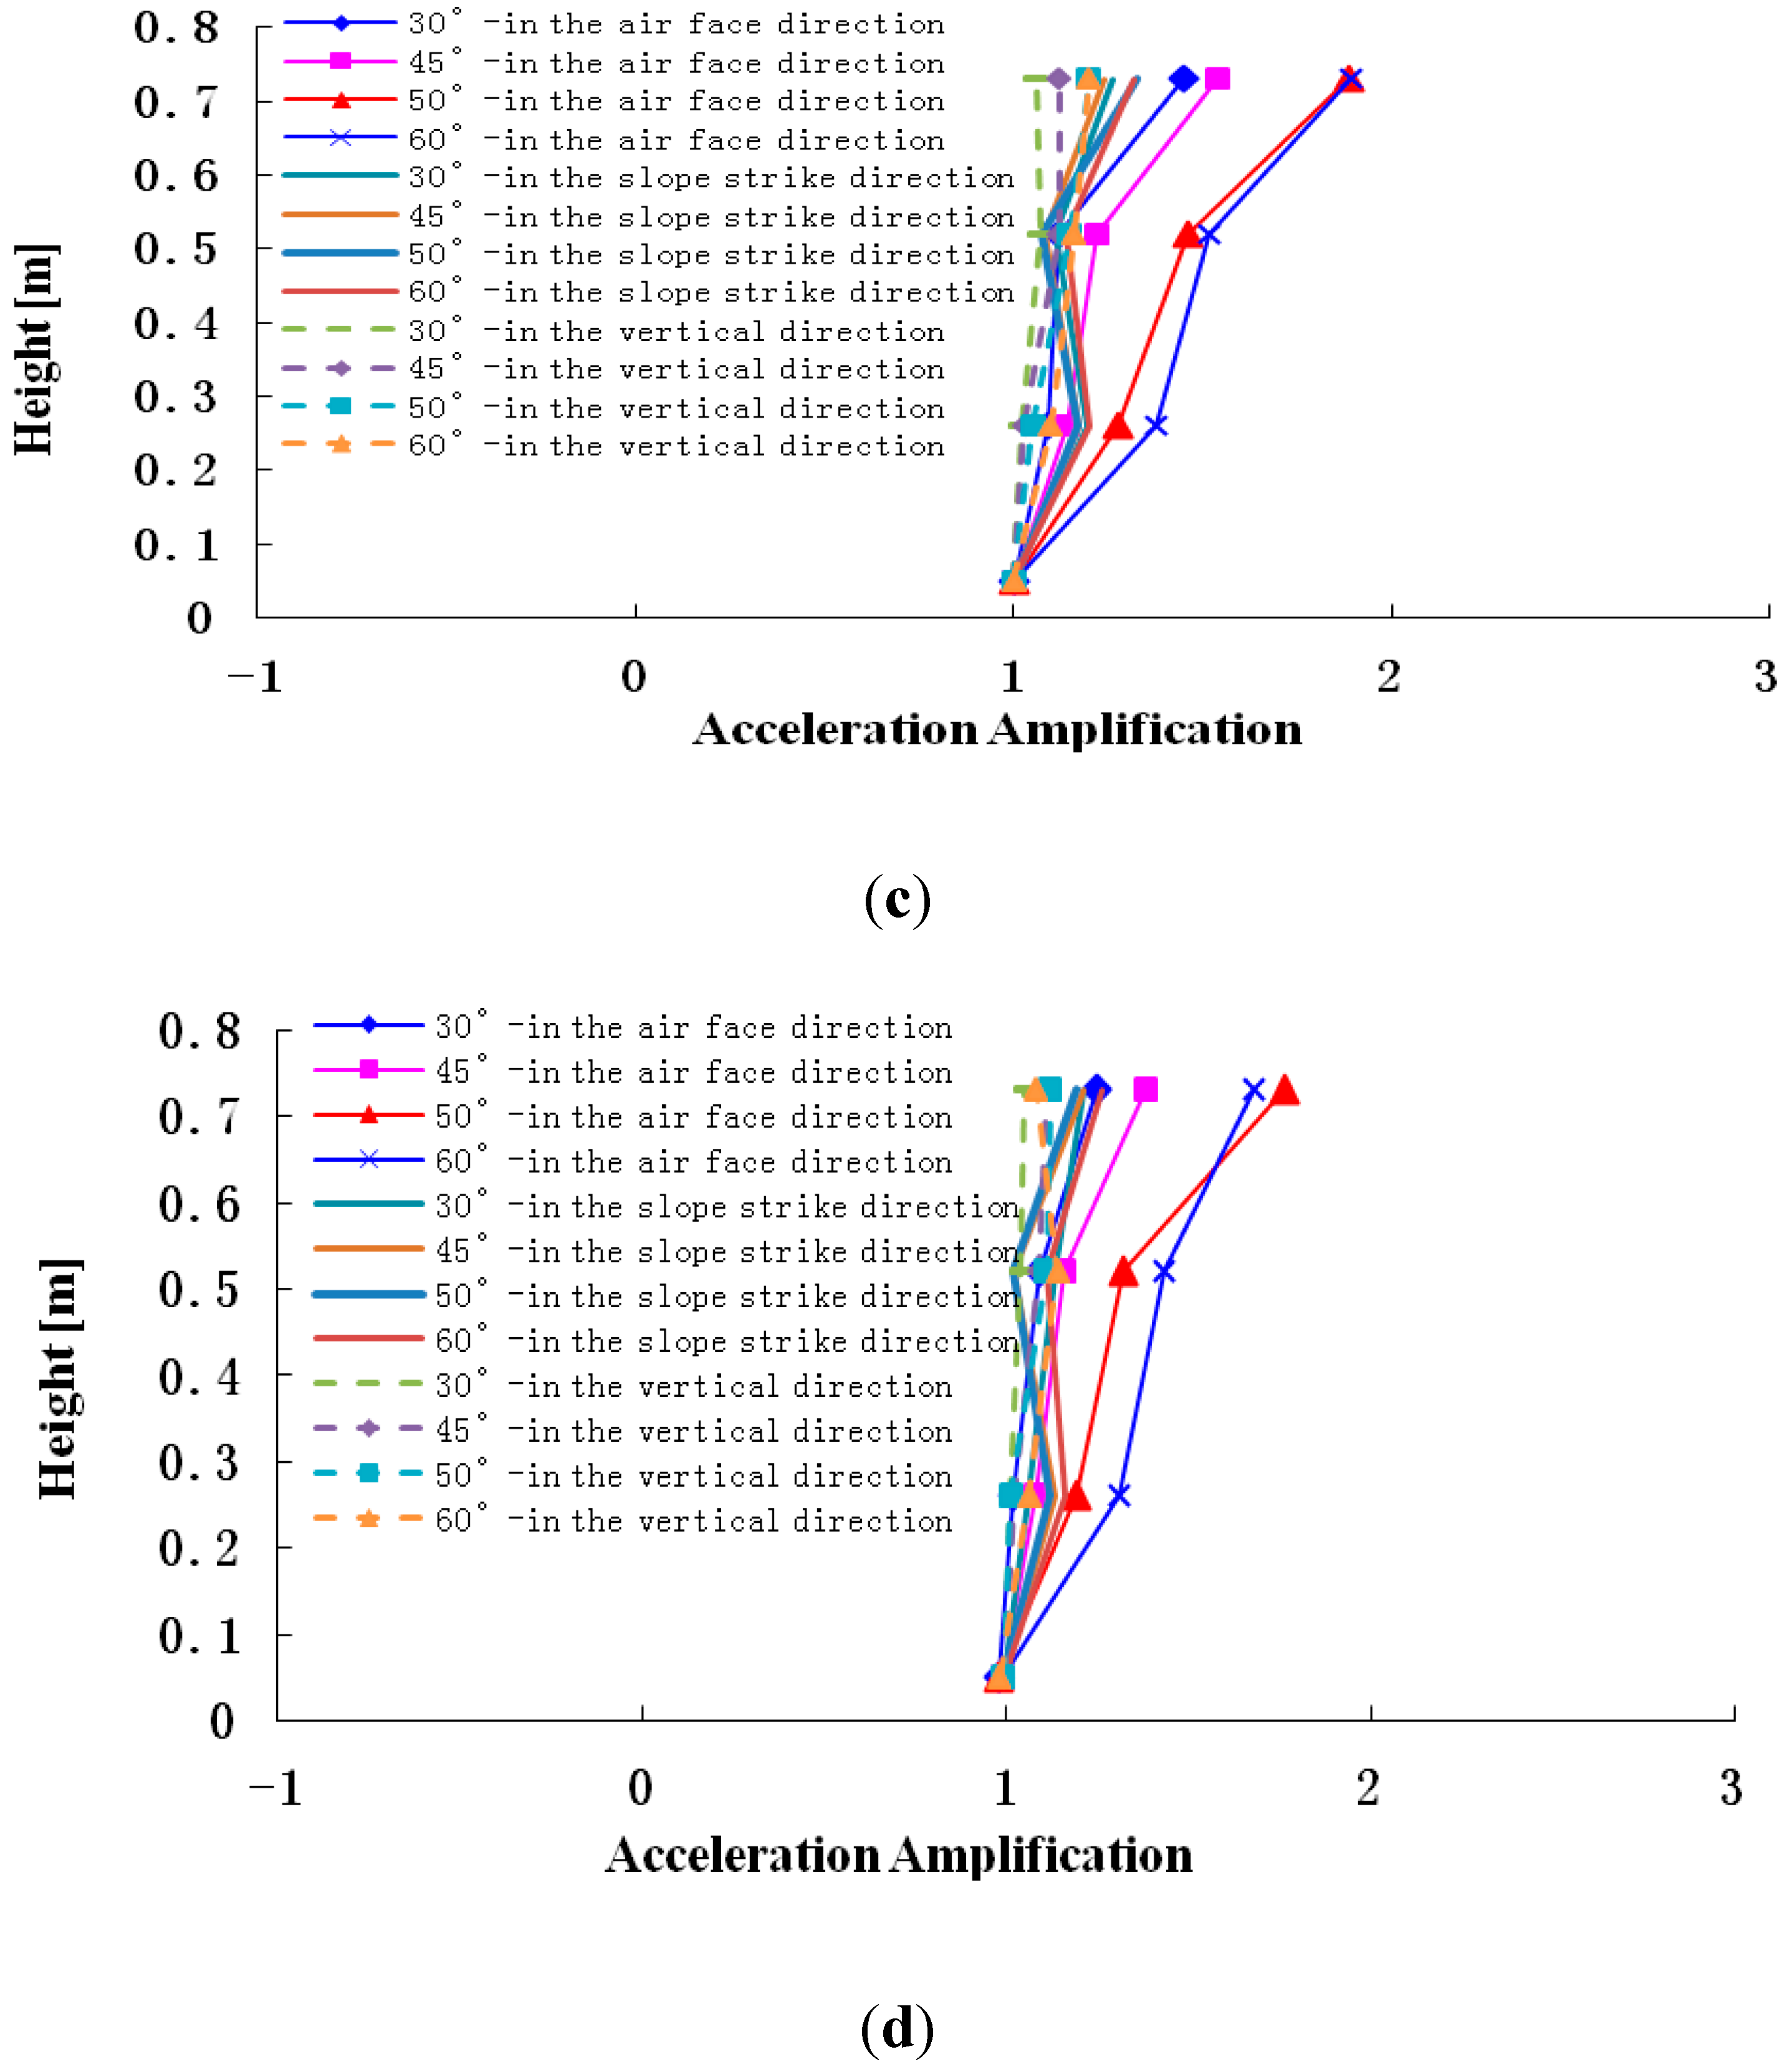
Figure 16.
Peak acceleration amplification coefficient in the different directions subjected to different intensity earthquakes. (a) Acceleration amplifications in different slope angles and different directions when the input PGA = 0.1 g. (b) Acceleration amplifications in different slope angles and different directions when the input PGA = 0.2 g. (c) Acceleration amplifications in different slope angles and different directions when the input PGA = 0.4 g; (d) Acceleration amplifications in different slope angles and different directions when the input PGA = 0.7 g.
Figure 16 shows that when 0.1 g, 0.2 g, 0.4 g and 0.7 g Wenchuan-Wolong seismic waves are input into slope models, the accelerations in the surface face direction L, slope strike direction M and vertical direction N are magnified to different degrees as elevation increases. In the surface face direction L, the acceleration amplification rules can be summarized as follows: 60° slope > 50° slope > 45° slope > 30° slope.
In the slope strike direction M, the acceleration amplification in different slopes is consistent. In the vertical direction N, the acceleration amplification rules can be ranked as follows: 60° slope > 50° slope > 45° slope > 30° slope.
Therefore, the acceleration amplification in the surface face direction L and vertical direction N gradually increase as the elevation increases, but that in slope strike direction M is basically unchanged. In order to illustrate the above phenomenon, this paper simplifies the slope problem as a plane strain problem, and illustrates that from the angle of the propagation features of seismic wave, as follows:
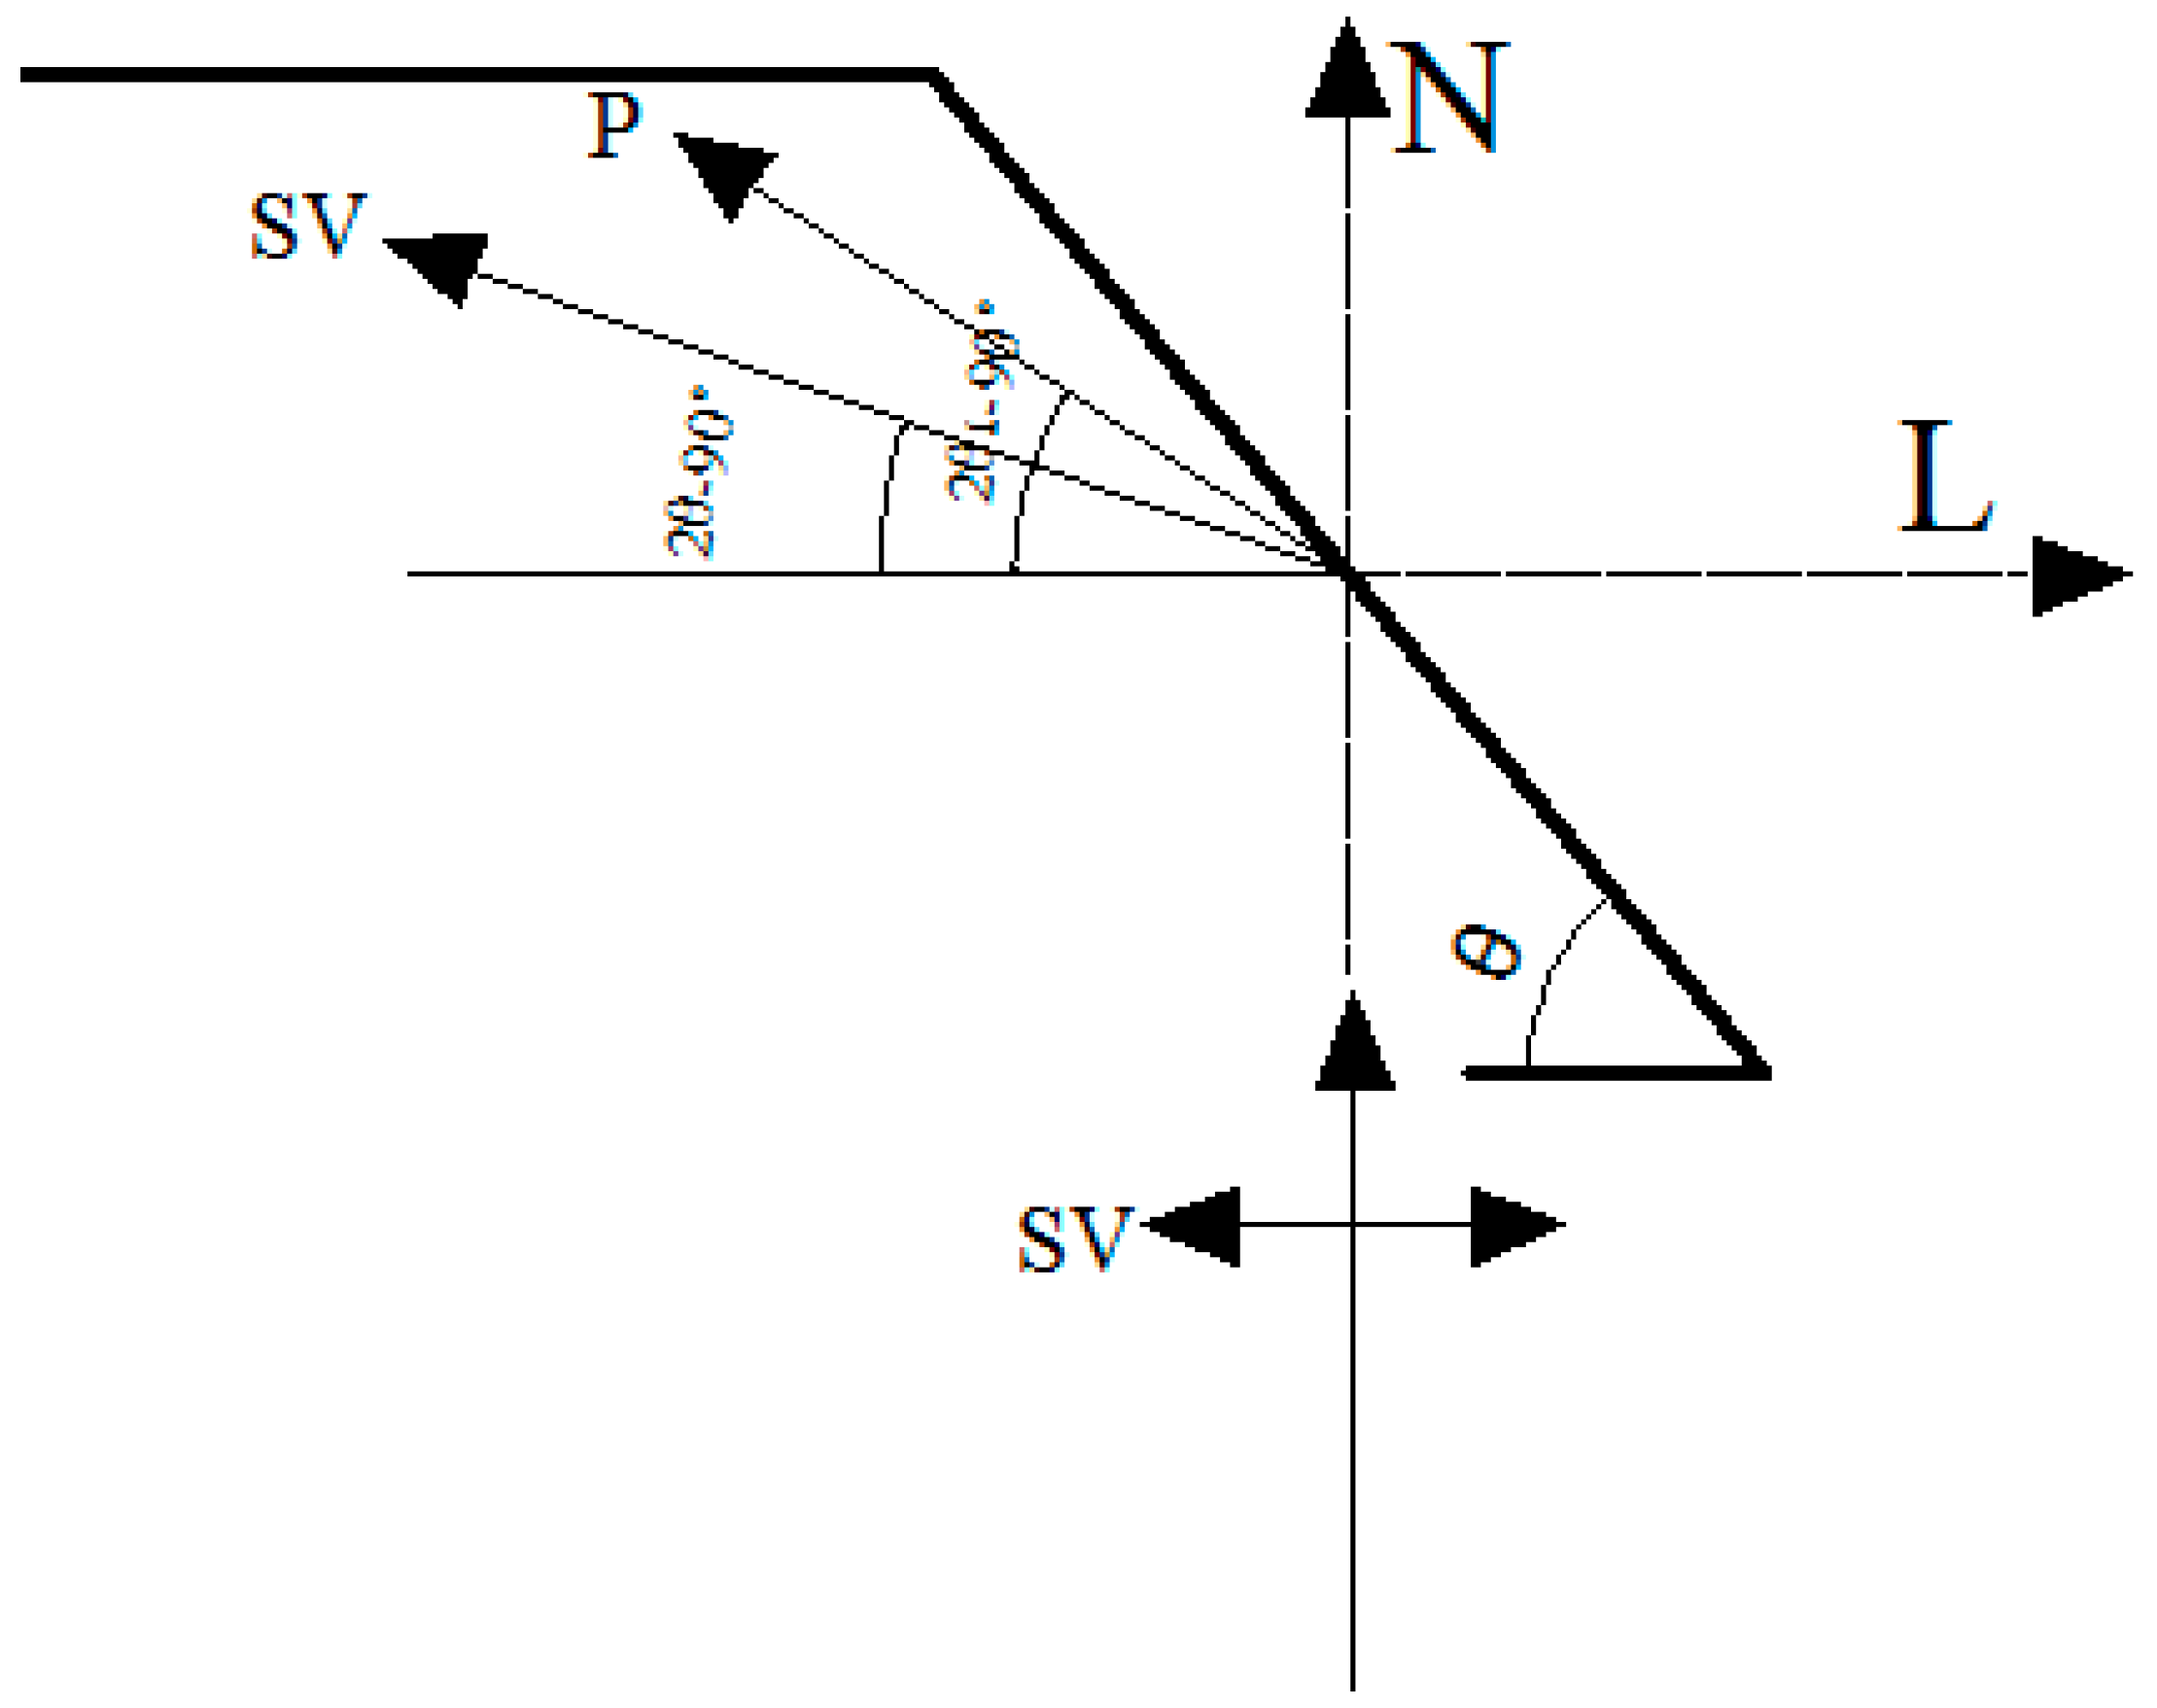
According to wave theory, when the SV wave input from the bottom of the model propagates to the slope surface, the reflection waves will produce a wave field separation phenomena, whereby P (SV) waves are transformed into SV (P) waves when the P (SV) wave is reflected on the slope surface, as shown in
Figure 17. Therefore, the potential functions of the input SV wave, the reflected SV wave and the reflected P wave are shown as follows:
The input SV wave: The reflected SV wave:
The reflected P wave:
where
is the incident angle
Figure 17.
The division of the SV wave field.
Figure 17.
The division of the SV wave field.
Based on the above formulas, we put the related parameters into the formulas, and then the results can be obtained, as shown in the following: F
P/E
S is a negative number, but
FS/ES is a positive number. That fully shows that the phase of the input SV wave is consistent with that of the reflected SV wave, but is opposite to that of the reflected P wave. It leads to the fact that the vibration component of the input SV wave and the reflected SV wave in the direction L are consistent with that in the direction N, but that of the input SV wave and reflected P wave in the direction L is opposite to that in the direction N. At the same time, the components of the input SV wave in the direction Land N is E
s and 0, respectively. That of reflected SV wave in the direction Land N is (E
S + F
S)sin(2θ − 90°) and (E
S + F
S)cos(2θ − 90°), respectively. That of reflected P wave in the direction Land N is F
pcos(2θ
1 − 90°) and F
psin(2θ
1 − 90°), respectively. Therefore, the total vibration components in the direction L and N are E
s + (E
S + F
S)sin(2θ − 90°) + F
pcos(2θ
1 − 90°) and (E
S + F
S)cos(2θ − 90°) + F
psin(2θ
1 − 90°). In addition, with the increase of incident angle, the reflection angle of the SV wave gradually increases and the vibration direction moves to the direction L. However, the reflection angle θ
1 of the P wave gradually increases and the vibration component in the direction L gradually decreases. So both (E
S + F
S)sin(2θ − 90°) + F
pcos(2θ
1 − 90°) and (E
S + F
S)cos(2θ − 90°) + F
psin(2θ
1 − 90°) gradually increase. Therefore, with the increase of slope angle, the amplification of acceleration in the directions L and N gradually increases. A similar conclusion about the amplification in the direction M can be obtained by using the above thinking. In order to reveal the effect of slope angle on the acceleration amplification clearly, only the measuring point at the position H/4 is selected for analysis, and the results are shown in
Figure 18,
Figure 19 and
Figure 20.
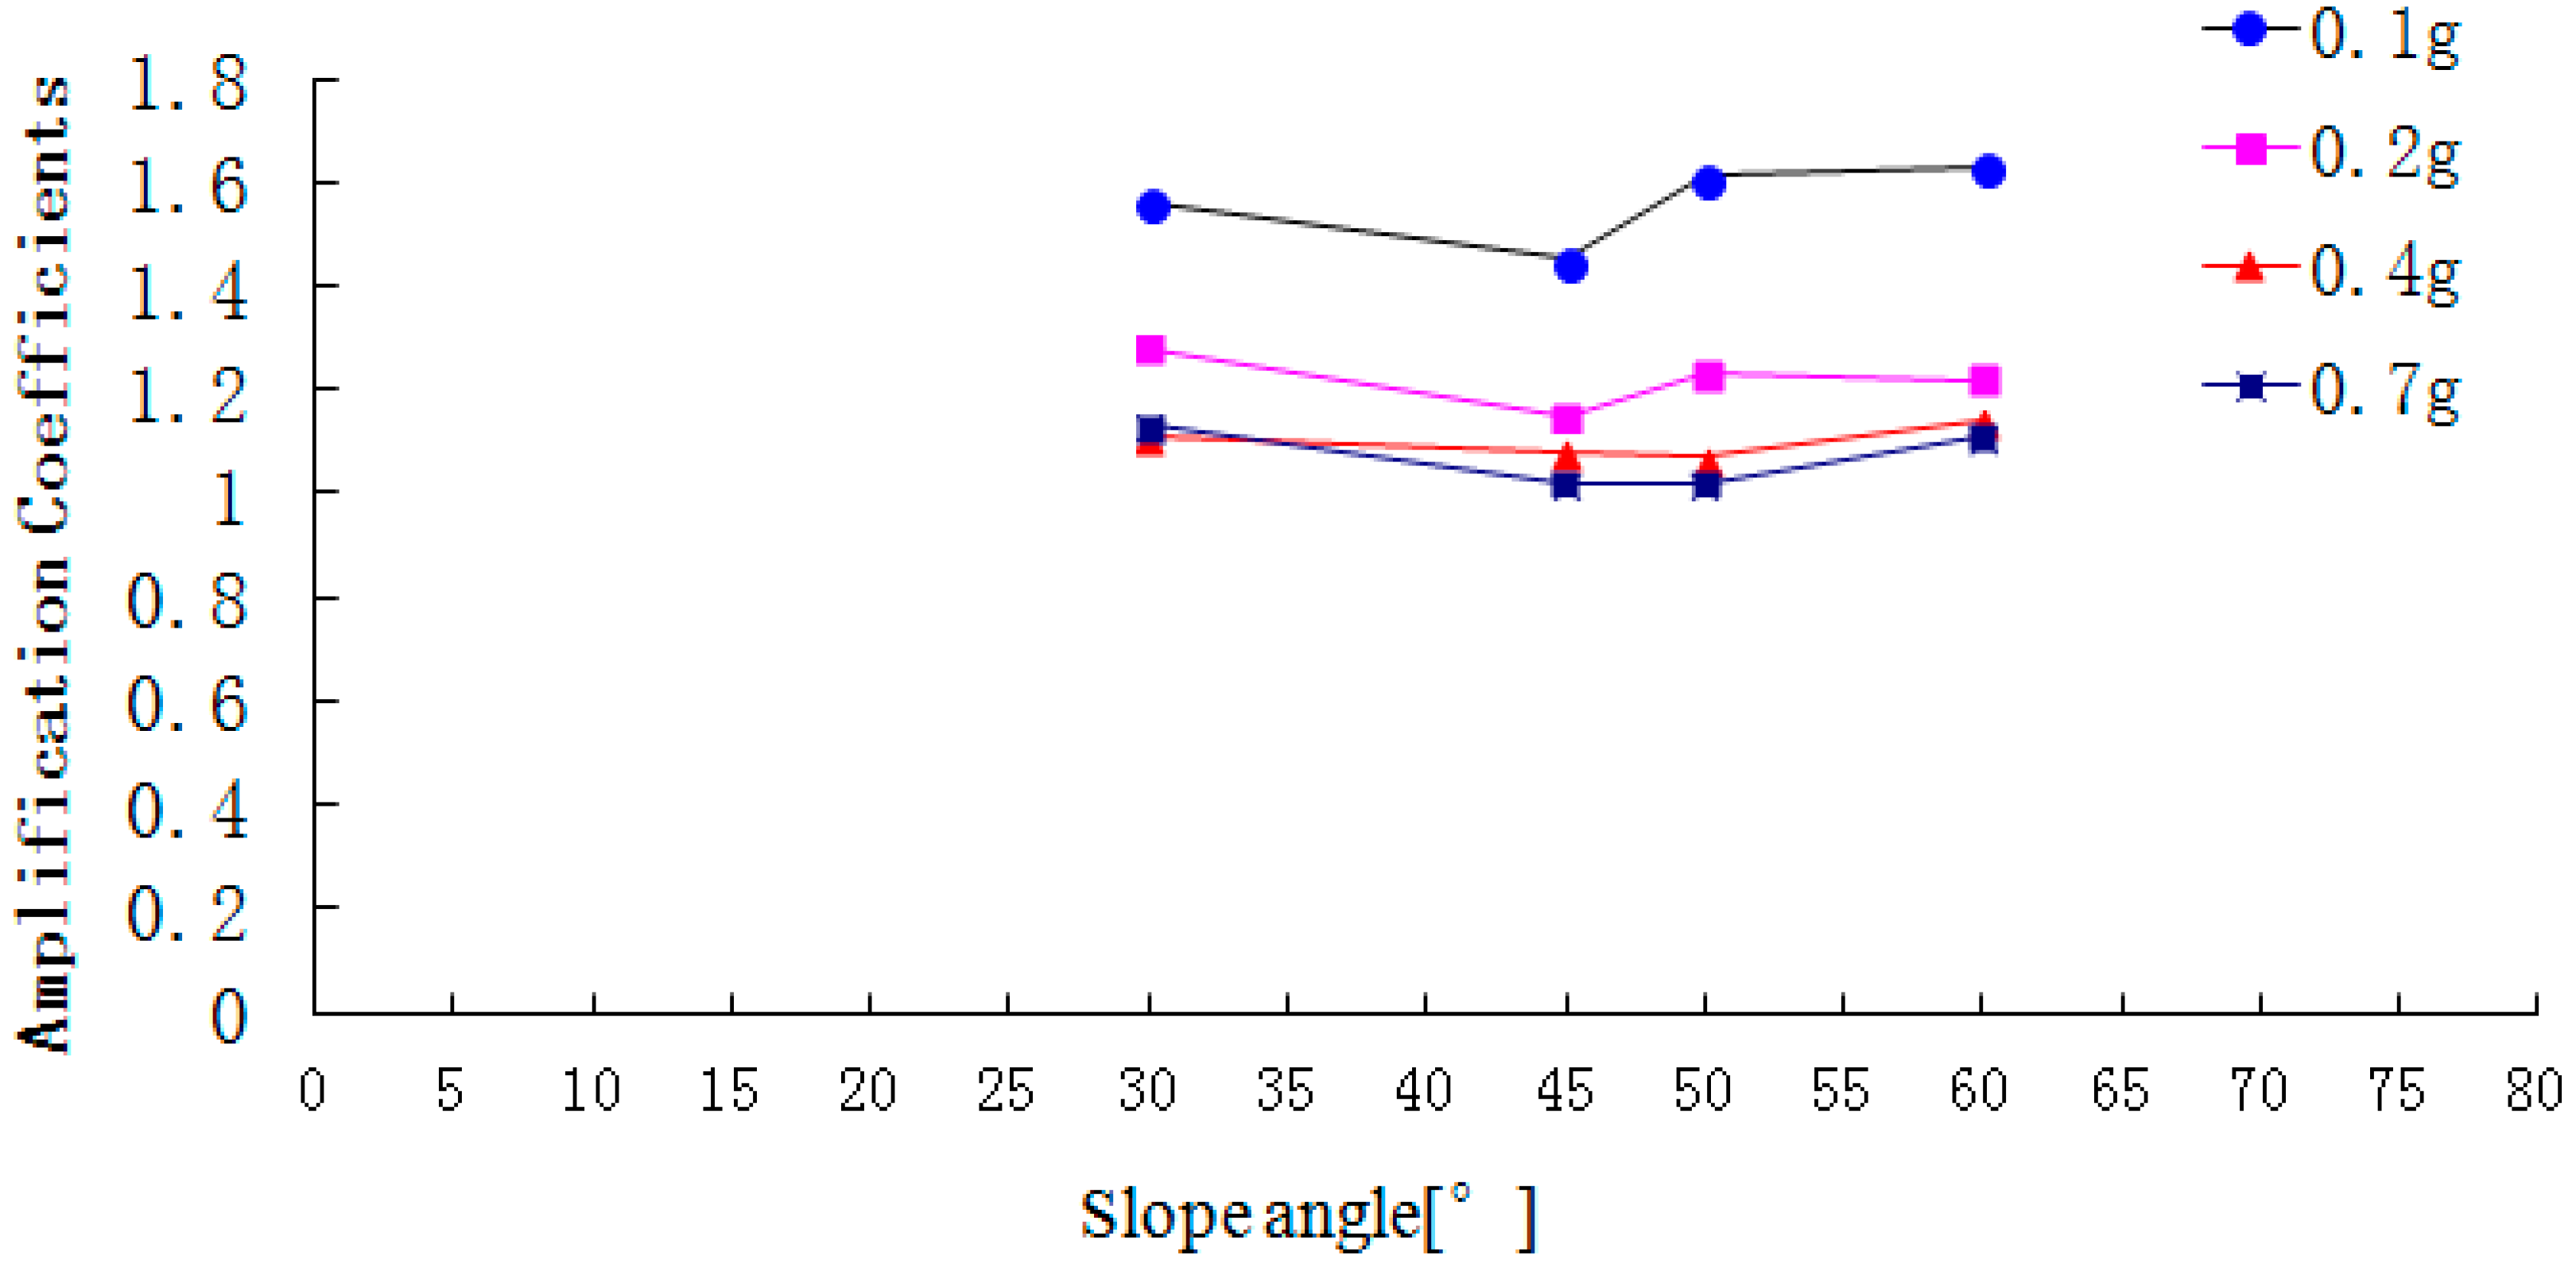
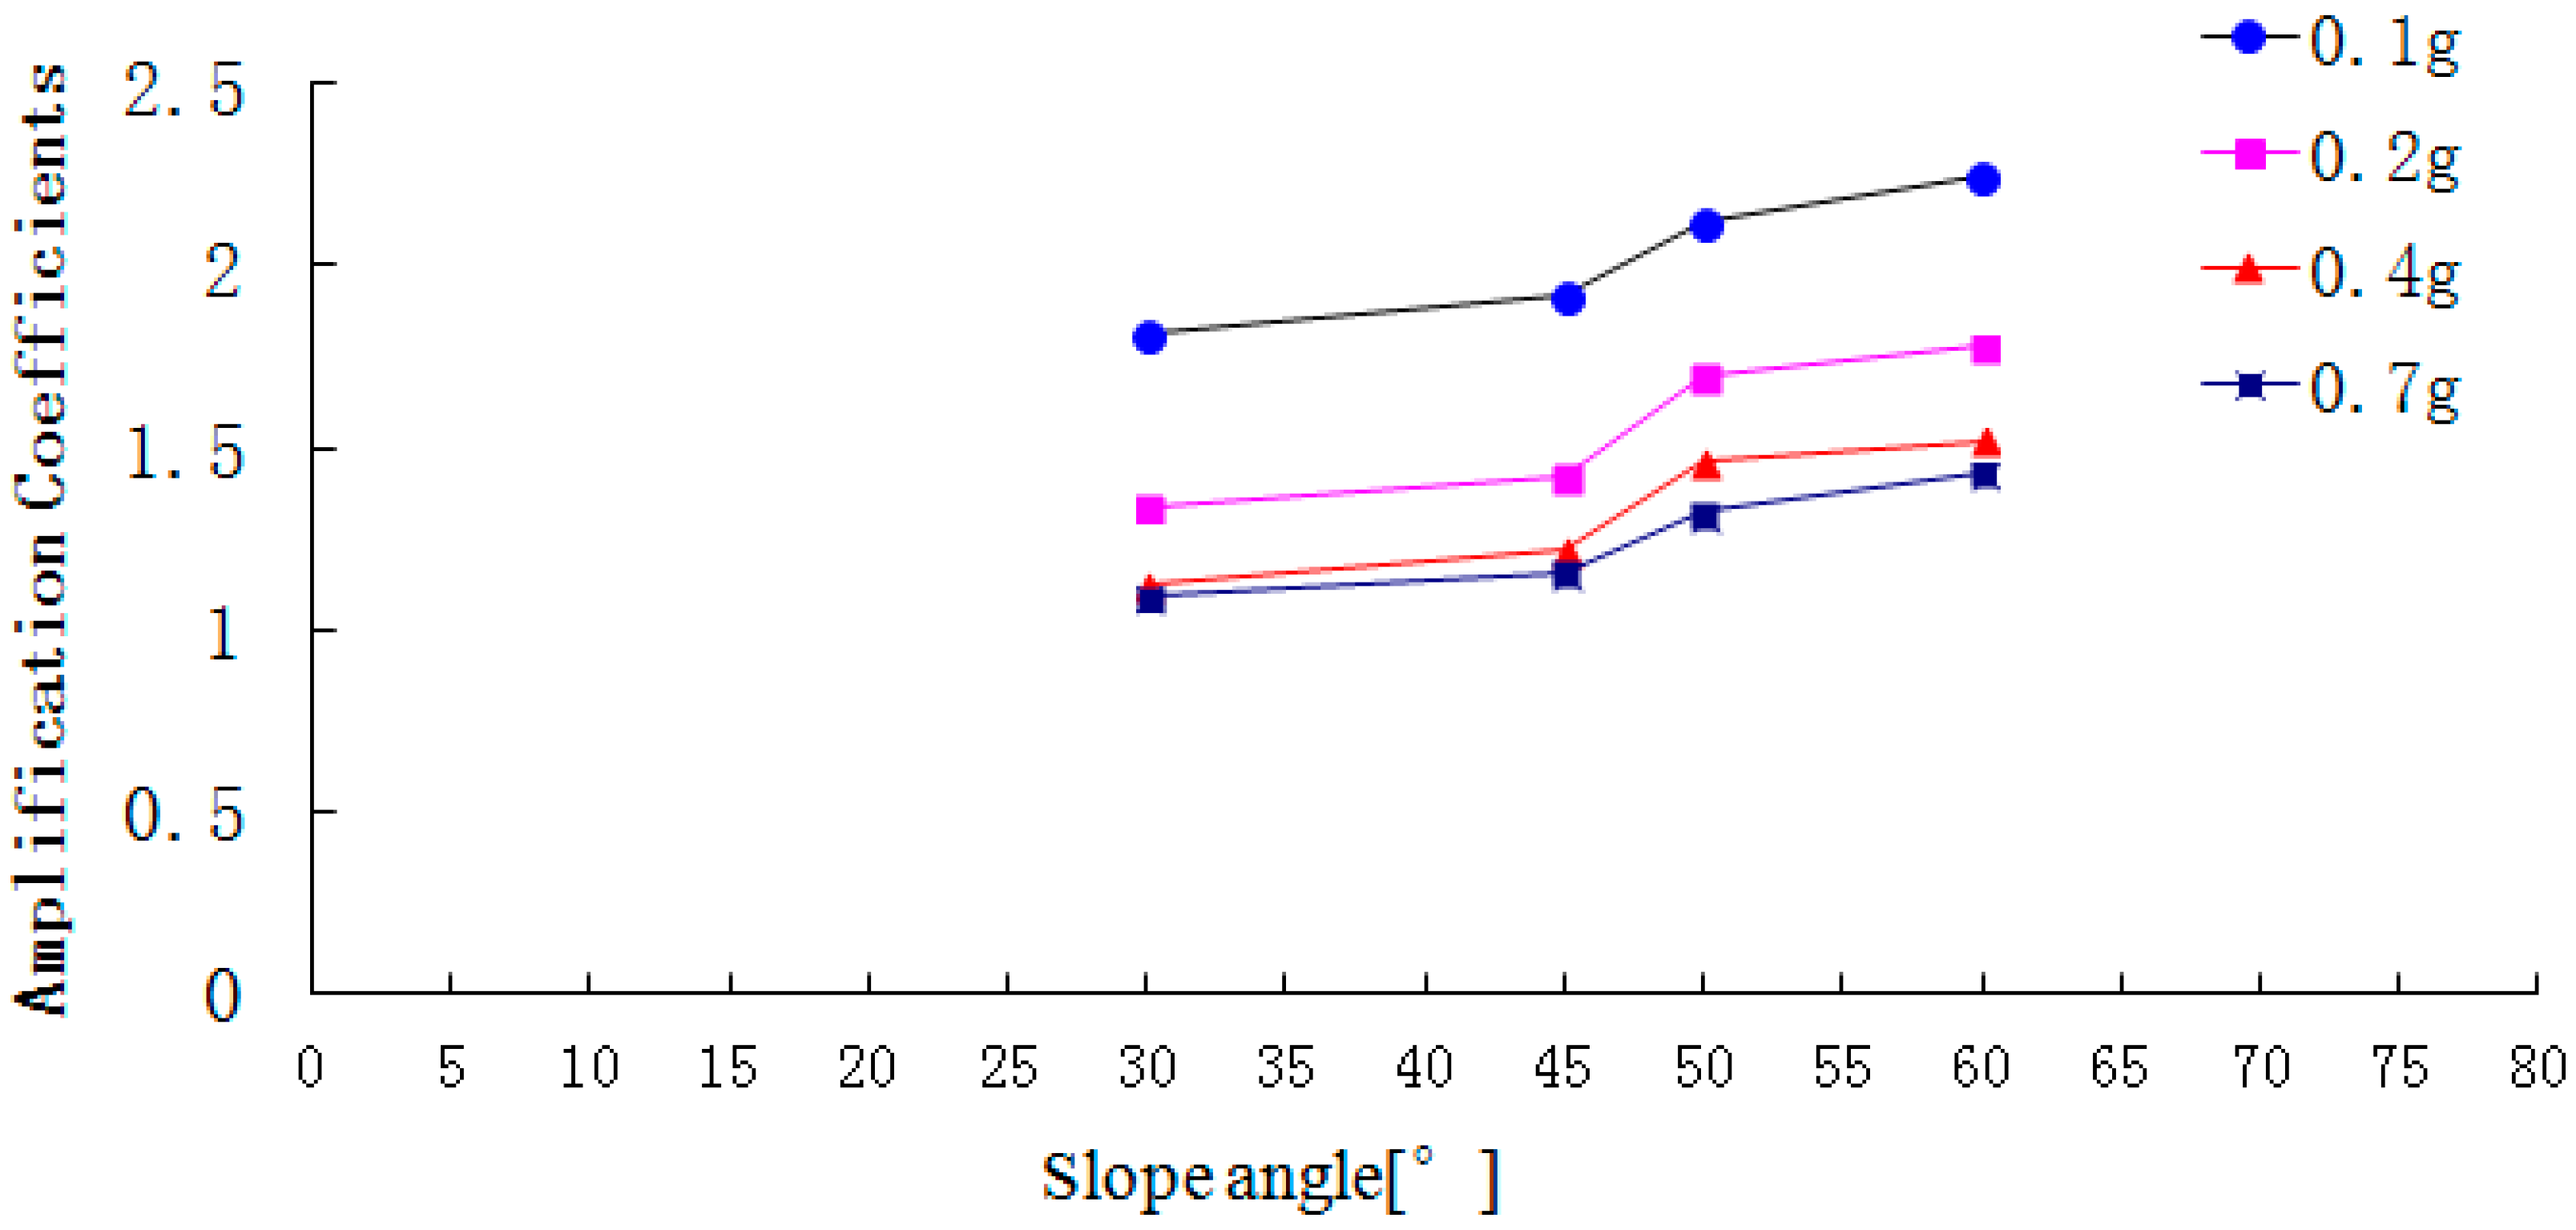
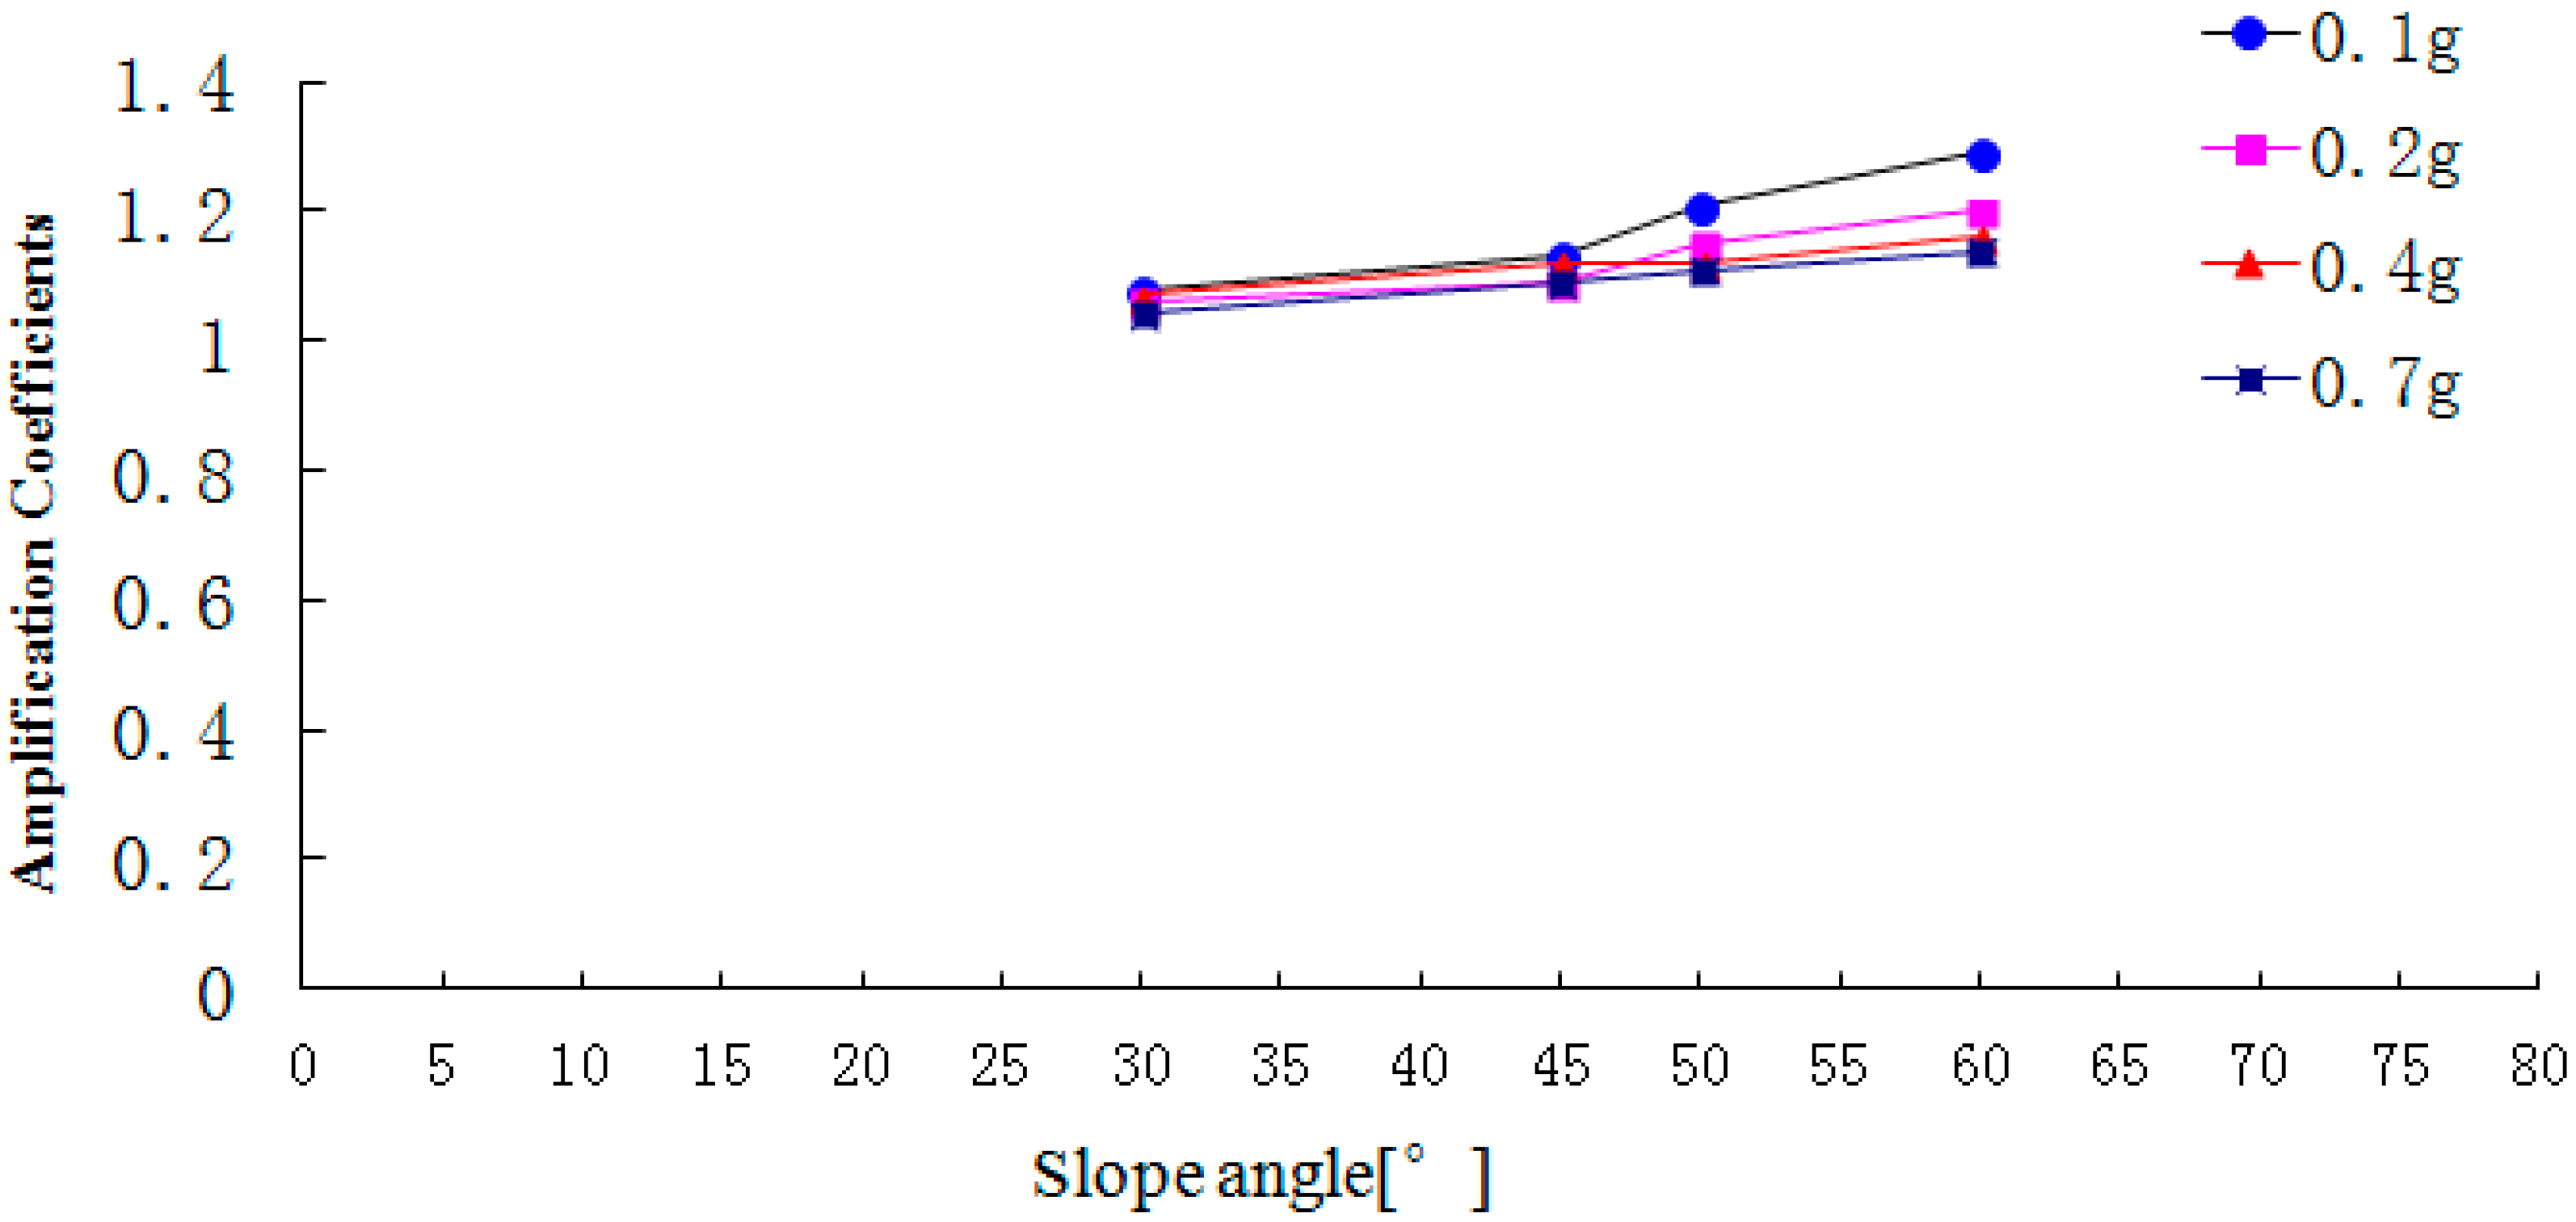
Figure 18.
The peak acceleration amplification coefficient on the free face.
Figure 18.
The peak acceleration amplification coefficient on the free face.
Figure 19.
The peak acceleration amplification coefficient in the slope direction.
Figure 19.
The peak acceleration amplification coefficient in the slope direction.
Figure 20.
The peak acceleration amplification coefficient in the vertical direction.
Figure 20.
The peak acceleration amplification coefficient in the vertical direction.
Figure 18,
Figure 19 and
Figure 20 show that with the increase of slope angle, the acceleration amplification coefficients in the direction L, M and N gradually increase and there is a step in the curve. When the slope angle ranges from 30° to 45° or from 50° to 60°, the acceleration amplification coefficients increase slightly, but from 45° to 50°, the amplification coefficients suddenly increase. In addition, the change law of the step height in the acceleration amplification coefficients curve is ranked as follows: that in the air face direction L> that in the slope strike direction M > that in the vertical direction N. At the same time, when the PGA of the input Wenchuan-Wolong wave is 0.1 g, 0.2 g, 0.4 g and 0.7 g, the acceleration amplification coefficients of the 50° slope in the air face direction are 42.3%, 19.7%, 19.7% and 13.8% larger than that of the 45° slope. Therefore, as the slope angle increases, the acceleration amplification coefficients do not only increase, but have two inflection points. Therefore, the dynamic responses of a rock slope whose slope angle is 45° is stronger than that of rock slope with an angle below 45°, which can explain well the seismic hazard whereby most landslides occur on the slopes whose angle is larger than 45°.
5. Conclusions
Considering two kinds of serious disaster phenomena in the Wenchuan earthquake, which are that the multi-aspect slopes facing empty isolated mountains and thin ridges reacted to the earthquake intensely and were seriously damaged and the slope angles of most landslides was larger than 45°, the primary reasons are analyzed on the basis of field investigations and shaking table tests of one-sided, two-sided and four-sided slopes. The following specific conclusions are proposed:
The multi-aspect slopes facing empty isolated mountains and thin ridges react to earthquakes intensely and get seriously damaged and the slope angles of most landslides is larger than 45°. Therefore, we should pay high attention to security protection work on high steep slopes when their slope angle is larger than 45° and multi-aspect slopes facing empty isolated mountains.
Regardless of whether one-sided, two-sided or four-sided steep slope are considered, the acceleration of different sites is magnified to different degrees as the elevation increases. The horizontal peak acceleration amplification effect is stronger than that of vertical peak acceleration. As for different slope shapes, the amplification effect of acceleration of four-sided slopes is the strongest, and that of one-sided slopes is the weakest, and that of two-sided slopes lays in between, which accounts for the phenomenon that two-sided slopes and isolated slopes were more seriously damaged than one-side slopes in the the 5.12 Wenchuan earthquake. The amplifications of the peak accelerations gradually increase as the slope angles increase, and there are two inflection points which are the point where the slope angle is 45° and where the slope angle is 50°, respectively, which can explain the seismic phenomena whereby landslide hazards mainly occur on the slopes whose slope angle is bigger than 45°. The amplification along the slope strike direction is basically consistent, and the step is smooth.


