
Integrated Assessment of Artisanal and Small-Scale Gold Mining in Ghana—Part 2: Natural Sciences Review

Abstract
:1. Introduction

1.1. Objective
1.2. Limitations and Assumptions
2. An Assessment of the Ecological Health Issues

2.1. Mercury Contamination
2.1.1. Causes
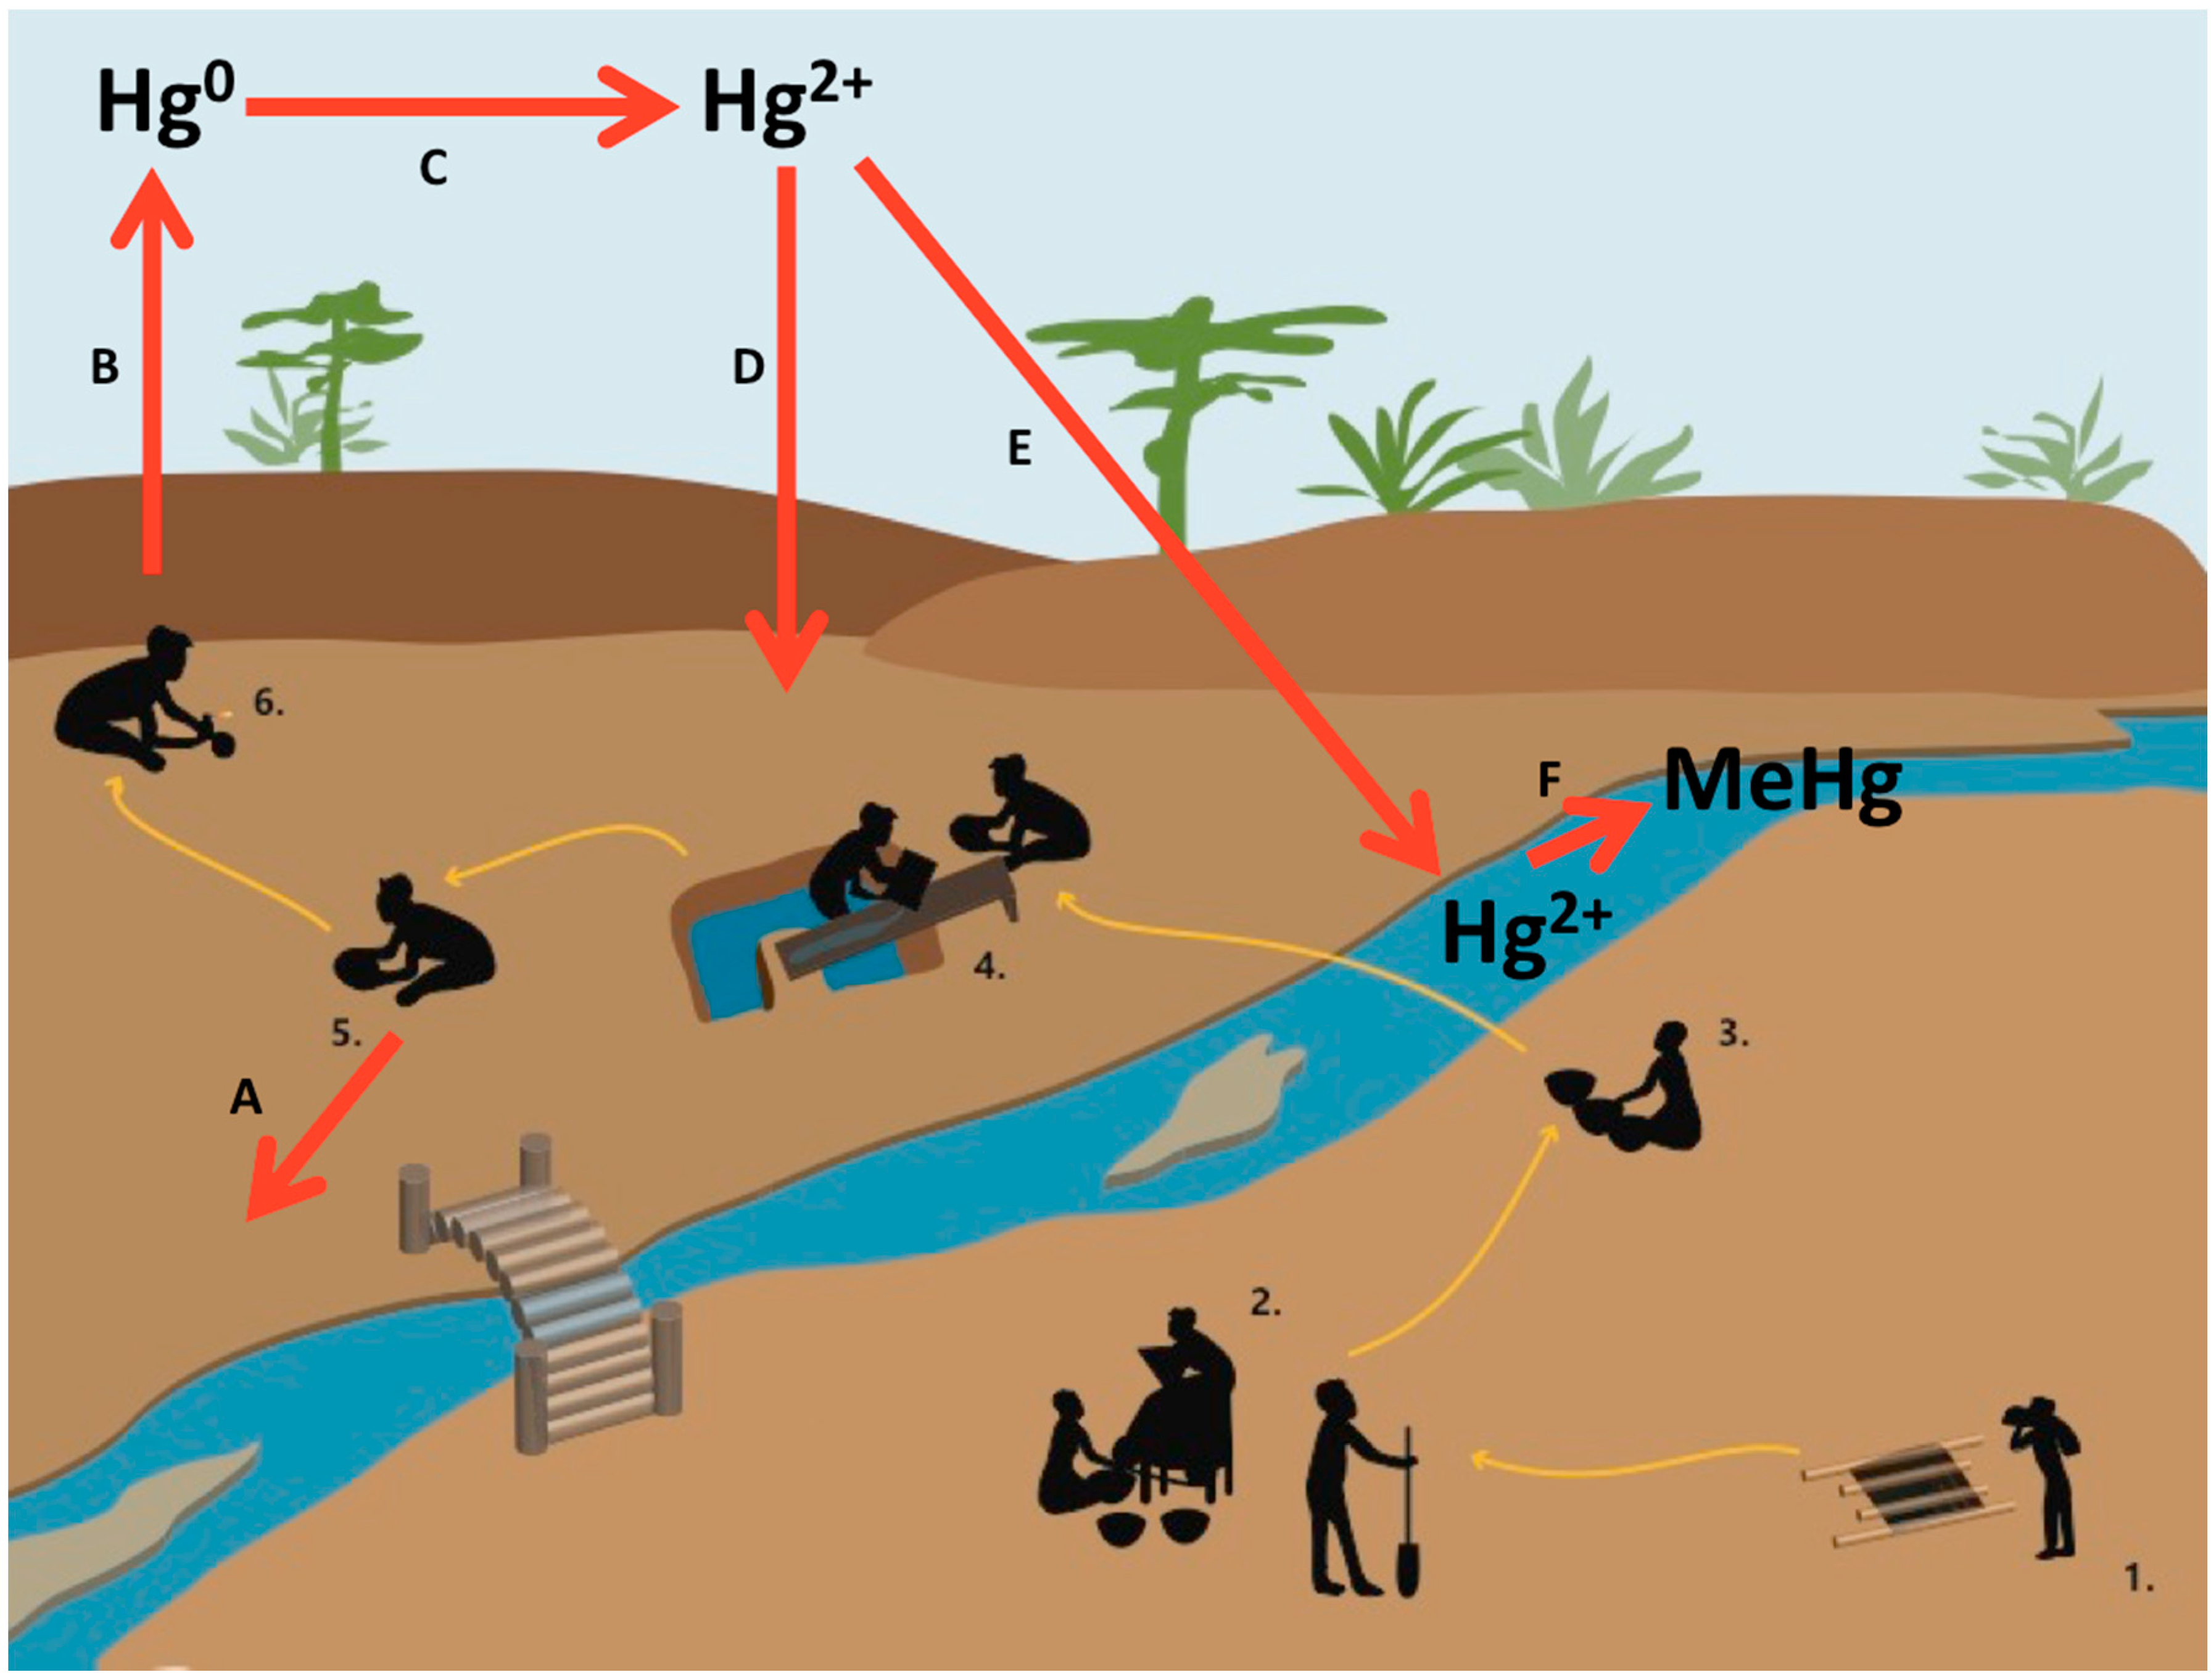

2.1.2. Status and Trends


| Mercury (Hg) | Arsenic (As) | Cadmium (Cd) | Lead (Pb) | |||||
|---|---|---|---|---|---|---|---|---|
| Soil | 0.1 µg/g THg | US EPA [23,24] | 0.4 µg/g | US EPA [23] | 78 µg/g | US EPA [23] | 400 µg/g | US EPA [23] |
| Plants | 0.5 µg/g MeHg | FAO/WHO [38] | 0.1 µg/g | FAO/WHO [38] | 0.1 µg/g | FAO/WHO [38] | 0.1 µg/g | FAO/WHO [38] |
| Sediment | 0.18 µg/g THg | US EPA [29] | 9.8 µg/g | US EPA [29] | 0.99 µg/g | US EPA [29] | 35.8 µg/g | US EPA [29] |
| Water | 6 µg/L Inorg. Hg | WHO [33] | 10 µg/L | WHO, GSB/GWC [33,46] | 3.0 µg/L | WHO, GSB/GWC [33,46] | 10 µg/L | WHO, GSB/GWC [33,47,48] |
| Fish | 0.3 µg/g MeHg | US EPA [37] | ||||||
| 0.5 µg/g MeHg | FAO/WHO [38] | |||||||
| Tailings | 0.1 µg/g THg | US EPA [23,24] | ||||||
| Metal | ||||||||||||
|---|---|---|---|---|---|---|---|---|---|---|---|---|
| Mercury (Hg) | Arsenic (As) | Cadmium (Cd) | Lead (Pb) | |||||||||
| n studies | n samples | Mean min.–max. | n studies | n samples | Mean min.–max. | n studies | n samples | Mean min.–max. | n studies | n samples | Mean min.–max. | |
| Soil (µg/g) | ||||||||||||
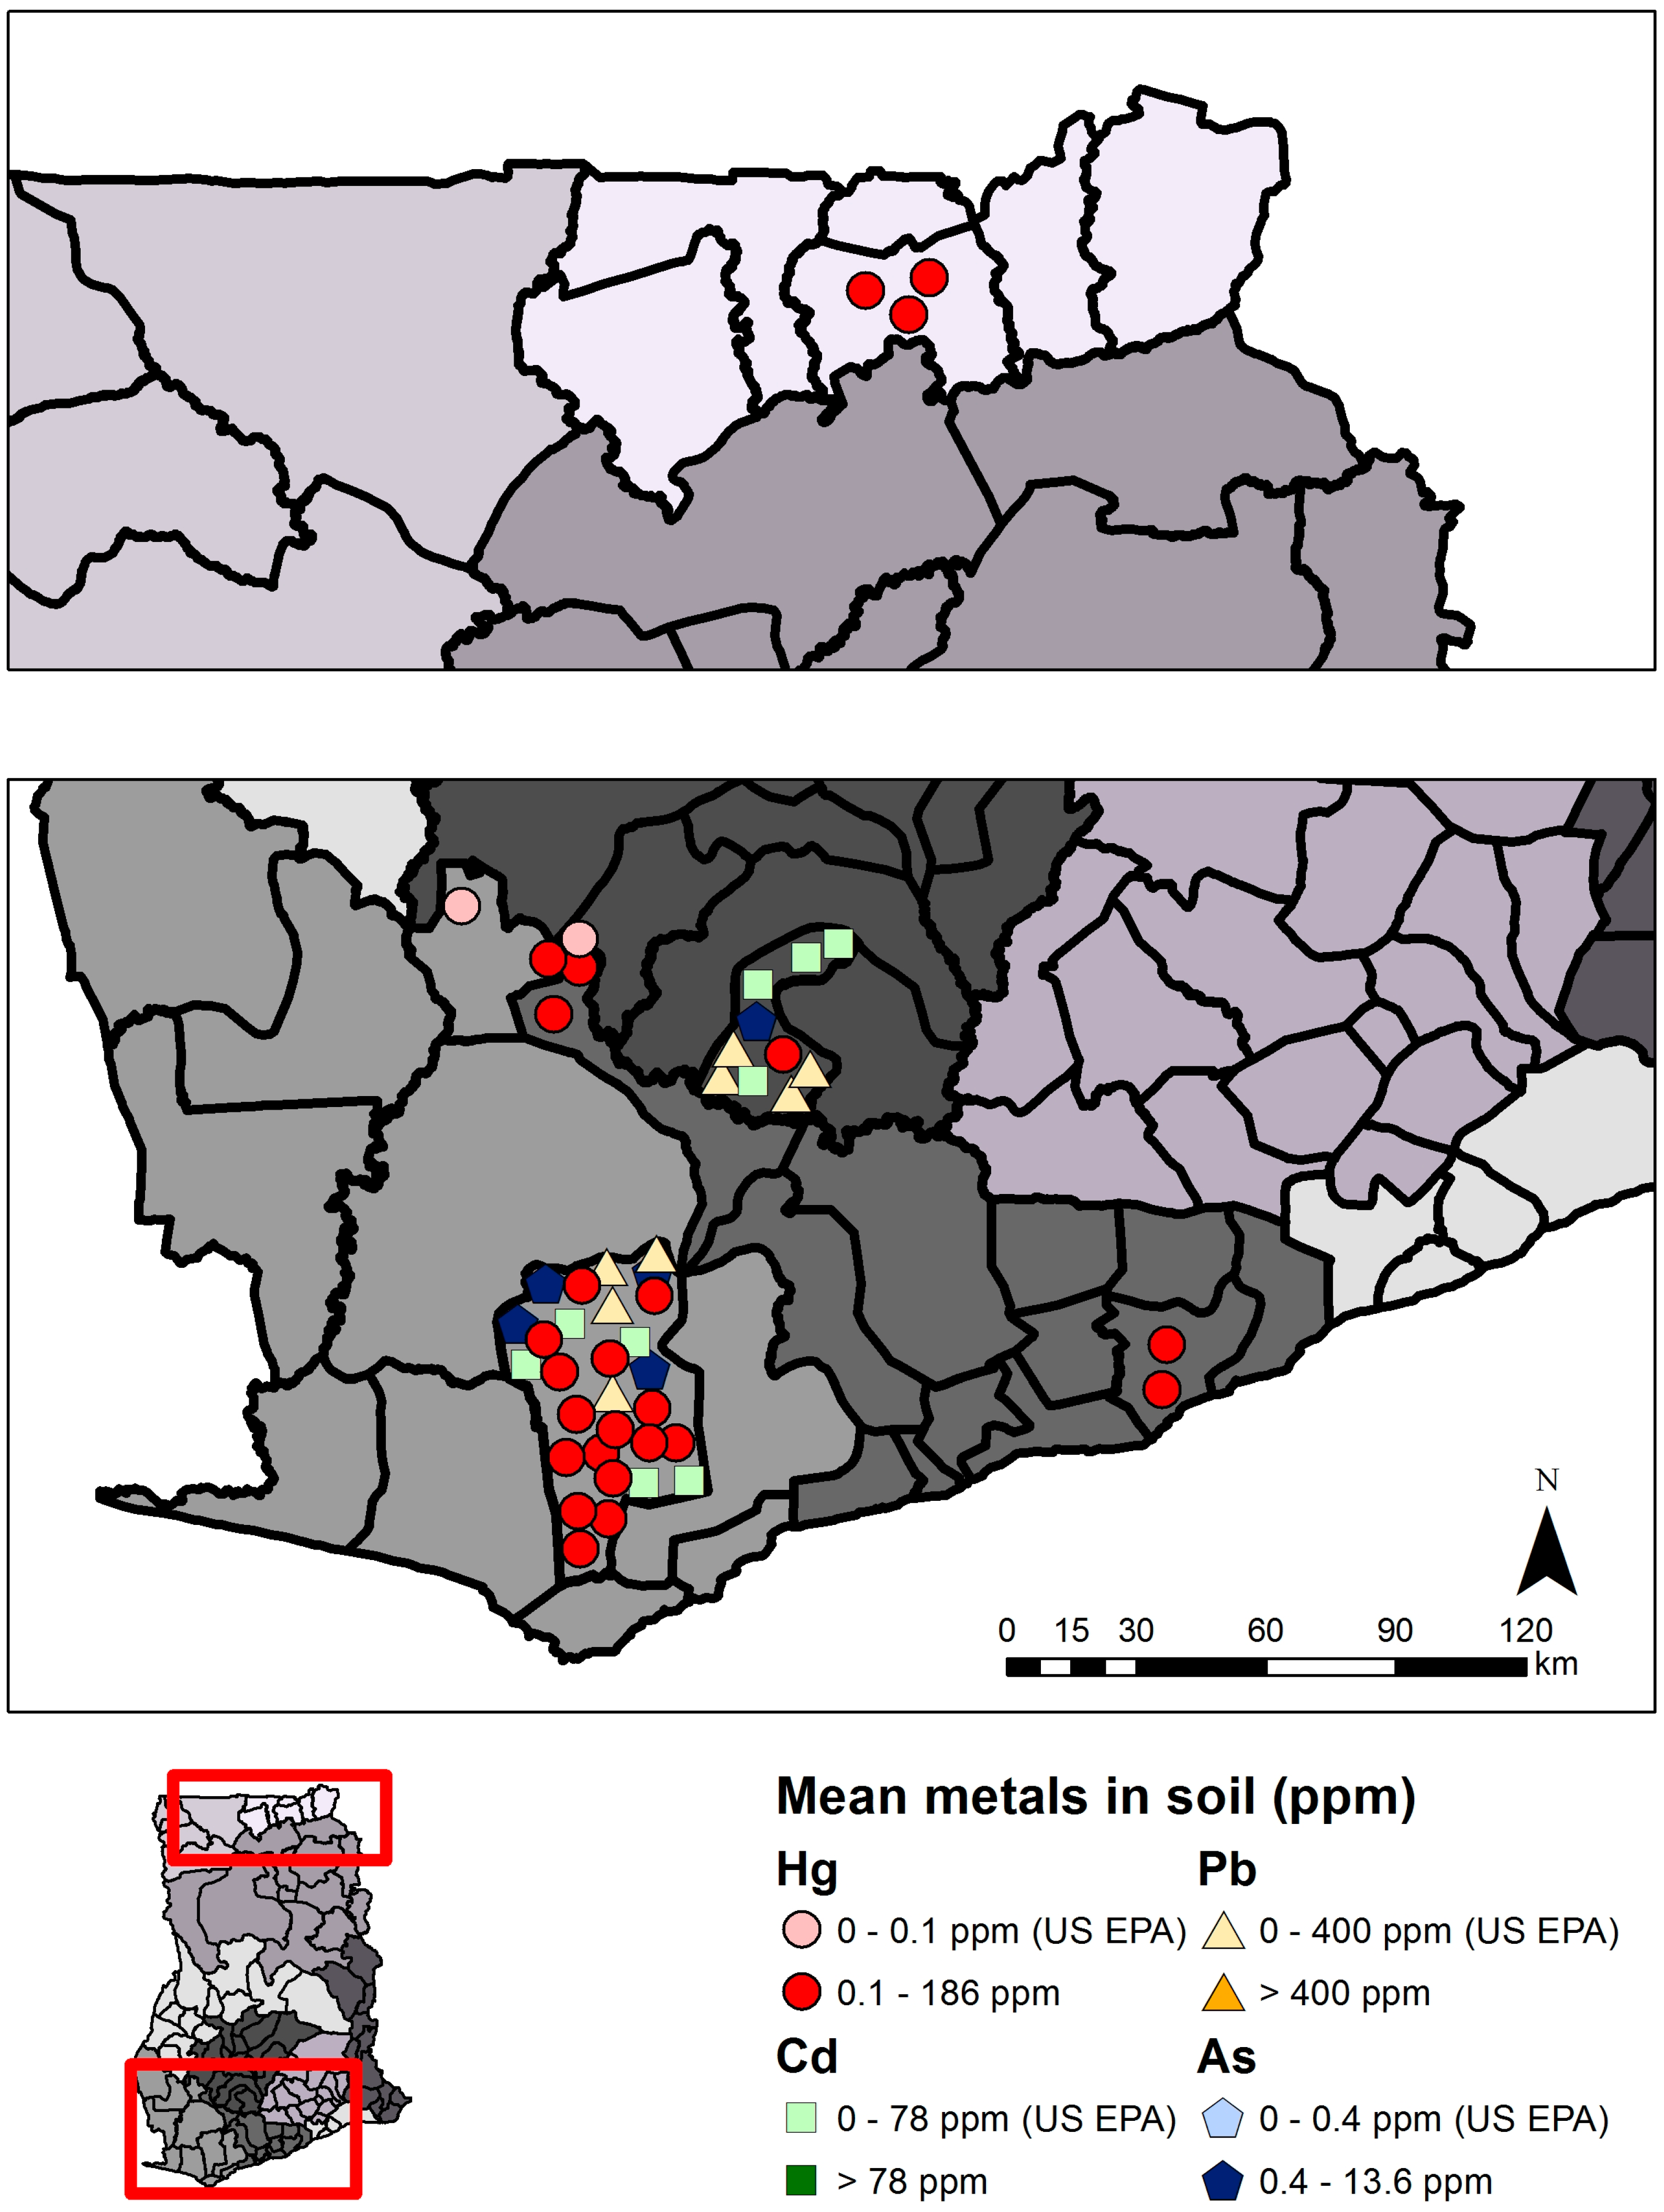
| Total | 11 | 727 | ND–185.9 | 5 | 549 | 0.1–227.0 | 3 | 430 | 0–3.958 | 2 | 422 | 0.042–11.0 |
| Mining | 10 | 565 | 0.020–185.9 | 3 | 295 | 1.1–227.0 | 2 | 271 | 10.0–3.958 | 2 | 266 | 0.042–5.80 |
| Non-mining | 5 | 54 | ND–0.190 | 4 | 254 | 0.1–10.5 | 3 | 159 | 0–1.71 | 2 | 156 | 0.079–11.0 |
| Plants (µg/g) | ||||||||||||
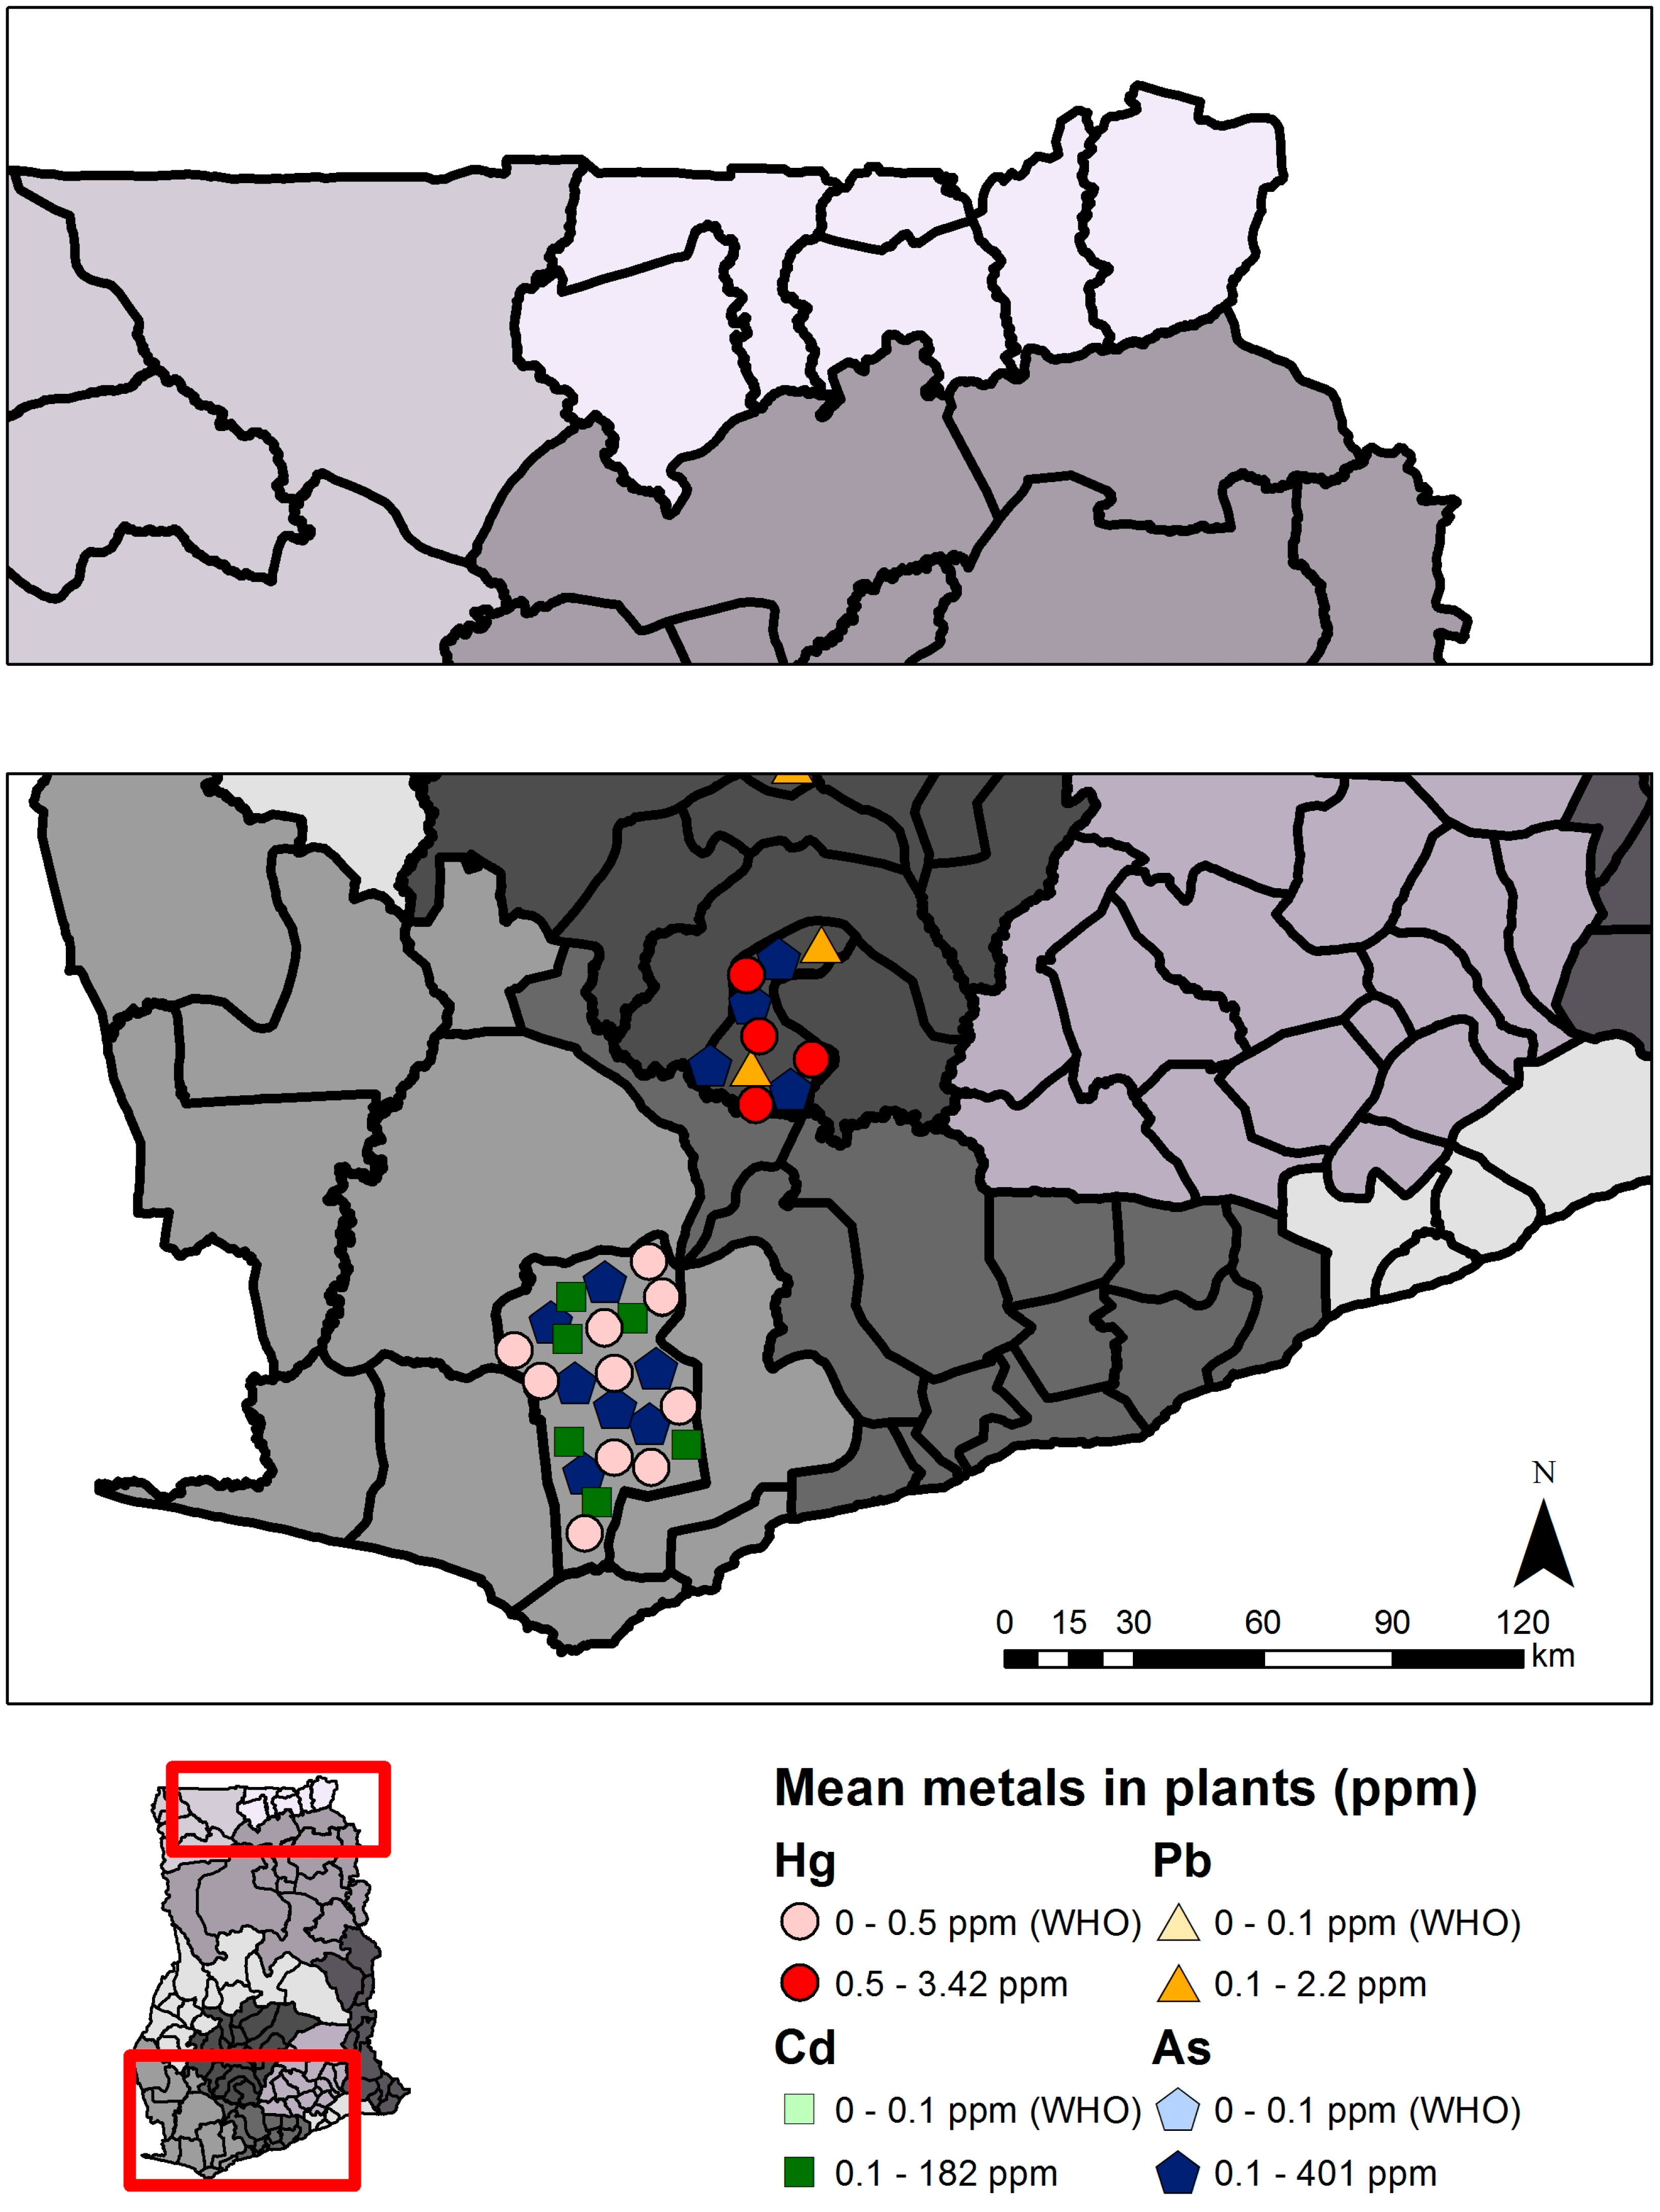
| Total | 4 | 639 | 0.003–3.42 | 3 | 623 | 1.28–383.5 | 2 | 35 | 1.99–182 | 1 | 720 | 0.7–2.2 |
| Mining | 4 | 639 | 0.003–3.42 | 3 | 623 | 1.28–383.5 | 2 | 35 | 1.99–182 | 1 | 240 | 0.8–2.2 |
| Non-mining | 0 | 0 | - | 0 | 0 | - | 0 | 0 | - | 1 | 480 | 0.7–1.9 |
| Sediment (µg/g) | ||||||||||||
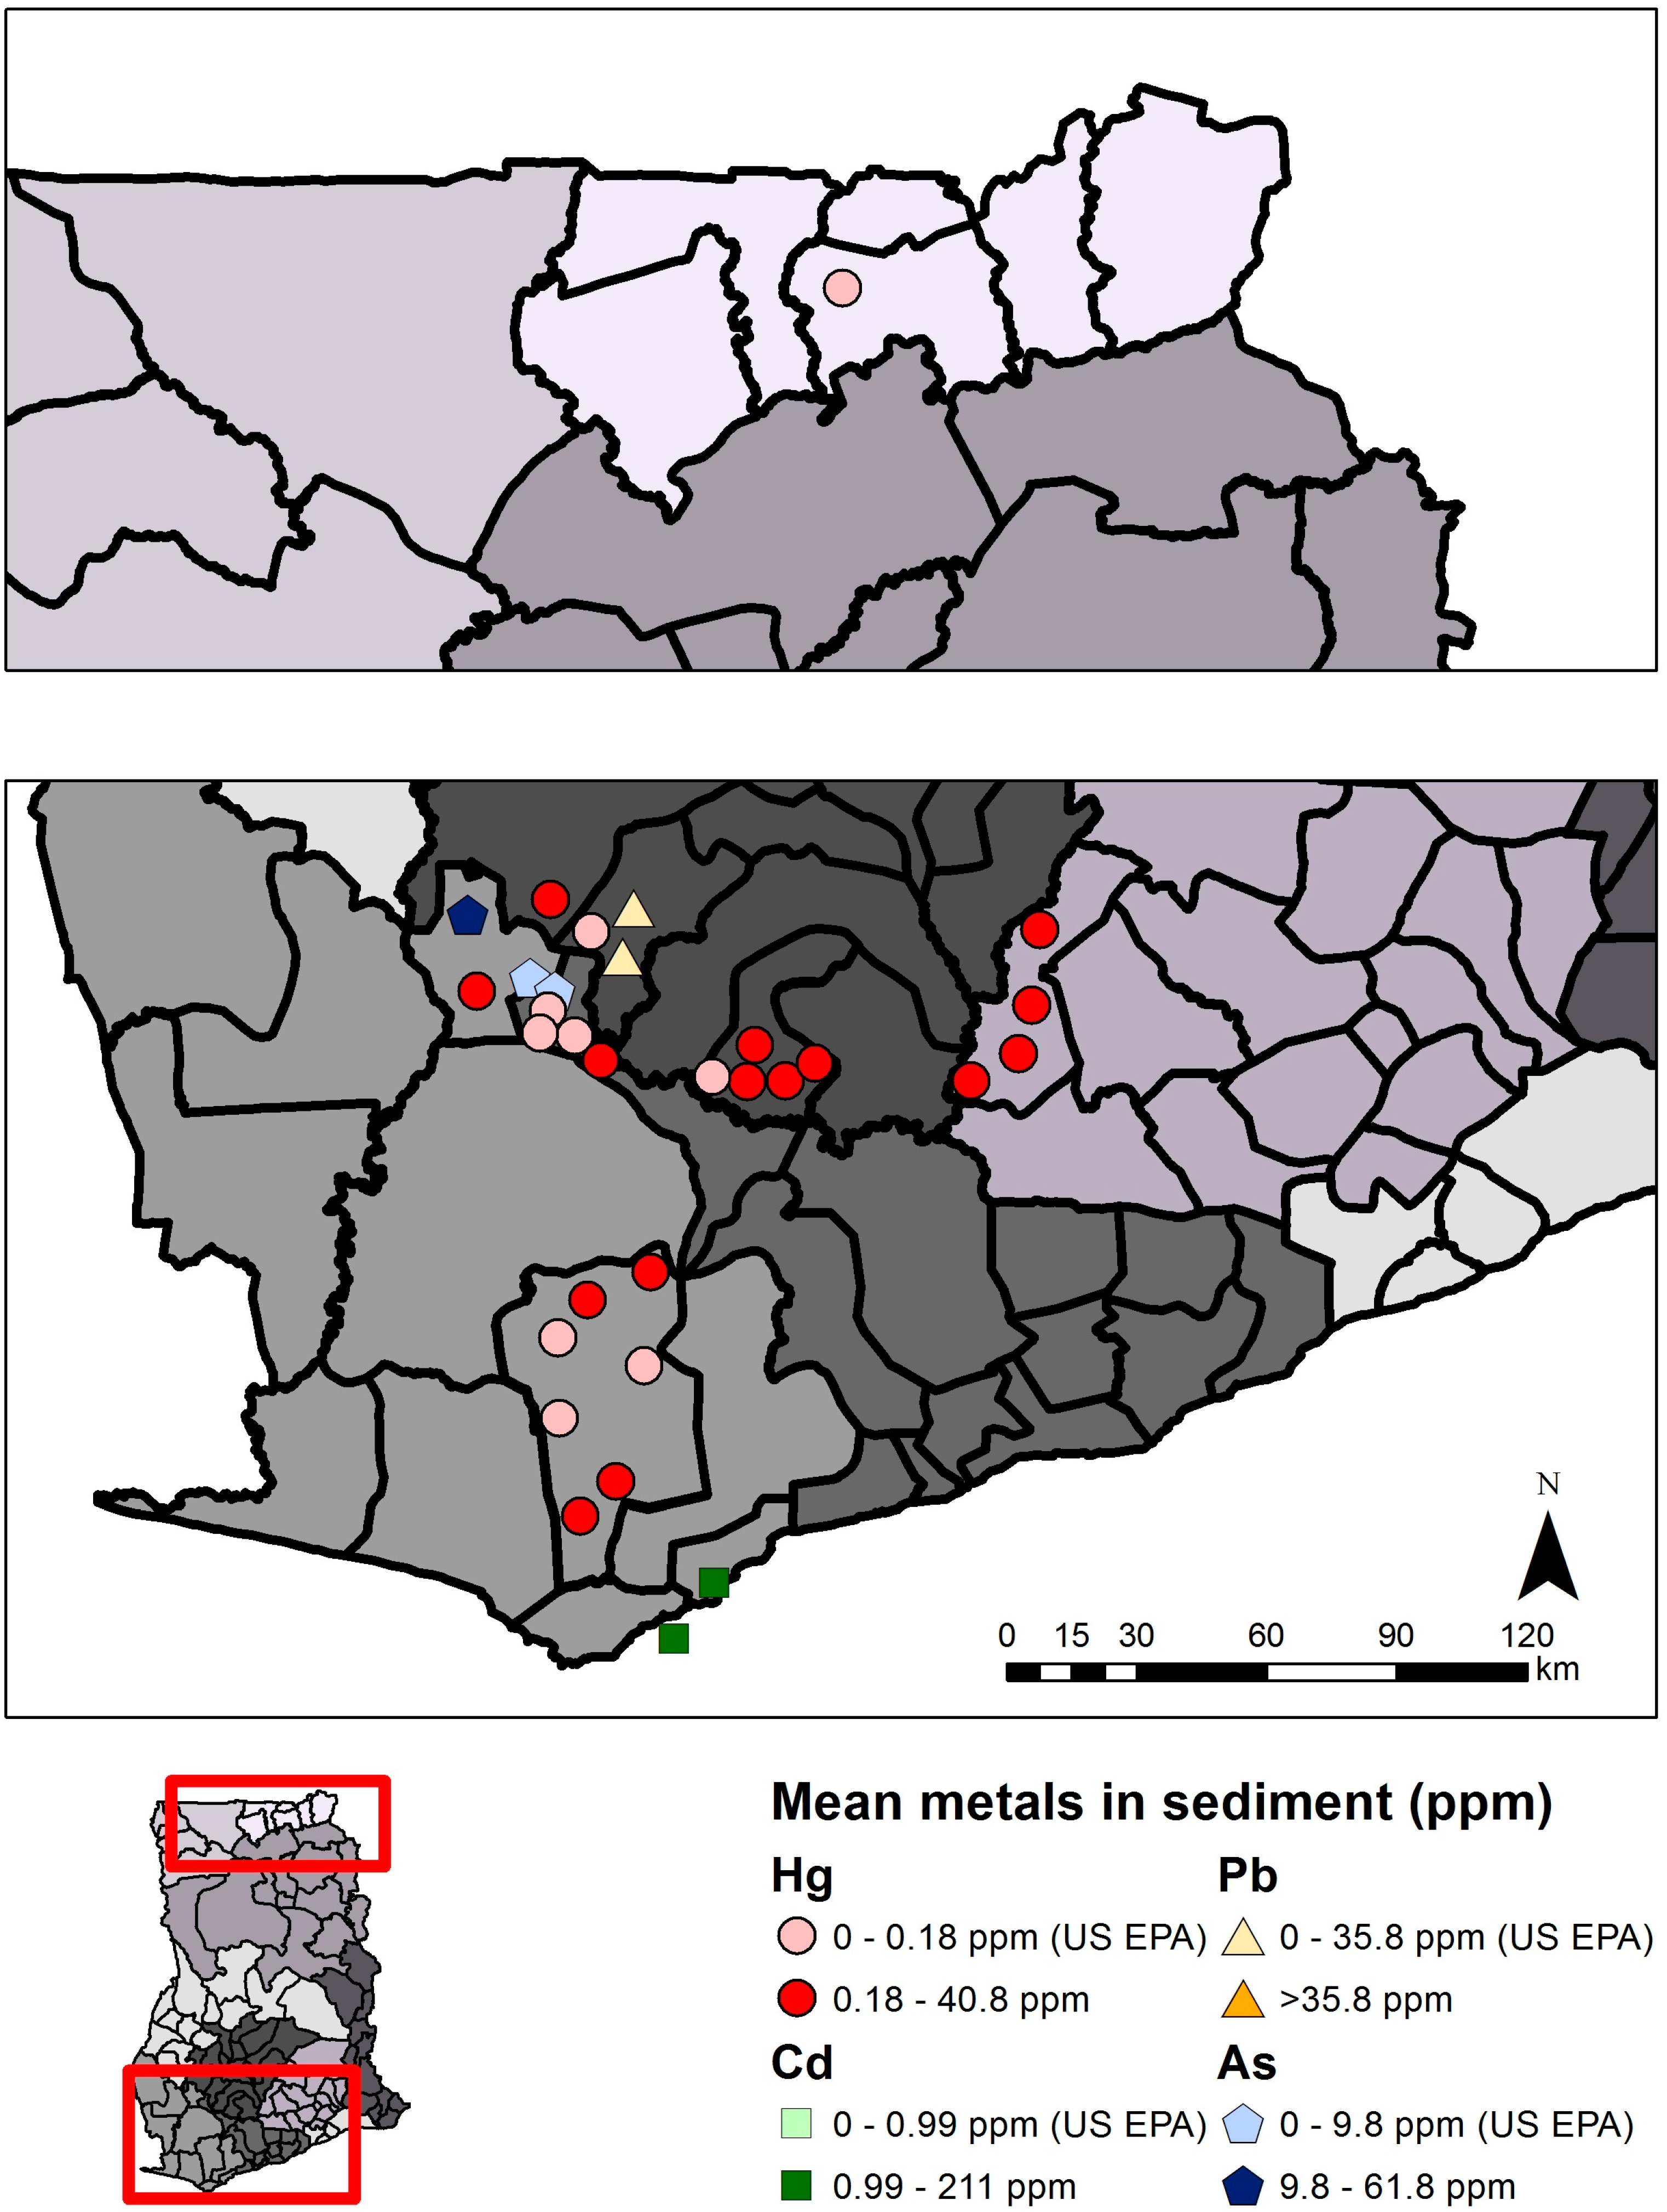
| Total | 15 | 193 * | ND–40.85 | 4 | 117 * | 0.081–61.8 | 2 | 42 | 0.074–0.211 | 1 | 42 | ND–0.243 |
| Mining | 13 | 140 * | ND–40.85 | 2 | 29 * | 0.322–61.8 | 0 | 0 | - | 1 | 28 | ND–0.243 |
| Non-mining | 5 | 53 * | ND–0.494 | 3 | 88 | 0.081–0.311 | 2 | 42 | 0.074–0.211 | 1 | 14 | ND–0.105 |
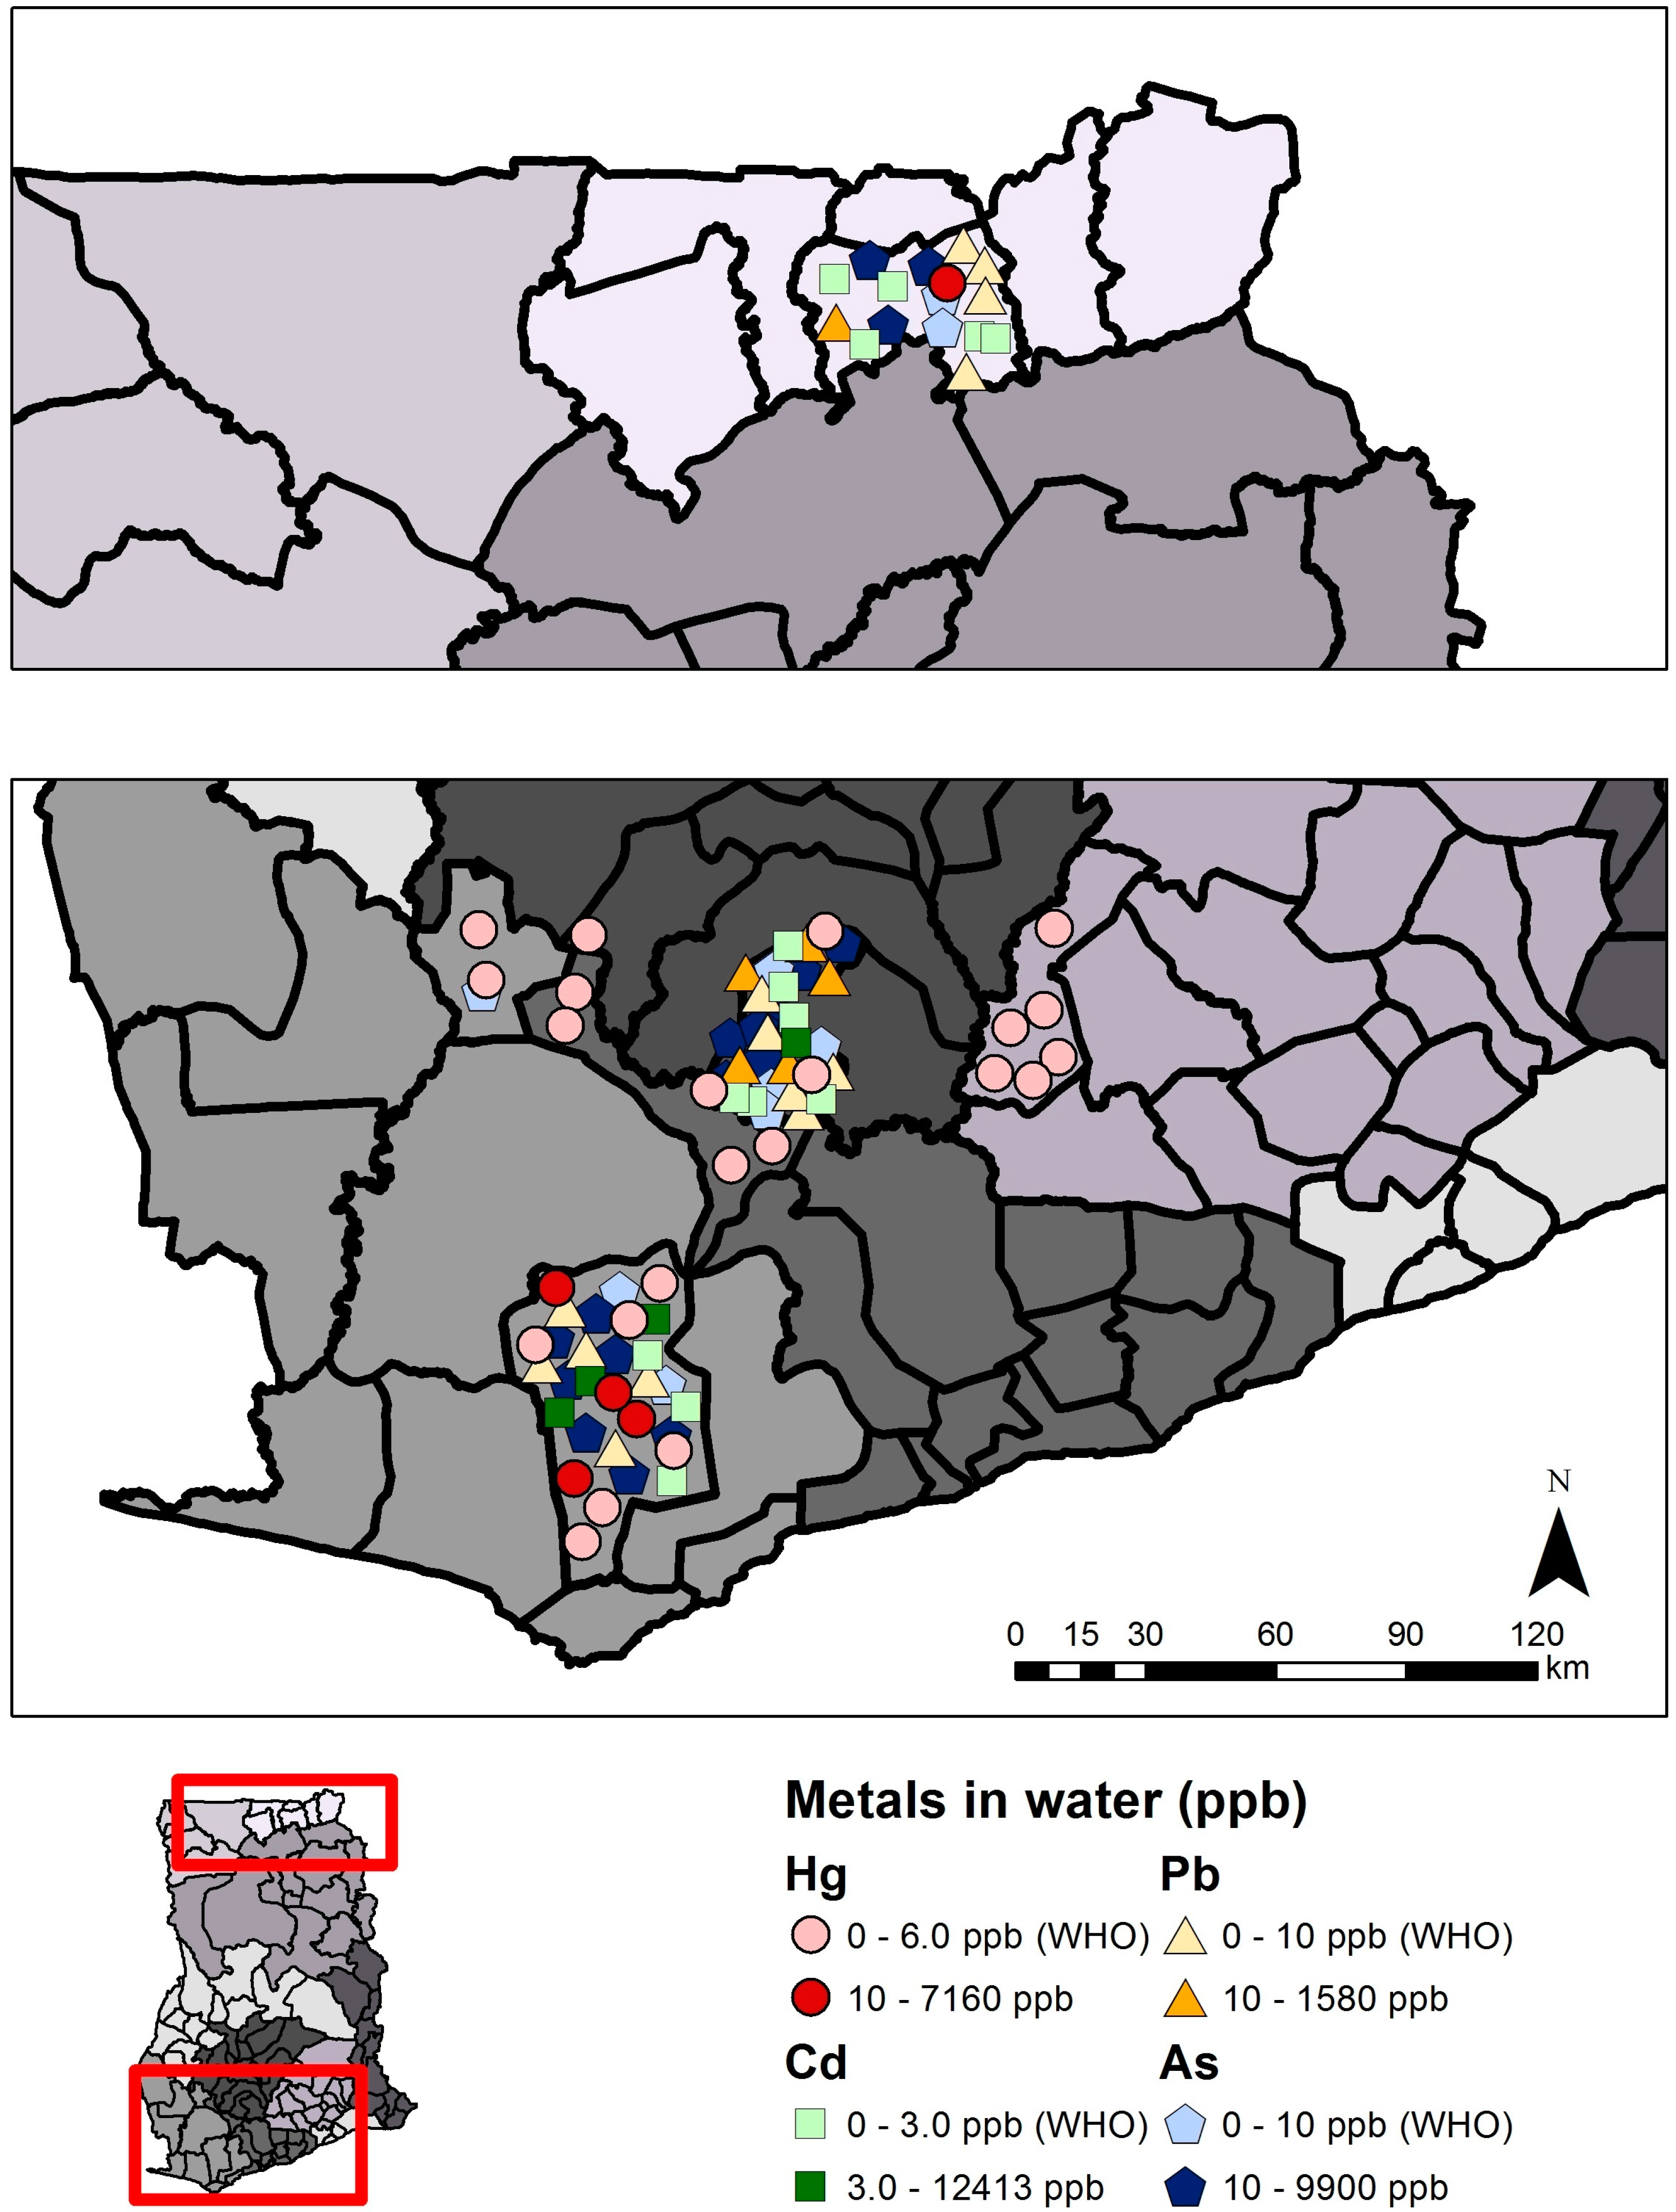
| Water (µg/L) | ||||||||||||
| Total | 18 | 727 * | ND–7160 | 13 | 1053 * | 0.017–10,100 | 9 | 575 | <0.01–12,413 | 9 | 832 | ND–1580.2 |
| Mining | 17 | 615 * | ND–7160 | 10 | 655 * | 0.2–10,100 | 7 | 338 | <0.01–12,413 | 8 | 626 | ND–1580.2 |
| Non-mining | 5 | 112 * | ND–0.4 | 5 | 398 | <0.017–1.93 | 4 | 237 | <0.01–0.07 | 3 | 206 | 0.05–1.526 |
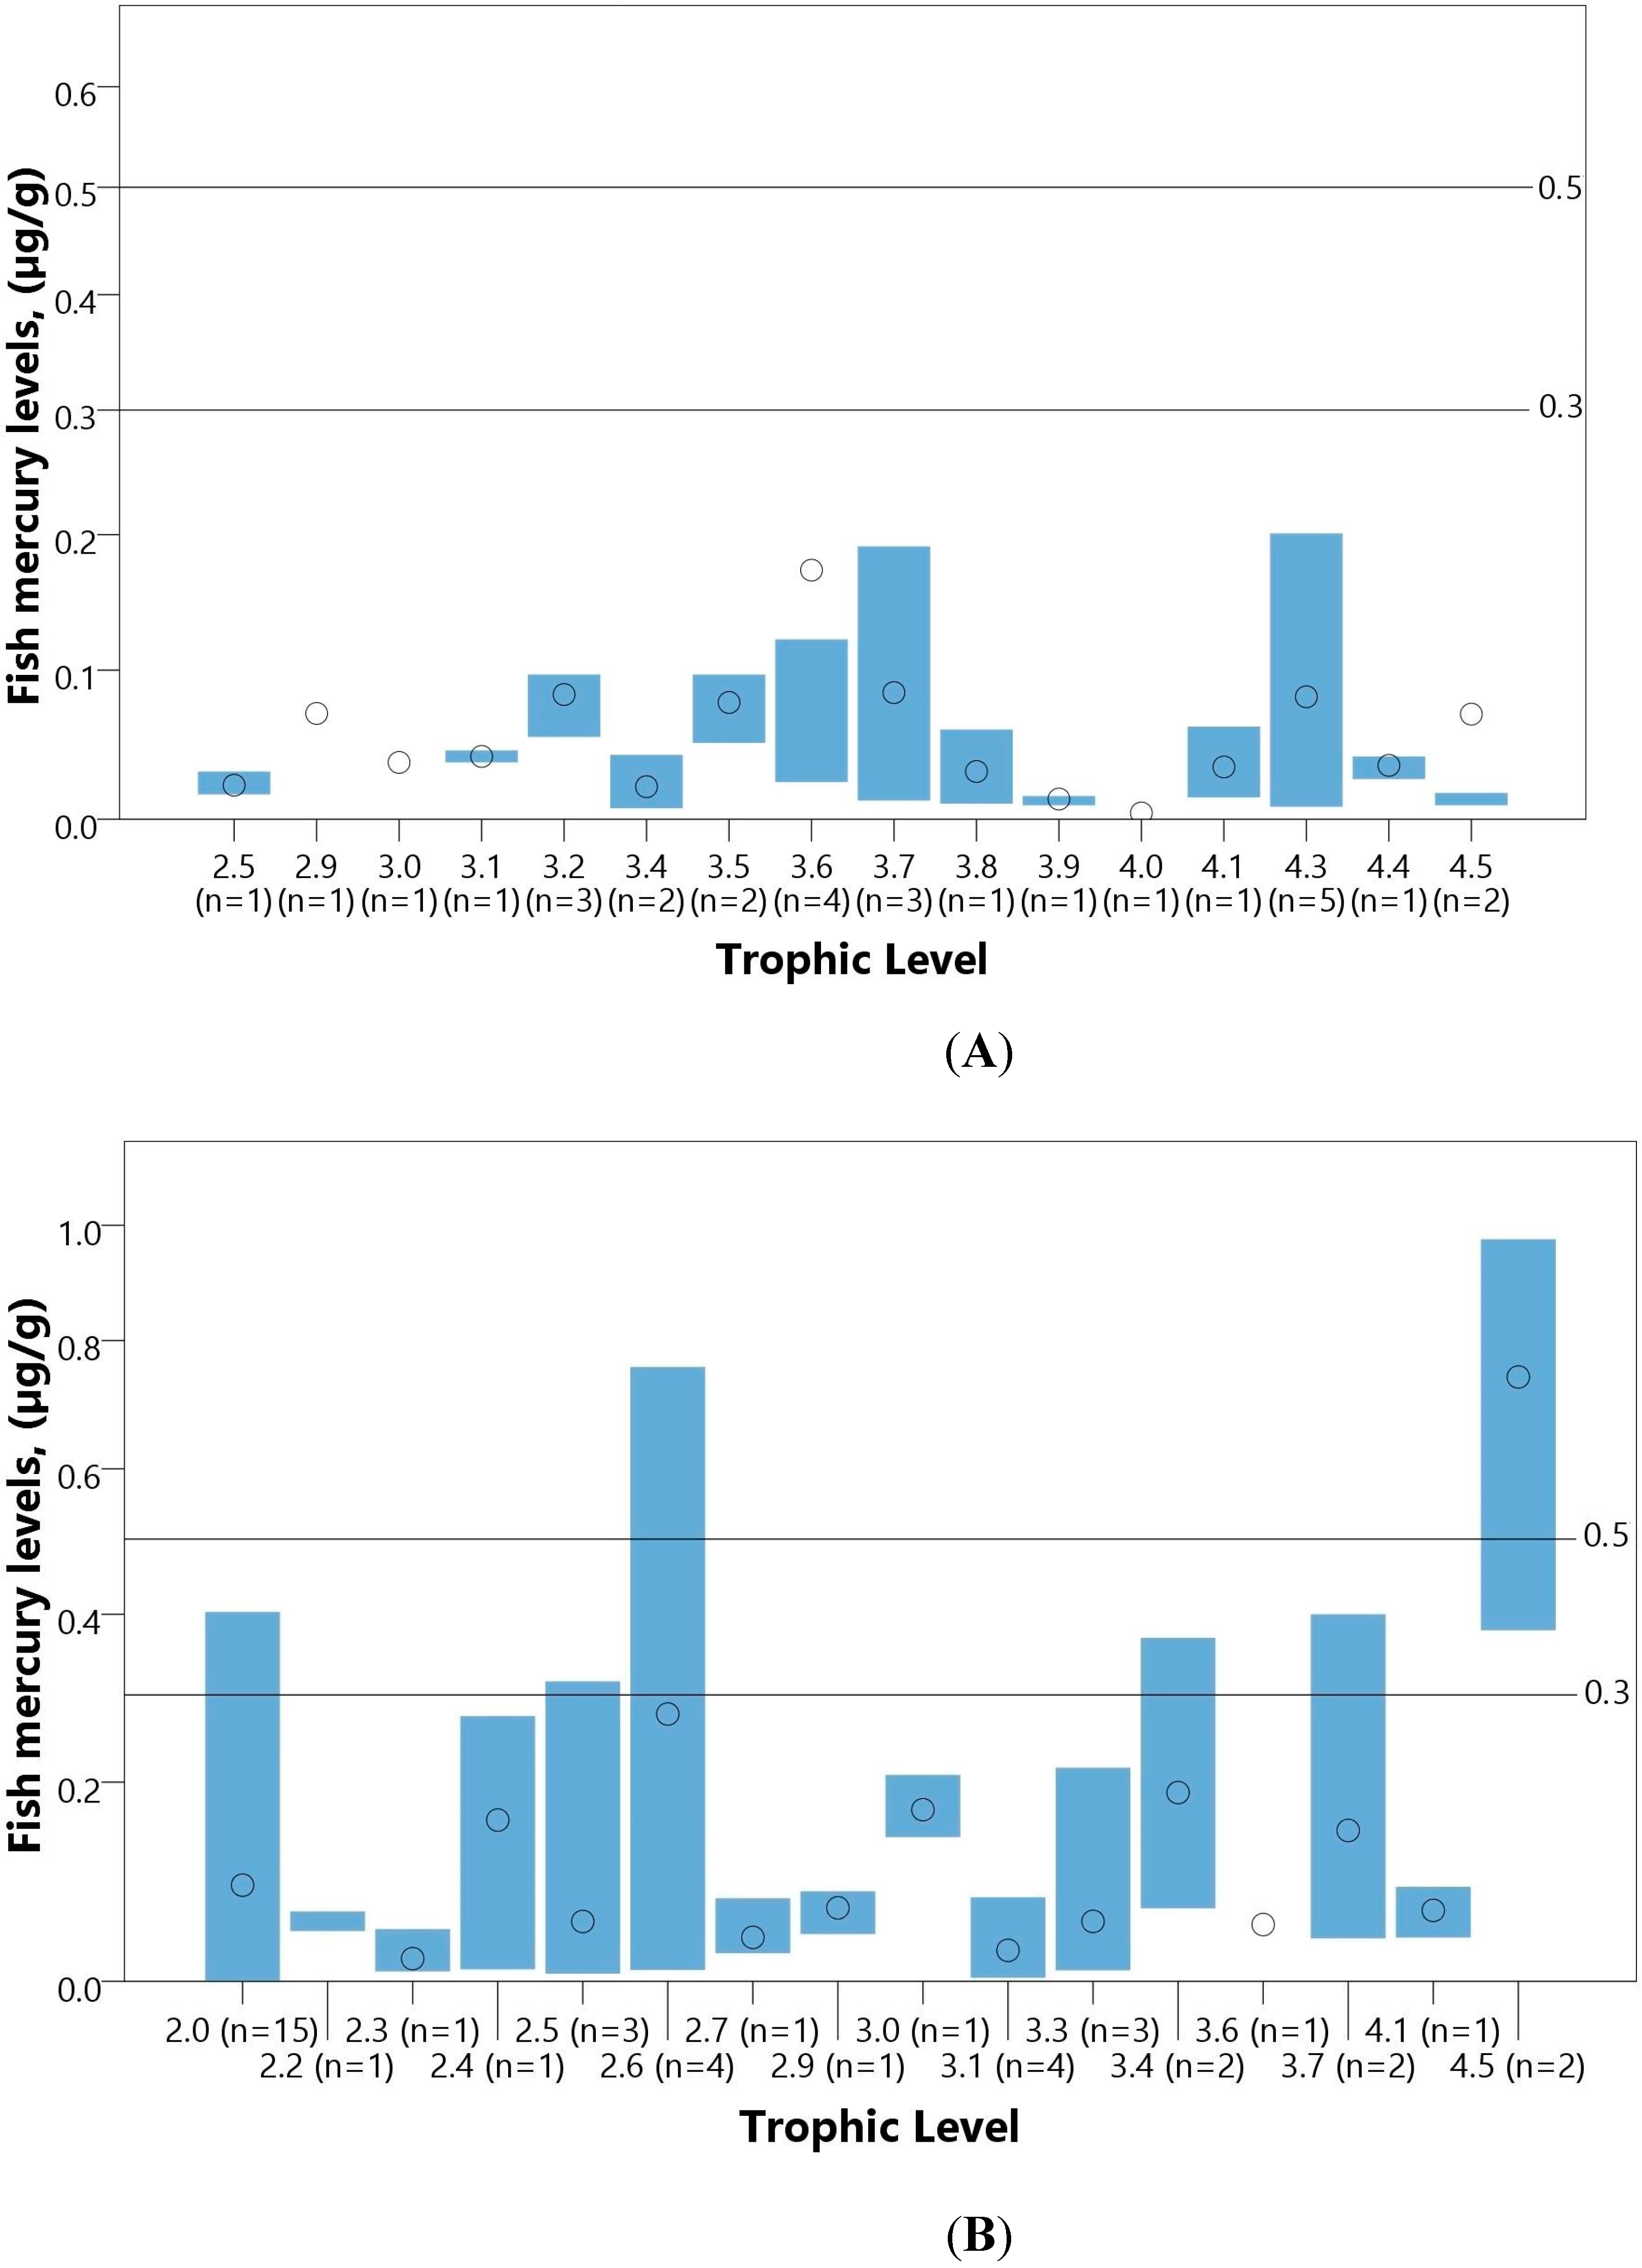
| Fish (µg/g) | ||||||||||||
| Total | 15 | 1305 | 0.004–0.430 | - | - | - | - | - | - | - | - | - |
| Tailings (µg/g) | ||||||||||||
| Total | 7 | 37 * | 0.011–19.3 | - | - | - | - | - | - | - | - | - |
2.1.3. Consequences
2.1.4. Certainty Evaluation
2.2. Contamination from Other Heavy Metals
2.2.1. Causes
2.2.2. Status and Trends
2.2.3. Consequences
2.2.4. Certainty Evaluation
2.3. Water Quality
2.3.1. Causes
2.3.2. Status and Trends
2.3.3. Consequences
2.3.4. Certainty Evaluation

2.4. Land Disturbances
2.4.1. Causes
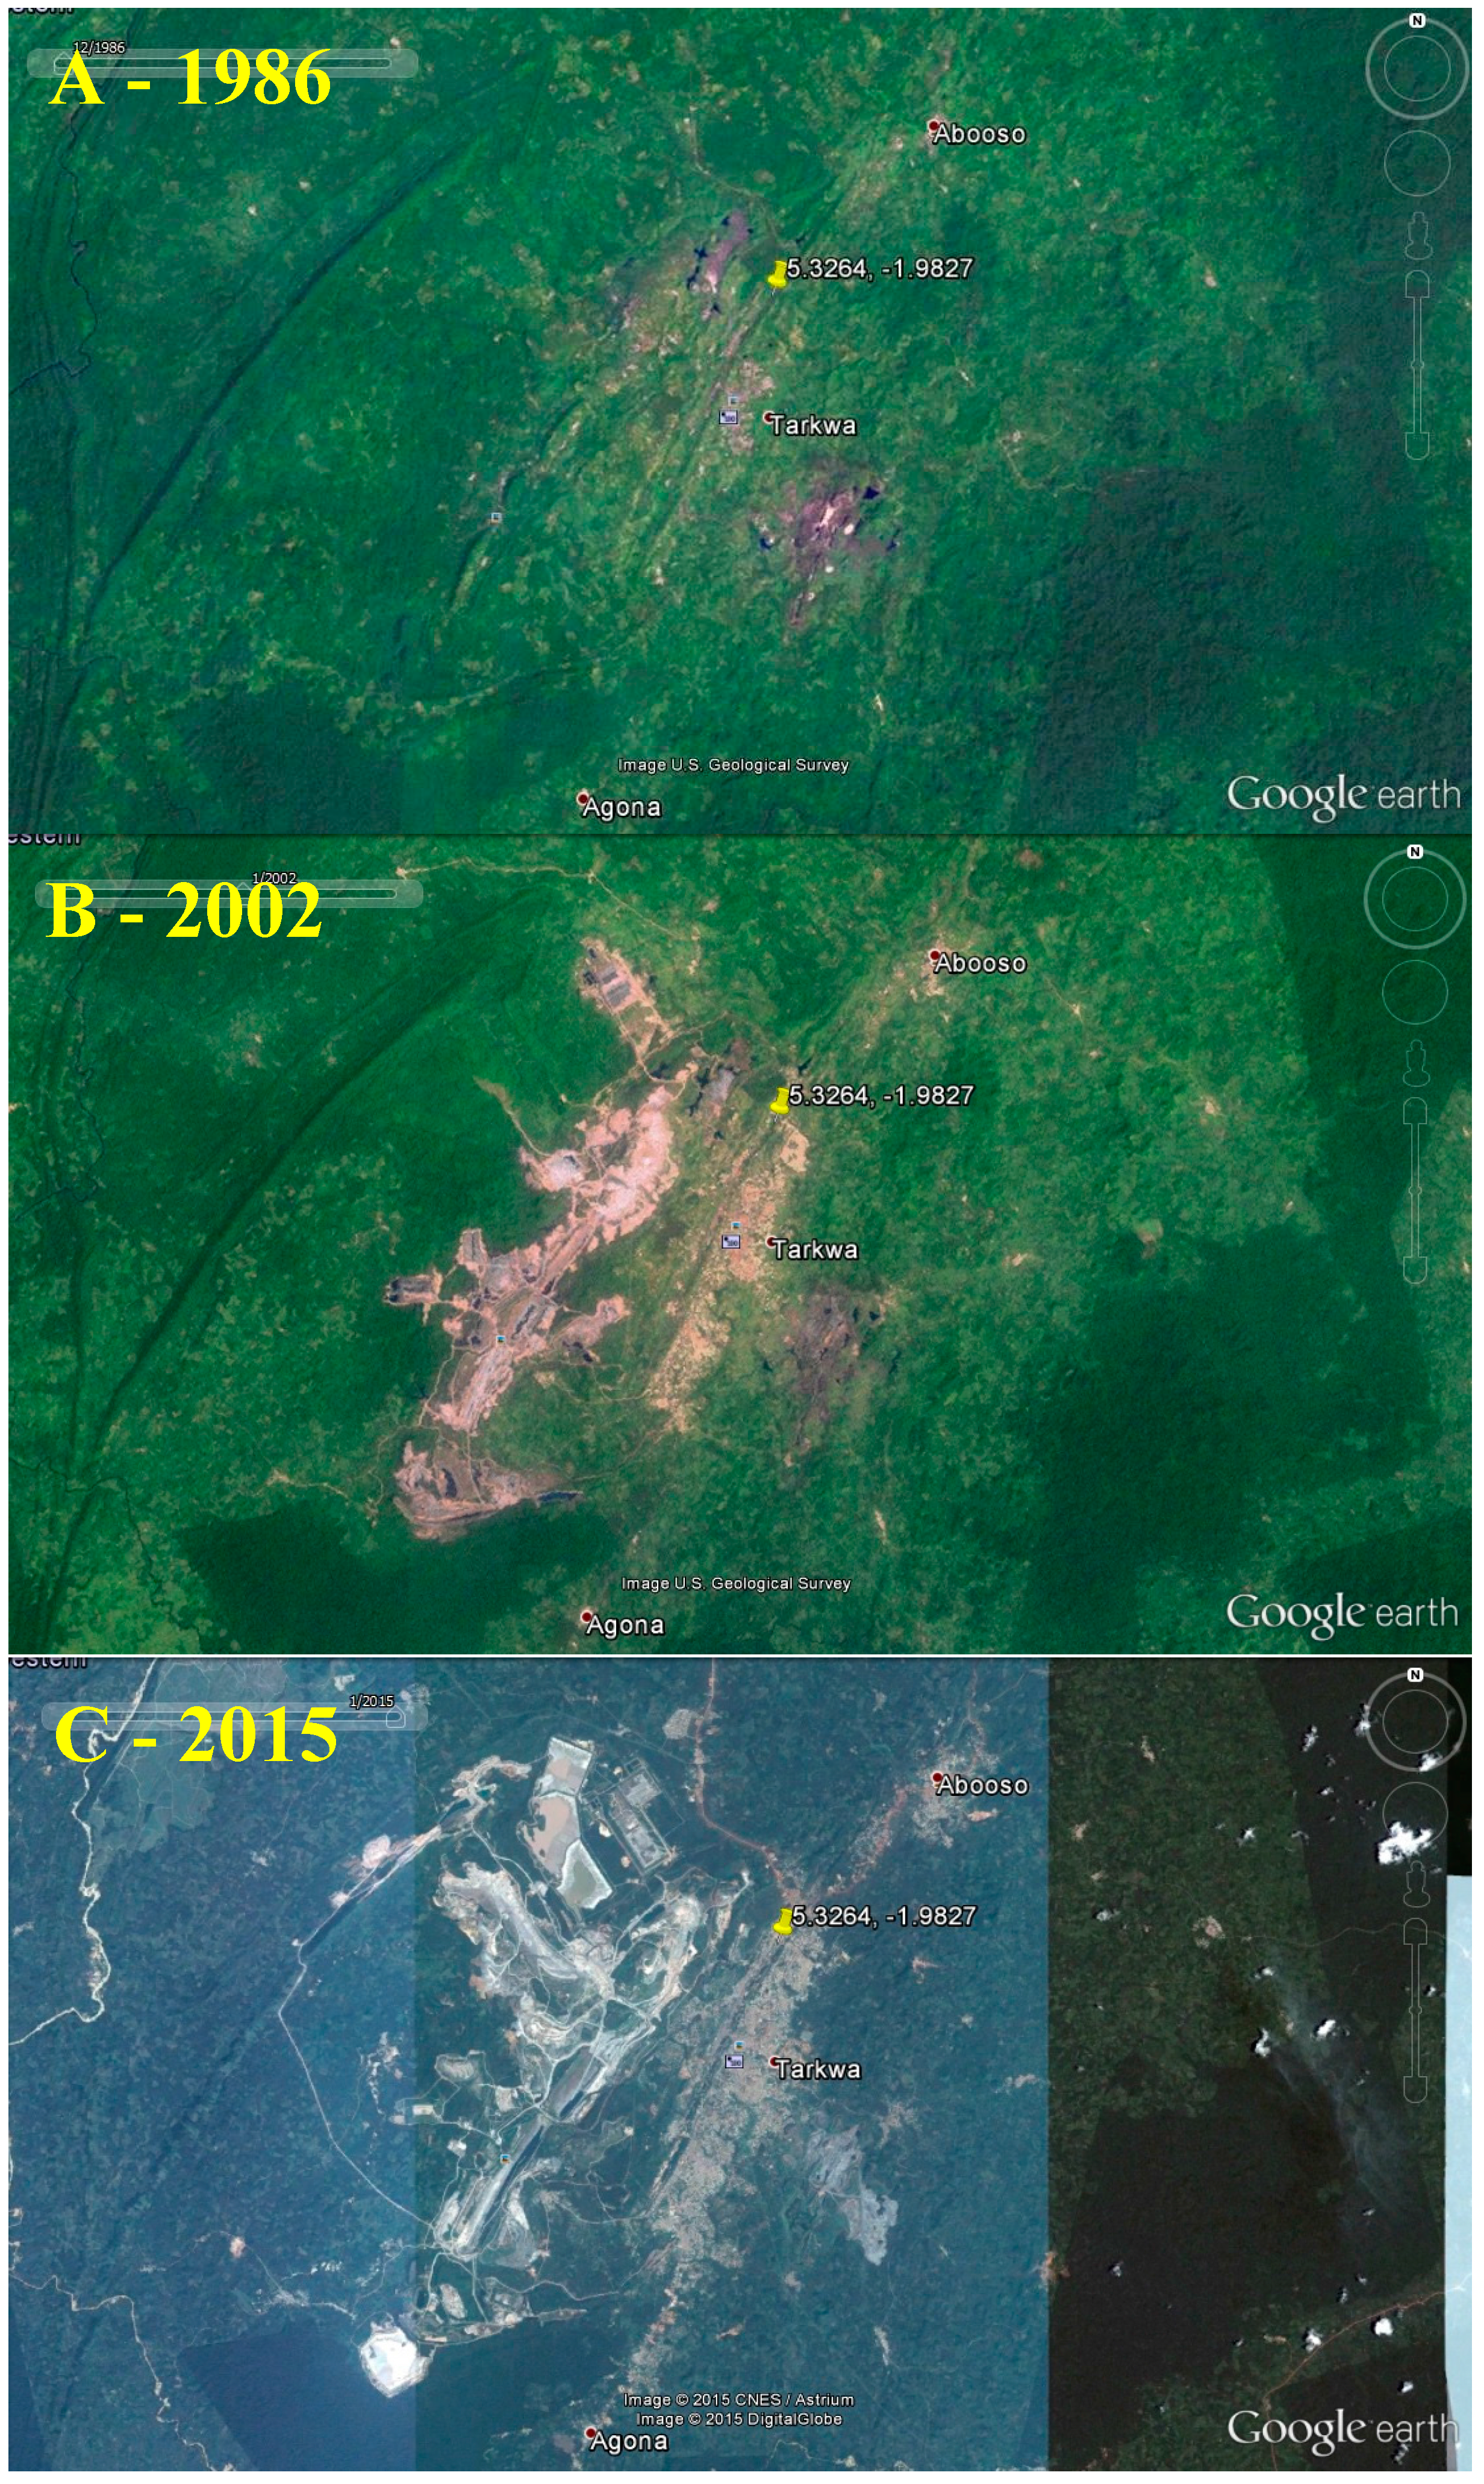
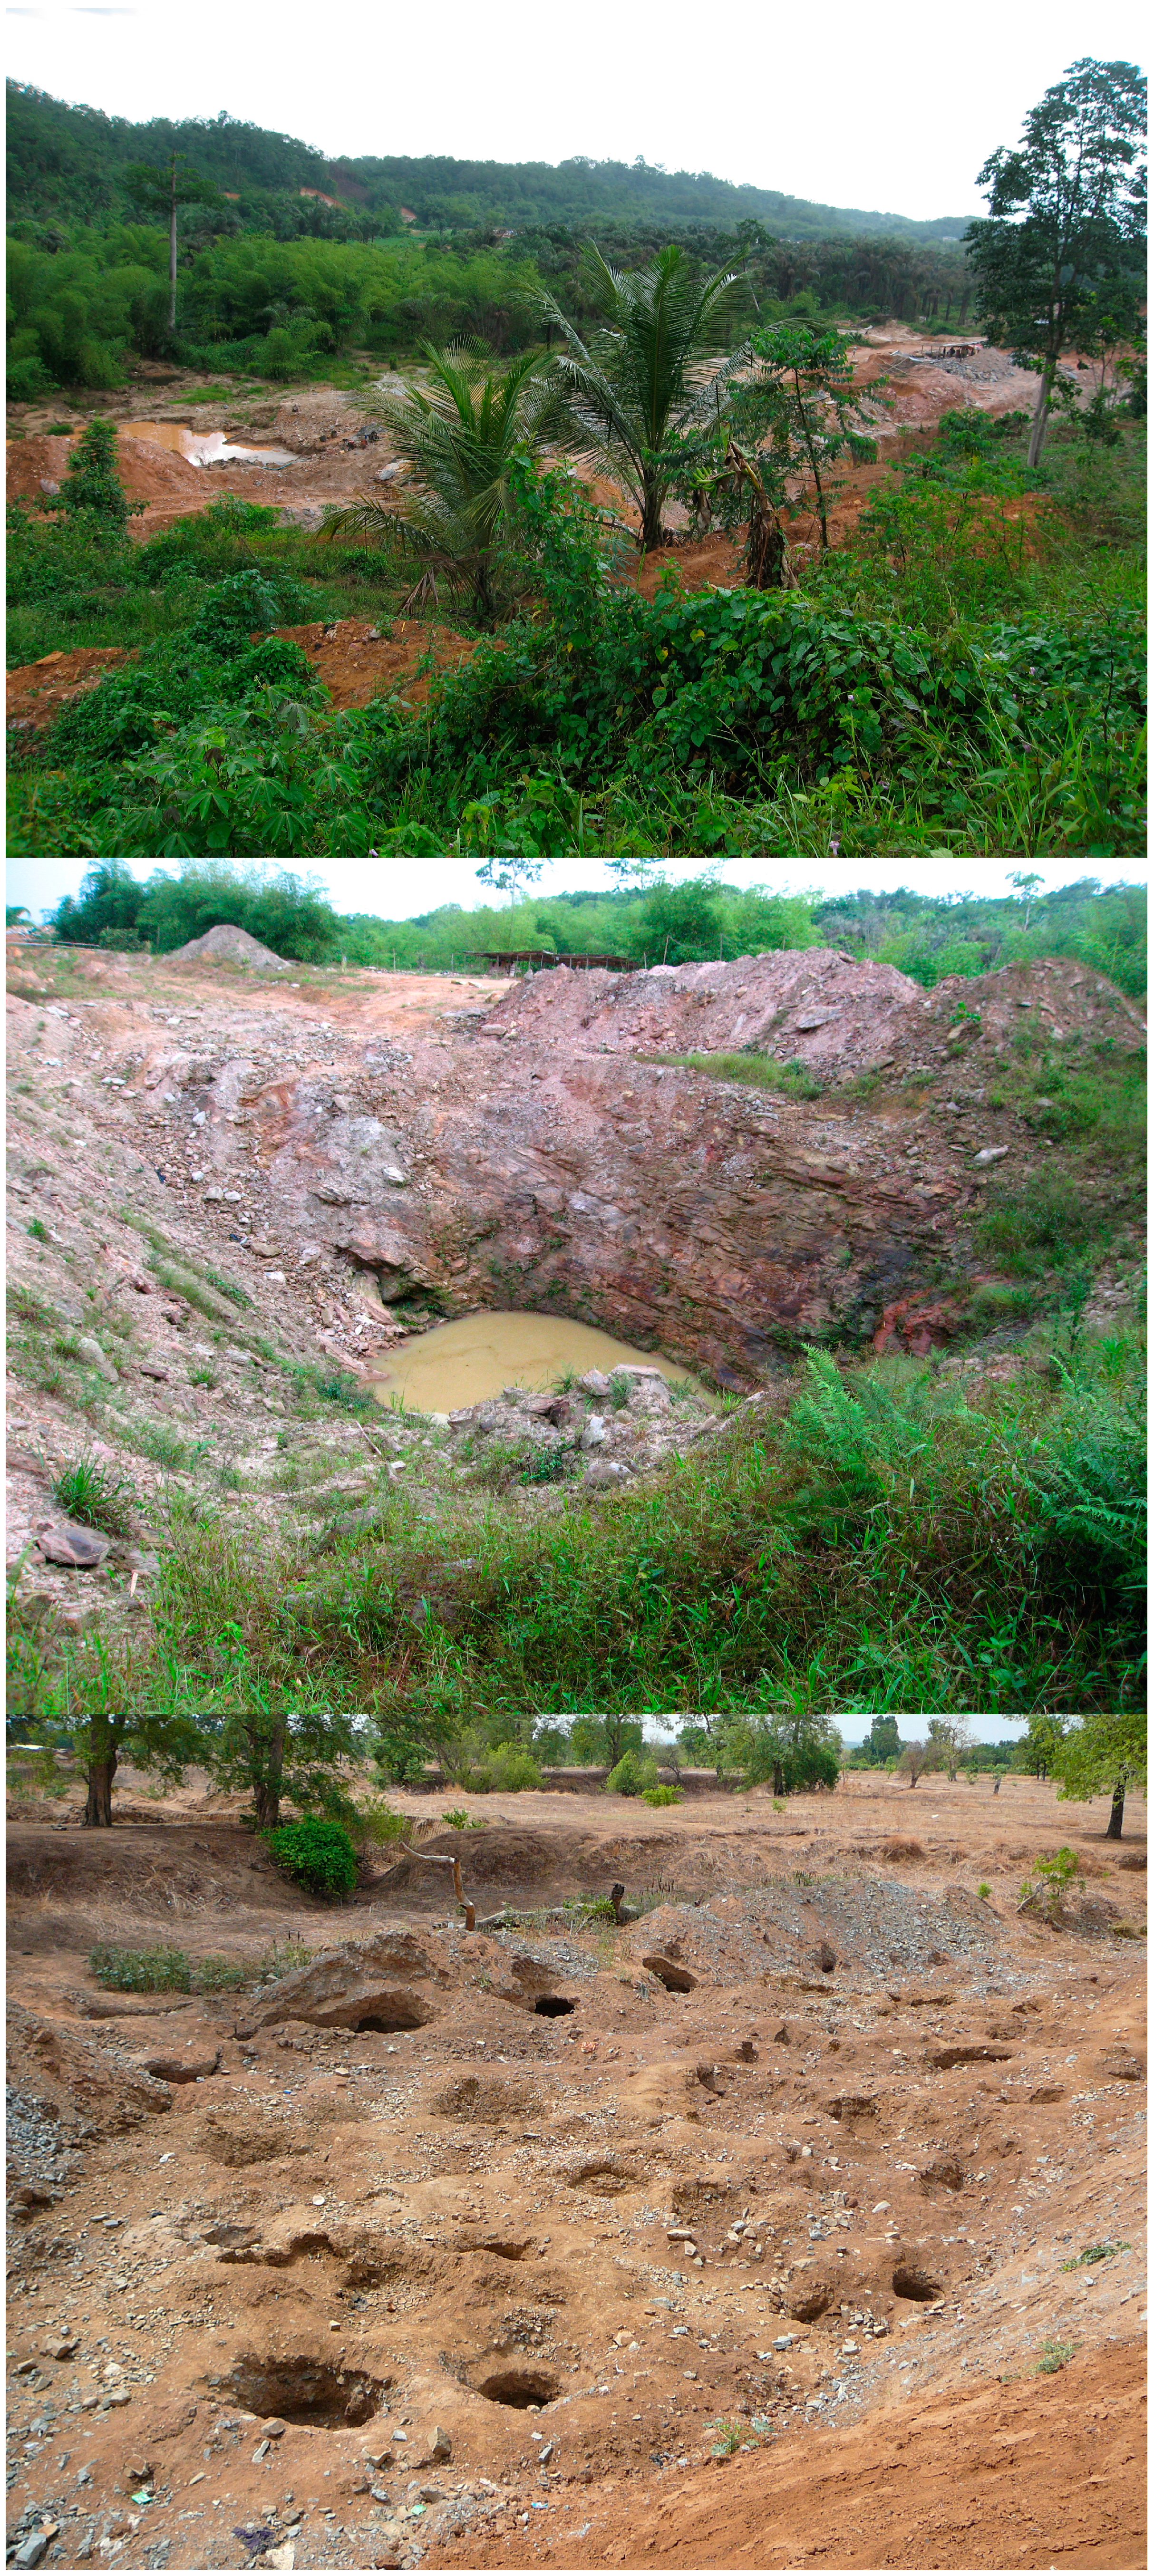
2.4.2. Status and Trends
2.4.3. Consequences
2.4.4. Certainty Evaluation
2.5. Other Plausible Ecological Effects
2.5.1. Climate Change
2.5.2. Mining Waste
| Causes | Status and Trends | Consequences | Certainty Evaluation | |
|---|---|---|---|---|
| Mercury contamination | Mercury is used in ASGM to isolate gold from other minerals; mercury is not recaptured | Mercury in soil, sediment, and water is higher in ASGM and LSGM areas than non-mining areas. | Health effects on wildlife and ecological systems; human exposure via contamination of soil, sediment, water, and food. | High |
| Contamination from other heavy metals | Mobilization of toxic elements during excavation, grinding, and washing ore | Arsenic is elevated in soil, and sediment in ASGM and LSGM areas compared to non-mining areas; arsenic is elevated more in some mining sites compared to non-mining sites in water. Cadmium is higher in soil and water in ASGM areas. Lead is elevated slightly in sediment and plants, and in water in ASGM areas. | Health effects on wildlife and ecological systems; human exposure via contamination of soil, sediment, water, and food. | Moderate |
| Water quality | Ore washing, panning, and amalgamation preparation | Water acidity (lower pH) in ASGM and LSGM areas. High turbidity and chemical oxygen demand in mining areas. Other water quality parameters (conductivity, sulfates, and total dissolved solids) were within WHO standards. | Effects on aquatic life and human health via pollution, siltation, and excessive water withdrawals. | Moderate |
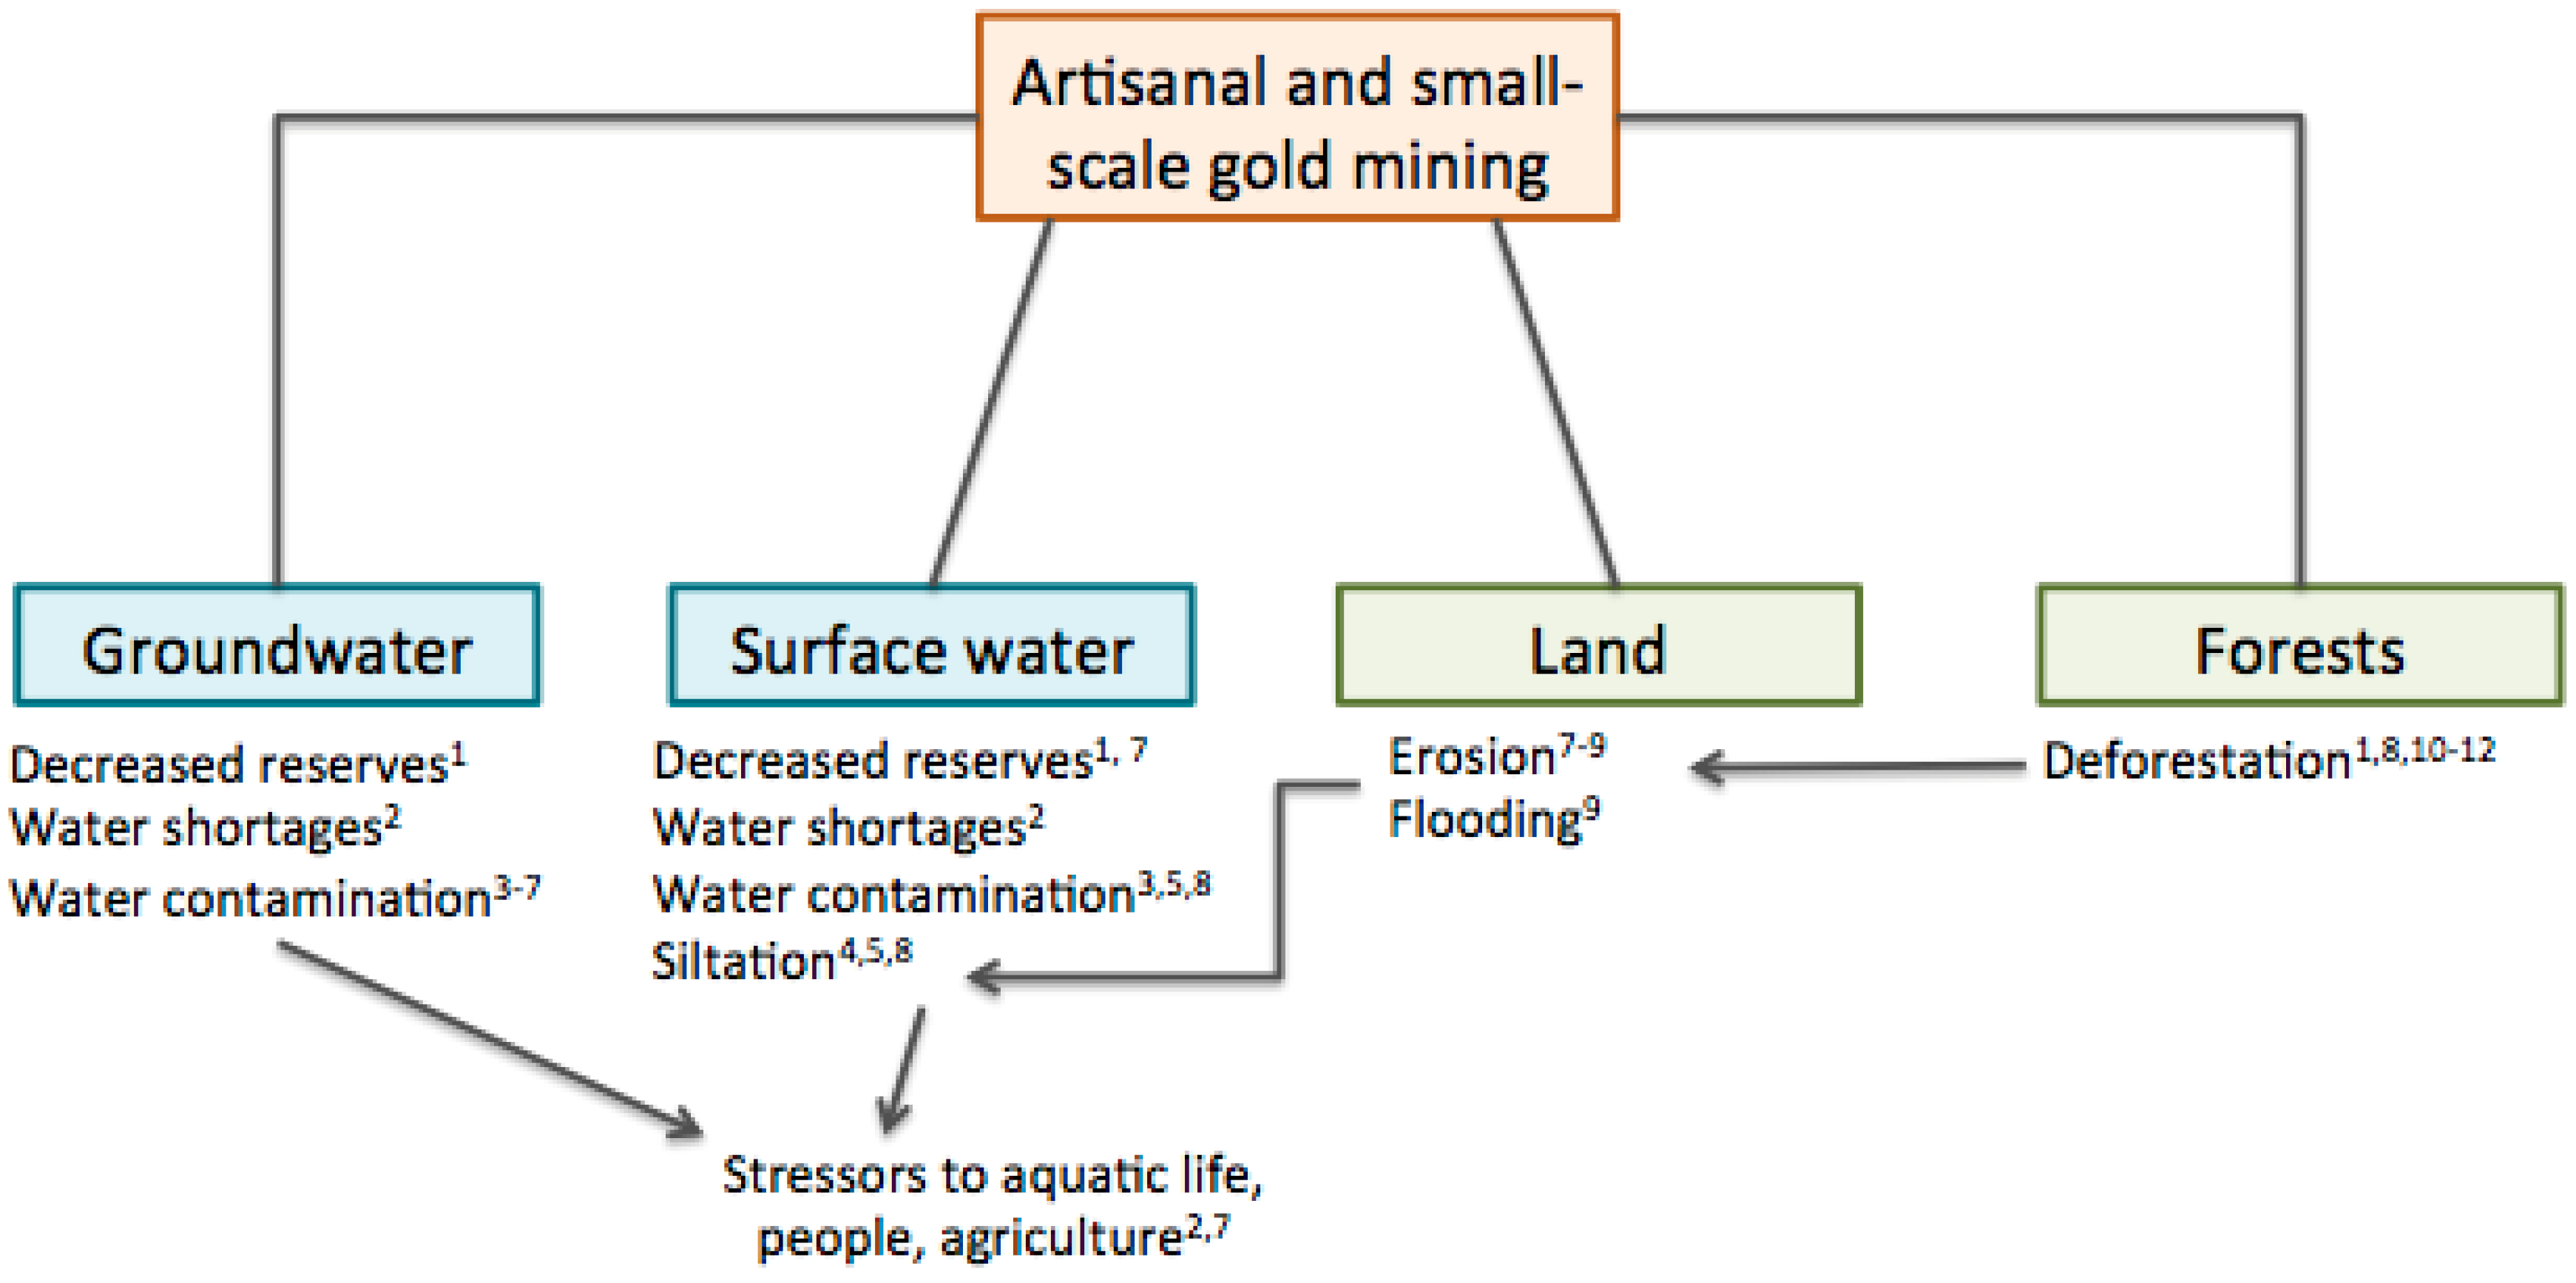
| Land disturbances | Vegetation and forests cleared for mining; excavation; temporary human settlements | Decreased natural land cover, shrub densities, and biodiversity in ASGM areas. | Deforestation; erosion; stress to wildlife; and loss of wildlife habitats and biodiversity. | Low-moderate |
| Climate change | Fossil fuel combustion, deforestation, industrial pollution | Greenhouse gas emissions increased mainly from land use changes and forestry losses. | Changes in agricultural and fishing patterns, desertification, and rising sea levels. | Low |
| Mining waste | Ore processing and unregulated tailings disposal | Tailings often not treated before discharging into rivers, deposition, or storage. | Elevated metals in tailings water and mercury in tailings. | Low |
3. Conclusions
Supplementary Files
Supplementary File 1Acknowledgments
Author Contributions
Conflicts of Interest
References
- United Nations Environment Programme (UNEP). Summary of Supply, Trade and Demand Information on Mercury; UNEP: Geneva, Switzerland, 2006. [Google Scholar]
- Spiegel, S.J.; Viega, M.M. Global Impacts of Mercury Supply and Demand in Small-Scale Gold Mining: Report to the UNEP Governing Council Meeting; UNEP Governing Council: Nairobi, Kenya, 2006. [Google Scholar]
- Hilson, G.M. Harvesting mineral riches: 1000 years of gold mining in Ghana. Resour. Policy 2002, 28, 13–26. [Google Scholar] [CrossRef]
- United Nations International Merchandise Trade Statistics Yearbook 2013; UNEP: Nairobe, Ghana, 2013.
- Tetteh, K. An Overview of Ghana’s Artisanal and Small-Scale Mining (ASM) Sector; Minerals Commission of Ghana: Nairobi, Ghana, 2010. [Google Scholar]
- United Nations Environment Programme (UNEP). Global Mercury Assessment 2013: Sources, Emissions, Releases and Environmental Transport; UNEP: Geneva, Switzerland, 2013. [Google Scholar]
- Millennium Ecosystem Assessment. Ecosystems and Human Well-being: Synthesis; Millennium Ecosystem Assessment: Washington, DC, USA, 2005; Vol. 5. [Google Scholar]
- Wilson, M.L.; Renne, E.P.; Roncoli, C.; Agyei-Baffour, P.; Tenkorang, E.Y. Integrated assessment of Artisanal and Small-Scale Gold Mining in Ghana—Part 3: Social sciences and economics. Int. J. Environ. Res. Public Health 2015. [Google Scholar] [CrossRef] [PubMed]
- Basu, N.; Clarke, E.; Green, A.; Long, R.; Calys-Tagoe, B.; Chan, L.H.M.; Dzodzomenyo, M.; Fobil, J.N.; Neitzel, R.L.; Obiri, S.; Odei, E.; Ovadje, L.; Rajaee, M.; Quansah, R.; Wilson, M.L. Integrated assessment of Artisanal and Small-Scale Gold Mining in Ghana—Part 1: Human health review. Int. J. Environ. Res. Public Heal. 2015, 12, 5143–5176. [Google Scholar] [CrossRef] [PubMed]
- Vaccaro, L.; Read, J.; Diana, J.; Horning, A.; Scavia, D. Tackling Wicked Problems through Integrated Assessment: A Guide for Decision-Makers, Project Leaders, and Scientists; University of Michigan: Ann Arbor, MI, USA, 2009. [Google Scholar]
- United Nations Environment Programme (UNEP). Mercury: Time to Act; UNEP: Geneva, Switzerland, 2013. [Google Scholar]
- United Nations Environment Programme (UNEP). Global Mercury Assessment; UNEP: Geneva, Switzerland, 2002. [Google Scholar]
- Watras, C.J.; Back, R.C.; Halvorsen, S.; Hudson, R.J.M.; Morrison, K.A.; Wente, S.P. Bioaccumulation of Hg in pelagic freshwater foot webs. Sci. Total Environ. 1998, 212, 183–208. [Google Scholar] [CrossRef]
- Hall, B.D.; Bodaly, R.A.; Fudge, R.J.P.; Rudd, J.W.M.; Rosenberg, D.M. Food as the dominant pathway of methylmercury uptake by fish. Water. Air. Soil Pollut. 1997, 100, 13–24. [Google Scholar]
- Cabana, G.; Tremblay, A.; Kalff, J.; Rasmussen, J. Pelagic food chain structure in Ontario lakes: A determinant of mercury levels in lake trout (Salvelinus namaycush). Can. J. Fish. Aquat. Sci. 1994, 51, 381–389. [Google Scholar] [CrossRef]
- Pacyna, E.G.; Pacyna, J.M.; Sundseth, K.; Munthe, J.; Kindbom, K.; Wilson, S.; Steenhuisen, F.; Maxson, P. Global emission of mercury to the atmosphere from anthropogenic sources in 2005 and projections to 2020. Atmos. Environ. 2010, 44, 2487–2499. [Google Scholar] [CrossRef]
- Bawa, I. A viewpoint on small-scale gold mining in Ghana: A regulatory perspective on current practices, mercury use and the UNIDO and EU projects. Int. J. Environ. Pollut. 2010, 41, 195–201. [Google Scholar] [CrossRef]
- Ghana Government. Mercury Act. PNDCL 217; Ghana Government: Nairobi, Ghana, 1989.
- Nyame, F.K. Policy challenges on mercury use in Ghana’s artisanal and small-scale mining sector. Int. J. Environ. Pollut. 2010, 41, 202–213. [Google Scholar] [CrossRef]
- Hilson, G.; Pardie, S. Mercury: An agent of poverty in Ghana’s small-scale gold-mining sector? Resour. Policy 2006, 31, 106–116. [Google Scholar] [CrossRef]
- Kessey, K.D.; Arko, B. Small scale gold mining and environmental degradation, in Ghana : Issues of mining policy implementation and challenges. J. Stud. Soc. Sci. 2013, 5, 12–30. [Google Scholar]
- Valdivia, S.M.; Ugaya, C.M.L. Life cycle inventories of gold artisanal and small-scale mining activities in Peru. J. Ind. Ecol. 2011, 15, 922–936. [Google Scholar] [CrossRef]
- U.S. Environmental Protection Agency (EPA). Generic Soil Screening Levels 2011; US EPA: Washington, DC, USA; pp. 1–11.
- Buchman, M.F. NOAA Screening Quick Reference Tables; NOAA: Seattle, WA, USA, 2008; pp. 1–34.
- Canadian Council of Ministers of the Environment. Canadian sediment quality guidelines for the protection of aquatic life—Mercury. In Canadian Environmental Quality Guidelines, 1999; Canadian Council of Ministers of the Environment: Winnipeg, Canada, 1999; pp. 1–5. [Google Scholar]
- Bonzongo, J.J.; Donkor, A.K.; Nartey, V.K.; Lacerda, L.D. Mercury pollution in Ghana: A case study of environmental impacts of artisanal gold mining in Sub-Saharan Africa. In Environmental Geochemistry in Tropical and Subtropical Environments; Drude de Lacerda, L., Santelli, R.E., Duursma, E.K., Abrão, J.J., Eds.; Springer: Heidelberg, Berlin, Germany, 2004; pp. 135–156. [Google Scholar]
- Rajaee, M.; Long, R.N.; Renne, E.P.; Basu, N. Mercury concentrations and spatial distribution in a Ghanaian small-scale gold mining community. Int. J. Environ. Res. Public Health 2015. under review. [Google Scholar]
- Codex Alimentarius Commission (CODEX). Working Document for Information and Use in Discussions Related to Contaminants and Toxins in the GSCTFF; CODEX: Rome, Italy, 2011. [Google Scholar]
- U.S. Environmental Protection Agency (EPA). Freshwater Sediment Screening Benchmarks; US EPA: Washington, DC, USA, 2006; pp. 1–6.
- Boamponsem, L.K.; Adam, J.I.; Dampare, S.B.; Owusu-Ansah, F.; Addae, G. Heavy metals level in streams of Tarkwa gold mining area of Ghana. J. Chem. Pharm. Res. 2010, 2, 504–527. [Google Scholar]
- Donkor, A.K.; Bonzongo, J.C.; Nartey, V.K.; Adotey, D.K. Mercury in different environmental compartments of the Pra River Basin, Ghana. Sci. Total Environ. 2006, 368, 164–176. [Google Scholar] [CrossRef] [PubMed]
- Nartey, V.; Klake, R.K.; Hayford, E.; Doamekpor, L.K.; Appoh, R. Assessment of mercury pollution in rivers and streams around artisanal gold mining areas of the Birim North District of Ghana. J. Environ. Prot. (Irvine,. Calif). 2011, 2, 1227–1239. [Google Scholar]
- World Health Organization (WHO). Guidelines for Drinking-Water Quality: Fourth Edition; WHO: Geneva, Switzerland, 2011. [Google Scholar]
- Froese, R.; Pauly, D. FishBase. Available online: www.fishbase.org (accessed on 1 July 2014).
- Oppong, S.O.B.; Voegborlo, R.B.; Agorku, S.E.; Adimado, A.A. Total mercury in fish, sediments and soil from the River Pra Basin, southwestern Ghana. Bull. Environ. Contam. Toxicol. 2010, 85, 324–329. [Google Scholar] [CrossRef] [PubMed]
- Laar, C.; Fianko, J.R.; Akiti, T.T.; Osae, S.; Brimah, A.K. Determination of heavy metals in the black-chin tilapia from the Sakumo Lagoon, Ghana. Res. J. Environ. Earth Sci. 2011, 3, 8–13. [Google Scholar]
- U.S. Environmental Protection Agency (EPA). Water Quality Criterion for the Protection of Human Health: Methylmercury; US EPA: Washington, DC, USA, 2001.
- Food and Agriculture Organization (FAO); World Health Organization (WHO). Codex General Standard for Contaminants and Toxins in Food and Feed; WHO: Geneva, Switzerland, 2013; pp. 1–48. [Google Scholar]
- Spry, D.J.; Wiener, J.G. Metal bioavailability and toxicity to fish in low-alkalinity lakes: A critical review. Environ. Pollut. 1991, 71, 243–304. [Google Scholar] [CrossRef]
- Agorku, E.S.; Voegborlo, R.B.; Adimado, A.A. Total mercury levels in nine species of freshwater fish from two hydroelectric reservoirs and a crater lake in Ghana. Environ. Monit. Assess. 2009, 153, 383–389. [Google Scholar] [CrossRef] [PubMed]
- Dwumah-Akoanah, S. Studies on Levels of Mercury, Cadmium and Zinc in Fish and Sediments from River Offin in Ghana; Kwame Nkrumah University of Science and Technology: Kumasi, Ghana, 2008. [Google Scholar]
- Voegborlo, R.B.; Akagi, H. Determination of mercury in fish by cold vapour atomic absorption spectrometry using an automatic mercury analyzer. Food Chem. 2007, 100, 853–858. [Google Scholar] [CrossRef]
- Voegborlo, R.B.; Adimado, A.A.; Ephraim, J.H. Total mercury distribution in different tissues of frigate tuna (Auxis thazard thazard) from the Atlantic Coastal Waters of Ghana, Gulf of Guinea. Environ. Monit. Assess. 2007, 132, 503–508. [Google Scholar] [CrossRef] [PubMed]
- Joiris, C.R.; Azokwu, M.I.; Otchere, F.A.; Ali, I.B. Mercury in the bivalve Anadara (Senilia) senilis from Ghana and Nigeria. Sci. Total Environ. 1998, 224, 181–188. [Google Scholar] [CrossRef]
- Joiris, C.R.; Holsbeek, L.; Otchere, F.A. Mercury in the bivalves Crassostrea tulipa and Perna perna from Ghana. Mar. Pollut. Bull. 2000, 40, 457–460. [Google Scholar] [CrossRef]
- Ghana Environmental Protection Agency (EPA). Environmental Quality Standards—Mining Sector; Ghana Environmental Protection Agency: Nairobi, Ghana, 2010.
- Kusimi, J.M.; Kusimi, B.A. The hydrochemistry of water resources in selected mining communities in Tarkwa. J. Geochemical Explor. 2012, 112, 252–261. [Google Scholar] [CrossRef]
- Obiri, S. Determination of heavy metals in water from boreholes in Dumasi in the Wassa West District of western region of Republic of Ghana. Environ. Monit. Assess. 2007, 130, 455–463. [Google Scholar] [CrossRef] [PubMed]
- Depew, D.C.; Basu, N.; Burgess, N.M.; Campbell, L.M.; Devlin, E.W.; Drevnick, P.E.; Hammerschmidt, C.R.; Murphy, C.A.; Sandheinrich, M.B.; Wiener, J.G. Toxicity of dietary methylmercury to fish: Derivation of ecologically meaningful threshold concentrations. Environ. Toxicol. Chem. 2012, 31, 1536–1547. [Google Scholar] [CrossRef] [PubMed] [Green Version]
- Scheuhammer, A.M.; Basu, N.; Evers, D.C.; Heinz, G.; Sandheinrich, M.B.; Bank, M. Ecotoxicology of mercury in fish and wildlife: Recent advances. In Mercury in the Environment: Pattern and Process; Bank, M., Ed.; University of California Press: Berkley, CA, USA, 2012; pp. 223–238. [Google Scholar]
- Mergler, D.; Anderson, H.A.; Chan, L.H.M.; Mahaffey, K.R.; Murray, M.; Sakamoto, M.; Stern, A.H. Methylmercury exposure and health effects in humans: A worldwide concern. Ambio 2007, 36, 3–11. [Google Scholar] [CrossRef]
- Sandheinrich, M.B.; Wiener, J.G. Methylmercury in freshwater fish—Recent advances in assessing toxicity of environmentally relevant exposures. In Environmental Contaminants in Biota: Interpreting Tissue Concentrations; Beyer, W.N., Meador, J.R., Eds.; CRC Press/Taylor and Francis: Boca Raton, FL, USA, 2011; pp. 169–190. [Google Scholar]
- Black, F.J.; Bokhutlo, T.; Somoxa, A.; Maethamako, M.; Modisaemang, O.; Kemosedile, T.; Cobb-Adams, C.; Mosepele, K.; Chimbari, M. The tropical African mercury anomaly: Lower than expected mercury concentrations in fish and human hair. Sci. Total Environ. 2011, 409, 1967–1975. [Google Scholar] [CrossRef] [PubMed]
- Hanna, D.E.L.; Solomon, C.; Poste, A.E.; Buck, D.G.; Chapman, L.J. A review of mercury concentrations in freshwater fishes of Africa: Patterns and predictors. Environ. Toxicol. Chem. 2014, 34, 215–223. [Google Scholar] [CrossRef] [PubMed]
- Adriano, D.C. Trace Elements in Terrestrial Environments: Biogeochemistry, Bioavailability, and Risks of Metals, 2nd ed.; Springer: New York, NY, USA, 2001. [Google Scholar]
- Cobbina, S.J.; Dagben, J.Z.; Obiri, S.; Tom-Dery, D. Assessment of non-cancerous health risk from exposure to Hg, As and Cd by resident children and adults in Nangodi in the Upper East Region, Ghana. Water Qual. Expo. Heal. 2011, 3, 225–323. [Google Scholar] [CrossRef]
- Asante, K.A.; Agusa, T.; Subramanian, A.; Ansa-Asare, O.D.; Biney, C.A.; Tanabe, S.; Ansong, K. Contamination status of arsenic and other trace elements in drinking water and residents from Tarkwa, a historic mining township in Ghana. Chemosphere 2007, 66, 1513–1522. [Google Scholar] [CrossRef] [PubMed]
- Golow, A.A.; Adzei, E.A. Mercury in surface soil and cassava crop near an alluvial goldmine at Dunkwa-on-Offin, Ghana. Bull. Environ. Contam. Toxicol. 2002, 69, 228–235. [Google Scholar] [CrossRef] [PubMed]
- Cobbina, S.J.; Nkuah, D.; Tom-dery, D.; Obiri, S. Non-cancer risk assessment from exposure to mercury (Hg), cadmium (Cd), arsenic (As), copper (Cu) and lead (Pb) in boreholes and surface water in Tinga, in the Bole-Bamboi District, Ghana. Glob. J. Toxicol. Signal Transduct. 2013, 1, 49–56. [Google Scholar] [CrossRef]
- Amonoo-Neizer, E.H.; Nyamah, D.; Bakiamoh, S.B. Mercury and arsenic pollution in soil and biological samples around the mining town of Obuasi, Ghana. Water Air Soil Pollut. 1996, 91, 363–373. [Google Scholar] [CrossRef]
- Ahiamadjie, H.; Serfor-Armah, Y.; Tandoh, J.B.; Gyampo, O.; Ofosu, F.G.; Dampare, S.B.; Adotey, D.K.; Nyarko, B.J.B. Evaluation of trace elements contents in staple foodstuffs from the gold mining areas in southwestern part of Ghana using neutron activation analysis. J. Radioanal. Nucl. Chem. 2011, 288, 653–661. [Google Scholar] [CrossRef]
- Essumang, D.K.; Dodoo, D.K.; Obiri, S.; Yaney, J.Y. Arsenic, cadmium, and mercury in cocoyam (Xanthosoma sagititolium) and watercocoyam (Colocasia esculenta) in Tarkwa a mining community. Bull. Environ. Contam. Toxicol. 2007, 79, 377–379. [Google Scholar] [CrossRef] [PubMed]
- Golow, A.A.; Laryea, J.N. Levels of iron, silver, zinc, and lead in oranges and avocados from two gold-rich towns compared with levels in an adjacent gold-deficient town. Bull. Environ. Contam. Toxicol. 1994, 53, 332–336. [Google Scholar] [CrossRef] [PubMed]
- Bannerman, W.; Potin-Gautier, M.; Amouroux, D.; Tellier, S.; Rambaud, A.; Babut, M.; Adimado, A.A.; Beinhoff, C. Mercury and arsenic in the gold mining regions of the Ankobra River basin in Ghana. J. Phys. IV Fr. 2003, 107, 107–110. [Google Scholar] [CrossRef]
- Donkor, A.K.; Bonzongo, J.; Nartey, V.; Adotey, D.K. Heavy metals in sediments of the gold mining impacted Pra River Basin, Ghana, West Africa. Soil Sediment Contam. 2005, 14, 479–503. [Google Scholar]
- Adokoh, C.K.; Obodai, E.A.; Essumang, D.K.; Serfor-Armah, Y.; Nyarko, B.J.B.; Asabere-Ameyaw, A. Statistical evaluation of environmental contamination, distribution and source assessment of heavy metals (aluminum, arsenic, cadmium, and mercury) in some lagoons and an estuary along the coastal belt of Ghana. Arch. Environ. Contam. Toxicol. 2011, 61, 389–400. [Google Scholar] [CrossRef] [PubMed]
- Adomako, D.; Nyarko, B.J.B.; Dampare, S.B.; Serfor-Armah, Y.; Osae, S.; Fianko, J.R.; Akaho, E.H.K. Determination of toxic elements in waters and sediments from River Subin in the Ashanti Region of Ghana. Environ. Monit. Assess. 2008, 141, 165–175. [Google Scholar] [CrossRef] [PubMed]
- Acheampong, M.A.; Paksirajan, K.; Lens, P.N.L. Assessment of the effluent quality from a gold mining industry in Ghana. Environ. Sci. Pollut. Res. Int. 2013, 20, 3799–3811. [Google Scholar] [CrossRef] [PubMed]
- Kusimi, J.M. Assessing land use and land cover change in the Wassa West District of Ghana using remote sensing. GeoJournal 2008, 71, 249–259. [Google Scholar] [CrossRef]
- Boadu, M.; Osae, E.K.; Golow, A.A.; Nyarko, B.J.B. Determination of arsenic in some water bodies, untreated ore and tailing samples at Konongo in the Ashanti region of Ghana and its surrounding towns and villages by instrumental neutron activation analysis. J. Radioanal. Nucl. Chem. 2001, 249, 581–585. [Google Scholar]
- Asante, K.A.; Agusa, T.; Biney, C.A.; Agyekum, W.A.; Bello, M.; Otsuka, M.; Itai, T.; Takahashi, S.; Tanabe, S. Multi-trace element levels and arsenic speciation in urine of e-waste recycling workers from Agbogbloshie, Accra in Ghana. Sci. Total Environ. 2012, 424, 63–73. [Google Scholar] [CrossRef] [PubMed]
- Armah, F.A.; Obiri, S.; Yawson, D.O.; Onumah, E.E.; Yengoh, G.T.; Afrifa, E.K.A.; Odoi, J.O. Anthropogenic sources and environmentally relevant concentrations of heavy metals in surface water of a mining district in Ghana: A multivariate statistical approach. J. Environ. Sci. Health. A. Tox. Hazard. Subst. Environ. Eng. 2010, 45, 1804–1813. [Google Scholar] [CrossRef] [PubMed]
- Foli, G.; Nude, P.M. Concentration levels of some inorganic contaminants in streams and sediments in areas of pyrometallurgical and hydrometallurgical activities at the Obuasi gold mine, Ghana. Environ. Earth Sci. 2011, 65, 753–763. [Google Scholar] [CrossRef]
- Järup, L. Hazards of heavy metal contamination. Br. Med. Bull. 2003, 68, 167–182. [Google Scholar] [CrossRef] [PubMed]
- Dooyema, C.A.; Neri, A.; Lo, Y.; Durant, J.; Dargan, P.I.; Swarthout, T.; Biya, O.; Gidado, S.O.; Haladu, S.; Sani-Gwarzo, N.; Nguku, P.M.; Akpan, H.; Idris, S.; Bashir, A.M.; Brown, M.J. Outbreak of fatal childhood lead poisoning related to artisanal gold mining in northwestern Nigeria, 2010. Environ. Health Perspect. 2012, 120, 601–607. [Google Scholar] [CrossRef] [PubMed] [Green Version]
- Adomako, E.E.; Deacon, C.; Meharg, A.A. Variations in concentrations of arsenic and other potentially toxic elements in mine and paddy soils and irrigation waters from Southern Ghana. Water Qual. Expo. Heal. 2010, 2, 115–124. [Google Scholar] [CrossRef]
- Das, S.; Jean, J.; Kar, S. Effect of arsenic contamination on bacterial and fungal biomass and enzyme activities in tropical arsenic-contaminated soils. Biol. Fert. Soil. 2013, 49, 757–765. [Google Scholar] [CrossRef]
- Cao, H.; Luan, Z.; Wang, J.; Zhang, X. Potential ecological risk of cadmium, lead and arsenic in agricultural black soil in Jilin Province, China. Stoch. Environ. Res. Risk Assess. 2009, 23, 57–64. [Google Scholar] [CrossRef]
- Korte, F. Ecotoxicology of cadmium. Regul. Toxicol. Pharmacol. 1982, 2, 184–208. [Google Scholar] [CrossRef]
- De Vries, W.; Römkens, P.F.A.M.; Schütze, G. Critical soil concentrations of cadmium, lead, and mercury in view of health effects on humans and animals. Rev. Environ. Contam. Toxicol. 2007, 191, 91–130. [Google Scholar] [PubMed]
- International Agency for Research on Cancer. Agents Classified by the IARC Monographs; WHO: Geneva, Switzerland, 2012. [Google Scholar]
- Rodríguez-Barranco, M.; Lacasaña, M.; Aguilar-Garduño, C.; Alguacil, J.; Gil, F.; González-Alzaga, B.; Rojas-García, A. Association of arsenic, cadmium and manganese exposure with neurodevelopment and behavioural disorders in children: A systematic review and meta-analysis. Sci. Total Environ. 2013, 454–455, 562–577. [Google Scholar] [CrossRef] [PubMed]
- WHO. Environmental Health Criteria 224: Arsenic and Arsenic Compounds; WHO: Geneva, Switzerland, 2001. [Google Scholar]
- Duker, A.A.; Carranza, E.J.; Hale, M. Spatial dependency of Buruli ulcer prevalence on arsenic-enriched domains in Amansie West District, Ghana: Implications for arsenic mediation in Mycobacterium ulcerans infection. Int. J. Health Geogr. 2004, 3. [Google Scholar] [CrossRef] [PubMed] [Green Version]
- Duker, A.A.; Stein, A.; Hale, M. A statistical model for spatial patterns of Buruli ulcer in the Amansie West district, Ghana. Int. J. Appl. Earth Obs. Geoinf. 2006, 8, 126–136. [Google Scholar] [CrossRef]
- Cecil, K.M.; Brubaker, C.J.; Adler, C.M.; Dietrich, K.N.; Altaye, M.; Egelhoff, J.C.; Wessel, S.; Elangovan, I.; Hornung, R.; Jarvis, K.; Lanphear, B.P. Decreased brain volume in adults with childhood lead exposure. PLoS Med. 2008, 5, 741–749. [Google Scholar] [CrossRef] [PubMed]
- Hilson, G.M. Child labour in African artisanal mining communities: Experiences from Northern Ghana. Dev. Change 2010, 41, 445–473. [Google Scholar] [CrossRef]
- Ghana Government. Minerals and Mining Act 703; Ghana Government: Nairobi, Ghana, 2006.
- Ministry of Water Resources, Works and Housing, Government of Ghana. National Water Policy; Government of Ghana: Accra, Ghana, 2007.
- United Nations Environment Programme (UNEP). Africa: Atlas of Our Changing Environment; United Nations Environment Programme: Nairobi, Ghana, 2008; Vol. 46. [Google Scholar]
- Long, R.; Renne, E.; Robins, T.; Wilson, M.; Pelig-ba, K.; Rajaee, M.; Yee, A.; Koomson, E.; Sharp, C.; Lu, J.; Basu, N. Water values in a Ghanaian small-scale gold mining community. Hum. Organ. 2013, 72, 199–210. [Google Scholar] [CrossRef]
- Armah, F.A.; Luginaah, I.; Ason, B. Water quality index in the tarkwa gold mining area in Ghana. J. Transdiscipl. Environ. Stud. 2012, 11, 2–15. [Google Scholar]
- Rossiter, H.M.A.; Owusu, P.A.; Awuah, E.; Macdonald, A.M.; Schäfer, A.I. Chemical drinking water quality in Ghana: Water costs and scope for advanced treatment. Sci. Total Environ. 2010, 408, 2378–2386. [Google Scholar] [CrossRef] [PubMed]
- Aryee, B.N.; Ntibery, B.K.; Atorkui, E. Trends in the small-scale mining of precious minerals in Ghana: A perspective on its environmental impact. J. Clean. Prod. 2003, 11, 131–140. [Google Scholar] [CrossRef]
- Garvin, T.; McGee, T.K.; Smoyer-Tomic, K.E.; Aubynn, E.A. Community-company relations in gold mining in Ghana. J. Environ. Manage. 2009, 90, 571–586. [Google Scholar] [CrossRef] [PubMed]
- Burton, G.A.; Johnston, E.L. Assessing contaminated sediments in the context of multiple stressors. Environ. Toxicol. Chem. 2010, 29, 2625–2643. [Google Scholar] [CrossRef] [PubMed]
- Lu, K.; Long, R.; Rajaee, M.; Basu, N.; Akizili, J.; Robins, T.; Yee, A.; Sharp, C.; Renne, E.; Wilson, M.L. An Exploratory Study on the Effects of Social Resources, Environmental Exposures and Malaria Prevention Practices on the Prevalence of Malaria-Like Symptoms in a Gold-Mining Community in Ghana; University of Michigan: Ann Arbor, MI, USA, 2011. [Google Scholar]
- Schueler, V.; Kuemmerle, T.; Schröder, H. Impacts of surface gold mining on land use systems in Western Ghana. Ambio 2011, 40, 528–539. [Google Scholar] [CrossRef] [PubMed]
- Tom-Dery, D.; Dagben, Z.J.; Cobbina, S.J. Effect of illegal small-scale mining operations on vegetation cover of arid Northern Ghana. Res. J. Environ. Earth Sci. 2012, 4, 674–679. [Google Scholar]
- Hentschel, T.; Hruschka, F.; Priester, M. Global Report on Artisanal & Small-Scale Mining; International Institute for Environment and Development: London, UK, 2002; Vol. 70. [Google Scholar]
- United Nations Environment Programme (UNEP). Artic Monitoring and Assessment Technical Background Report to the Global Atmospheric Mercury Assessment; UNEP: Geneva, Switzerland, 2008. [Google Scholar]
- United Nations Millenium Development Goals (UN MDG). Millenium Development Goals Indicators. Available online: http://mdgs.un.org/unsd/mdg/SeriesDetail.aspx?srid=567&crid=288 (accessed on 10 January 2015).
- Akabzaa, T.; Darimani, A. Impact of Mining Sector Investment in Ghana: A Study of the Tarkwa Mining Region. A Draft Report Prepared for SAPRI; SAPRI: Colombo, Sri Lanka, 2001. [Google Scholar]
- Hilson, G. Small-scale mining in Africa: Tackling pressing environmental problems with improved strategy. J. Environ. Dev. 2002, 11, 149–174. [Google Scholar] [CrossRef]
- World Bank. Staff appraisal report, Republic of Ghana, mining sector development and environmental project (World Bank Report No. 13881-GH); World Bank: New York, NY, USA, 1995. [Google Scholar]
- Kibadi, K.; Panda, M.; Tamfum, J.-J.M.; Fraga, A.G.; Longatto Filho, A.; Anyo, G.; Pedrosa, J.; Nakazawa, Y.; Suykerbuyk, P.; Meyers, W.M.; Portaels, F. New foci of Buruli ulcer, Angola and Democratic Republic of Congo. Emerg. Infect. Dis. 2008, 14, 1790–1792. [Google Scholar] [CrossRef] [PubMed]
- Merritt, R.W.; Benbow, M.E.; Small, P.L.C. Unraveling an emerging disease associated with disturbed aquatic environments : The case of Buruli ulcer. Front. Ecoloy Environ. 2005, 3, 323–331. [Google Scholar] [CrossRef]
- Newport, J.; Shorthouse, D.J.; Manning, A.D. The effects of light and noise from urban development on biodiversity: Implications for protected areas in Australia. Ecol. Manag. Restor. 2014, 15, 204–214. [Google Scholar] [CrossRef]
- Brittingham, M.C.; Maloney, K.O.; Harper, D.D.; Bowen, Z.H. Ecological risks of shale oil and gas development to wildlife, aquatic resources and their habitats. Environ. Sci. Technol. 2014, 48, 11034–11047. [Google Scholar] [CrossRef] [PubMed]
- Collinge, S.K. Ecology of Fragmented Landscapes; Johns Hopkins University Press: Baltimore, MD, USA, 2009. [Google Scholar]
- Ghana Environmental Protection Agency (EPA). National Greenhouse Gas Inventory Report for 1990–2006. Volume 1: Synthesis Report; Ghana EPA: Accra, Ghana, 2011; Vol. 1.
- Okoh, G.; Hilson, G.M. Poverty and livelihood diversification: Exploring the linkages between smallholder farming and artisanal mining in rural Ghana. J. Int. Dev. 2011, 23, 1100–1114. [Google Scholar] [CrossRef]
- Banchirigah, S.M.; Hilson, G.M. De-agrarianization, re-agrarianization and local economic development: Re-orientating livelihoods in African artisanal mining communities. Policy Sci. 2009, 43, 157–180. [Google Scholar] [CrossRef]
- Armah, F.A.; Odoi, J.O.; Yengoh, G.T.; Obiri, S.; Yawson, D.O.; Afrifa, E.K.A. Food security and climate change in drought-sensitive savanna zones of Ghana. Mitig. Adapt. Strateg. Glob. Chang. 2010, 16, 291–306. [Google Scholar] [CrossRef]
- Hayford, E.K.; Amin, A.; Osae, E.K.; Kutu, J. Impact of gold mining on soil and some staple foods collected from selected mining communities in and around Tarkwa-Prestea Area. West African J. Appl. Ecol. 2008, 14, 1–12. [Google Scholar] [CrossRef]
- Basu, A.; Phipps, S.; Long, R.; Basu, N. Applying the Delphi technique to evaluate response options to small-scale gold mining in Ghana. Int. J. Environ. Res. Public Health 2015. under review. [Google Scholar]
© 2015 by the authors; licensee MDPI, Basel, Switzerland. This article is an open access article distributed under the terms and conditions of the Creative Commons Attribution license (http://creativecommons.org/licenses/by/4.0/).
Share and Cite
Rajaee, M.; Obiri, S.; Green, A.; Long, R.; Cobbina, S.J.; Nartey, V.; Buck, D.; Antwi, E.; Basu, N. Integrated Assessment of Artisanal and Small-Scale Gold Mining in Ghana—Part 2: Natural Sciences Review. Int. J. Environ. Res. Public Health 2015, 12, 8971-9011. https://doi.org/10.3390/ijerph120808971
Rajaee M, Obiri S, Green A, Long R, Cobbina SJ, Nartey V, Buck D, Antwi E, Basu N. Integrated Assessment of Artisanal and Small-Scale Gold Mining in Ghana—Part 2: Natural Sciences Review. International Journal of Environmental Research and Public Health. 2015; 12(8):8971-9011. https://doi.org/10.3390/ijerph120808971
Chicago/Turabian StyleRajaee, Mozhgon, Samuel Obiri, Allyson Green, Rachel Long, Samuel J. Cobbina, Vincent Nartey, David Buck, Edward Antwi, and Niladri Basu. 2015. "Integrated Assessment of Artisanal and Small-Scale Gold Mining in Ghana—Part 2: Natural Sciences Review" International Journal of Environmental Research and Public Health 12, no. 8: 8971-9011. https://doi.org/10.3390/ijerph120808971