
Assessments of Drought Impacts on Vegetation in China with the Optimal Time Scales of the Climatic Drought Index

 ,
,
Abstract
:1. Introduction
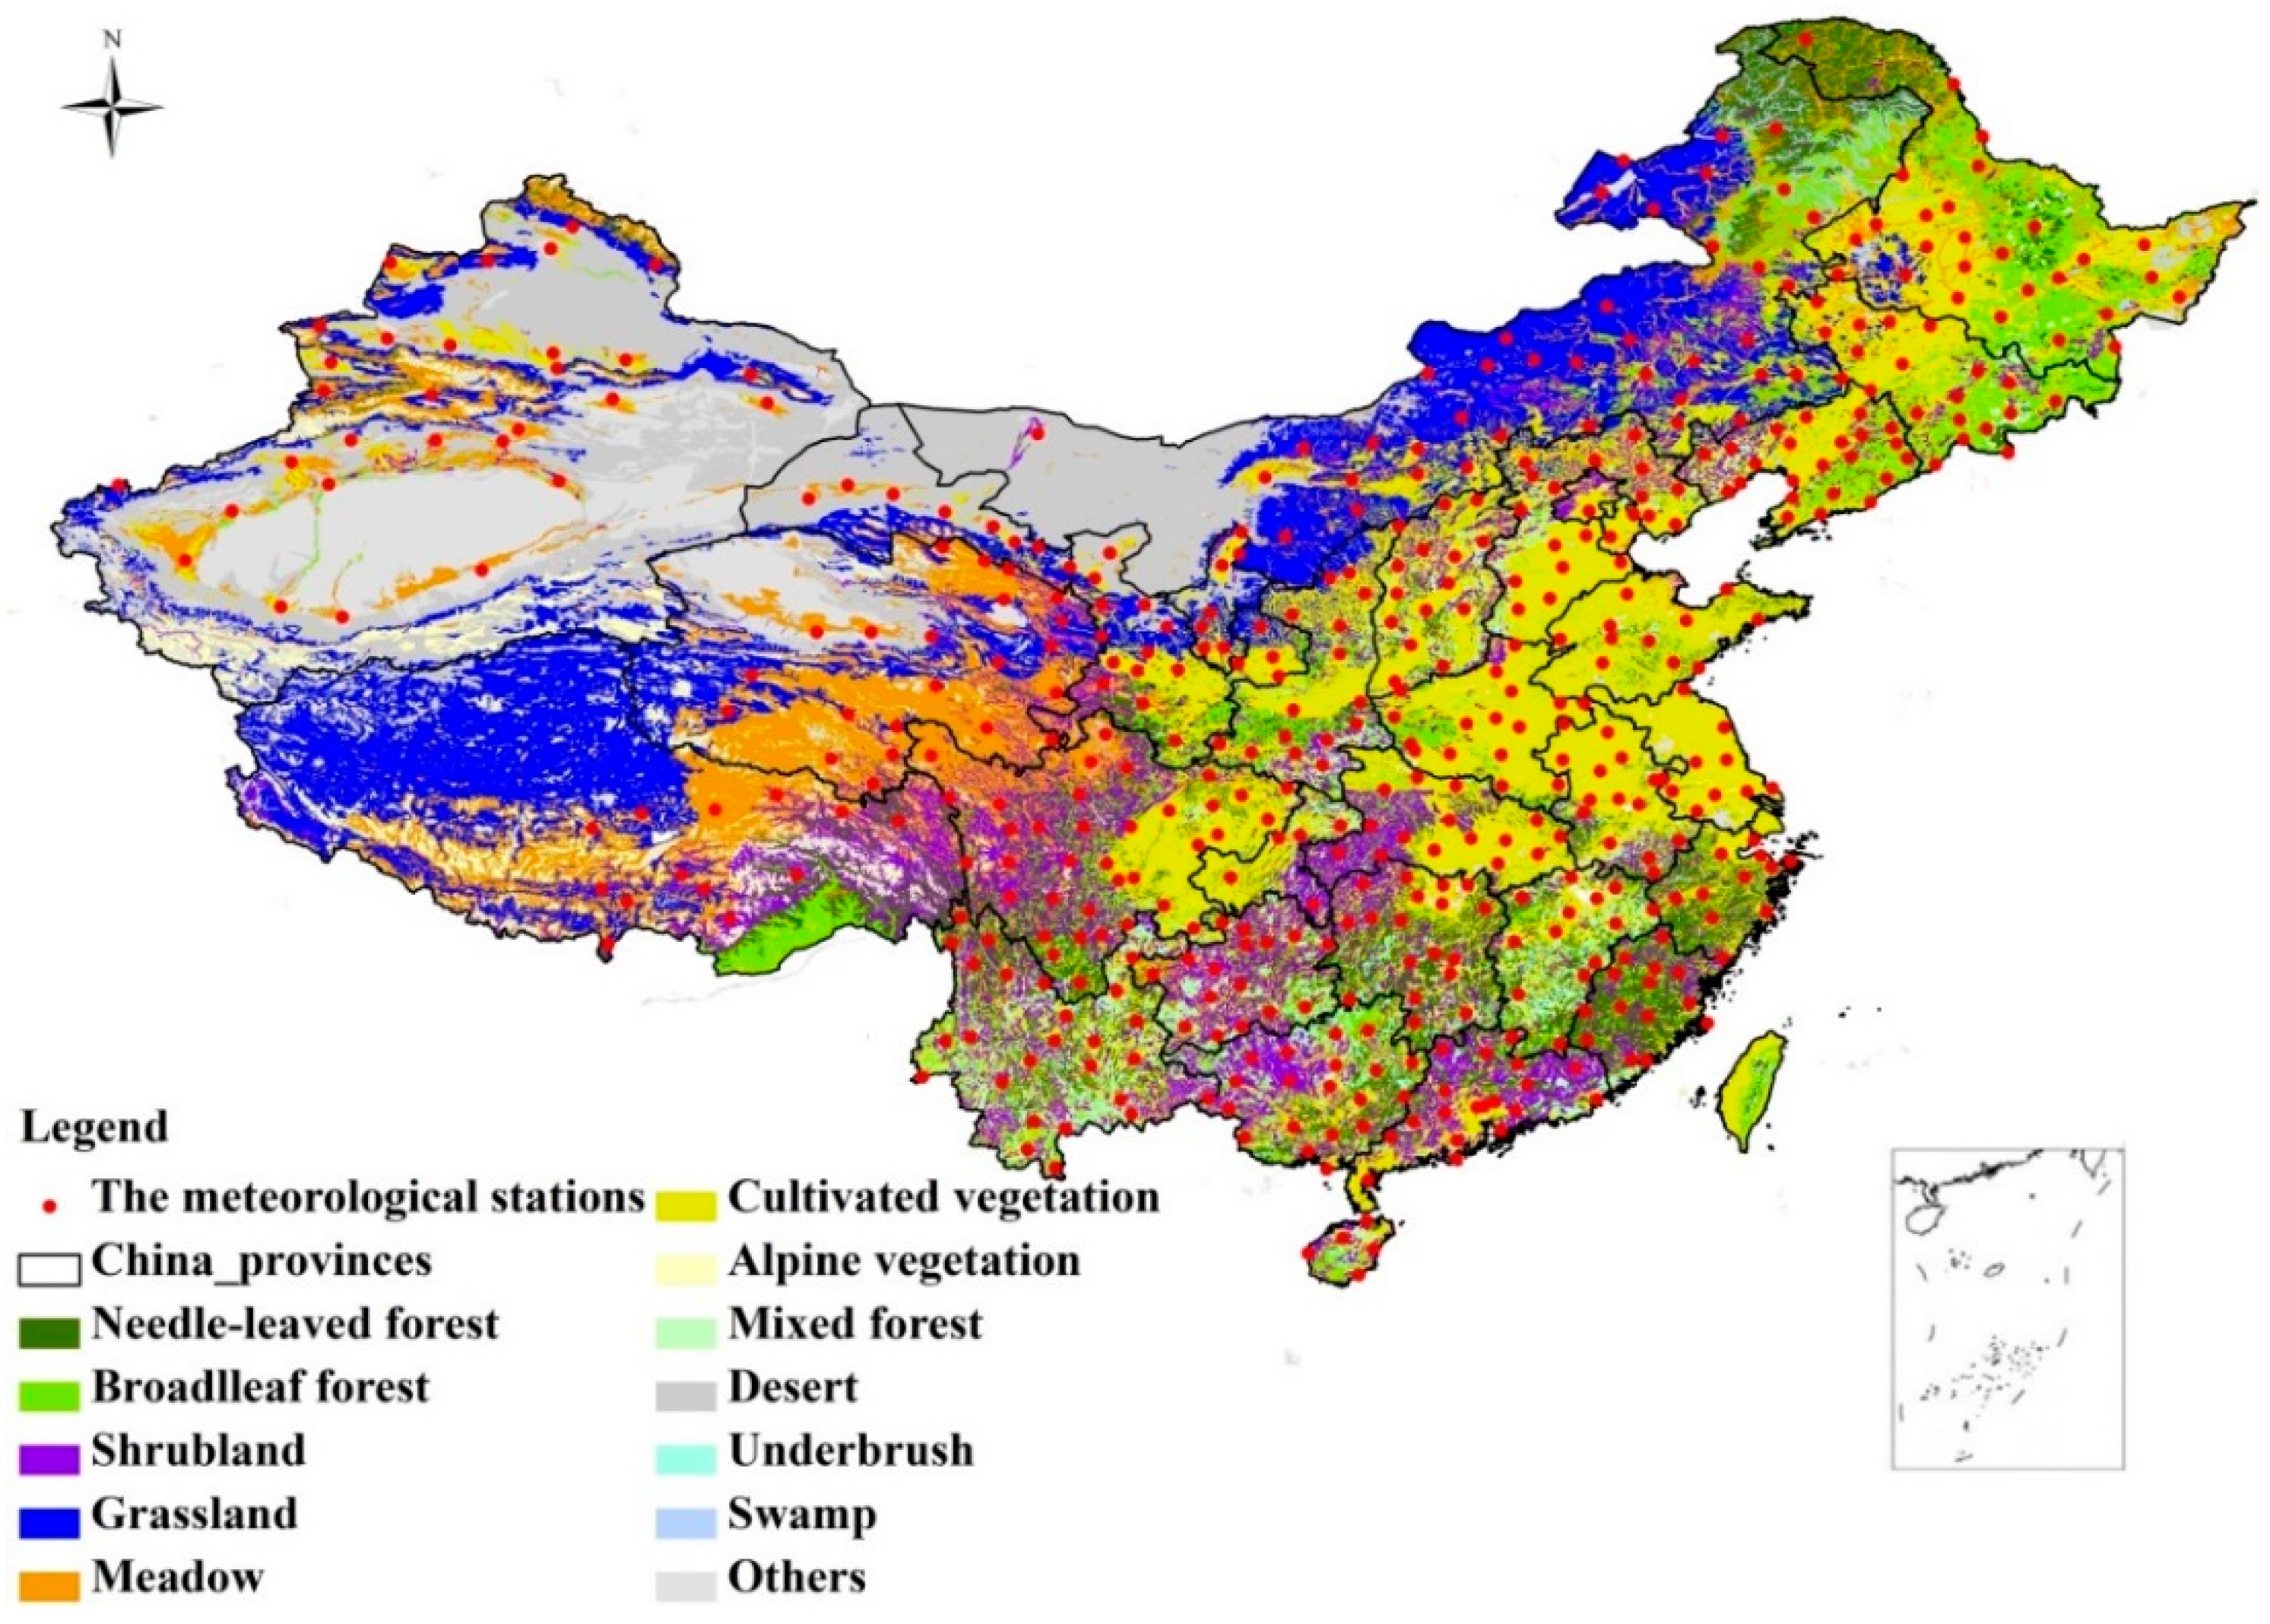
2. Data and Methods
2.1. Climatic Data and Multi-Scalar SPEI Drought Indicator

| SPEI | Drought Category | Probability |
|---|---|---|
| ≥2.00 | Extreme wet | 0.02 |
| [1.50, 2.00) | Severe wet | 0.06 |
| [1.00, 1.50) | Moderate wet | 0.10 |
| (−1.00, 1.00) | Normal | 0.65 |
| (−1.50, −1.00] | Moderate drought | 0.10 |
| (−2.00, −1.50] | Severe drought | 0.05 |
| ≤−2.00 | Extreme drought | 0.02 |

2.2. Remote Sensing Data
2.3. Drought Assessment Index
2.4. Statistical Methods
3. Results
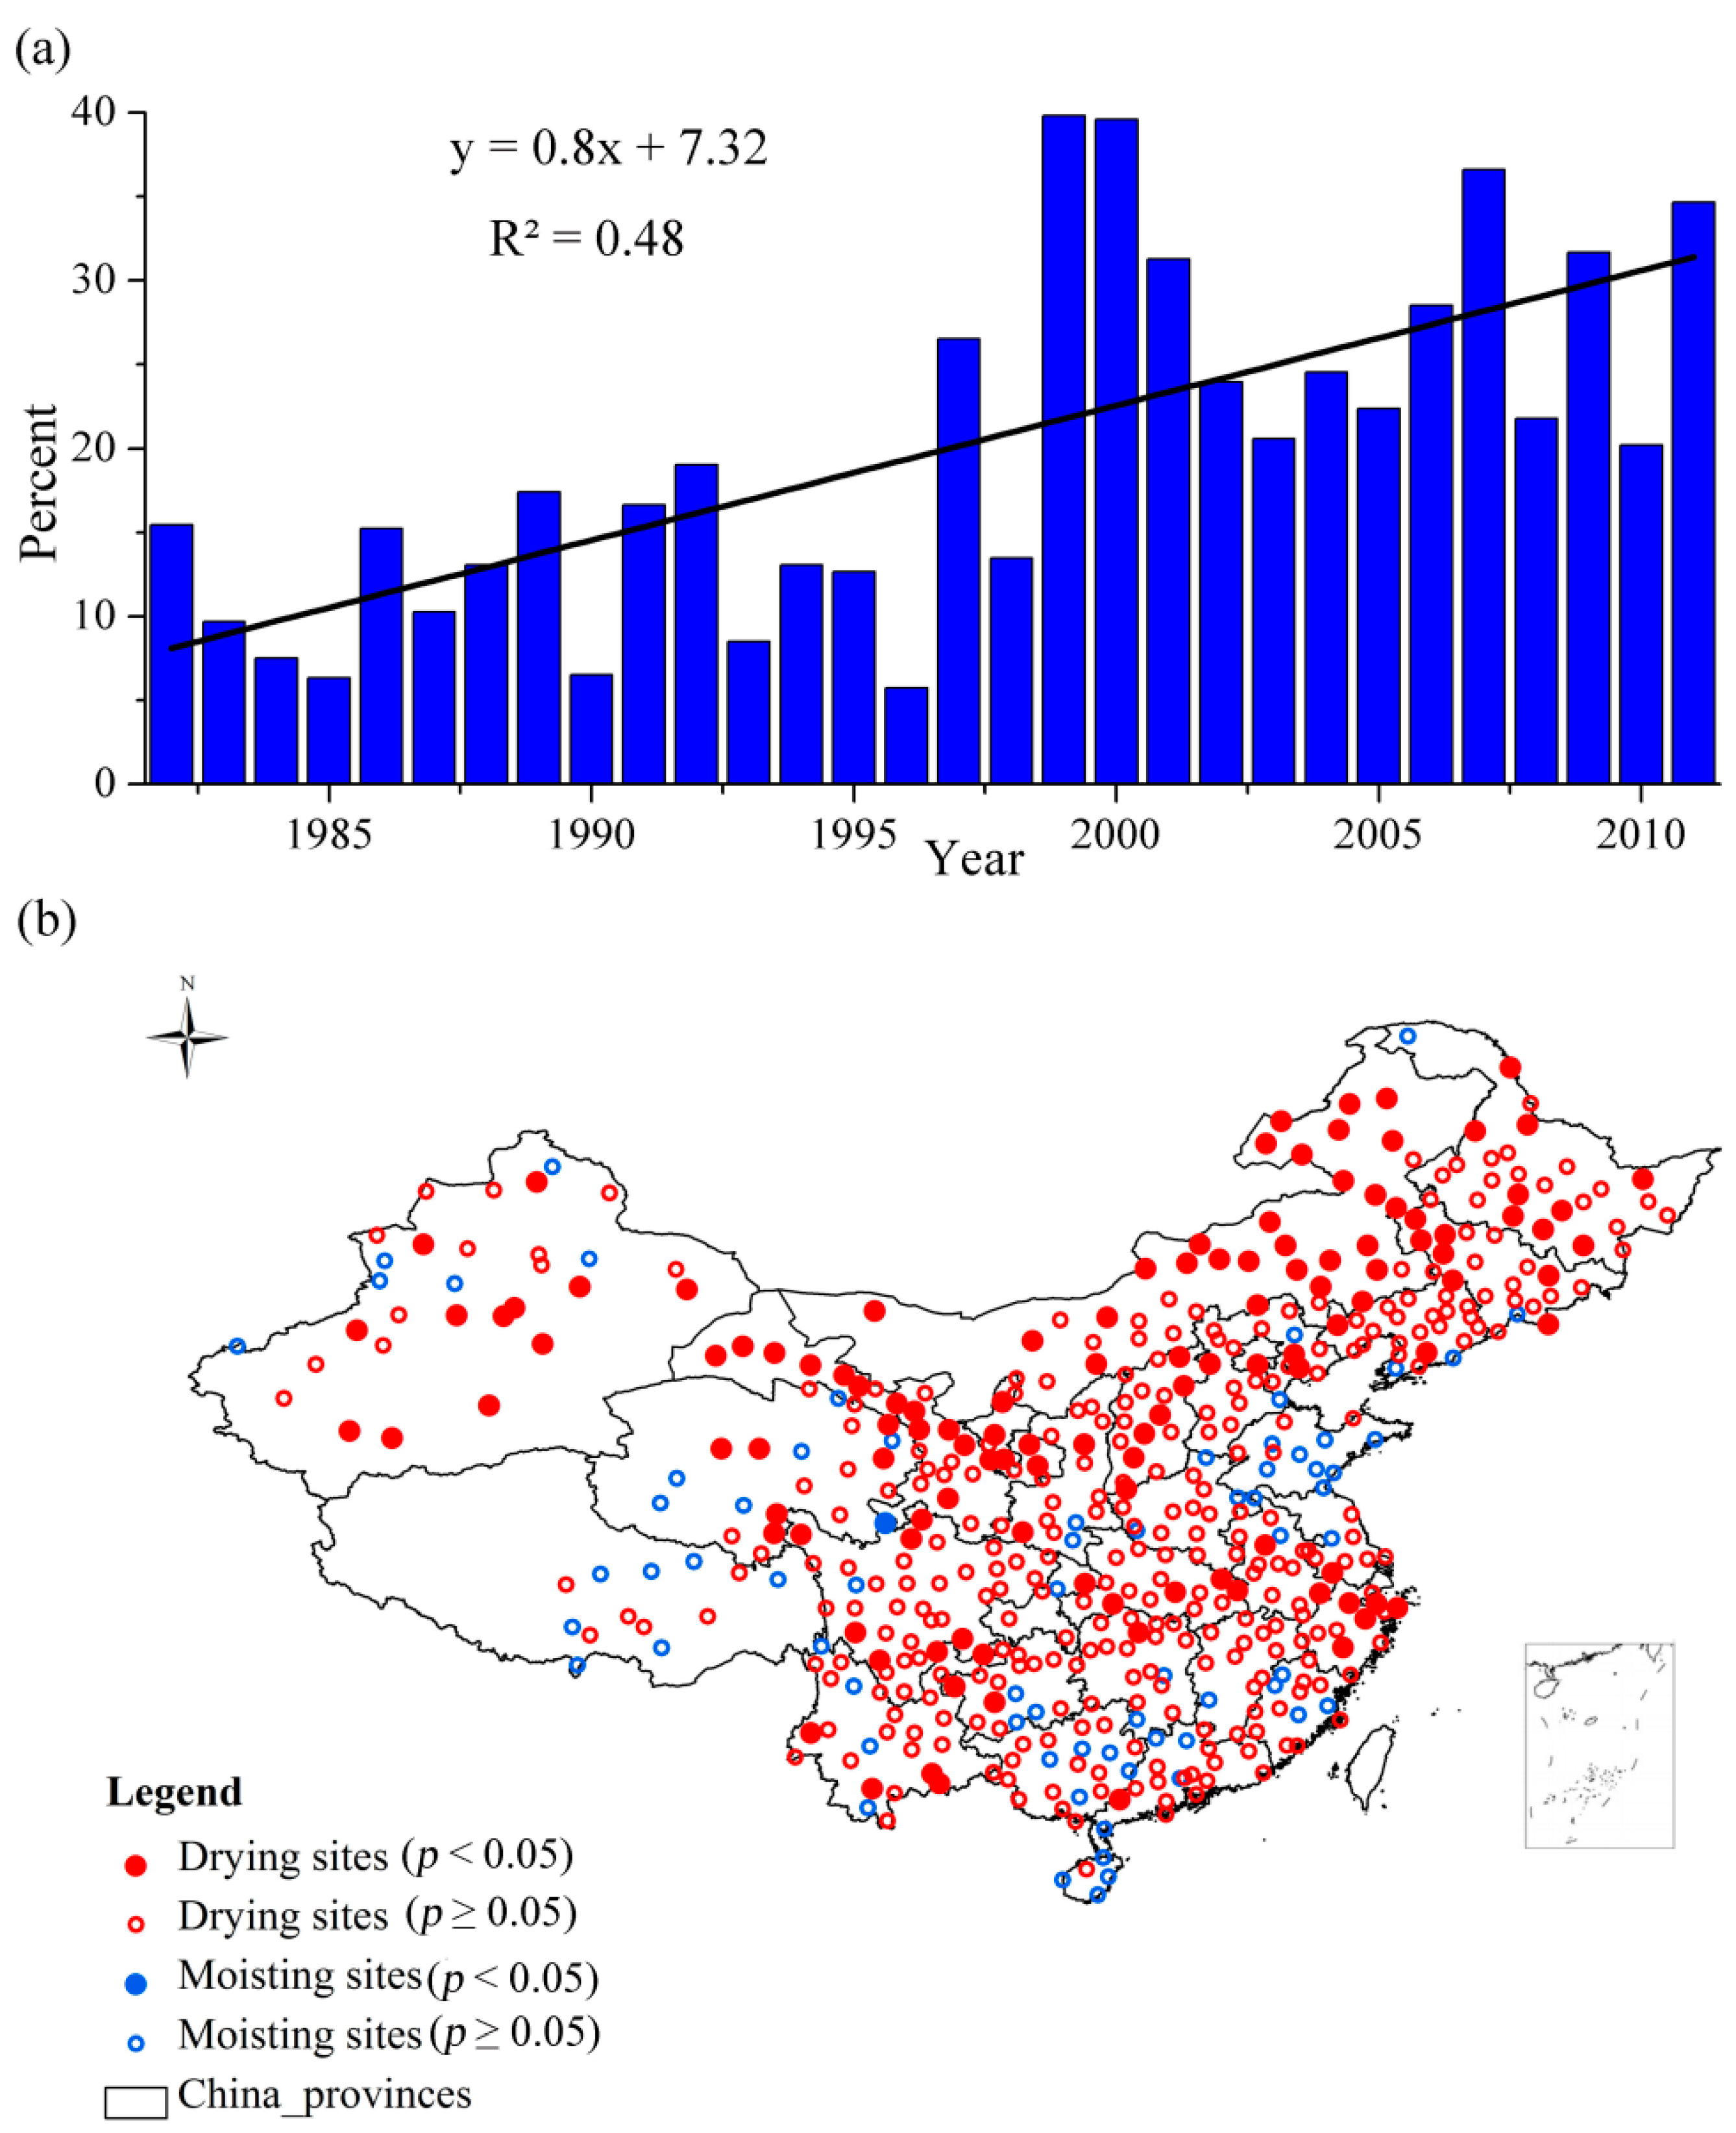
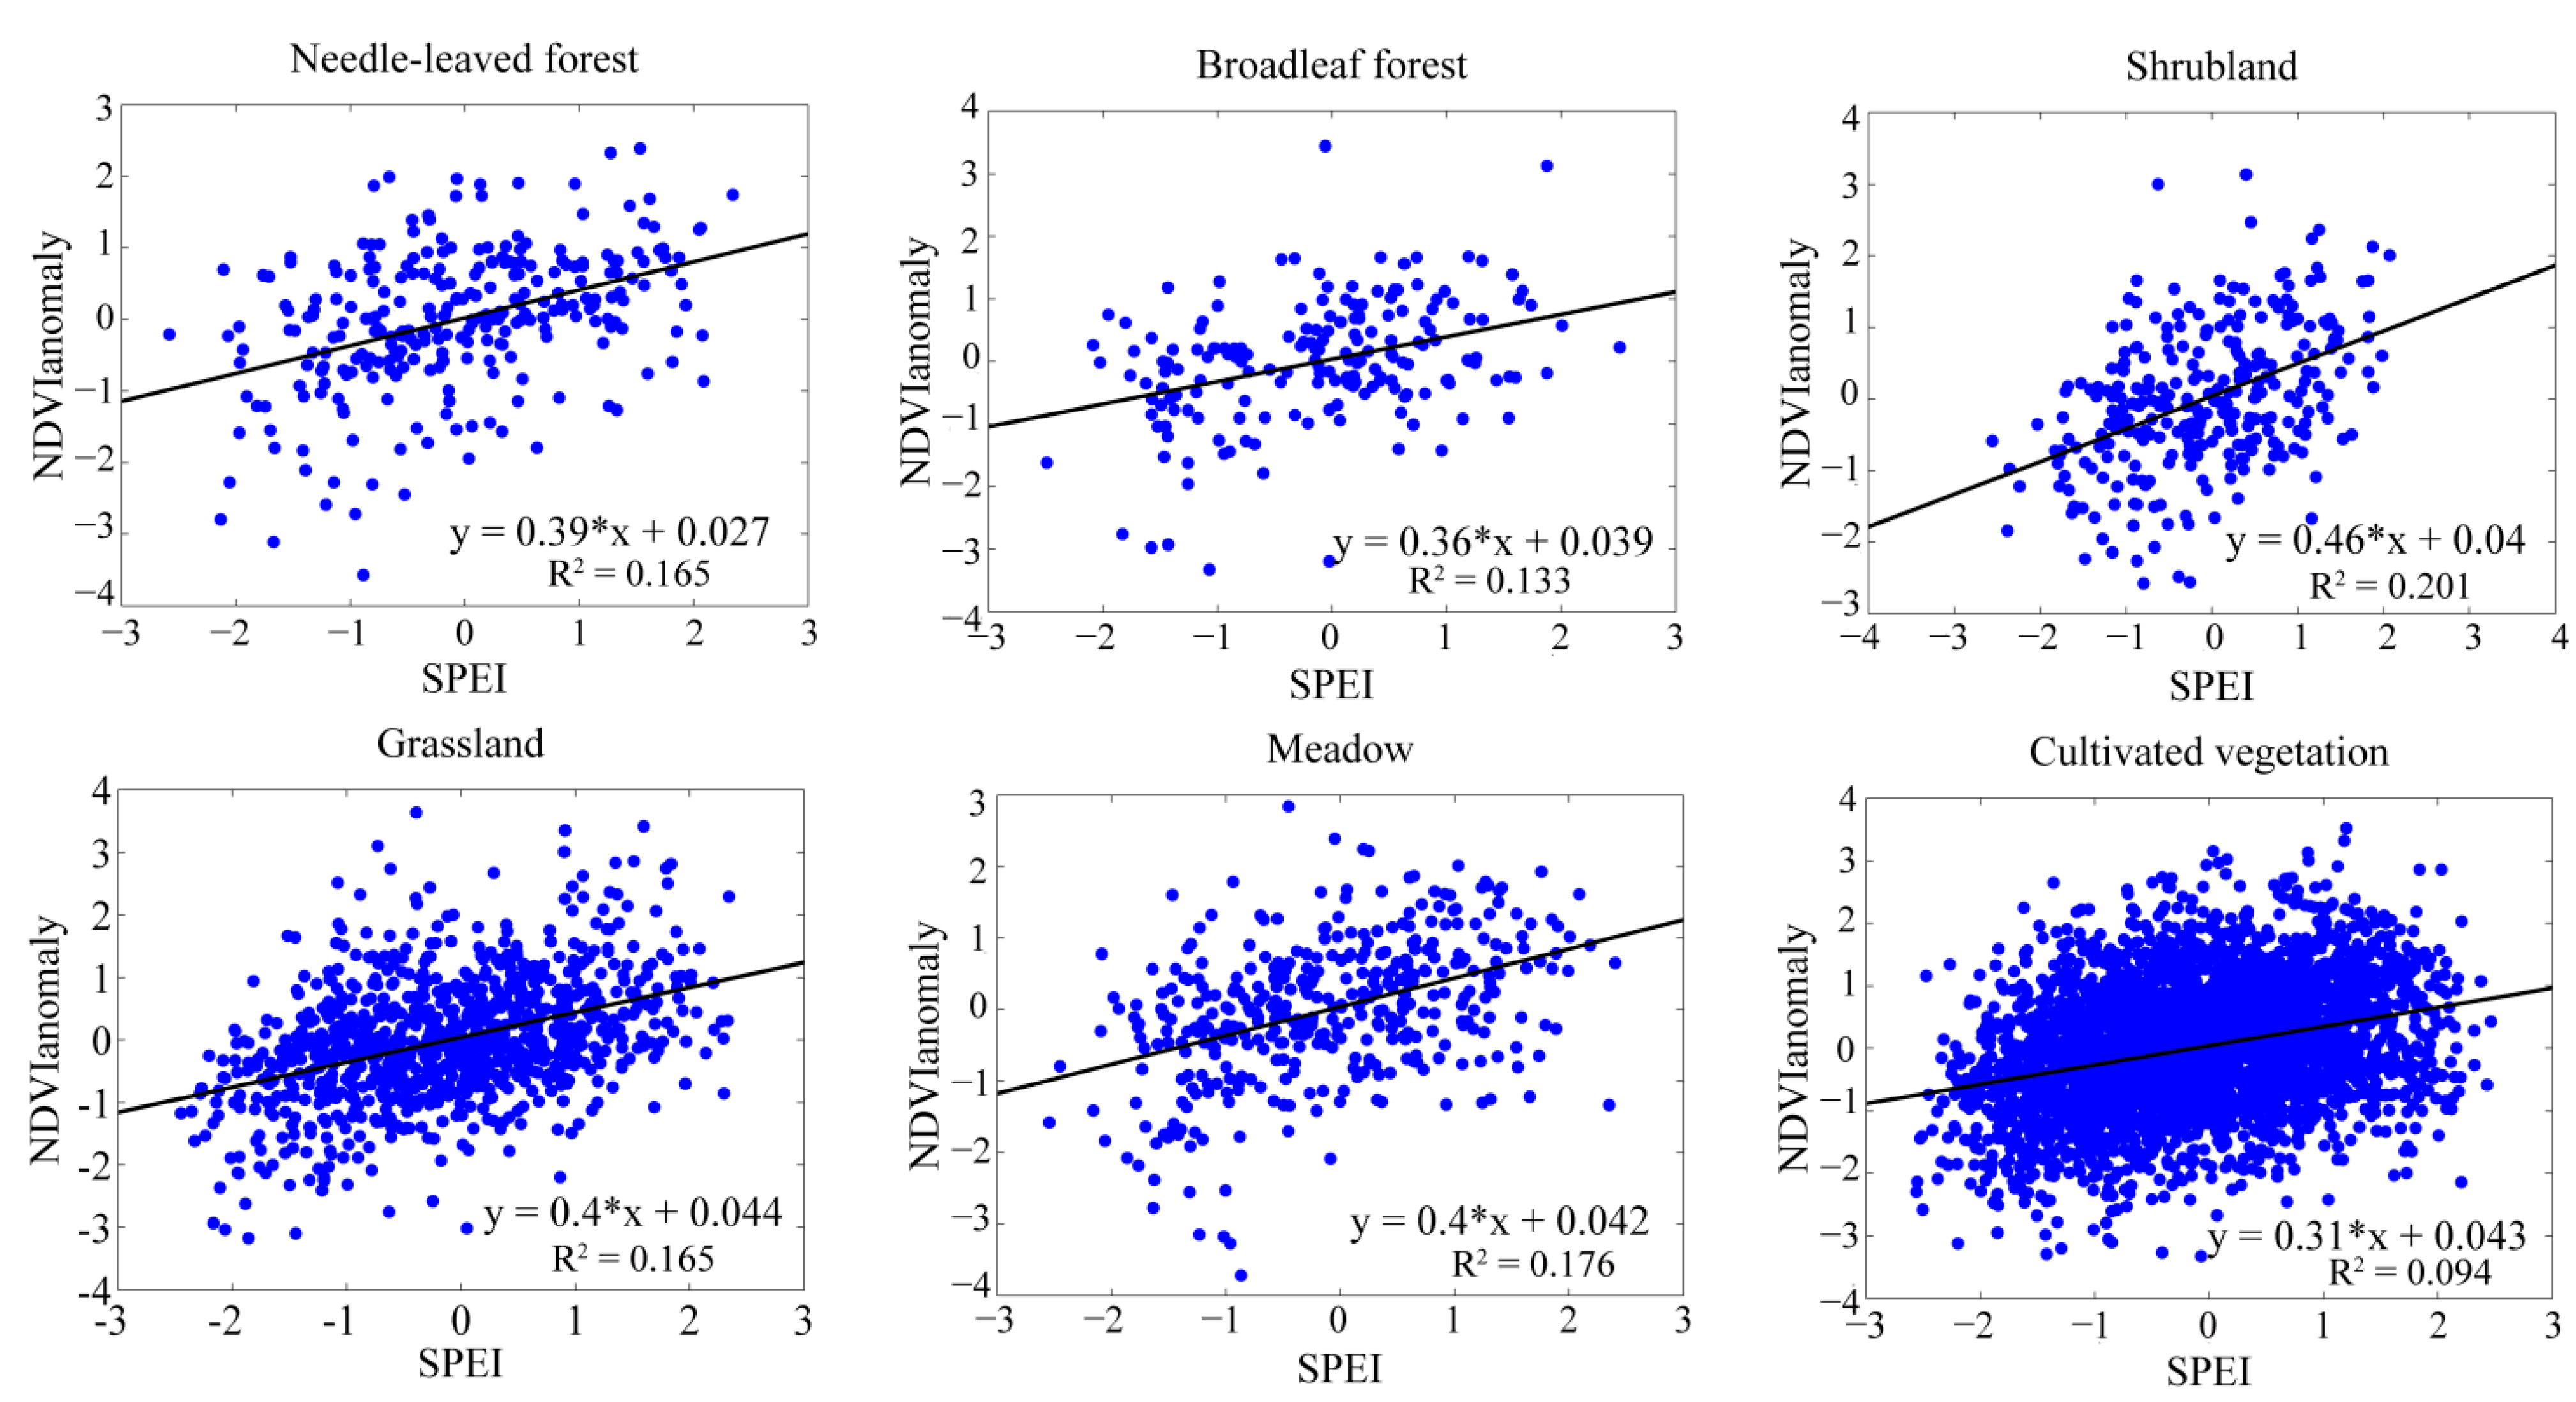
3.1. Drought Derived from the SPEI-12

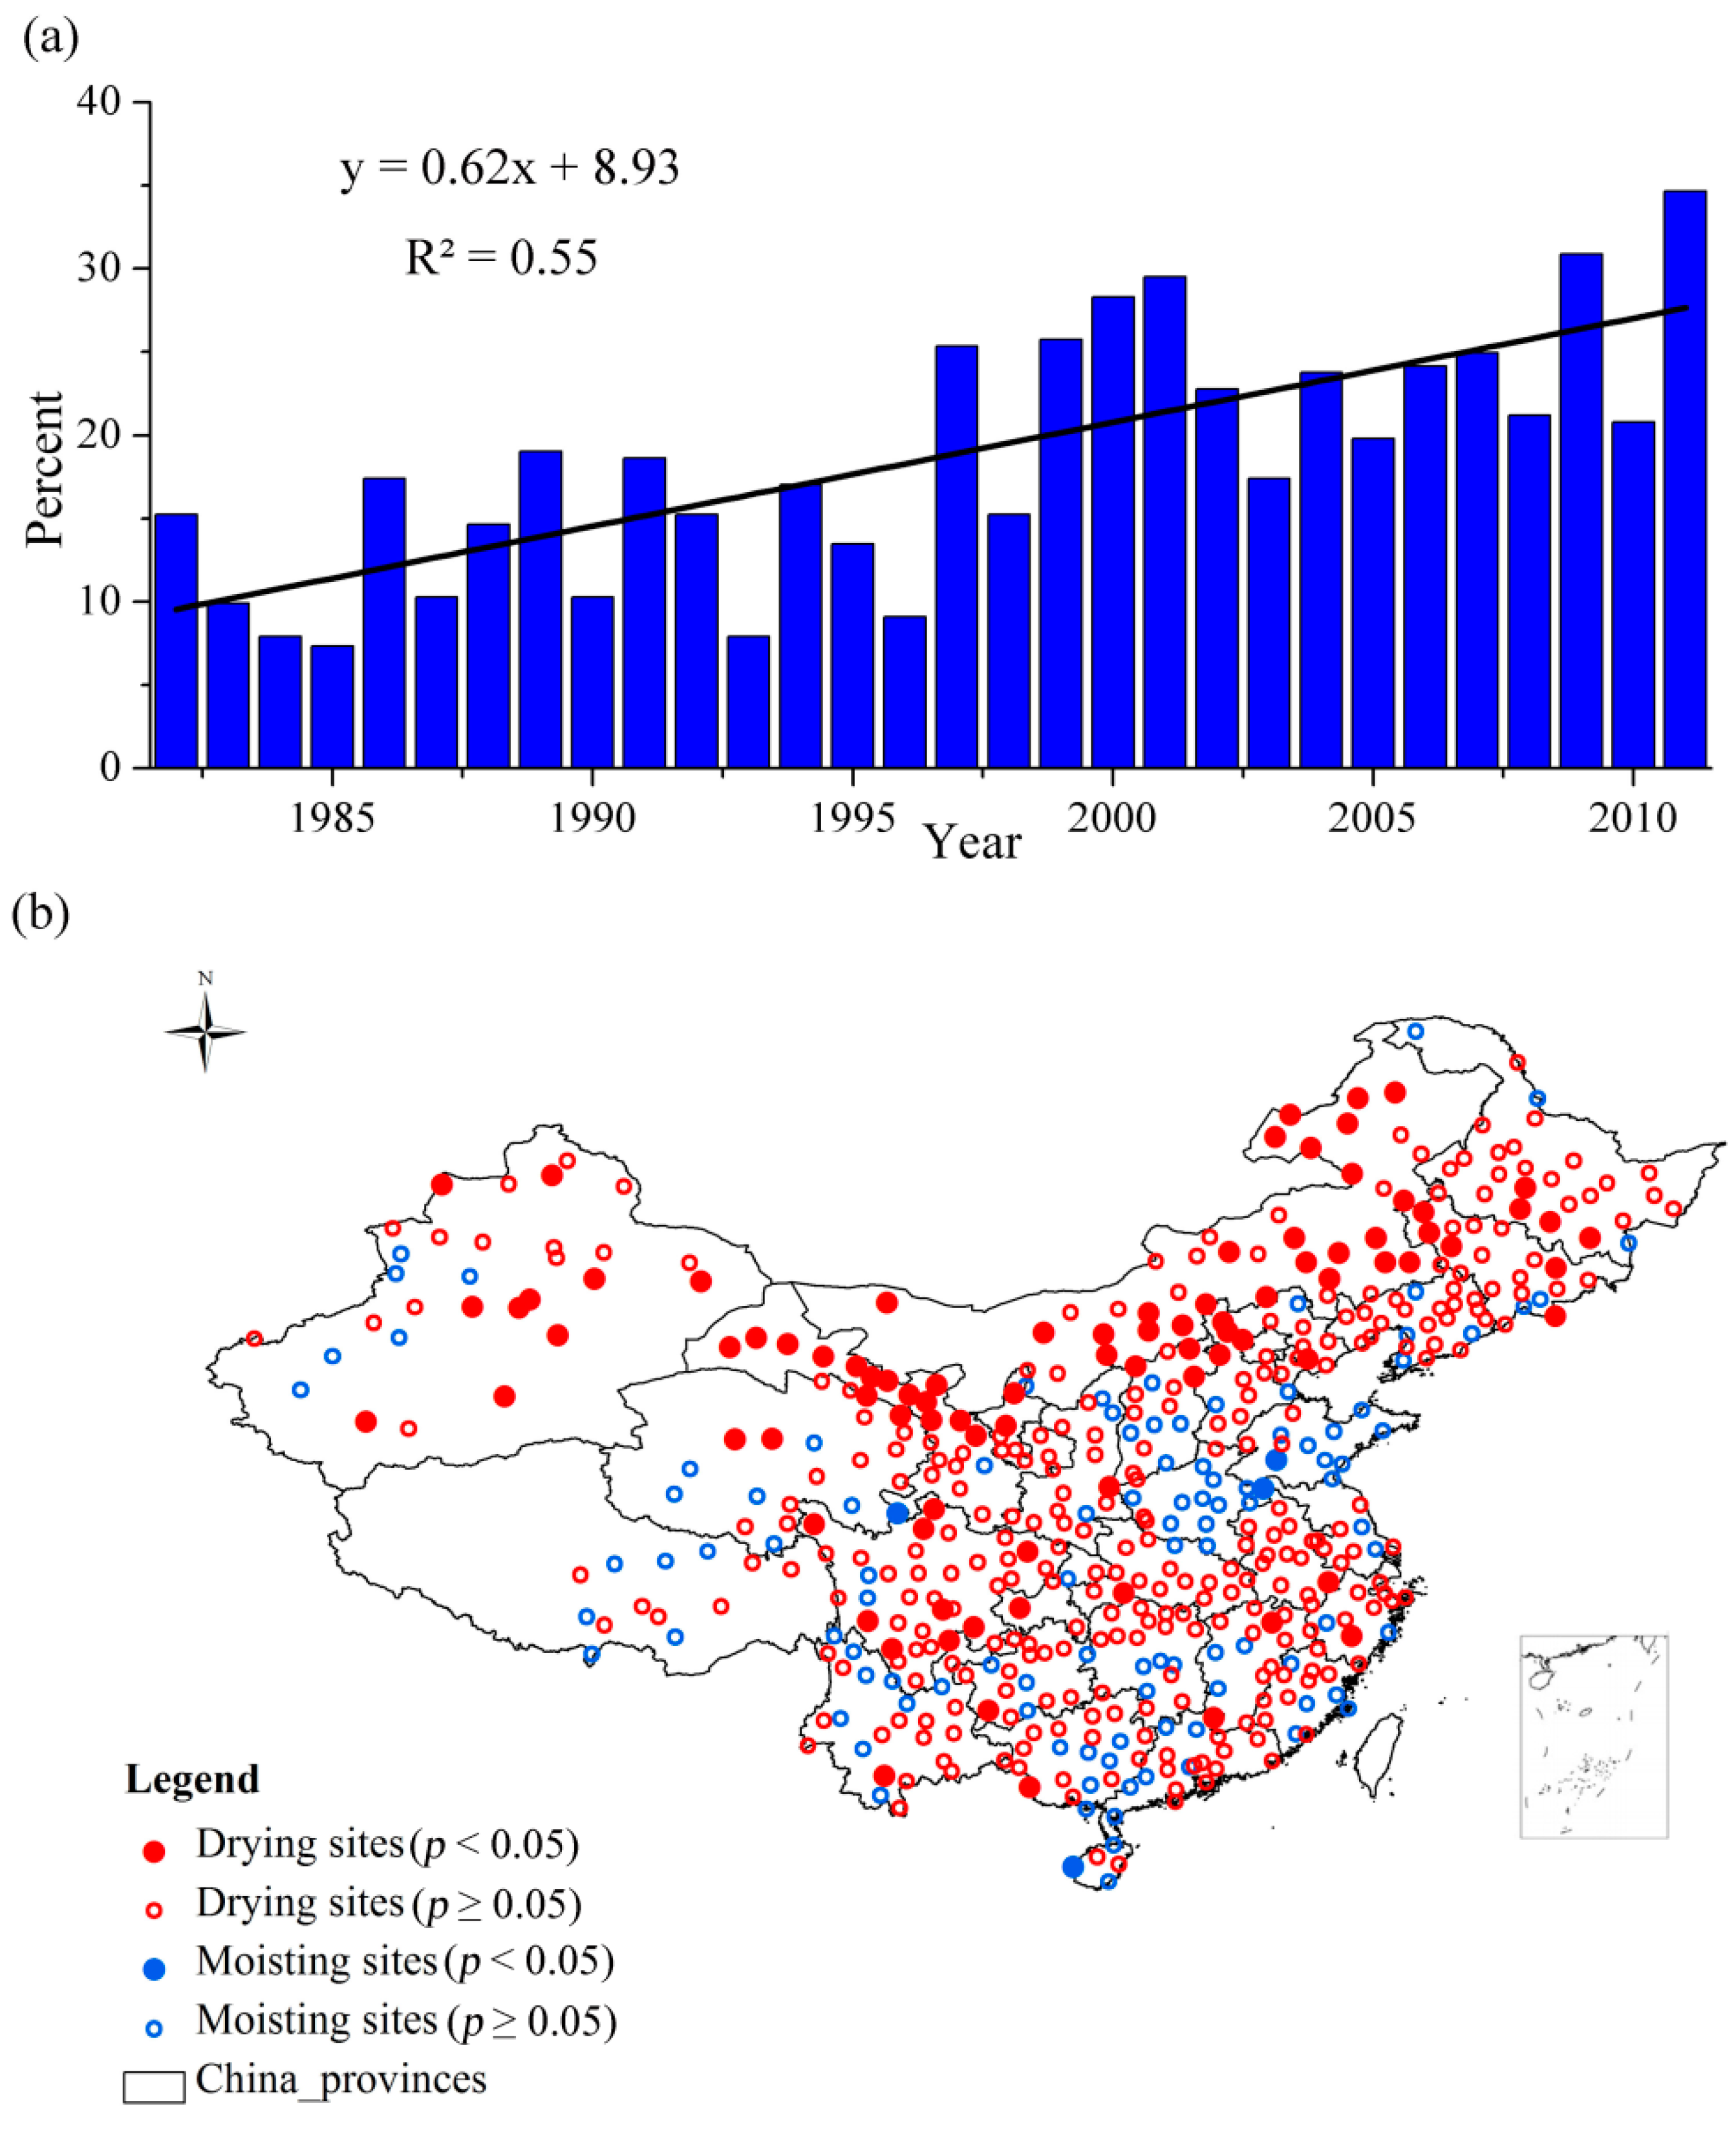
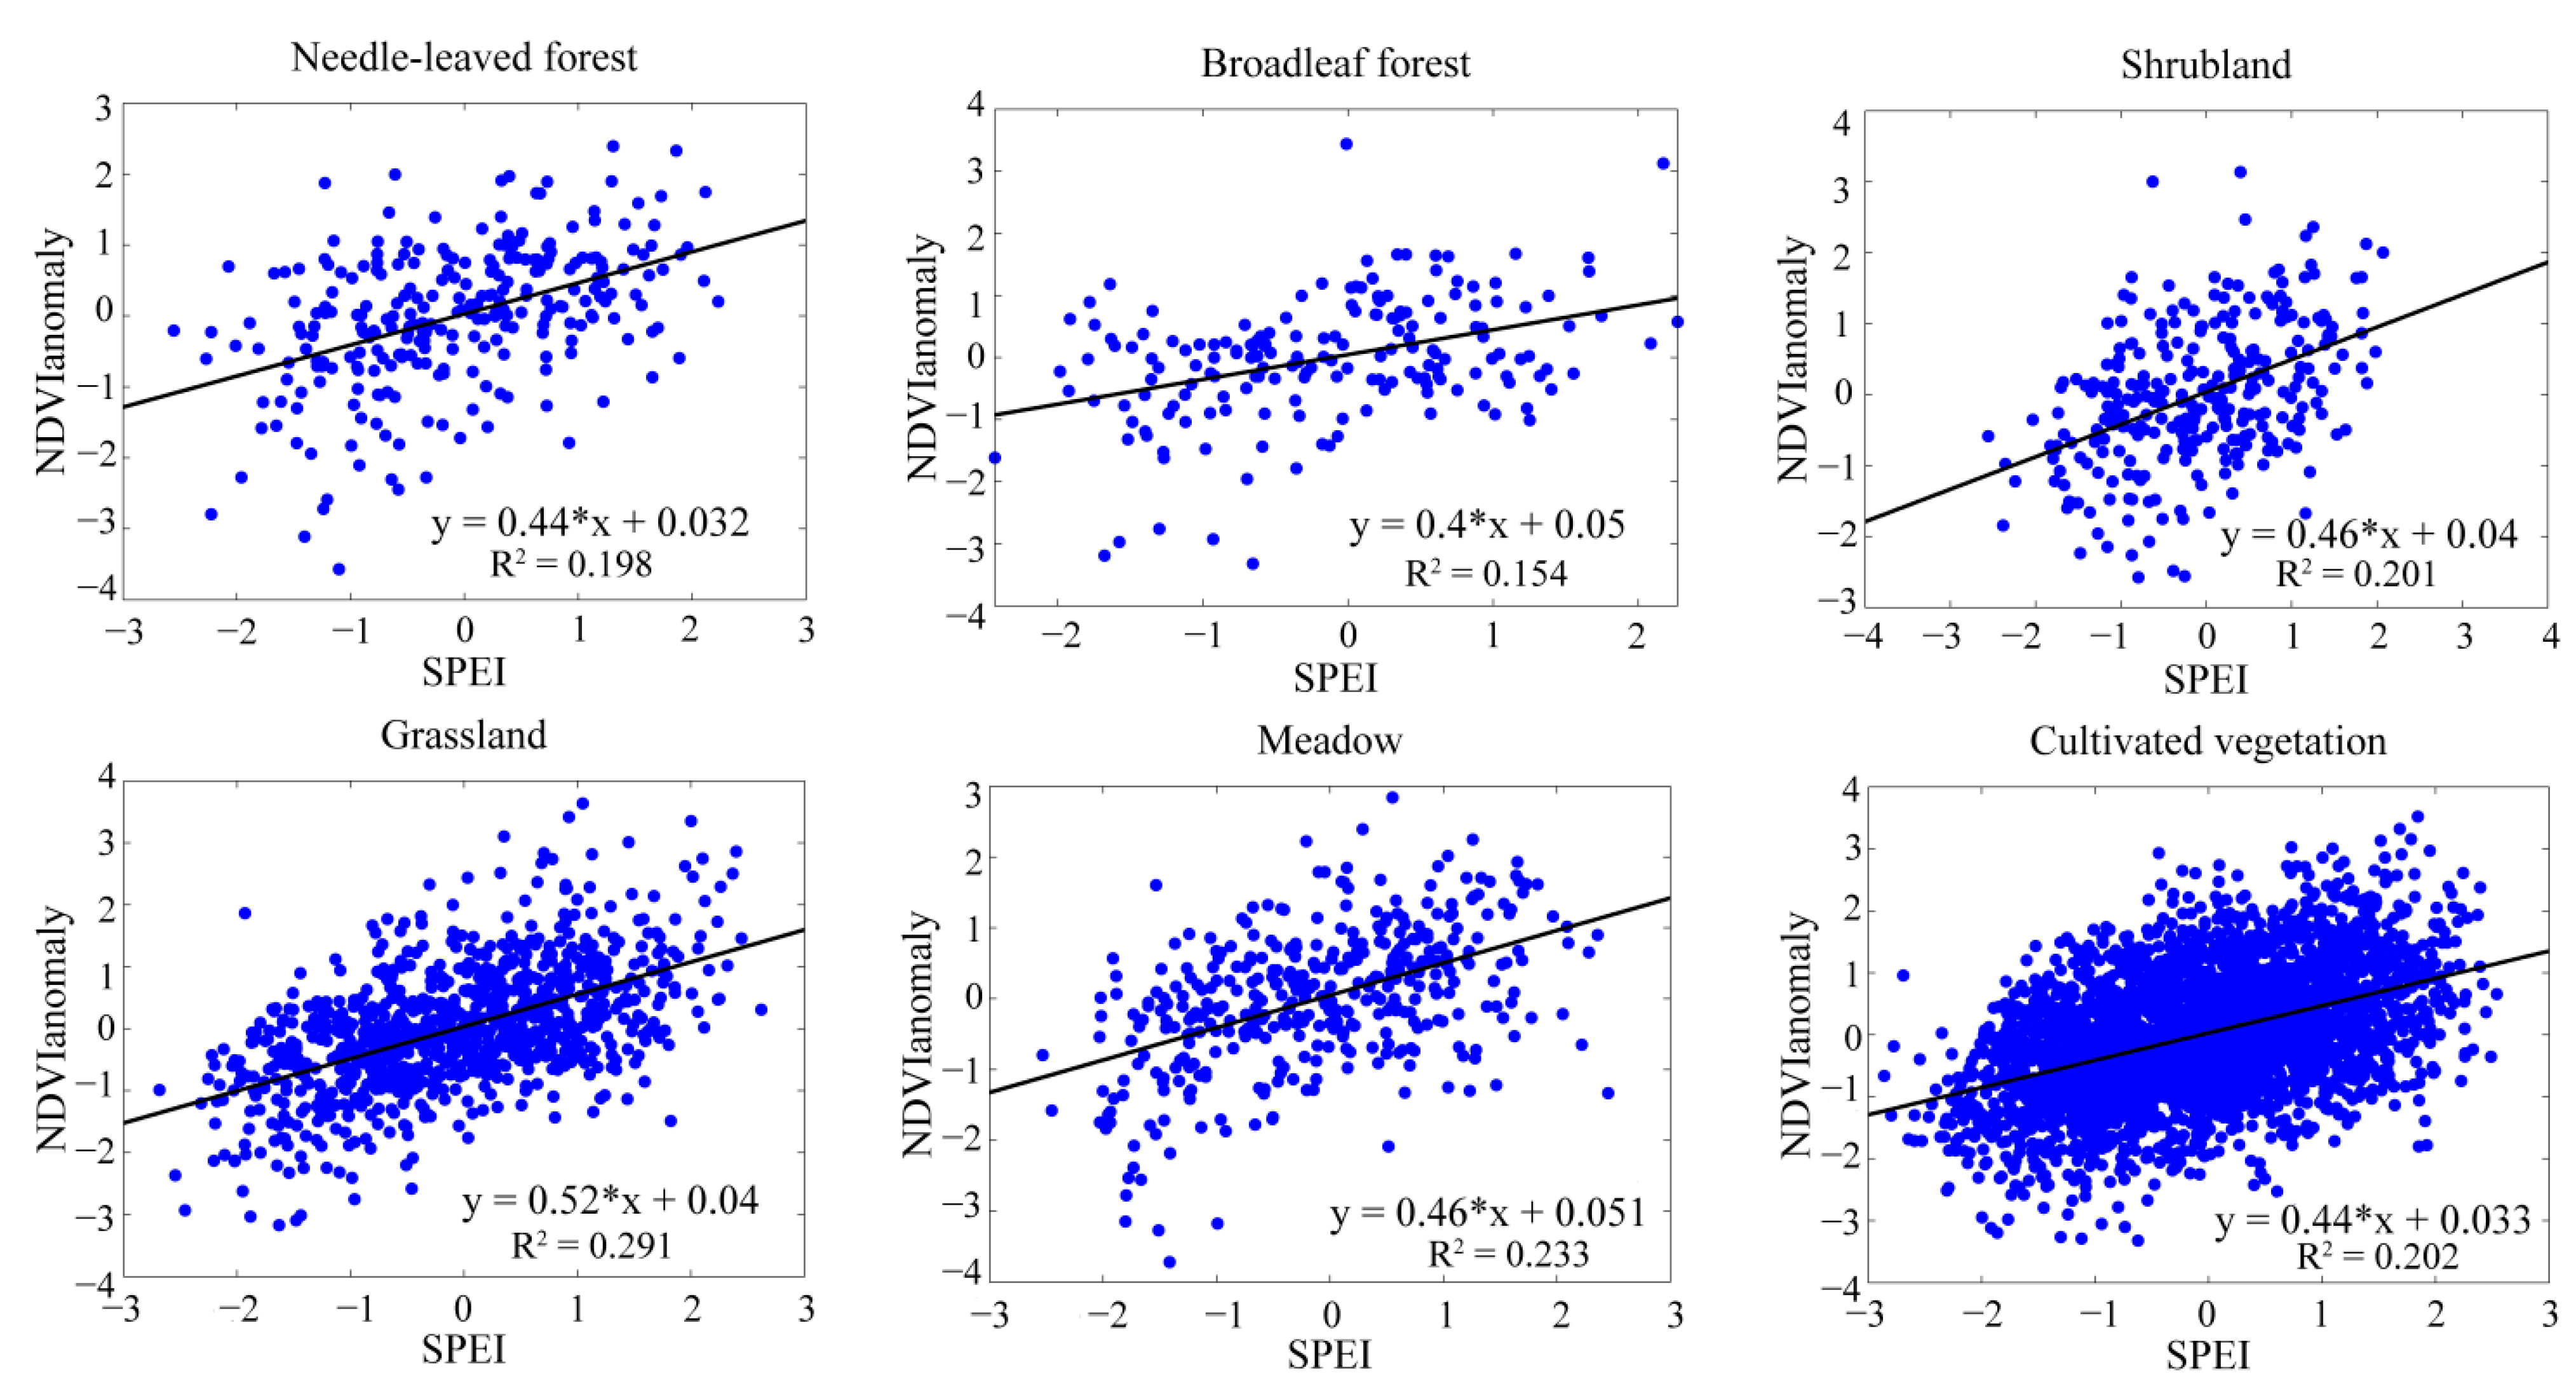
3.2. Drought Derived from the Optimal Time Scales of SPEI
| Vegetation Types | Number of Stations | Optimal Time Scales (months) | Season |
|---|---|---|---|
| Needle-leaved forest | 39 | 11 | Summer |
| Broadleaf forest | 26 | 10 | Summer |
| Shrubland | 46 | 12 | Summer |
| Grassland | 39 | 3 | Summer |
| Meadow | 32 | 4 | Autumn |
| Cultivated vegetation | 323 | 2 | Summer |
| Vegetation Types | Increased Proportion of the Correlation Coefficients (%) |
|---|---|
| Needle-leaved forest | 5.9 |
| Broadleaf forest | 10.6 |
| Shrubland | 0 |
| Grassland | 20 |
| Meadow | 16.3 |
| Cultivated vegetation | 28.4 |

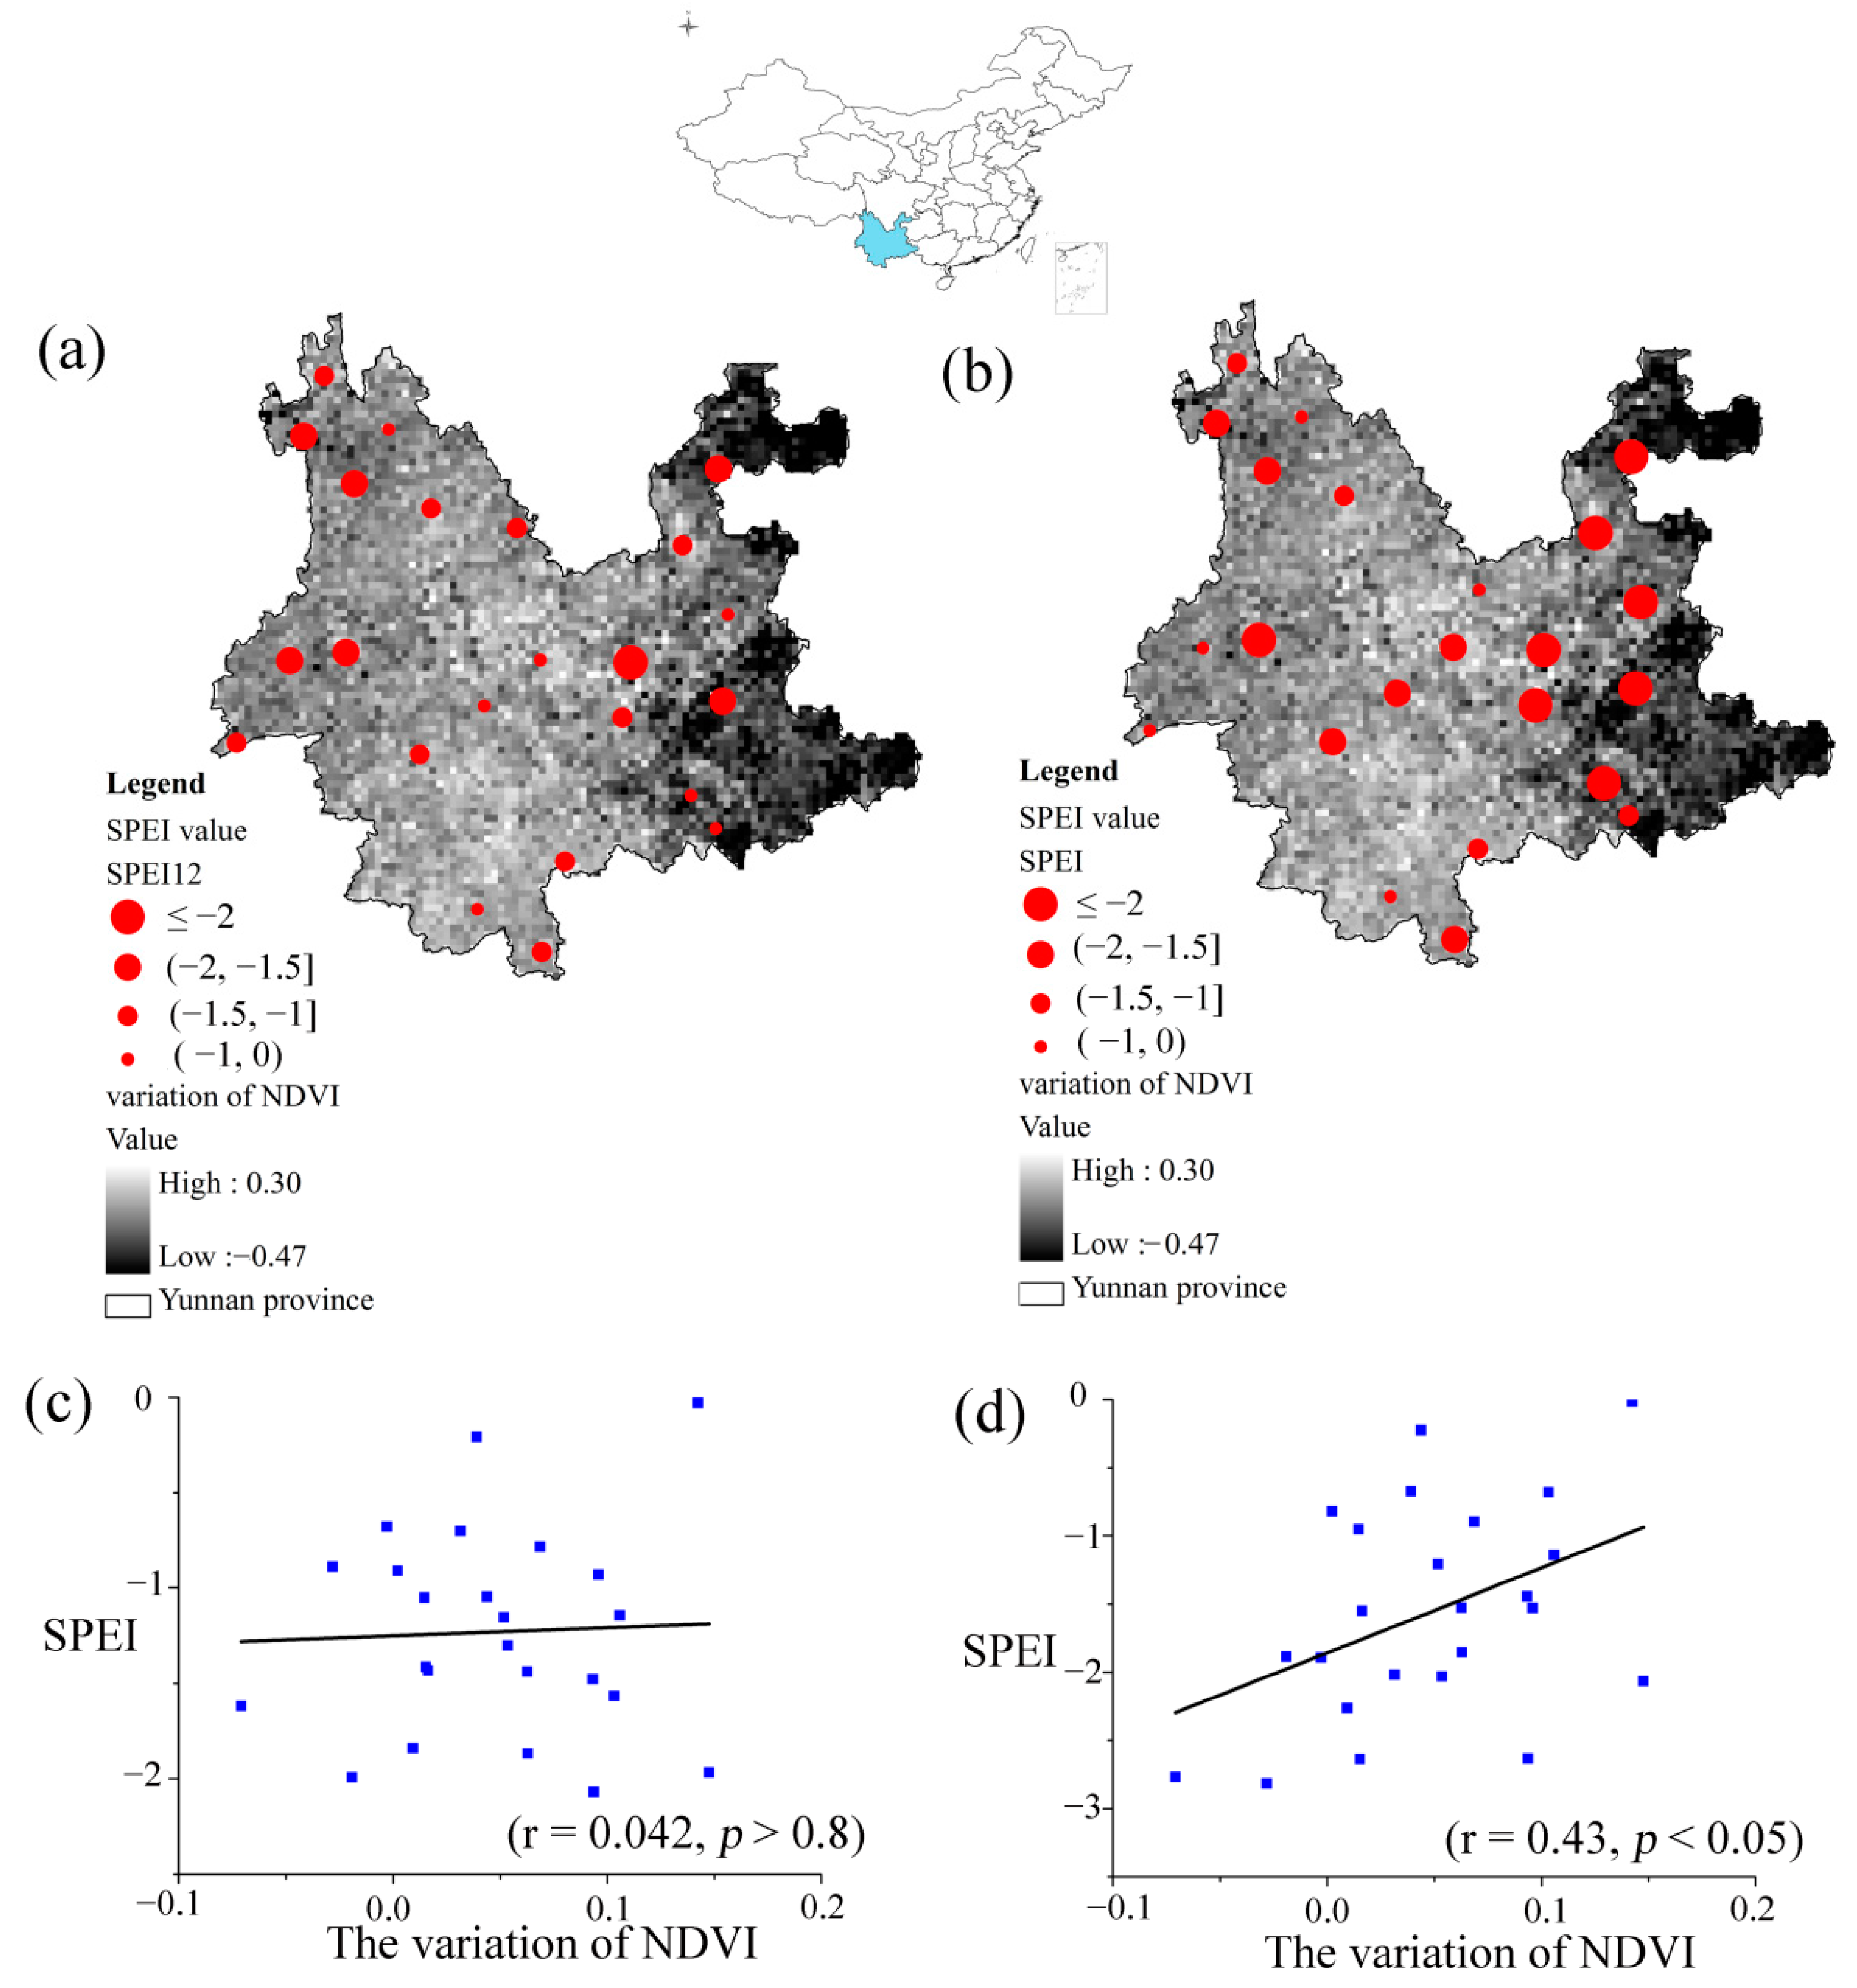
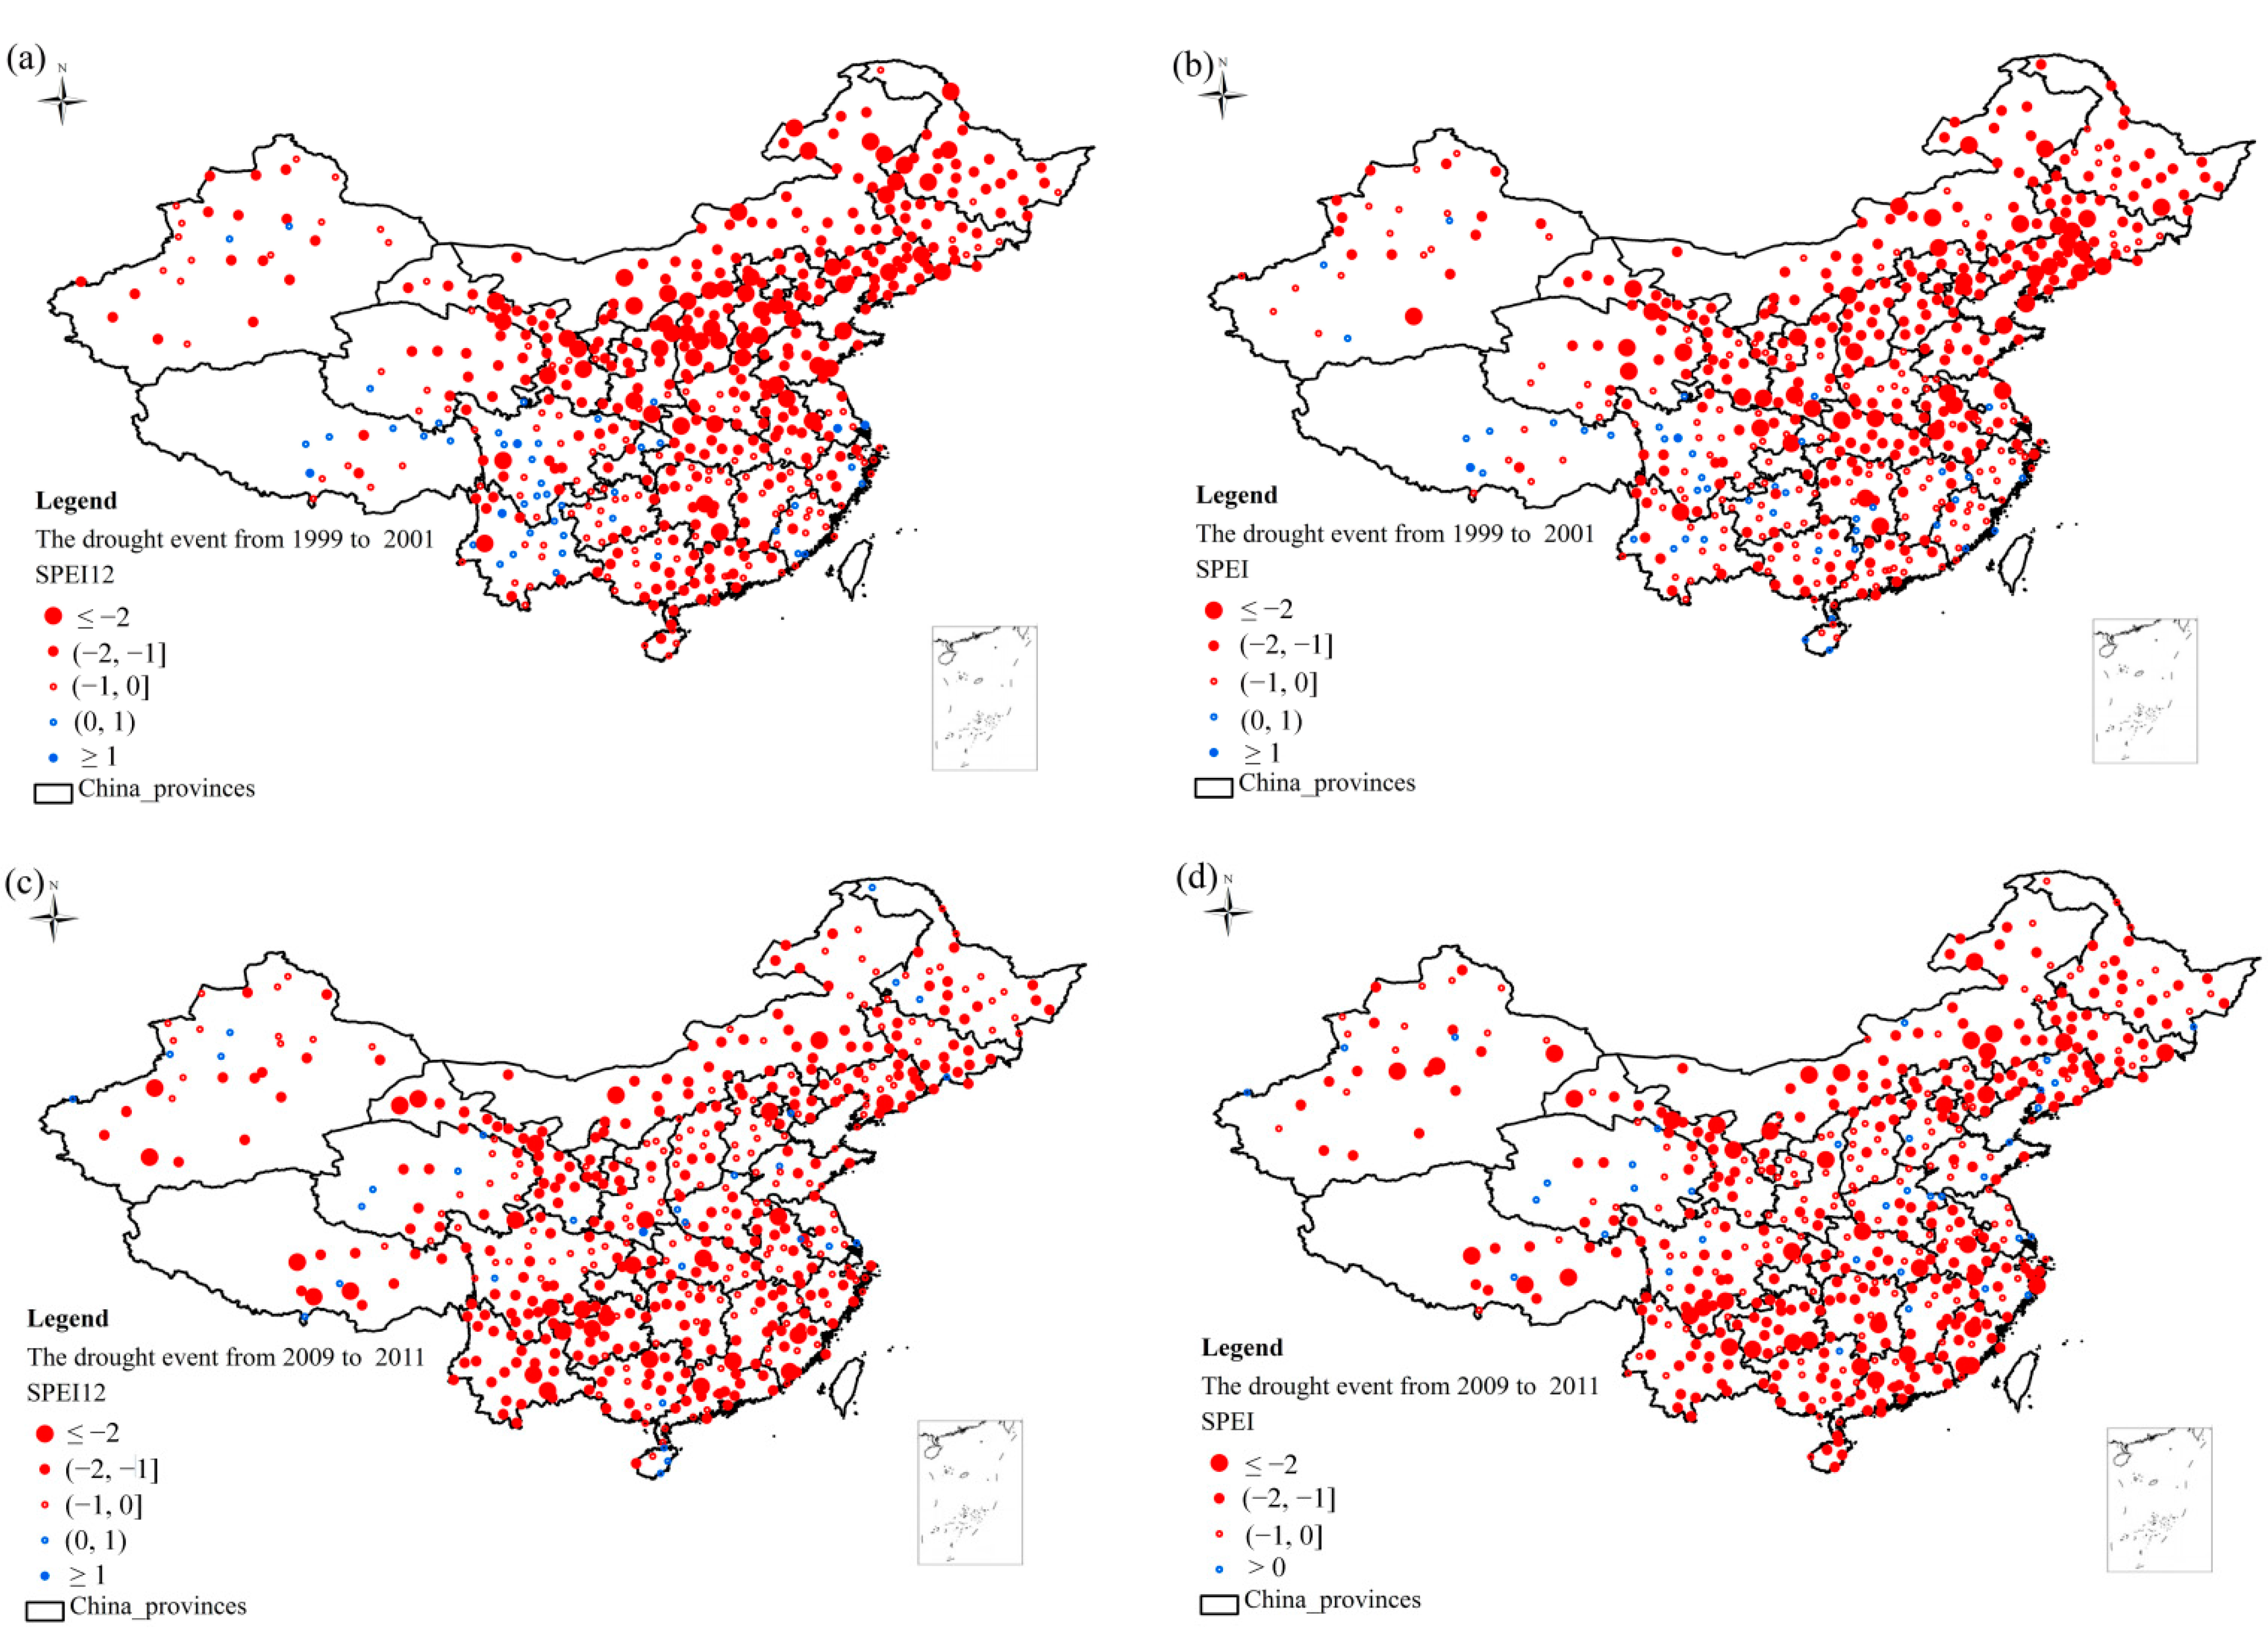
3.3. Comparison of Large-Scale Drought Events

3.4. Regression Models Between Vegetation Growth and Drought with Both SPEI-12 and SPEIopt


4. Discussion
5. Conclusions
Acknowledgments
Author Contributions
Conflicts of Interest
References
- Beguería, S.; Vicente-Serrano, S.M.; Angulo, M. A multi-scalar global drought data set: The SPEI base: A new gridded product for the analysis of drought variability and impacts. Bull. Am. Meteorol. Soc. 2010, 91, 1351–1354. [Google Scholar] [CrossRef]
- Bryant, E.A. Natural Hazards, 2nd ed.; Cambridge University Press: Cambridge, UK, 2005. [Google Scholar]
- Wilhite, D. Drought as a natural hazard: Concepts and definitions. In Drought: A Global Assessment; Whihite, D.A., Ed.; Routledge: London, UK, 2000; pp. 3–18. [Google Scholar]
- Centre for Research on the Epidemiology of Disasters-CRED. EM-DAT: The OFDA/CRED International Disaster Database. Université Catholique de Louvain: Brussels, Belgium, 2011; Available online: www.emdat.be (accessed on 8 May 2015).
- Dai, A. Drought under global warming: A review. Wiley Interdiscip. Rev. Clim. Chang. 2011, 2, 45–65. [Google Scholar] [CrossRef]
- Xu, K.; Yang, D.W.; Yang, H.B.; Li, Z.; Qin, Y.; Shen, Y. Spatio-temporal variation of drought in China during 1961–2012: A climatic perspective. J. Hydrol. 2015, 526, 253–264. [Google Scholar] [CrossRef]
- Dai, A. Increasing drought under global warming in observations and models. Nat. Clim. Chang. 2013, 3, 52–58. [Google Scholar] [CrossRef]
- Seneviratne, S.I. Climate science: Historical drought trends revisited. Nature 2012, 491, 338–339. [Google Scholar] [CrossRef] [PubMed]
- Sheffield, J.; Andreadis, K.M.; Wood, E.F.; Lettenmaier, D.P. Global and continental drought in the second half of the twentieth century: Severity-area-duration analysis and temporal variability of large-scale events. J. Clim. 2009, 22, 1962–1981. [Google Scholar] [CrossRef]
- Sheffield, J.; Wood, E.F.; Roderick, M.L. Little change in global drought over the past 60 years. Nature 2012, 491, 435–440. [Google Scholar] [CrossRef] [PubMed]
- Wang, X.J.; Zhang, J.Y.; Shamsuddin, S.; Amgad, E.; He, R.M.; Bao, Z.X.; Ali, M. Water resources management strategy for adaptation to droughts in China. Mitig. Adapt. Strateg. Glob. Chang. 2012, 17, 923–937. [Google Scholar] [Green Version]
- Zhang, L.; Xiao, J.; Li, J.; Wang, K.; Lei, L.; Guo, H. The 2010 spring drought reduced primary productivity in southwestern China. Environ. Res. Lett. 2012, 7, 1–10. [Google Scholar] [CrossRef]
- Zhao, C.; Deng, X.; Yuan, Y.; Yan, H.; Liang, H. Prediction of drought risk based on the WRF model in Yunnan province of China. Adv. Meteorol. 2013, 2013, 1–9. [Google Scholar] [CrossRef]
- Zou, X.K.; Ren, G.Y.; Zhang, Q. Droughts variations in China based on a compound index of meteorological drought. Clim. Environ. Res. 2010, 15, 371–378. (in Chinese). [Google Scholar]
- Yu, M.X.; Li, Q.F.; Hayes, M.J.; Svoboda, M.D.; Heim, R.R. Are droughts becoming more frequent or severe in China based on the Standardized Precipitation Evapotranspiration Index: 1951–2010? Int. J. Climatol. 2014, 34, 545–558. [Google Scholar] [CrossRef]
- Wang, H.L.; Cheng, A.; Wang, Q.; He, B. Drought dynamics and impacts on vegetation in China from 1982 to 2011. Ecol. Eng. 2015, 75, 303–307. [Google Scholar] [CrossRef]
- Palmer, W.C. Meteorological Drought; U.S. Department of Commerce Weather Bureau Research Paper: Washington, DC, USA, 1965; pp. 45–58.
- McKee, T.B.; Doesken, N.J.; Kleist, J. The relationship of drought frequency and duration to time scales. In Proceedings of the Eighth Conference on Applied Climatology, Anaheim, CA, USA, 17–22 January 1993; pp. 17–22.
- Vicente-Serrano, S.M.; Beguería, S.; López-Moreno, J.I. A multiscalar drought index sensitive to global warming: The Standardized Precipitation Evapotranspiration Index. J. Clim. 2010, 23, 1696–1718. [Google Scholar] [CrossRef]
- Guttman, N.B. Comparing the Palmer drought index and the standardized precipitation index. J. Am. Water Resour. Assoc. 1998, 34, 113–121. [Google Scholar] [CrossRef]
- Vicente-Serrano, S.M.; Camarero, J.J.; Azorin-Molina, C. Diverse responses of forest growth to drought time-scales in the Northern Hemisphere. Glob. Ecol. Biogeogr. 2014, 23, 1019–1030. [Google Scholar] [CrossRef]
- Wells, N.; Goddard, S.; Hayes, M.J. A self-calibrating Palmer Drought Severity Index. J. Clim. 2004, 17, 2335–2351. [Google Scholar] [CrossRef]
- Potop, V.; Možny, M.; Soukup, J. Drought evolution at various time scales in the lowland regions and their impact on vegetable crops in the Czech Republic. Agric. For. Meteorol. 2012, 156, 121–133. [Google Scholar] [CrossRef]
- Potopová, V.; Štĕpánek, P.; Možný, M.; Türkott, L.; Soukup, J. Performance of the standardized precipitation evapotranspiration index at various lags for agricultural drought risk assessment in the Czech Republic. Agric. For. Meteorol. 2015, 202, 26–38. [Google Scholar] [CrossRef]
- Ivits, E.; Horion, S.; Fensholt, R.; Cherlet, M. Drought footprint on European ecosystems between 1999 and 2010 assessed by remotely sensed vegetation phenology and productivity. Glob. Chang. Biol. 2014, 20, 581–593. [Google Scholar] [CrossRef] [PubMed]
- Vicente-Serrano, S.M. Evaluating the impact of drought using remote sensing in a Mediterranean, semi-arid region. Nat. Hazards 2007, 40, 173–208. [Google Scholar] [CrossRef]
- Pasho, E.; Camarero, J.J.; Luis, M.; Vicente-Serrano, S.M. Impacts of drought at different time scales on forest growth across a wide climatic gradient in north-eastern Spain. Agric. For. Meteorol. 2011, 151, 1800–1811. [Google Scholar] [CrossRef]
- Kim, Y.; Kimball, J.; Zhang, K.; Didan, K.; Velicogna, I.; McDonald, K. Attribution of divergent northern vegetation growth responses to lengthening non-frozen seasons using satellite optical-NIR and microwave remote sensing. Int. J. Remote Sens. 2014, 35, 3700–3721. [Google Scholar] [CrossRef]
- Bi, J.; Xu, L.; Samanta, A.; Zhu, Z.; Myneni, R. Divergent arctic-boreal vegetation changes between North America and Eurasia over the past 30 years. Remote Sens. 2013, 5, 2093–2112. [Google Scholar] [CrossRef]
- Parida, B.; Buermann, W. Increasing summer drying in North American ecosystems in response to longer nonfrozen periods. Geophys. Res. Lett. 2014, 41, 5476–5483. [Google Scholar] [CrossRef]
- Beguería, S.; Vicente-Serrano, S.M.; Reig, F.; Latorre, B. Standardized precipitation evapotranspiration index (SPEI) revisited: Parameter fitting, evapotranspiration models, tools, datasets and drought monitoring. Int. J. Climatol. 2014, 34, 2001–2023. [Google Scholar] [CrossRef]
- Thornthwaite, C.W. An approach toward a rational classification of climate. Geogr. Rev. 1948, 38, 55–94. [Google Scholar] [CrossRef]
- Vicente-Serrano, S.M.; Gouveia, C.; Camarero, J.J.; Beguería, S.; Trigo, R.; López-Moreno, J.I.; Azorín-Molina, C.; Pasho, E.; Lorenzo-Lacruz, J.; Revuelto, J.; et al. Response of vegetation to drought time-scales across global land biomes. Proc. Natl. Acad. Sci. USA. 2013, 110, 52–57. [Google Scholar] [CrossRef] [PubMed] [Green Version]
- Potop, V.; Boroneant, C.; Možný, M.; Štĕpánek, P.; Skalák, P. Observed spatiotemporal characteristics of drought on various time scales over the Czech Republic. Theor. Appl. Climatol. 2014, 115, 563–581. [Google Scholar] [CrossRef]
- Pasho, E.; Toromani, E.; Alla, A.Q. Climatic impact on tree-ring widths in Abies Borisii-regis forests from South-East Albania. Dendrochronologia 2014, 32, 237–244. [Google Scholar] [CrossRef]
- López-Moreno, J.I.; Vicente-Serrano, S.M.; Beguería, S.; Lorenzo-Lacruz, J.; Azorin-Molina, C.; Zabalza, J.; Morán-Tejeda, E. Hydrological response to climate variability at different time scales: A study in the Ebro basin. J. Hydrol. 2013, 477, 175–188. [Google Scholar] [CrossRef] [Green Version]
- Zhang, X.S. Vegetation Map of the People’s Republic of China (1:1,000,000) and Its Illustration Put to Press; Geological Publishing House: Beijing, China, 2007. [Google Scholar]
- Mohammat, A.; Wang, X.; Xu, X.; Peng, L.; Yang, Y.; Zhang, X.; Myneni, R.; Piao, S. Drought and spring cooling induced recent decrease in vegetation growth in Inner Asia. Agric. For. Meteorol. 2013, 178–179, 21–30. [Google Scholar] [CrossRef]
- Henricksen, B.L.; Durkin, J.W. Growing period and drought early warning in Africa using satellite data. Int. J. Remote Sens. 1986, 7, 1583–1608. [Google Scholar] [CrossRef]
- Groten, S.M.E.; Ocatre, R. Monitoring the length of the growing season with NOAA. Int. J. Remote Sens. 2002, 23, 2797–2815. [Google Scholar] [CrossRef]
- Ji, L.; Peters, A.J. Assessing vegetation response to drought in the northern Great Plains using vegetation and drought indices. Remote Sens. Environ. 2003, 87, 85–98. [Google Scholar] [CrossRef]
- Jain, S.K.; Keshri, R.; Goswami, A.; Sarkar, A.; Chaudhry, A. Identification of drought-vulnerable areas using NOAA AVHRR data. Int. J. Remote Sens. 2009, 30, 2653–2668. [Google Scholar] [CrossRef]
- Karnieli, A.; Agam, N.; Pinker, R.T.; Anderson, M.; Imhoff, M.L.; Gutman, G.G.; Panov, N.; Goldberg, A. Use of NDVI and land surface temperature for drought assessment: Merits and limitations. J. Clim. 2010, 23, 618–633. [Google Scholar] [CrossRef]
- Son, N.T.; Chen, C.F.; Chen, C.R.; Chang, L.Y.; Minh, V.Q. Monitoring agricultural drought in the Lower Mekong Basin using MODIS NDVI and land surface temperature data. Int. J. Appl. Earth Obs. Geoinf. 2012, 18, 417–427. [Google Scholar] [CrossRef]
- Tucker, C.J.; Pinzon, J.E.; Brown, M.E.; Slayback, D.A.; Pak, E.W.; Mahoney, R.; Vermote, E.; Saleous, N.E. An extended AVHRR 8-km NDVI dataset compatible with MODIS and SPOT vegetation NDVI data. Int. J. Remote Sens. 2005, 26, 4485–4498. [Google Scholar] [CrossRef]
- Holben, B. Characteristics of maximum-value composite images from temporal AVHRR data. Int. J. Remote Sens. 1986, 7, 1417–1434. [Google Scholar] [CrossRef]
- Pinzon, J.; Tucker, C. A non-stationary 1981–2012 AVHRR NDVI3g time series. Remote Sens. 2014, 6, 6929–6960. [Google Scholar] [CrossRef]
- Fensholt, R.; Proud, S. Evaluation of earth observation based global long term vegetation trends—Comparing GIMMS and MODIS global NDVI time series. Remote Sens. Environ. 2012, 119, 131–147. [Google Scholar] [CrossRef]
- Wu, D.; Zhao, X.; Liang, S.; Zhou, T.; Huang, K.; Tang, B.; Zhao, W. Time-lag effects of global vegetation responses to climate change. Glob. Chang. Biol. 2015. [Google Scholar] [CrossRef] [PubMed]
- Mao, J.; Shi, X.; Thornton, P.; Hoffman, F.; Zhu, Z.; Myneni, R. Global latitudinal-asymmetric vegetation growth trends and their driving mechanisms: 1982–2009. Remote Sens. 2013, 5, 1484–1497. [Google Scholar] [CrossRef]
- Huang, W.H.; Yang, X.G.; Li, M.S.; Zhang, X.Y.; Wang, M.T.; Dai, S.W.; Ma, J.H. Evolution characteristics of seasonal drought in the south of China during the past 58 years based on standardized precipitation index. Trans. CSAE. 2010, 26, 50–59. [Google Scholar]
- Merlin, M.; Perot, T.; Perret, S.; Korboulewsky, N.; Vallet, P. Effects of stand composition and tree size on resistance and resilience to drought in sessile and Scots pine. For. Ecol. Manag. 2015, 339, 22–33. [Google Scholar] [CrossRef]
- Huang, K.C.; Yi, C.X.; Wu, D.H.; Zhou, T.; Zhao, X.; Blanford, W.J.; Wei, S.H.; Wu, H.; Du, L.; Li, Z. Tipping point of a conifer forest ecosystem under severe drought. Environ. Res. Lett. 2015, 10. [Google Scholar] [CrossRef]
- Xiong, G.J.; Zhang, B.K.; Li, C.Y.; Shang, K.Z.; Wang, S.G. Characteristics of drought variations in Southwest China in 1961–2013 based on SPEI. Progress. Inquis. Mutat. Clim. 2013, 3, 192–198. [Google Scholar]
- Zhang, W.C.; Zheng, J.M.; Ren, J.Z. Climate characteristics of extreme drought events in Yunnan. J. Catastrophol. 2013, 28, 59–64. [Google Scholar]
- Wang, J.J.; Meng, Y.B.; Zhang, Z.; Shi, P.J. Establishment of Palmer drought severity model for Yunnan Province: Analysis of characteristics of drought disaster in 2010. J. Nat. Disaster 2012, 21, 190–197. [Google Scholar]
- Orwing, D.A.; Abrams, M.D. Variation in radial growth responses to drought among species, site and canopy strata. Trees 1997, 11, 474–484. [Google Scholar] [CrossRef]
- Jonsson, S.; Gunnarson, B.; Criado, C. Drought is the major limiting factor for tree-ring growth of high-altitude Canary island pines on Tenerife. Geogr. Ann. 2002, 84, 51–71. [Google Scholar] [CrossRef]
- Hacke, U.G.; Sperry, J.S. Functional and ecological xylem anatomy. Perspect. Plant Ecol. 2001, 4, 97–115. [Google Scholar] [CrossRef]
- Willson, C.J.; Manos, P.S.; Hackson, R.B. Hydraulic traits are influenced by phylogenetic history in the drought-resistant, invasive genus Juniperus (Cupressaceae). Am. J. Bot. 2008, 95, 299–314. [Google Scholar] [CrossRef] [PubMed]
- Guehl, J.M.; Aussenac, G.; Bouachorine, J.; Zimmermann, R.; Pennes, J.M.; Ferhi, A.; Grieu, P. Sensitivity of leaf gas exchange to atmospheric drought, soil drought, and water-use efficiency in some Mediterranean Abies species. Can. J. For. Res. 1991, 21, 1507–1515. [Google Scholar] [CrossRef]
- Schwinning, S.; Sala, O.E. Hierarchy of responses to resource pulses in arid and semi-arid ecosystems. Oecologia 2004, 141, 211–220. [Google Scholar] [CrossRef] [PubMed]
- Li, W.G.; Yi, X.; Hou, M.T.; Chen, H.L.; Chen, Z.L. Standardized precipitation evapotranspiration index shows drought trend in China. Chin. J. Eco. Agric. 2012, 20, 643–649. [Google Scholar] [CrossRef]
- Vicente-Serrano, S.M. Differences in spatial patterns of drought on different time scales: An analysis of Iberian Peninsula. Water Resour. Manag. 2006, 20, 37–60. [Google Scholar] [CrossRef]
- Jump, A.S.; Hunt, J.M.; Peñuelas, J. Rapid climate change-related growth decline at the southern range edge of Fagus sylvatica. Glob. Chang. Biol. 2006, 12, 2163–2174. [Google Scholar] [CrossRef]
- Sarris, A.; Christodoulakis, D.; Kӧrner, C. Recent decline in precipitation and tree growth in the eastern Mediterranean. Glob. Chang. Biol. 2007, 13, 1–14. [Google Scholar] [CrossRef]
- Martínez-Vilalta, J.; López, B.C.; Adell, N.; Badiella, L.; Ninyerola, M. Twentieth century increase of Scots pine radial growth in NE Spain shows strong climate interactions. Glob. Chang. Biol. 2008, 14, 2868–2881. [Google Scholar] [CrossRef]
© 2015 by the authors; licensee MDPI, Basel, Switzerland. This article is an open access article distributed under the terms and conditions of the Creative Commons Attribution license (http://creativecommons.org/licenses/by/4.0/).
Share and Cite
Li, Z.; Zhou, T.; Zhao, X.; Huang, K.; Gao, S.; Wu, H.; Luo, H. Assessments of Drought Impacts on Vegetation in China with the Optimal Time Scales of the Climatic Drought Index. Int. J. Environ. Res. Public Health 2015, 12, 7615-7634. https://doi.org/10.3390/ijerph120707615
Li Z, Zhou T, Zhao X, Huang K, Gao S, Wu H, Luo H. Assessments of Drought Impacts on Vegetation in China with the Optimal Time Scales of the Climatic Drought Index. International Journal of Environmental Research and Public Health. 2015; 12(7):7615-7634. https://doi.org/10.3390/ijerph120707615
Chicago/Turabian StyleLi, Zheng, Tao Zhou, Xiang Zhao, Kaicheng Huang, Shan Gao, Hao Wu, and Hui Luo. 2015. "Assessments of Drought Impacts on Vegetation in China with the Optimal Time Scales of the Climatic Drought Index" International Journal of Environmental Research and Public Health 12, no. 7: 7615-7634. https://doi.org/10.3390/ijerph120707615