
The Construction and Validation of the Heat Vulnerability Index, a Review


Abstract
:1. Introduction
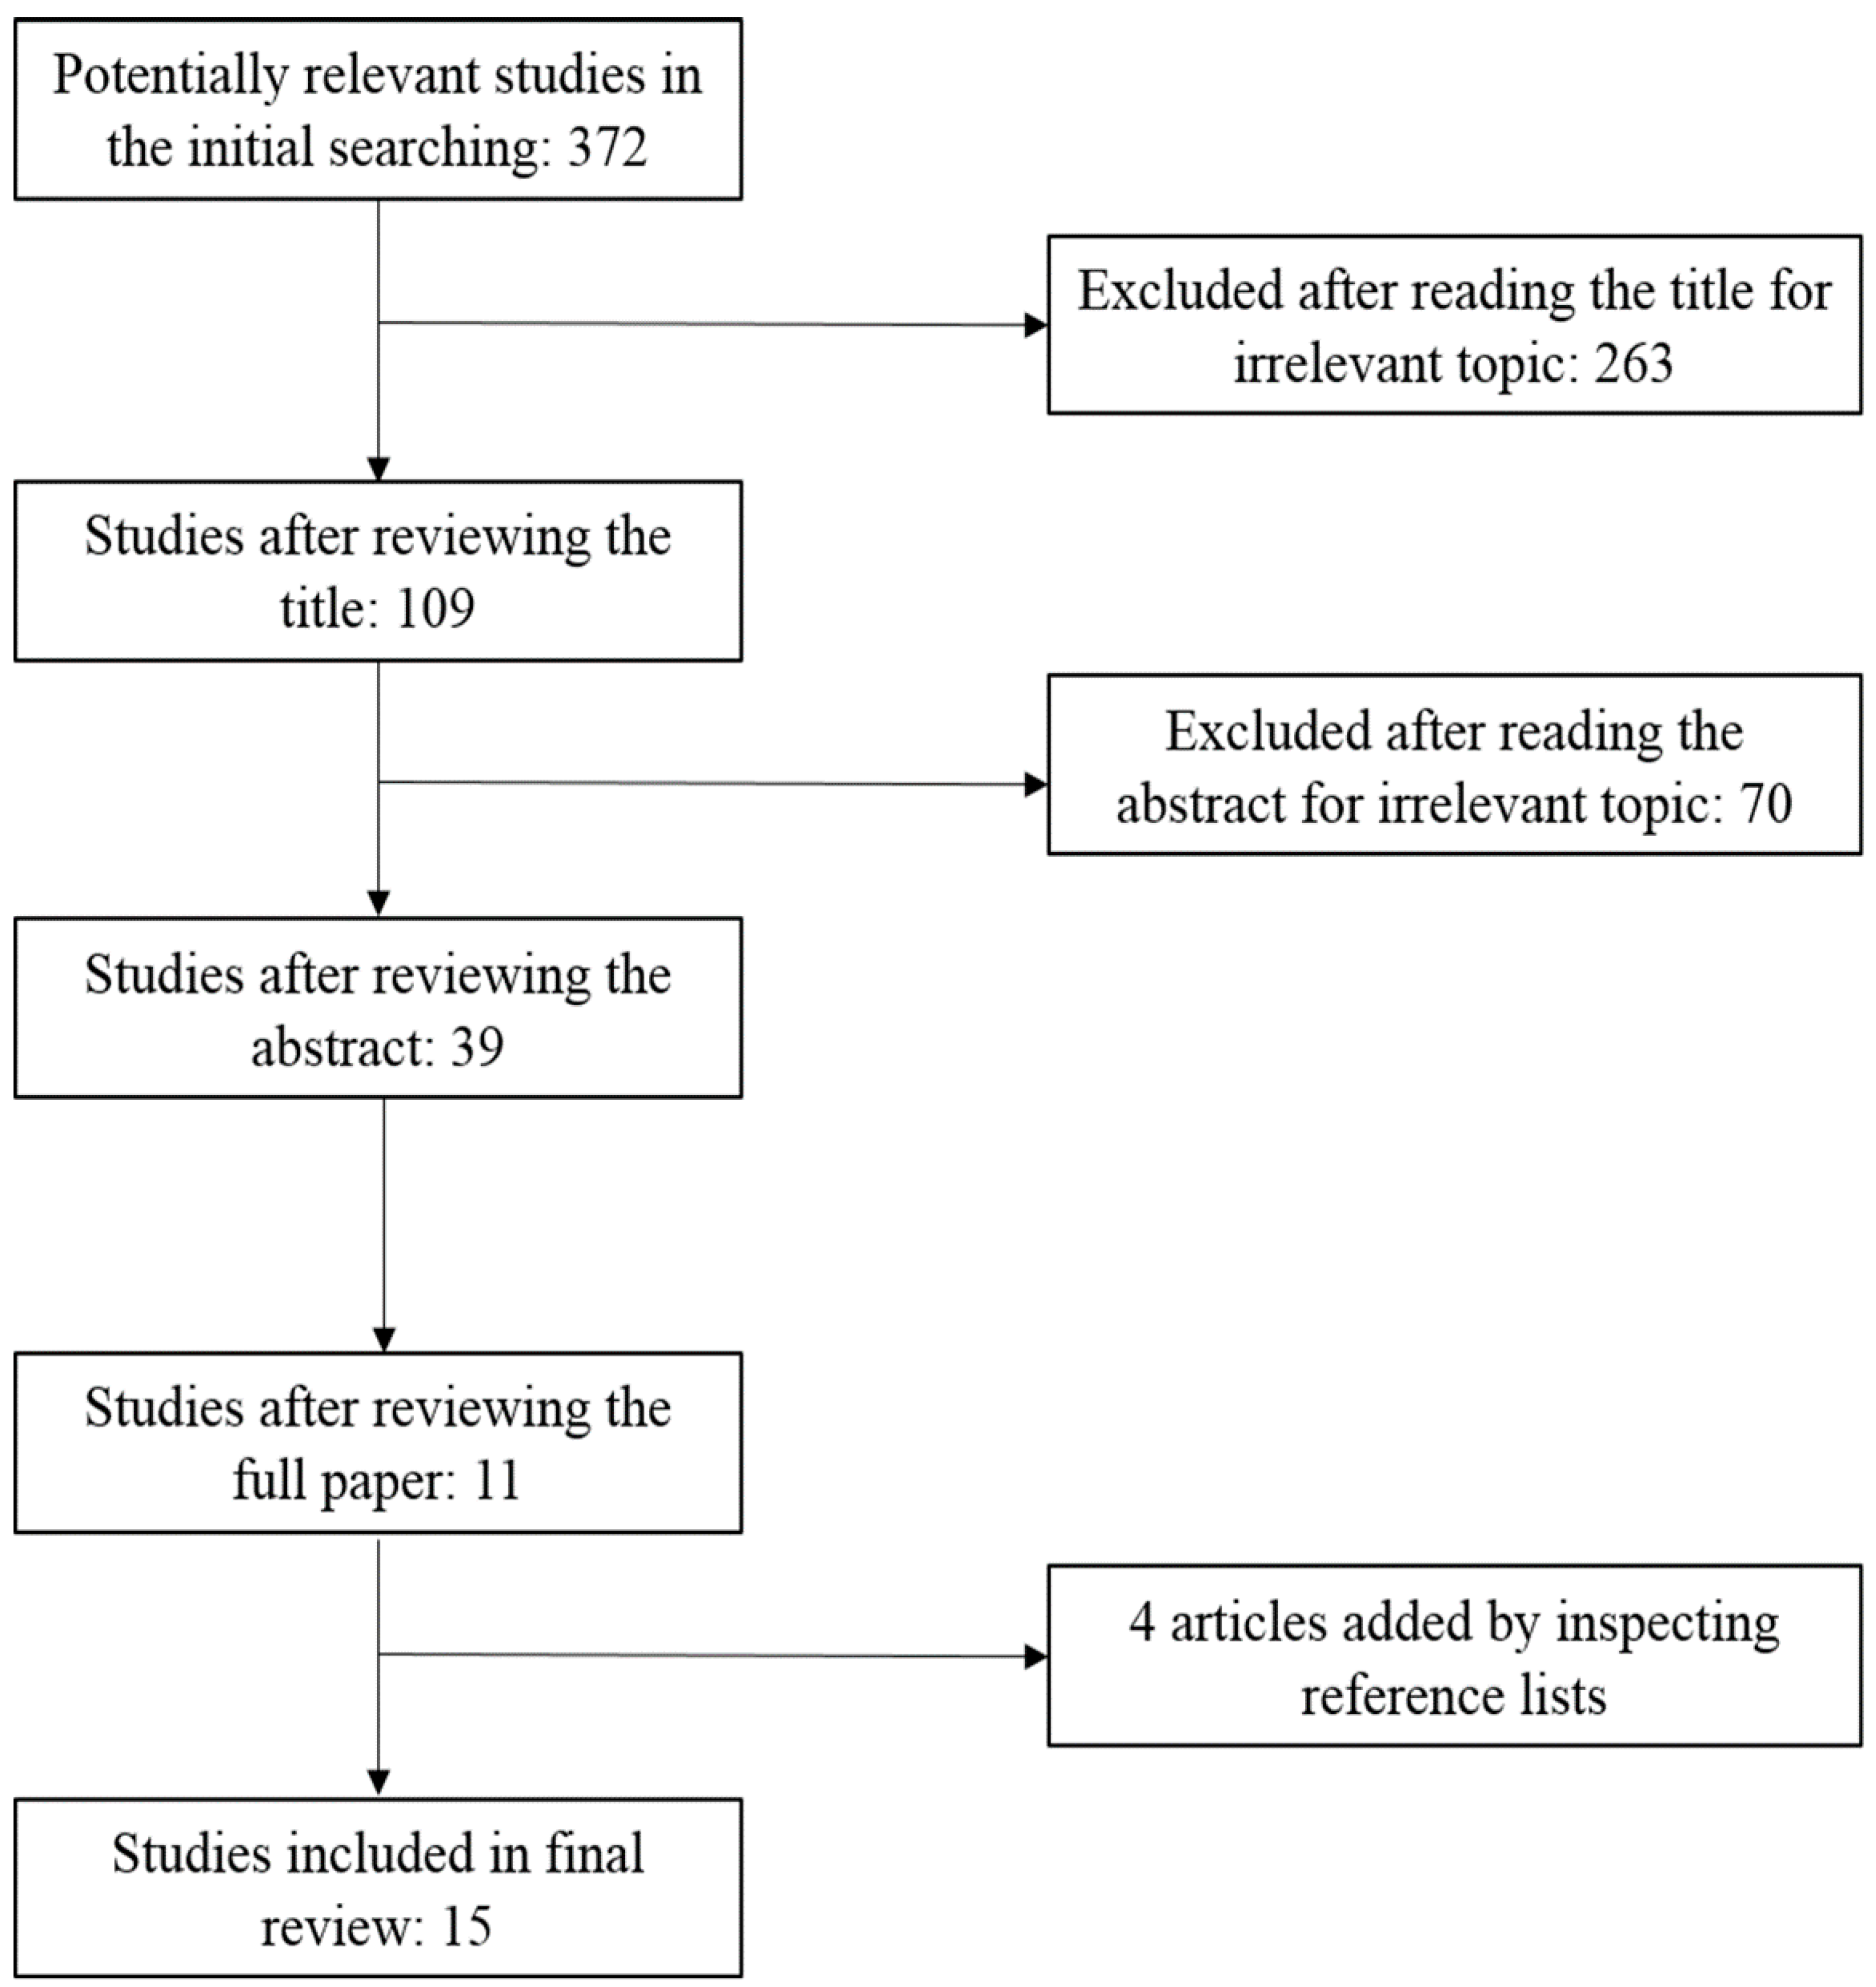
2. Methods
3. Results and Discussion

| Author (Time, Location) | Variables (Numbers) | Methods |
|---|---|---|
| Vescovi et al. [31] (2005, Southern Quebec) | hot days, consecutive hot days with Tmax > 30°C and Tmin > 22°C, elderly, poverty, isolation, education (6) | normalization, equal weight |
| Reid et al. [25] (2009, USA) | poverty, education, ethnicity, living alone, elderly, aged people living alone, vegetation, diabetes, central AC, AC (10) | principal component analysis |
| Rinner et al. [24] (2010, Toronto) | land surface temperature, vegetation, old dwelling without AC, high-density dwellings without AC, behavior, illness, cognitive impairment, elderly, infants and young children, poverty, rental households, isolation, homeless, education, not English speaking, recent immigrants, ethnicity, home cooling, drop-in centers, participating community outreach centers, cooling centers (21) | ordered weighted averaging, local indicators of spatial association |
| Hondula et al. [32] (2012, Philadelphia) | surface temperature (2004 and 2008), low/mid/high density residential, recreational, industrial, mixed use land, commercial, building coverage, White, Black, American Indian, Asian, Pacific Islander, other race, two or more races, nonwhite, elderly, education, income, below poverty line, below 2x poverty line, aged people living alone, living alone(25) | principal components analysis, multiple linear regression |
| Chow et al. [21] (2012, Phoenix) | mean summer maximum/minimum temperature, mean normalized difference vegetation index, elderly, income, foreign-born noncitizens, immigrants (7) | normalization, equal weight |
| Tomlinson et al. [33] (2012, Birmingham) | land surface temperature, elderly, ill, density of households, flat (5) | normalization, equal weight |
| Loughnan et al. [34] (2012, Melbourne) | aged care facilities, ethnicity, aged people living alone, infants and elderly, urban density (5) | linear correlation, regression analysis, weighting the indicators according to their contribution |
| Johnson et al. [35] (2012, Chicago) | land surface temperature, elderly women, elderly men, lonely elderly women, white population, female heads of household, lonely elderly men, family income, per capita income, household income, population with less than high school education, Asian population, population aged 65 and older in group living, other race population, Hispanic population, population 25 and older with a high school education, built-up index, vegetation index, black population (19) | principal component analysis |
| Wolf et al. [26] (2013, London) | land surface temperature, households in rented tenure, flat, population density, households without central heating, elderly, self-report bad health status, receiving social benefit, single pensioner households, ethnicity (10) | principal component analysis, spatial clustering analysis |
| Aubrecht et al. [36] (2013, U.S. National Capital Region) | heat wave day count, elderly, living alone, poverty, poor English skills, education, vegetation (7) | normalization, equal weight |
| Harlan et al. [37] (2013, Maricopa county) | ethnicity, immigrant, poverty, education, central AC, elderly, elderly and living alone, living alone, unvegetated area (mean), unvegetated area (SD), surface temperature (11) | principal component analysis, local indicators of spatial association |
| Maier et al. [28] (2013, Georgia) | poverty, education, ethnicity, living alone, elderly, elderly and living alone, diabetes, land use (8) | principal component analysis |
| Dong et al. [38] (2014, Beijing) | heat wave days, extremely high temperature days, population density, elderly ratio, income level, land use/cover (6) | normalization, equal weight |
| Zhu et al. [39] (2014, Guangdong) | elderly, infant, immigrant, unemployment, agricultural population, infant mortality rate, health worker, GDP per capita, living space, harmless sanitary latrines, illiteracy rate, temperature growth, heat wave day count (13) | analytic hierarchy process, principal component analysis |
| El-Zein et al. [40] (2015, Sydney) | maximum temperature, minimum temperature, high temperature days, land cover, population density, road density, elderly, elderly and living alone, children, multiunit dwellings, population completing year 12, not English speaking, home loan repayment, home ownership, household income, internet access, assets to liabilities of local council, business rates, residential rates, community service expenses, environmental and health expenses, population requiring financial assistance (22) | multi-criteria outranking approach |
3.1. Heat Vulnerability Determinants
| Amount of Evidence | Large | Gender: Female | Age (+) Education (−) | Magnitude (+) |
|---|---|---|---|---|
| medium | income race: Non-African American minorities | population density (+) poverty (+) deprivation (+) housing quality (~) social isolation (~) | timing (+) pre-existing medicalconditions (+) acclimatization (−) race: African American (+) air conditioning (−) | |
| small | housing density social networks | total population (~) urban land use (+) open space (~) vegetation (−) healthcare access (−) | duration (+) variance (+) race: non-white (~) | |
| low | medium | high | ||
| level of agreement | ||||
3.1.1. Thermal Characteristics
3.1.2. Demographic and Socioeconomic Factors
3.2. The Construction of the HVI
3.3. Validation of the HVI
4. Conclusions and Outlook
Acknowledgments
Author Contributions
Conflicts of Interest
References
- Meehl, G.A.; Tebaldi, C. More intense, more frequent, and longer lasting heat waves in the 21st century. Science 2004, 305, 994–997. [Google Scholar] [CrossRef] [PubMed]
- Patz, J.A.; Campbell-Lendrum, D.; Holloway, T.; Foley, J.A. Impact of regional climate change on human health. Nature 2005, 438, 310–317. [Google Scholar] [CrossRef] [PubMed]
- Sheridan, S.C.; Kalkstein, L.S. Progress in heat watch-warning system technology. Bull. Amer. Meteorol. Soc. 2004, 85, 1931–1941. [Google Scholar] [CrossRef]
- Semenza, J.C.; Rubin, C.H.; Falter, K.H.; Selanikio, J.D.; Flanders, W.D.; Howe, H.L.; Wilhelm, J.L. Heat-related deaths during the July 1995 heat wave in Chicago. New Engl. J. Med. 1996, 335, 84–90. [Google Scholar] [CrossRef] [PubMed]
- Robine, J.M.; Cheung, S.L.K.; Le Roy, S.; van Oyen, H.; Griffiths, C.; Michel, J.P.; Herrmann, F.R. Death toll exceeded 70,000 in Europe during the summer of 2003. CR Biol. 2008, 331, 171–178. [Google Scholar] [CrossRef] [PubMed]
- Patz, J.A.; McGeehin, M.A.; Bernard, S.M.; Ebi, K.L.; Epstein, P.R.; Grambsch, A.; Gubler, D.J.; Reiter, P.; Romieu, I.; Rose, J.B.; Samet, J.M.; Trtanj, J. The potential health impacts of climate variability and change for the United States—Executive summary of the report of the health sector of the US National Assessment. J. Environ. Health 2001, 64, 20–28. [Google Scholar] [PubMed]
- Pengelly, L.D.; Campbell, M.E.; Cheng, C.S.; Fu, C.; Gingrich, S.E.; Macfarlane, R. Anatomy of heat waves and mortality in Toronto, Lessons for public health protection. Can. J. Public Health 2007, 98, 364–368. [Google Scholar] [PubMed]
- Kovats, R.S.; Hajat, S. Heat stress and public health: A critical review. Ann. Rev. Public Health 2008, 29, 41–55. [Google Scholar] [CrossRef] [PubMed]
- Shen, T.F.; Howe, H.L.; Alo, C.; Moolenaar, R.L. Toward a broader definition of heat-related death: Comparison of mortality estimates from medical examiners’ classification with those from total death differentials during the July 1995 heat wave in Chicago, Illinois. Amer J Foren Med Path. 1998, 19, 113–118. [Google Scholar] [CrossRef]
- Vandentorren, S.; Bretin, P.; Zeghnoun, A.; Mandereau-Bruno, L.; Croisier, A.; Cochet, C.; Riberon, J.; Siberan, I.; Declercq, B.; Ledrans, M. August 2003 heat wave in France: Risk factors for death of elderly people living at home. Eur. J. Public Health 2006, 16, 583–591. [Google Scholar] [CrossRef] [PubMed]
- Balbus, J.M.; Malina, C. Identifying vulnerable subpopulations for climate change health effects in the United States. J. Occup. Environ. Med. 2009, 51, 33–37. [Google Scholar] [CrossRef] [PubMed]
- Ebi, K.L.; Teisberg, T.J.; Kalkstein, L.S.; Robinson, L.; Weiher, R.F. Heat watch/warning systems save lives: Estimated costs and benefits for Philadelphia 1995–1998. Bull. Am. Meteorol. Soc. 2004, 85, 1067–1073. [Google Scholar] [CrossRef]
- Fouillet, A.; Rey, G.; Wagner, V.; Laaidi, K.; Empereur-Bissonnet, P.; le Tertre, A.; Frayssinet, P.; Bessemoulin, P.; Laurent, F.; de Crouy-Chanel, P.; et al. Has the impact of heat waves on mortality changed in France since the European heat wave of summer 2003? A study of the 2006 heat wave. Int. J. Epidemiol. 2008, 37, 309–317. [Google Scholar] [CrossRef] [PubMed]
- Bernard, S.M.; McGeehin, M.A. Municipal heat wave response plans. Amer. J. Public Health 2004, 94, 1520–1522. [Google Scholar] [CrossRef]
- Bassil, K.L.; Cole, D.C. Effectiveness of public health interventions in reducing morbidity and mortality during heat episodes: A structured review. Int. J. Environ. Res. Public Health 2010, 7, 991–1001. [Google Scholar] [CrossRef] [PubMed]
- Naughton, M.P.; Henderson, A.; Mirabelli, M.C.; Kaiser, R.; Wilhelm, J.L.; Kieszak, S.M.; Rubin, C.H.; McGeehin, M.A. Heat-related mortality during a 1999 heat wave in Chicago. Amer. J. Prev. Med. 2002, 22, 221–227. [Google Scholar] [CrossRef]
- Weisskopf, M.G.; Anderson, H.A.; Foldy, S.; Hanrahan, L.P.; Blair, K.; Torok, T.J.; Rumm, P.D. Heat wave morbidity and mortality, Milwaukee, Wis, 1999 vs. 1995: An improved response? Amer. J. Public Health 2002, 92, 830–833. [Google Scholar] [CrossRef]
- O’Neill, M.S.; Jackman, D.K.; Wyman, M.; Manarolla, X.; Gronlund, C.J.; Brown, D.G.; Brines, S.J.; Schwartz, J.; Diez-Roux, A.V. US local action on heat and health: Are we prepared for climate change? Int. J. Public Health 2010, 55, 105–112. [Google Scholar] [CrossRef] [PubMed]
- Turner, B.L., 2nd; Kasperson, R.E.; Matson, P.A.; McCarthy, J.J.; Corell, R.W.; Christensen, L.; Eckley, N.; Kasperson, J.X.; Luers, A.; Martello, M.L.; et al. A framework for vulnerability analysis in sustainability science. Proc. Natl. Acad. Sci. USA 2003, 100, 8074–8079. [Google Scholar] [CrossRef] [PubMed]
- Parry, M.L.; Canziani, O.F.; Palutikof, J.P.; van der Linden, P.J.; Hanson, C.E. (Eds.) Climate Change 2007: Impacts, Adaptation and Vulnerability; Cambridge University Press: Cambridge, UK, 2007; Volume 6.
- Chow, W.T.L.; Chuang, W.C.; Gober, P. Vulnerability to extreme heat in metropolitan phoenix: Spatial, temporal, and demographic dimensions. Prof. Geogr. 2012, 64, 286–302. [Google Scholar] [CrossRef]
- Hansen, A.; Bi, L.D.; Saniotis, A.; Nitschke, M. Vulnerability to extreme heat and climate change: Is ethnicity a factor? Glob. Health Action 2013, 6, 1–7. [Google Scholar] [CrossRef] [PubMed] [Green Version]
- Sheridan, S.C.; Lee, C.C.; Allen, M.J.; Kalkstein, L.S. Future heat vulnerability in California, Part I: Projecting future weather types and heat events. Clim. Chang. 2012, 115, 291–309. [Google Scholar] [CrossRef]
- Rinner, C.; Patychuk, D.; Bassil, K.; Nasr, S.; Gower, S.; Campbell, M. The role of maps in neighborhood-level heat vulnerability assessment for the city of Toronto. Cartogr. Geogr. Inf. Sci. 2010, 37, 31–44. [Google Scholar] [CrossRef]
- Reid, C.E.; O’Neill, M.S.; Gronlund, C.J.; Brines, S.J.; Brown, D.G.; Diez-Roux, A.V.; Schwartz, J. Mapping community determinants of heat vulnerability. Environ. Health Perspect. 2009, 117, 1730–1736. [Google Scholar] [CrossRef] [PubMed]
- Wolf, T.; McGregor, G. The development of a heat wave vulnerability index for London, United Kingdom. Weather Clim. Extremes 2013, 1, 59–68. [Google Scholar] [CrossRef] [Green Version]
- Smoyer-Tomic, K.E.; Rainham, D.G.C. Beating the heat: Development and evaluation of a Canadian hot weather health-response plan. Environ. Health Perspect. 2001, 109, 1241–1248. [Google Scholar] [CrossRef] [PubMed]
- Maier, G.; Grundstein, A.; Jang, W.; Li, C.; Naeher, L.P.; Shepherd, M. Assessing the performance of a vulnerability index during oppressive heat across Georgia, United States. Weather Clim. Soc. 2014, 6, 253–263. [Google Scholar] [CrossRef]
- Reid, C.E.; Mann, J.K.; Alfasso, R.; English, P.B.; King, G.C.; Lincoln, R.A.; Margolis, H.G.; Rubado, D.J.; Sabato, J.E.; West, N.L.; et al. Evaluation of a heat vulnerability index on abnormally hot days: An environmental public health tracking study. Environ. Health Perspect. 2012, 120, 715–720. [Google Scholar] [CrossRef] [PubMed]
- Wolf, T.; McGregor, G.; Analitis, A. Performance assessment of a heat wave vulnerability index for greater London, United Kingdom. Weather Clim. Soc. 2014, 6, 32–46. [Google Scholar] [CrossRef]
- Vescovi, L.; Rebetez, M.; Rong, F. Assessing public health risk due to extremely high temperature events: Climate and social parameters. Clim. Res. 2005, 30, 71–78. [Google Scholar] [CrossRef]
- Hondula, D.M.; Davis, R.E.; Leisten, M.J.; Saha, M.V.; Veazey, L.M.; Wegner, C.R. Fine-scale spatial variability of heat-related mortality in Philadelphia County, USA, from 1983–2008: A case-series analysis. Glob. Environ. Health 2012, 11. [Google Scholar] [CrossRef] [PubMed]
- Tomlinson, C.J.; Chapman, L.; Thornes, J.E.; Baker, C.J. Including the urban heat island in spatial heat health risk assessment strategies: A case study for Birmingham, UK. Int. J. Health Geogr. 2011, 10, 42. [Google Scholar] [CrossRef] [PubMed] [Green Version]
- Loughnan, M.; Nicholls, N.; Tapper, N.J. Mapping heat health risks in urban areas. Int. J. Popul. Res. 2012. [Google Scholar] [CrossRef]
- Johnson, D.P.; Stanforth, A.; Lulla, V.; Luber, G. Developing an applied extreme heat vulnerability index utilizing socioeconomic and environmental data. Appl. Geogr. 2012, 35, 23–31. [Google Scholar] [CrossRef]
- Aubrecht, C.; Ozceylan, D. Identification of heat risk patterns in the U.S. National Capital Region by integrating heat stress and related vulnerability. Environ. Int. 2013, 56, 65–77. [Google Scholar] [CrossRef] [PubMed]
- Harlan, S.L.; Declet-Barreto, J.H.; Stefanov, W.L.; Petitti, D.B. Neighborhood Effects on Heat Deaths: Social and Environmental Predictors of Vulnerability in Maricopa County, Arizona. Environ. Health Perspect. 2013, 121, 197–204. [Google Scholar] [PubMed]
- Dong, W.H.; Liu, Z.; Zhang, L.J.; Tang, Q.H.; Liao, H.; Li, X.E. Assessing Heat Health Risk for Sustainability in Beijing’s Urban Heat Island. Sustainability 2014, 6, 7334–7357. [Google Scholar] [CrossRef]
- Zhu, Q.; Liu, T.; Lin, H.L.; Xiao, J.P.; Luo, Y.; Zeng, W.L.; Zeng, S.Q.; Wei, Y.; Chu, C.; Baum, S.; et al. The spatial distribution of health vulnerability to heat waves in Guangdong Province, China. Glob. Health Action 2014, 7. [Google Scholar] [CrossRef] [PubMed]
- El-Zein, A.; Tonmoy, F.N. Assessment of vulnerability to climate change using a multi-criteria outranking approach with application to heat stress in Sydney. Ecol. Indic. 2015, 48, 207–217. [Google Scholar] [CrossRef]
- Romero-Lankao, P.; Qin, H.; Dickinson, K. Urban vulnerability to temperature-related hazards: A meta-analysis and meta-knowledge approach. Glob. Environ. Chang. 2012, 22, 670–683. [Google Scholar] [CrossRef]
- Uejio, C.K.; Wilhelmi, O.V.; Golden, J.S.; Mills, D.M.; Gulino, S.P.; Samenow, J.P. Intra-urban societal vulnerability to extreme heat: The role of heat exposure and the built environment, socioeconomics, and neighborhood stability. Health Place 2011, 17, 498–507. [Google Scholar] [CrossRef] [PubMed]
- Johnson, D.P.; Wilson, J.S.; Luber, G.C. Socioeconomic indicators of heat-related health risk supplemented with remotely sensed data. Int. J. Health Geogr. 2009, 8. [Google Scholar] [CrossRef] [PubMed]
- Streutker, D.R. Satellite-measured growth of the urban heat island of Houston, Texas. Remote Sens. Environ. 2003, 85, 282–289. [Google Scholar] [CrossRef]
- Voogt, J.A.; Oke, T.R. Thermal remote sensing of urban climates. Remote Sens. Environ. 2003, 86, 370–384. [Google Scholar] [CrossRef]
- Gershunov, A.; Cayan, D.R.; Iacobellis, S.F. The Great 2006 Heat Wave over California and Nevada: Signal of an Increasing Trend. J. Clim. 2009, 22, 6181–6203. [Google Scholar] [CrossRef]
- Lin, H.L.; Zhang, Y.H.; Xu, Y.J.; Xu, X.J.; Liu, T.; Luo, Y.; Xiao, J.P.; Wu, W.; Ma, W.J. Temperature Changes between Neighboring Days and Mortality in Summer: A Distributed Lag Non-Linear Time Series Analysis. PLoS ONE 2013, 8. [Google Scholar] [CrossRef] [PubMed]
- Arnfield, A.J. Two decades of urban climate research: A review of turbulence, exchanges of energy and water, and the urban heat island. Int. J. Climatol. 2003, 23, 1–26. [Google Scholar] [CrossRef]
- Fernandez, F. Heat Islands. Understanding and mitigating heat in urban areas. Rev. Geogr. Norte Gd. 2009, 43, 119–121. [Google Scholar]
- Havenith, G. Temperature regulation, heat balance and climatic stress. Extreme Weather Events Public Health Responses 2005, 69–80. [Google Scholar] [CrossRef]
- Kershaw, S.E.; Millward, A.A. A spatio-temporal index for heat vulnerability assessment. Environ. Monit. Assess. 2012, 184, 7329–7342. [Google Scholar] [CrossRef] [PubMed]
- Robinson, P.J. On the definition of a heat wave. J. Appl. Meteorol. 2001, 40, 762–775. [Google Scholar] [CrossRef]
- Kim, H.; Ha, J.S.; Park, J. High temperature, heat index, and mortality in 6 major cities in South Korea. Arch. Environ. Occup. Health 2006, 61, 265–270. [Google Scholar] [CrossRef] [PubMed]
- Dikmen, S.; Hansen, P.J. Is the temperature-humidity index the best indicator of heat stress in lactating dairy cows in a subtropical environment? J. Dairy Sci. 2009, 92, 109–116. [Google Scholar] [CrossRef] [PubMed]
- Gronlund, C.J.; Berrocal, V.J.; White-Newsome, J.L.; Conlon, K.C.; O’Neill, M.S. Vulnerability to extreme heat by socio-demographic characteristics and area green space among the elderly in Michigan, 1990–2007. Environ. Res. 2015, 136, 449–461. [Google Scholar] [CrossRef] [PubMed]
- Rosenthal, J.K.; Kinney, P.L.; Metzger, K.B. Intra-urban vulnerability to heat-related mortality in New York City, 1997–2006. Health Place 2014, 30, 45–60. [Google Scholar] [CrossRef] [PubMed]
- Schwartz, J. Who is sensitive to extremes of temperature? A case-only analysis. Epidemiology 2005, 16, 67–72. [Google Scholar] [CrossRef] [PubMed]
- Dolney, T.J.; Sheridan, S.C. The relationship between extreme heat and ambulance response calls for the city of Toronto, Ontario, Canada. Environ. Res. 2006, 101, 94–103. [Google Scholar] [CrossRef] [PubMed]
- Bunyavanich, S.; Landrigan, C.P.; McMichael, A.J.; Epstein, P.R. The impact of climate change on child health. Ambul. Pediatr. 2003, 3, 44–52. [Google Scholar] [CrossRef]
- Xu, Z.; Sheffield, P.E.; Su, H.; Wang, X.; Bi, Y.; Tong, S. The impact of heat waves on children's health: A systematic review. Int. J. Biometeorol. 2014, 58, 239–247. [Google Scholar] [CrossRef] [PubMed] [Green Version]
- Curriero, F.C.; Heiner, K.S.; Samet, J.M.; Zeger, S.L.; Strug, L.; Patz, J.A. Temperature and mortality in 11 cities of the eastern United States. Amer. J. Epidemiol. 2002, 155, 80–87. [Google Scholar] [CrossRef]
- Semenza, J.C.; McCullough, J.E.; Flanders, W.D.; McGeehin, M.A.; Lumpkin, J.R. Excess hospital admissions during the July 1995 heat wave in Chicago. Am. J. Prev. Med. 1999, 16, 269–277. [Google Scholar] [CrossRef]
- O’Neill, M.S.; Zanobetti, A.; Schwartz, J. Modifiers of the temperature and mortality association in seven US cities. Amer. J. Epidemiol. 2003, 157, 1074–1082. [Google Scholar] [CrossRef]
- Rocklov, J.; Forsberg, B.; Ebi, K.; Bellander, T. Susceptibility to mortality related to temperature and heat and cold wave duration in the population of Stockholm County, Sweden. Glob. Health Action 2014. [Google Scholar] [CrossRef]
- Sun, X.; Sun, Q.; Zhou, X.; Li, X.; Yang, M.; Yu, A.; Geng, F. Heat wave impact on mortality in Pudong New Area, China in 2013. Sci. Total Environ. 2014, 493, 789–794. [Google Scholar] [CrossRef] [PubMed]
- Nitschke, M.; Hansen, A.; Bi, P.; Pisaniello, D.; Newbury, J.; Kitson, A.; Tucker, G.; Avery, J.; Dal Grande, E. Risk factors, health effects and behavior in older people during extreme heat: A survey in south Australia. Int. J. Environ. Res. Public Health 2013, 10, 6721–6733. [Google Scholar] [CrossRef] [PubMed] [Green Version]
- Stone, B.; Hess, J.J.; Frumkin, H. Urban form and extreme heat events: Are sprawling cities more vulnerable to climate change than compact cities? Environ. Health Perspect. 2010, 118, 1425–1428. [Google Scholar] [CrossRef] [PubMed]
- Wolf, J.; Adger, W.N.; Lorenzoni, I.; Abrahamson, V.; Raine, R. Social capital, individual responses to heat waves and climate change adaptation: An empirical study of two UK cities. Glob. Environ. Chang. 2010, 20, 44–52. [Google Scholar] [CrossRef]
- Tapsell, S.M.; Penning-Rowsell, E.C.; Tunstall, S.M.; Wilson, T.L. Vulnerability to flooding: Health and social dimensions. Philos. Trans. R. Soc. A 2002, 360, 1511–1525. [Google Scholar] [CrossRef] [PubMed]
- Turvey, R. Vulnerability assessment of developing countries: The case of small-island developing states. Dev. Policy Rev. 2007, 25, 243–264. [Google Scholar] [CrossRef]
- Ozceylan, D.; Coskun, E. The Relationship between Turkey’s Provinces’ Development Levels and Social and Economic Vulnerability to Disasters. J. Homel. Secur. Emerg. 2012, 9. [Google Scholar] [CrossRef]
- Brooks, N.; Adger, W.N.; Kelly, P.M. The determinants of vulnerability and adaptive capacity at the national level and the implications for adaptation. Glob. Environ. Chang. 2005, 15, 151–163. [Google Scholar] [CrossRef]
- Cutter, S.L.; Boruff, B.J.; Shirley, W.L. Social vulnerability to environmental hazards. Soc. Sci. Q. 2003, 84, 242–261. [Google Scholar] [CrossRef]
- Ahn, B.S.; Choi, S.H. Aggregation of ordinal data using ordered weighted averaging operator weights. Ann. Oper. Res. 2012, 201, 1–16. [Google Scholar] [CrossRef]
- Chuang, W.C.; Gober, P. Predicting hospitalization for heat-related illness at the census-tract level: Accuracy of a generic heat vulnerability index in phoenix, Arizona (USA). Environ. Health Perspect. 2015, 123, 606–612. [Google Scholar] [CrossRef] [PubMed]
© 2015 by the authors; licensee MDPI, Basel, Switzerland. This article is an open access article distributed under the terms and conditions of the Creative Commons Attribution license (http://creativecommons.org/licenses/by/4.0/).
Share and Cite
Bao, J.; Li, X.; Yu, C. The Construction and Validation of the Heat Vulnerability Index, a Review. Int. J. Environ. Res. Public Health 2015, 12, 7220-7234. https://doi.org/10.3390/ijerph120707220
Bao J, Li X, Yu C. The Construction and Validation of the Heat Vulnerability Index, a Review. International Journal of Environmental Research and Public Health. 2015; 12(7):7220-7234. https://doi.org/10.3390/ijerph120707220
Chicago/Turabian StyleBao, Junzhe, Xudong Li, and Chuanhua Yu. 2015. "The Construction and Validation of the Heat Vulnerability Index, a Review" International Journal of Environmental Research and Public Health 12, no. 7: 7220-7234. https://doi.org/10.3390/ijerph120707220