
Cellular Energy Allocation to Assess the Impact of Nanomaterials on Soil Invertebrates (Enchytraeids): The Effect of Cu and Ag


Abstract
:1. Introduction
2. Materials and Methods
2.1. Test Species
2.2. Test Soils
2.3. Test Chemicals and Characterization
2.4. Spiking Procedure

| Characteristic | COPPER | SILVER | ||||||
|---|---|---|---|---|---|---|---|---|
| CuNO3 | Cu-NPs | Cu-Nwires | AgNO3 | Ag-NPs Non-Coated | Ag-NPs PVP-coated | Ag NM300K | Dispersant (Tween 20) | |
| Supplier | Sigma Aldrich | American Elements | Synthesized [17] | Sigma Aldrich | AG-M-03M-NP.020N | AG-M-03M-NPCP.020N | JRC Repository | JRC Repository |
| (American Elements) | (American Elements) | |||||||
| State | Powder | Powder | Powder | Powder | Powder | Powder | Suspension | Suspension |
| Solubility | Water soluble | Not dispersed | Not dispersed | Water soluble | Not dispersed | Not dispersed | Dispersible | Soluble |
| Coating | - | - | - | - | - | 0.2%w/w PVP | - | - |
| nominal size (nm) | - | 20–30 | 90–120 nm diameter, 40–50 µm length | - | 20–30 | 20–30 | 15 | - |
| TEM/SEM (nm) | - | n.a. | 365 ± 100 nm diameter, > 10 µm length | - | 26 ± 4 | 25 ± 5 | 17 ± 8 | - |
| Purity | >99% | 99.8% | - | >99% | 99% | 99% | 10.2% w/w Ag | - |
| Morphology | flower like * | wires | Spherical * | Spherical * | Spherical | - | ||
| Material Tested | Control-EC20-EC50 (mg/kg) |
|---|---|
| COPPER | |
| CuNO3 | 0-290-360 |
| Cu-NPs | 0-980-1760 |
| Cu-Nwires | 0-850-1610 |
| Cu-Field | 0-500-1400 |
| SILVER | |
| AgNO3 | 0-45-60 |
| Ag-NPs PVP-coated | 0-380-550 |
| Ag-NPs Non-coated | 0-380-430 |
| Ag NM300K | Dispersant *-60-170 |
2.5. Experimental Details
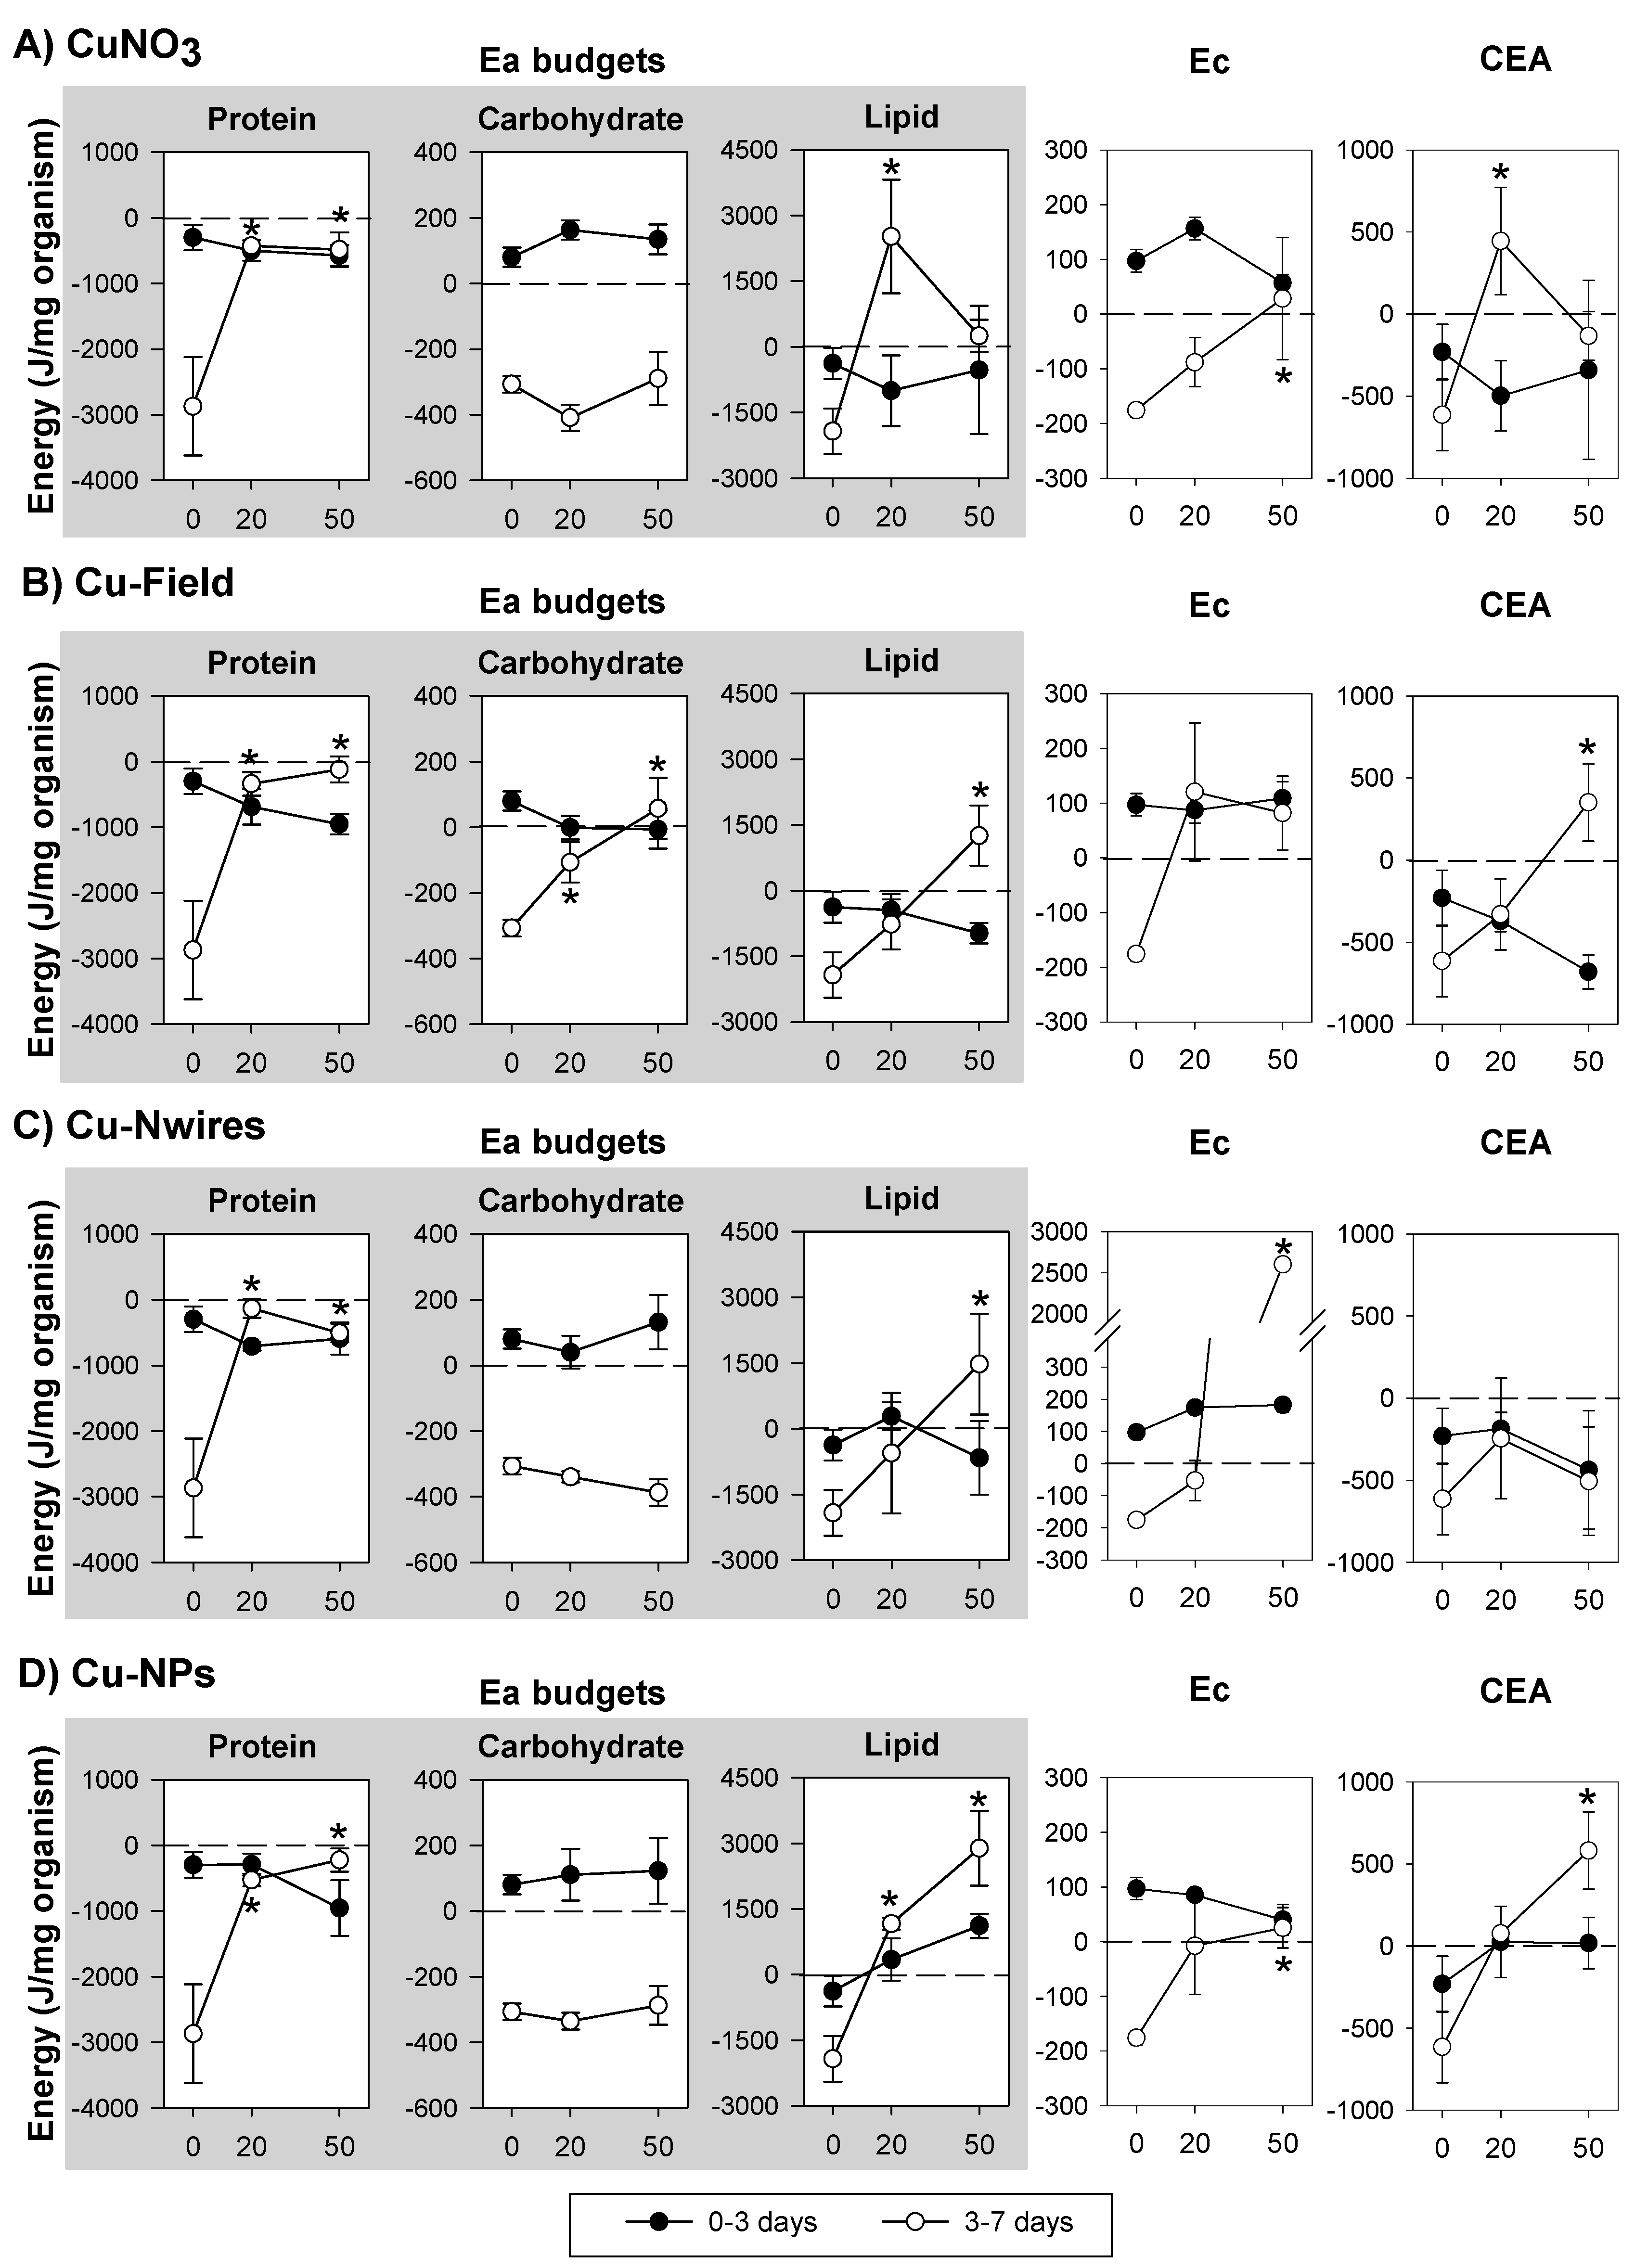
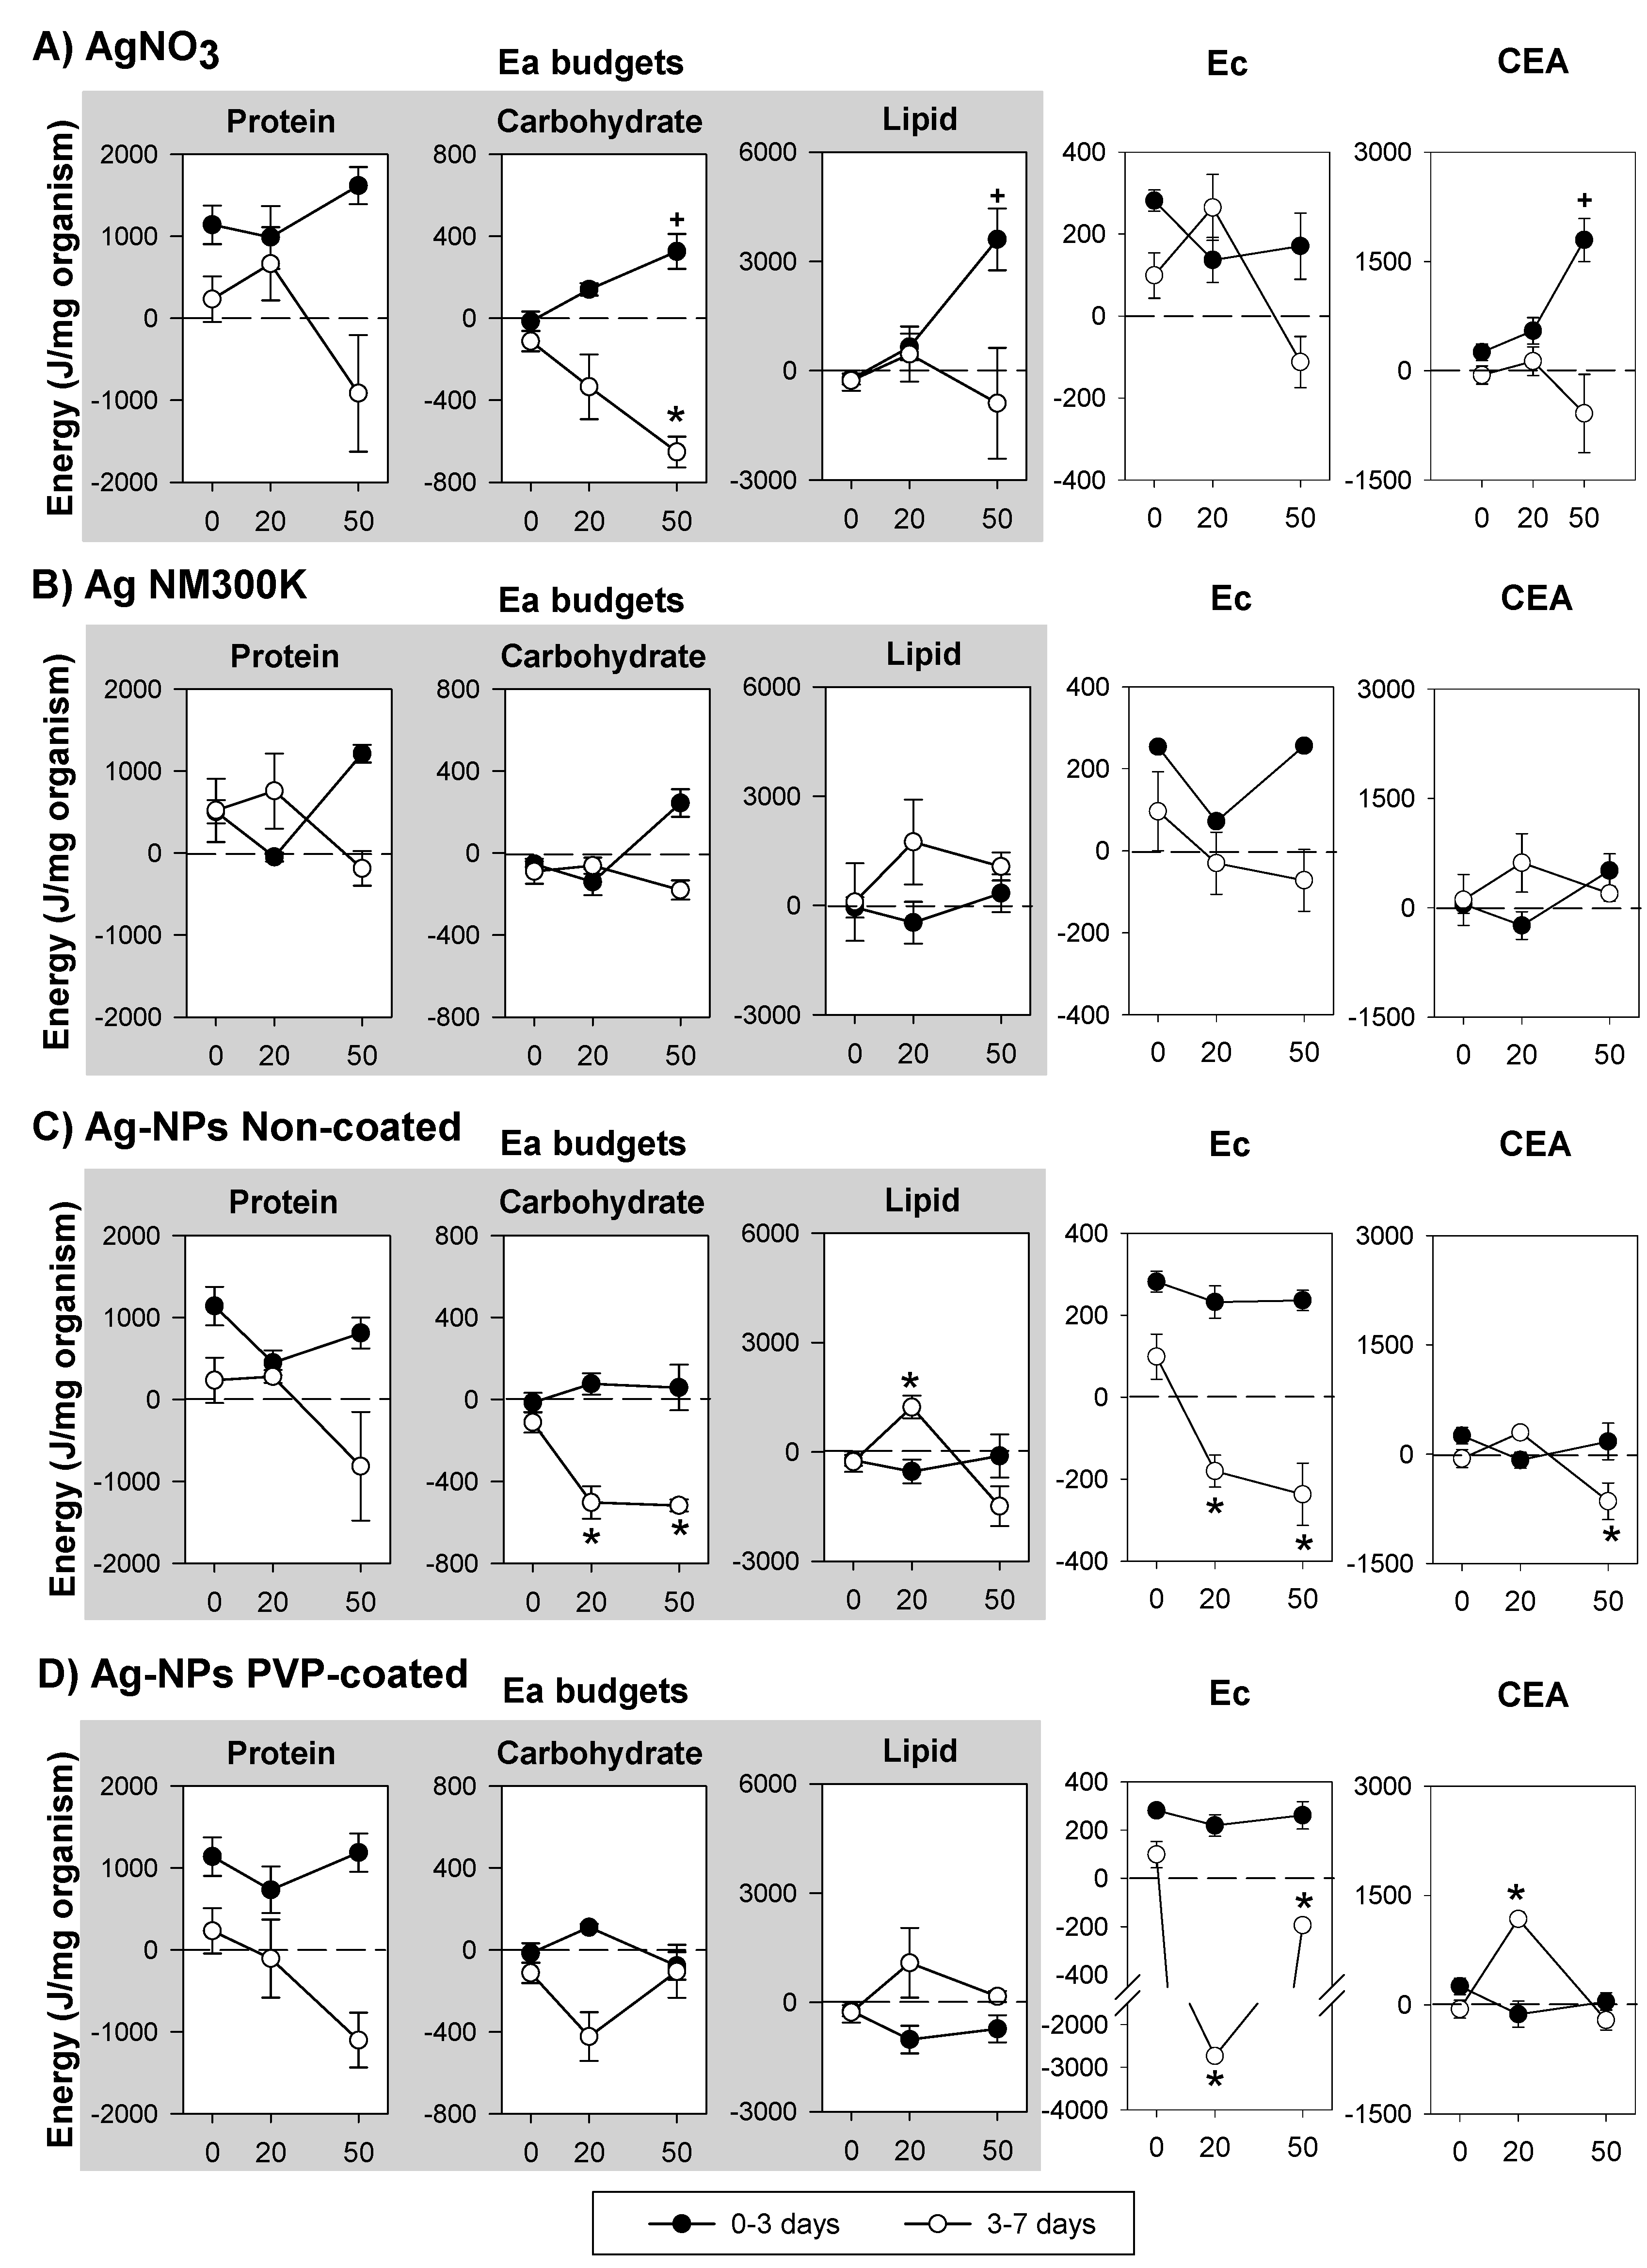
2.6. Energy Available—Ea
2.7. Energy Consumption—Ec
2.8. Cellular Energy Allocation—CEA
2.9. Statistical Analysis
3. Results
3.1. Copper Exposure

3.2. Silver Exposure


4. Discussion
4.1. Copper Exposure
4.2. Silver Exposure
4.3. Copper vs. Silver
5. Conclusions
Acknowledgments
Author Contributions
Conflicts of Interest
Appendix
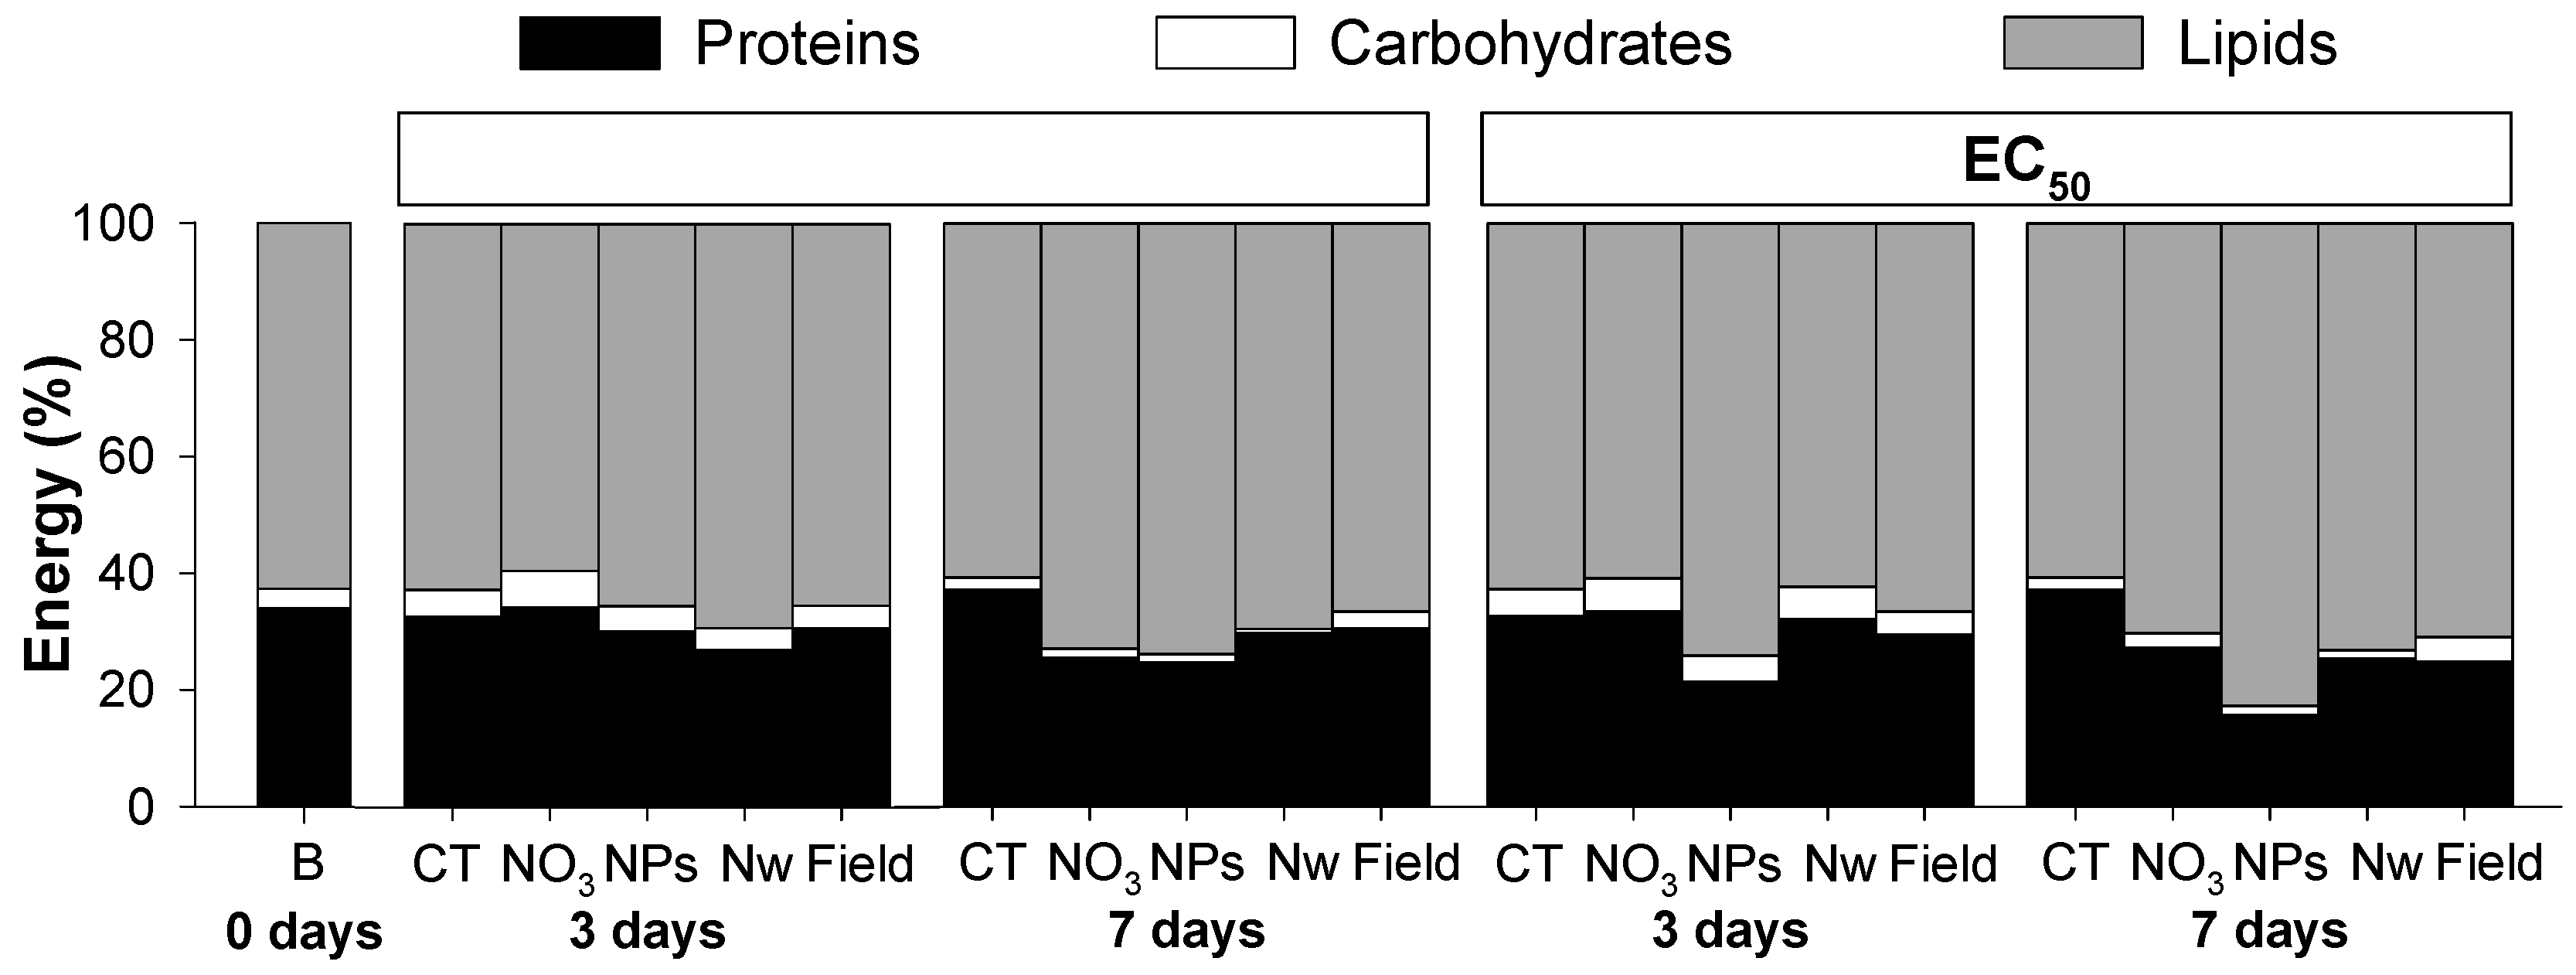
| Time | ECx | Treatment | % Proteins | % Carbohydrates | % Lipids |
|---|---|---|---|---|---|
| 0 days | Baseline | 34.1 | 3.2 | 62.7 | |
| 3 days | EC20 | CT | 32.8 | 4.6 | 62.7 |
| CuNO3 | 34.3 | 6.2 | 59.4 | ||
| Cu-NPs | 30.2 | 4.3 | 65.5 | ||
| Cu-Nwires | 26.9 | 3.8 | 69.2 | ||
| Cu-Field | 30.7 | 3.9 | 65.4 | ||
| EC50 | CT | 32.8 | 4.6 | 62.7 | |
| CuNO3 | 33.5 | 5.6 | 60.9 | ||
| Cu-NPs | 21.5 | 4.4 | 74.1 | ||
| Cu-Nwires | 32.2 | 5.5 | 62.3 | ||
| Cu-Field | 29.5 | 4.0 | 66.5 | ||
| 7 days | EC20 | CT | 37.2 | 2.1 | 60.7 |
| CuNO3 | 25.6 | 1.5 | 72.9 | ||
| Cu-NPs | 24.7 | 1.5 | 73.8 | ||
| Cu-Nwires | 29.8 | 0.8 | 69.5 | ||
| Cu-Field | 30.6 | 2.8 | 66.6 | ||
| EC50 | CT | 37.2 | 2.1 | 60.7 | |
| CuNO3 | 27.2 | 2.5 | 70.3 | ||
| Cu-NPs | 15.7 | 1.6 | 82.7 | ||
| Cu-Nwires | 25.4 | 1.4 | 73.2 | ||
| Cu-Field | 24.9 | 4.3 | 70.9 |
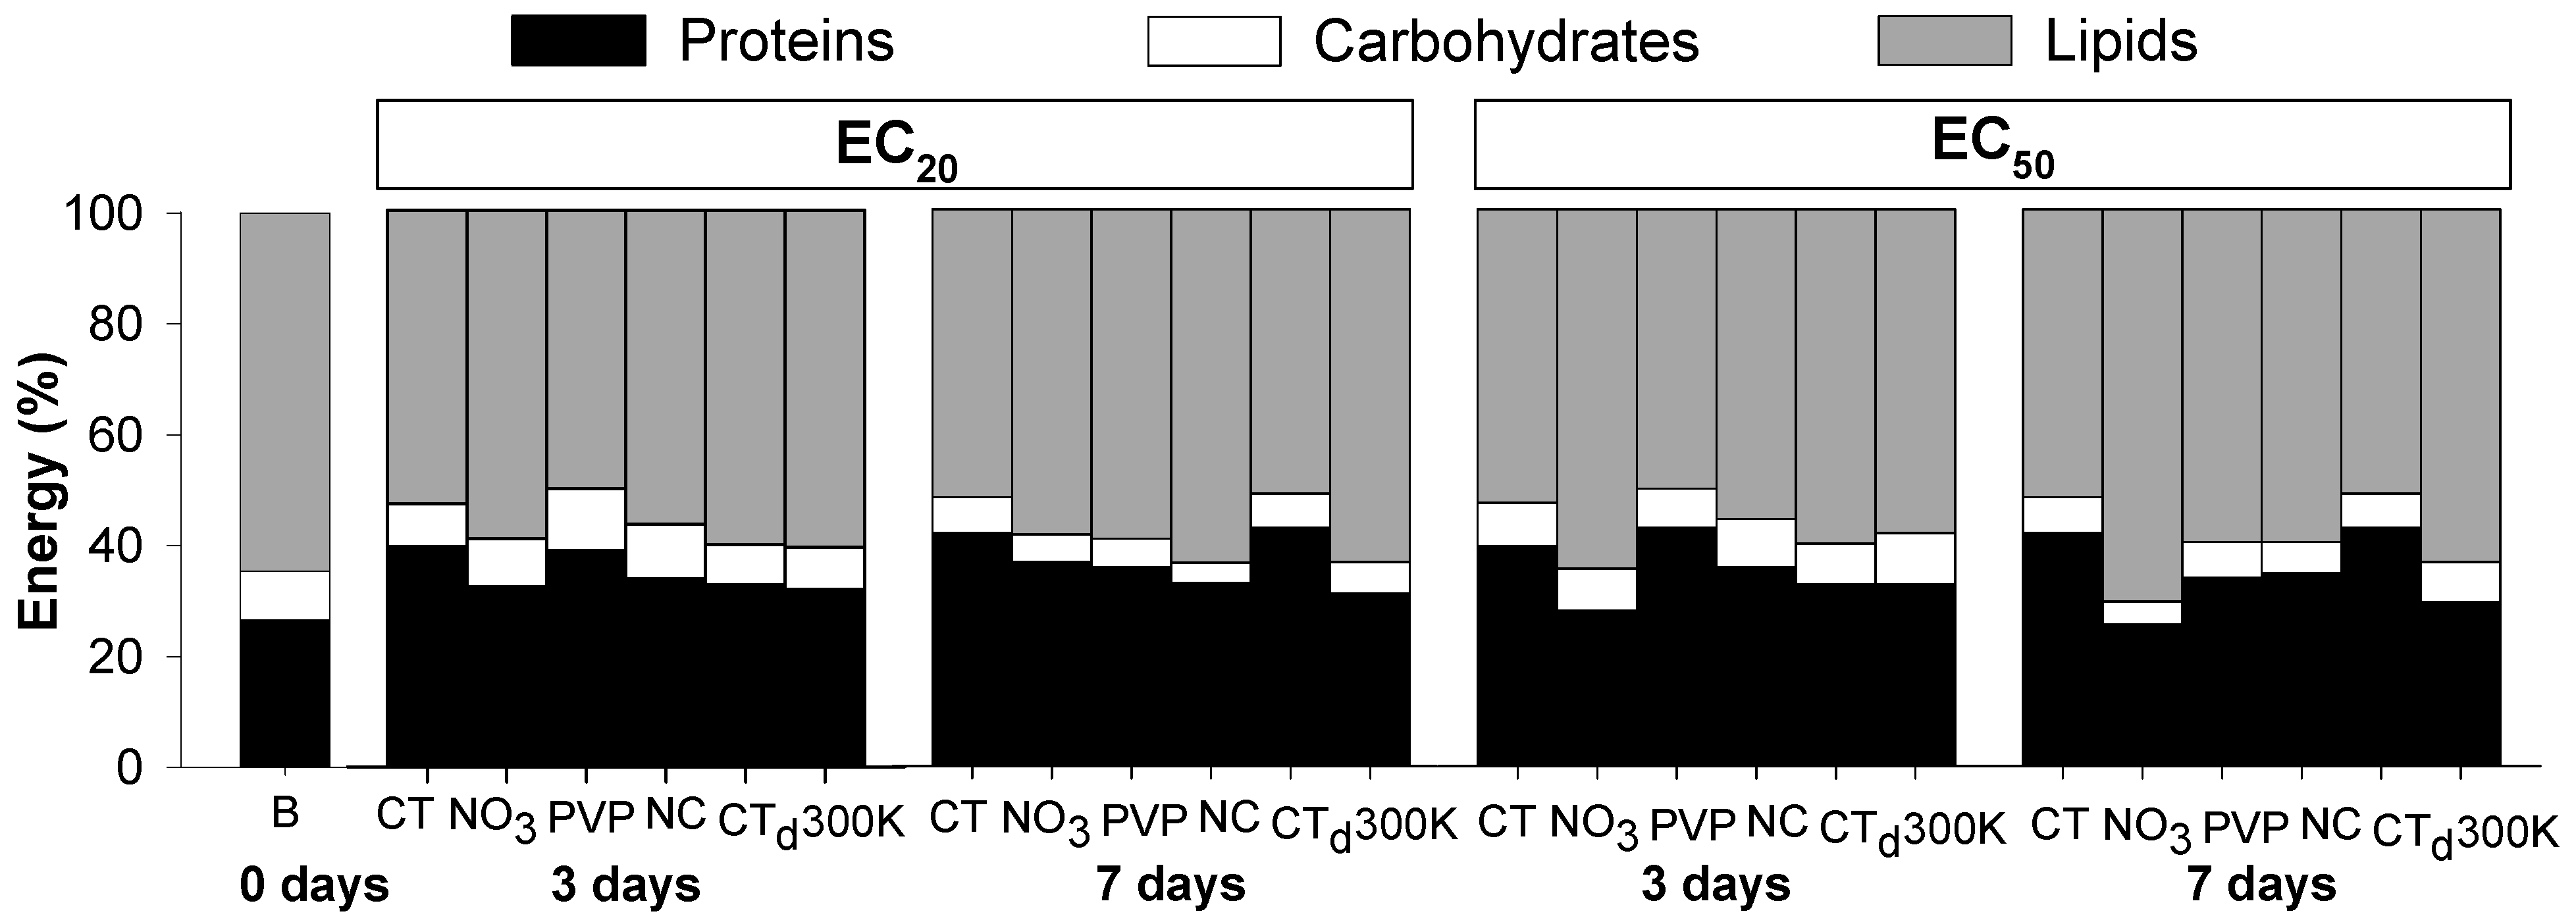
| Time | ECx | Treatment | % Proteins | % Carbohydrates | % Lipids |
|---|---|---|---|---|---|
| 0 days | Baseline | 26.6 | 8.7 | 64.7 | |
| 3 days | EC20 | CT | 39.5 | 7.8 | 52.7 |
| AgNO3 | 32.4 | 8.6 | 59.0 | ||
| Ag PVP-Coated | 38.9 | 11.1 | 50.0 | ||
| Ag Non-Coated | 33.7 | 9.9 | 56.4 | ||
| CT dispersant | 32.7 | 7.2 | 60.1 | ||
| Ag NM300K | 31.9 | 7.6 | 60.5 | ||
| EC50 | CT | 39.5 | 7.8 | 52.7 | |
| AgNO3 | 28.0 | 7.5 | 64.5 | ||
| Ag PVP-Coated | 42.9 | 7.0 | 50.1 | ||
| Ag Non-Coated | 35.7 | 8.6 | 55.7 | ||
| CT dispersant | 32.7 | 7.2 | 60.1 | ||
| Ag NM300K | 32.7 | 9.1 | 58.2 | ||
| 7 days | EC20 | CT | 41.9 | 6.4 | 51.7 |
| AgNO3 | 36.6 | 5.0 | 58.4 | ||
| Ag PVP-Coated | 35.7 | 5.1 | 59.2 | ||
| Ag Non-Coated | 32.9 | 3.6 | 63.5 | ||
| CT dispersant | 42.8 | 6.2 | 51.0 | ||
| Ag NM300K | 31.0 | 5.7 | 63.3 | ||
| EC50 | CT | 41.9 | 6.4 | 51.7 | |
| AgNO3 | 25.4 | 4.1 | 70.4 | ||
| Ag PVP-Coated | 33.9 | 6.4 | 59.7 | ||
| Ag Non-Coated | 34.7 | 5.5 | 59.8 | ||
| CT dispersant | 42.8 | 6.2 | 51.0 | ||
| Ag NM300K | 29.4 | 7.2 | 63.3 |
References
- Heckmann, L.-H.; Hovgaard, M.B.; Sutherland, D.S.; Autrup, H.; Besenbacher, F.; Scott-Fordsmand, J.J. Limit-Test toxicity screening of selected inorganic nanoparticles to the earthworm Eisenia fetida. Ecotoxicology 2011, 20, 226–233. [Google Scholar] [CrossRef] [PubMed]
- Amorim, M.J.B.; Scott-Fordsmand, J.J. Toxicity of Copper nanoparticles and CuCl2 salt to Enchytraeus albidus worms: Survival, reproduction and avoidance responses. Environ. Pollut. 2012, 164, 164–168. [Google Scholar] [CrossRef] [PubMed]
- Gomes, S.I.L.; Soares, A.M.V.M.; Scott-Fordsmand, J.J.; Amorim, M.J.B. Mechanisms of response to silver nanoparticles on Enchytraeus albidus (Oligochaeta): Survival, reproduction and gene expression profile. J. Hazard. Mater. 2013, 254–255, 336–344. [Google Scholar] [CrossRef] [PubMed]
- Gomes, S.I.L.; Novais, S.C.; Gravato, C.; Guilhermino, L.; Scott-Fordsmand, J.J.; Soares, A.M.V.M.; Amorim, M.J.B. Effect of Cu-nanoparticles versus one Cu-salt: Analysis of stress and neuromuscular biomarkers response in Enchytraeus albidus (Oligochaeta). Nanotoxicology 2012, 6, 134–143. [Google Scholar] [CrossRef] [PubMed]
- Hayashi, Y.; Engelmann, P.; Foldbjerg, R.; Szabo, M.; Somogyi, I.; Pollak, E.; Molnar, L.; Autrup, H.; Sutherland, D.S.; Scott-Fordsmand, J.; et al. Earthworms and Humans in Vitro: Characterizing Evolutionarily Conserved Stress and Immune Responses to Silver Nanoparticles. Environ. Sci. Technol. 2012, 46, 4166–4173. [Google Scholar] [CrossRef] [PubMed]
- Lapied, E.; Moudilou, E.; Exbrayat, J.M.; Oughton, D.H.; Joner, E.J. Silver nanoparticle exposure causes apoptotic response in the earthworm Lumbricus terrestris (Oligochaeta). Nanomedicine 2010, 5, 975–984. [Google Scholar] [CrossRef] [PubMed]
- Calow, P. Physiological costs of combating chemical toxicants: Ecological implications. Comp. Biochem. Physiol. C. 1991, 100, 3–6. [Google Scholar] [CrossRef]
- De Coen, W.M.; Janssen, C.R. The missing biomarker link: Relationships between effects on the cellular energy allocation biomarker of toxicant-stressed Daphnia magna and corresponding population characteristics. Env. Toxicol. Chem. 2003, 22, 1632–1641. [Google Scholar] [CrossRef]
- De Coen, W.M.; Janssen, C.R. The use of biomarkers in Daphnia magna toxicity testing. IV. Cellular Energy Allocation: A new methodology to assess the energy budget of toxicant-stressed Daphnia populations. J. Aquat. Ecosyst. Stress Recover. 1997, 6, 43–55. [Google Scholar] [CrossRef]
- Novais, S.C.; Soares, A.M.V.M.; de Coen, W.; Amorim, M.J.B. Exposure of Enchytraeus albidus to Cd and Zn—Changes in cellular energy allocation (CEA) and linkage to transcriptional, enzymatic and reproductive effects. Chemosphere 2013, 90, 1305–1309. [Google Scholar] [CrossRef] [PubMed]
- Novais, S.C.; Amorim, M.J.B. Changes in cellular energy allocation in Enchytraeus albidus when exposed to dimethoate, atrazine, and carbendazim. Environ. Toxicol. Chem. 2013, 32, 2800–2807. [Google Scholar] [CrossRef] [PubMed]
- Smolders, R.; Bervoets, L.; de Coen, W.; Blust, R. Cellular energy allocation in zebra mussels exposed along a pollution gradient: Linking cellular effects to higher levels of biological organization. Environ. Pollut. 2004, 129, 99–112. [Google Scholar] [CrossRef] [PubMed]
- International Organization for Standardization. ISO Soil Quality—Effects of Pollutants on Enchytraeidae (Enchytraeus sp.). Determination of Effects on Reproduction and Survival; Guideline No 16387; International Organization for Standardization: Geneva, Switzerland, 2005. [Google Scholar]
- Organization for Economic Cooperation and Development. OECD Guidelines for the Testing of Chemicals No. 220. Enchytraeid Reproduction Test; Organization for Economic Cooperation and Development: Paris, France, 2004. [Google Scholar]
- Castro-Ferreira, M.P.; Roelofs, D.; van Gestel, C.A.M.; Verweij, R.A.; Soares, A.M.V.M.; Amorim, M.J.B. Enchytraeus crypticus as model species in soil ecotoxicology. Chemosphere 2012, 87, 1222–1227. [Google Scholar] [CrossRef] [PubMed]
- Scott-Fordsmand, J.J.; Krogh, P.H.; Weeks, J.M. Responses of Folsomia fimetaria (Collembola: Isotomidae) to copper under different soil copper contamination histories in relation to risk assessment. Environ. Toxicol. Chem. 2000, 19, 1297–1303. [Google Scholar] [CrossRef]
- Chang, Y.; Lye, M.L.; Zeng, H.C. Large-Scale Synthesis of High-Quality Ultralong Copper Nanowires. Langmuir 2005, 21, 3746–3748. [Google Scholar] [CrossRef] [PubMed]
- Gomes, S.I.L.; Murphy, M.; Nielsen, M.T.; Kristiansen, S.M.; Amorim, M.J.B.; Scott-Fordsmand, J.J. Cu-Nanoparticles Ecotoxicity—Explored and Explained. (Submitted).
- Pegoraro, N.; Amorim, M.; Scott-Fordsmand, J. Does one AgNP represent another AgNP in hazard testing and does it just come down to ions release? In Proceedings of SETAC Europe 23rd Annual Meeting, Glasgow, UK, 12–16 May 2013.
- Gomes, S.I.L.; Soares, A.M.V.M.; Amorim, M.J.B. Changes in cellular energy allocation in Enchytraeus crypticus exposed to copper and silver-linkage to effects at higher level (reproduction). Environ. Sci. Pollut. Res. 2015, 5. [Google Scholar] [CrossRef] [PubMed]
- Bligh, E.G.; Dyer, W.J. A Rapid Method of Total Lipid Extraction and Purification. Can. J. Biochem. Physiol. 1959, 37, 911–917. [Google Scholar] [CrossRef] [PubMed]
- Bradford, M.M. Rapid and Sensitive Method for Quantitation of Microgram Quantities of Protein Utilizing Principle of Protein-Dye Binding. Anal. Biochem. 1976, 72, 248–254. [Google Scholar] [CrossRef]
- King, F.; Packard, T. Respiration and the activity of the respiratory electron transport system in marine zooplankton. Limnol. Ocean. 1975, 20, 849–854. [Google Scholar] [CrossRef]
- Gnaiger, E. Calculation of Energetic and Biochemical Equivalents of Respiratory Oxygen Consumption. In Polarographic Oxygen Sensors SE—30; Gnaiger, E., Forstner, H., Eds.; Springer: Berlin/Heidelberg, Germany, 1983; pp. 337–345. [Google Scholar]
- Bednarska, A.J.; Stachowicz, I.; Kuriańska, L. Energy reserves and accumulation of metals in the ground beetle Pterostichus oblongopunctatus from two metal-polluted gradients. Environ. Sci. Pollut. Res. Int. 2013, 20, 390–398. [Google Scholar] [CrossRef] [PubMed]
- Erk, M.; Ivanković, D.; Strižak, Ž. Cellular energy allocation in mussels (Mytilus galloprovincialis) from the stratified estuary as a physiological biomarker. Mar. Pollut. Bull. 2011, 62, 1124–1129. [Google Scholar] [CrossRef] [PubMed]
- Amorim, M.J.B.; Gomes, S.I.L.; Soares, A.M.V.M.; Scott-Fordsmand, J.J. Energy Basal Levels and Allocation among Lipids, Proteins, and Carbohydrates in Enchytraeus albidus: Changes Related to Exposure to Cu Salt and Cu Nanoparticles. Water Air Soil Pollut. 2012, 223, 477–482. [Google Scholar] [CrossRef]
- Verslycke, T.; Janssen, C.R. Effects of a changing abiotic environment on the energy metabolism in the estuarine mysid shrimp Neomysis integer (Crustacea: Mysidacea). J. Exp. Mar. Biol. Ecol. 2002, 279, 61–72. [Google Scholar] [CrossRef]
- Sroda, S.; Cossu-Leguille, C. Effects of sublethal copper exposure on two gammarid species: Which is the best competitor? Ecotoxicology 2011, 20, 264–273. [Google Scholar] [CrossRef] [PubMed]
- Smolders, R.; de Boeck, G.; Blust, R. Changes in cellular energy budget as a measure of whole effluent toxicity in zebrafish (Danio rerio). Environ. Toxicol. Chem. 2003, 22, 890–899. [Google Scholar] [CrossRef] [PubMed]
- Sarkar, A.; Das, J.; Manna, P.; Sil, P.C. Nano-Copper induces oxidative stress and apoptosis in kidney via both extrinsic and intrinsic pathways. Toxicology 2011, 290, 208–217. [Google Scholar] [CrossRef] [PubMed]
- Unrine, J.M.; Tsyusko, O.V.; Hunyadi, S.E.; Judy, J.D.; Bertsch, P.M. Effects of Particle Size on Chemical Speciation and Bioavailability of Copper to Earthworms (Eisenia fetida) Exposed to Copper Nanoparticles. J. Environ. Qual. 2010, 39, 1942–1953. [Google Scholar] [CrossRef] [PubMed]
- Midander, K.; Cronholm, P.; Karlsson, H.L.; Elihn, K.; Möller, L.; Leygraf, C.; Wallinder, I.O. Surface characteristics, copper release, and toxicity of nano- and micrometer-sized copper and copper(II) oxide particles: A cross-disciplinary study. Small 2009, 5, 389–399. [Google Scholar] [CrossRef] [PubMed]
- Gomes, S.I.L.; Novais, S.C.; Scott-Fordsmand, J.J.; de Coen, W.; Soares, A.M.V.M.; Amorim, M.J.B. Effect of Cu-nanoparticles versus Cu-salt in Enchytraeus albidus (Oligochaeta): Differential gene expression through microarray analysis. Comp. Biochem. Physiol. Part C 2012, 155, 219–227. [Google Scholar] [CrossRef] [PubMed]
- Griffitt, R.J.; Weil, R.; Hyndman, K.A.; Denslow, N.D.; Powers, K.; Taylor, D.; Barber, D.S. Exposure to copper nanoparticles causes gill injury and acute lethality in zebrafish (Danio rerio). Environ. Sci. Technol. 2007, 41, 8178–8186. [Google Scholar] [CrossRef] [PubMed]
- Einicker-Lamas, M.; Mezian, G.A.; Fernandes, T.B.; Silva, F.L.S.; Guerra, F.; Miranda, K.; Attias, M.; Oliveira, M.M. Euglena gracilis as a model for the study of Cu2+ and Zn2+ toxicity and accumulation in eukaryotic cells. Environ. Pollut. 2002, 120, 779–786. [Google Scholar] [CrossRef]
- Kennedy, D.C.; Lyn, R.K.; Pezacki, J.P. Cellular lipid metabolism is influenced by the coordination environment of copper. J. Am. Chem. Soc. 2009, 131, 2444–2445. [Google Scholar] [CrossRef] [PubMed]
- Nielsen, M.T.; Scott-Fordsmand, J.J.; Murphy, M.W.; Kristiansen, S.M. Speciation and solubility of copper along a soil contamination gradient. J. Soils Sediments 2015, 3. [Google Scholar] [CrossRef]
- Lorenzon, S.; Francese, M.; Ferrero, E.A. Heavy metal toxicity and differential effects on the hyperglycemic stress response in the shrimp Palaemon elegans. Arch. Environ. Contam. Toxicol. 2000, 39, 167–176. [Google Scholar] [CrossRef] [PubMed]
- Enuneku, A.A.; Ayobahan, S.U. Sublethal Toxic effects of spent Oil Based Drilling Mud and Cuttings to Earthworm Aporrectodea longa. J. Appl. Sci. Environ. Manag. 2014, 18, 615–620. [Google Scholar]
- Bednarska, A.J.; Gerhardt, A.; Laskowski, R. Locomotor activity and respiration rate of the ground beetle, Pterostichus oblongopunctatus (Coleoptera: Carabidae), exposed to elevated nickel concentration at different temperatures: Novel application of Multispecies Freshwater Biomonitor. Ecotoxicology 2010, 19, 864–871. [Google Scholar] [CrossRef] [PubMed]
- Ketpadung, R.; Tangkrock-olan, N. Changes in oxygen consumption and heart rate of the blue swimming crab, Portunus pelagicus (Linnaeus, 1766) following exposure to sublethal concentrations of copper. J. Environ. Biol. 2006, 27, 7–12. [Google Scholar] [PubMed]
- Waser, W.; Sahoo, T.P.; Herczeg, G.; Merilä, J.; Nikinmaa, M. Physiological differentiation among nine-spined stickleback populations: Effects of copper exposure. Aquat. Toxicol. 2010, 98, 188–195. [Google Scholar] [CrossRef] [PubMed]
- Munari, C.; Mistri, M. Effect of copper on the scope for growth of clams (Tapes philippinarum) from a farming area in the Northern Adriatic Sea. Mar. Environ. Res. 2007, 64, 347–357. [Google Scholar] [CrossRef] [PubMed]
- Muller, E.B.; Hanna, S.K.; Lenihan, H.S.; Miller, R.J.; Nisbet, R.M. Impact of engineered zinc oxide nanoparticles on the energy budgets of Mytilus galloprovincialis. J. Sea Res. 2014, 94, 29–36. [Google Scholar] [CrossRef]
- De Boeck, G.; Vlaeminck, A.; Blust, R. Environmental Contamination and Toxicology Effects of Sublethal Copper Exposure on Copper Accumulation , Food Consumption , Growth , Energy Stores, and Nucleic Acid Content in Common Carp. Arch. Environ. Contam. Toxicol. 1997, 422, 415–422. [Google Scholar] [CrossRef]
- Moolman, L.; van Vuren, J.H.J.; Wepener, V. Comparative studies on the uptake and effects of cadmium and zinc on the cellular energy allocation of two freshwater gastropods. Ecotoxicol. Environ. Saf. 2007, 68, 443–450. [Google Scholar] [CrossRef] [PubMed]
- Soetaert, A.; Vandenbrouck, T.; van der Ven, K.; Maras, M.; van Remortel, P.; Blust, R.; de Coen, W.M. Molecular responses during cadmium-induced stress in Daphnia magna: Integration of differential gene expression with higher-level effects. Aquat. Toxicol. 2007, 83, 212–222. [Google Scholar] [CrossRef] [PubMed]
- Vandenbrouck, T.; Soetaert, A.; van der Ven, K.; Blust, R.; De Coen, W. Nickel and binary metal mixture responses in Daphnia magna: Molecular fingerprints and (sub)organismal effects. Aquat. Toxicol. 2009, 92, 18–29. [Google Scholar] [CrossRef] [PubMed]
- Tripathi, P.K.; Singh, A. Toxic Effects of Dimethoate and Carbaryl Pesticides on Carbohydrate Metabolism of Freshwater Snail Lymnaea acuminata. Bull. Environ. Contam. Toxicol. 2002, 68, 606–611. [Google Scholar] [CrossRef] [PubMed]
- Vijayavel, K.; Balasubramanian, M.P. Fluctuations of biochemical constituents and marker enzymes as a consequence of naphthalene toxicity in the edible estuarine crab Scylla serrata. Ecotoxicol. Environ. Saf. 2006, 63, 141–147. [Google Scholar] [CrossRef] [PubMed]
- Ma, K.L.; Ruan, X.Z.; Powis, S.H.; Chen, Y.; Moorhead, J.F.; Varghese, Z. Inflammatory stress exacerbates lipid accumulation in hepatic cells and fatty livers of apolipoprotein E knockout mice. Hepatology 2008, 48, 770–781. [Google Scholar] [CrossRef] [PubMed]
- Prasad, R.Y.; McGee, J.K.; Killius, M.G.; Suarez, D.A.; Blackman, C.F.; DeMarini, D.M.; Simmons, S.O. Investigating oxidative stress and inflammatory responses elicited by silver nanoparticles using high-throughput reporter genes in HepG2 cells: Effect of size, surface coating, and intracellular uptake. Toxicol. Vitro 2013, 27, 2013–2021. [Google Scholar] [CrossRef] [PubMed]
- Ivask, A.; Elbadawy, A.; Kaweeteerawat, C.; Boren, D.; Fischer, H.; Ji, Z.; Chang, C.H.; Liu, R.; Tolaymat, T.; Telesca, D.; et al. Toxicity mechanisms in Escherichia coli vary for silver nanoparticles and differ from ionic silver. ACS Nano 2014, 8, 374–386. [Google Scholar] [CrossRef] [PubMed]
- Cornelis, G.; DooletteMadeleine Thomas, C.; McLaughlin, M.J.; Kirby, J.K.; Beak, D.G.; Chittleborough, D. Retention and Dissolution of Engineered Silver Nanoparticles in Natural Soils. Soil Sci. Soc. Am. J. 2012, 76. [Google Scholar] [CrossRef]
- Shoults-Wilson, W.A.; Reinsch, B.C.; Tsyusko, O.V.; Bertsch, P.M.; Lowry, G.V.; Unrine, J.M. Effect of silver nanoparticle surface coating on bioaccumulation and reproductive toxicity in earthworms (Eisenia fetida). Nanotoxicology 2011, 5, 432–444. [Google Scholar] [CrossRef] [PubMed]
- Jiang, X.; Miclăuş, T.; Wang, L.; Foldbjerg, R.; Sutherland, D.S.; Autrup, H.; Chen, C.; Beer, C. Fast intracellular dissolution and persistent cellular uptake of silver nanoparticles in CHO-K1 cells: Implication for cytotoxicity. Nanotoxicology 2014, 4. [Google Scholar] [CrossRef] [PubMed]
- AshaRani, P.V.; Mun, G.L.K.; Hande, M.P.; Valiyaveettil, S. Cytotoxicity and Genotoxicity of Silver Nanoparticles in Human Cells. ACS Nano 2009, 3, 279–290. [Google Scholar] [CrossRef] [PubMed]
- Bragg, P.D.; Rainnie, D.J. The effect of silver ions on the respiratory chain of Escherichia coli. Can. J. Microbiol. 1974, 20, 883–889. [Google Scholar] [CrossRef] [PubMed]
- Costa, C.S.; Ronconi, J.V.V.; Daufenbach, J.F.; Gonçalves, C.L.; Rezin, G.T.; Streck, E.L.; da Paula, M.M.S. In vitro effects of silver nanoparticles on the mitochondrial respiratory chain. Mol. Cell. Biochem. 2010, 342, 51–56. [Google Scholar] [CrossRef] [PubMed]
- Ahn, J.-M.; Eom, H.-J.; Yang, X.; Meyer, J.N.; Choi, J. Comparative toxicity of silver nanoparticles on oxidative stress and DNA damage in the nematode, Caenorhabditis elegans. Chemosphere 2014, 108, 343–352. [Google Scholar] [CrossRef] [PubMed]
© 2015 by the authors; licensee MDPI, Basel, Switzerland. This article is an open access article distributed under the terms and conditions of the Creative Commons Attribution license (http://creativecommons.org/licenses/by/4.0/).
Share and Cite
Gomes, S.I.L.; Scott-Fordsmand, J.J.; Amorim, M.J.B. Cellular Energy Allocation to Assess the Impact of Nanomaterials on Soil Invertebrates (Enchytraeids): The Effect of Cu and Ag. Int. J. Environ. Res. Public Health 2015, 12, 6858-6878. https://doi.org/10.3390/ijerph120606858
Gomes SIL, Scott-Fordsmand JJ, Amorim MJB. Cellular Energy Allocation to Assess the Impact of Nanomaterials on Soil Invertebrates (Enchytraeids): The Effect of Cu and Ag. International Journal of Environmental Research and Public Health. 2015; 12(6):6858-6878. https://doi.org/10.3390/ijerph120606858
Chicago/Turabian StyleGomes, Susana I. L., Janeck J. Scott-Fordsmand, and Mónica J. B. Amorim. 2015. "Cellular Energy Allocation to Assess the Impact of Nanomaterials on Soil Invertebrates (Enchytraeids): The Effect of Cu and Ag" International Journal of Environmental Research and Public Health 12, no. 6: 6858-6878. https://doi.org/10.3390/ijerph120606858