Article

Simultaneous Exposure to Heavy Metals among Residents in the Industrial Complex: Korean National Cohort Study

1
Department of Environmental Health Science, Soonchunhyang University, 22 Soonchunhyang-ro, Asan-si, 336-745, Korea
2
Department of Occupational Epidemiology, Samsung Health Research Institute, Samsung Electronics, Suwon city 443-742, Korea
3
Department of Industrial Health, Catholic University of Pusan, 57 Oryundae-ro, Geumjeong-gu, Busan, 609-817, Korea
4
Department of Environmental Health, National Institute of Environment Research, 42 Hwangyeong-ro, Incheon, 404-170, Korea
5
School of Public Health, Seoul National University, 1 Gwanak-ro, Seoul, 151-015, Korea
*
Author to whom correspondence should be addressed.
Int. J. Environ. Res. Public Health 2015, 12(6), 5905-5917; https://doi.org/10.3390/ijerph120605905
Submission received: 8 March 2015 / Accepted: 15 May 2015 / Published: 27 May 2015

Abstract

:
A survey was conducted to evaluate the multi-exposure level and correlation among toxic metal biomarkers (Cd, Pb, and Hg). A total of 592 individuals who participated in the survey were residents near an industrial complex in Gwangyang and Yeosu (exposed group) and of Hadong and Namhae (control group) in southern Korea from May 2007 to November 2010. The Gwangyang and Yeosu area exposed groups had slightly higher blood Pb (2.21 and 1.90 µg/dL), urinary Cd observed values (2.20 and 1.46 µg/L), urinary Cd with a urinary creatinine correction (1.43 and 1.25 µg/g Cr), and urinary Hg observed values (2.26 and 0.98 µg/L) in women participants than those in the Hadong and Namhae area (control group). Blood Pb (3.18 and 2.55 µg/dL), urinary Hg observed values (1.14 and 0.92 µg/L), and urinary Hg with a urinary creatinine correction (1.06 and 0.96 µg/L) for male participants were also slightly higher than those in the Hadong and Namhae area (control group). The correlation among urinary Cd, Hg and Pb concentrations in the blood was significant. We suggest that the exposed group of residents were simultaneously exposed to Pb, Cd, and Hg from contaminated ambient air originating from the iron manufacturing industrial complex.

1. Introduction

National and international environmental pollution and disease problems continue to rise, and the WHO reported that 25%–35% of diseases in developed countries are due to environmental factors [1]. The South Korean government has led the development of petrochemical, non-ferrous metal, shipbuilding, automotive industries, and urbanization since the 1960s, according to heavy chemical industry development policies. Thus, the type and amount of harmful substances entering the environment has increased rapidly, and the chances for exposure have increased [2,3,4]. Environmental policies are no longer sufficient to prevent pollution and protect the public, which deserves safe environmental quality [2,5]. The country’s leading industrial parks, container terminals, steel and thermal power plants, and other industries are arranged primarily in Gwangyang Bay, as a symbol of Korean’s industrial area [6]. The pollution generated due to increased industrial demand not only affects the surrounding areas of this industrial park but continues throughout society [7]. Health problems are emerging as an important issue in these areas with the increased use of various heavy metals [2,8,9]. The Environmental Protection Agency in the USA, the National Environmental Exposure Concentration [10], and the National Institute for Occupational Safety and Health (NIOSH) have assessed the impact of environmental pollutants through a variety of occupational disease systems. In particular, the Adult Blood Lead Epidemiology and Surveillance analyzes blood lead (Pb) levels. If blood Pb level is >25 µg/dL, it is directly reported to the main monitoring center, and they analyze and send information about the number of cases, people, age distribution, and concentration to the NIOSH who operates a reporting system [11]. Cadmium (Cd) accumulates and damages the liver, kidney, and reproductive organs, and also accumulates in the cardiovascular system [12]. As Cd exposure increases, the impact on the cardiovascular disease becomes more serious [13,14]. Pb is harmful to the nervous, renal, and endocrine systems, and low concentrations can elevate blood pressure and increase the risk of heart disease [15,16]. Mercury (Hg) accumulates in the body and damages the central nervous system as well as increases the prevalence of cardiovascular disease [17], coronary heart disease, and mortality [18]. However, the accumulation of heavy metals in the body is affected by age, ethnicity, and lifestyle and is also influenced by the intensity and duration of exposure. Environmental epidemiology studies are needed to evaluate the effects of the current level of environmental pollution in the Gwangyang industrial complex.
In this study, we continuously and systematically monitored and evaluated Pb in blood (B-Pb), Cd in urine as an observed value (U-Cd), Cd in urine as urinary creatinine correction (U-Cd cr), Hg in urine as an observed value (U-Hg), and Hg in urine as urinary creatinine correction (U-Hg cr) in residents of the Gwangyang and Yeosu industrial complex areas.

2. Methods

2.1. Geographic Features

The east-west distance across Gwangyang Bay is 27 km, and it is 15 km wide from north to south. The Bay is surrounded by Gwangyang, Yeosu, Namhae, Hadong as a closed-coast; thus, pollutants spread out and become isolated in this area (Figure 1). The wind flows mainly south in summer and northeast in winter, which influences the damage caused by the air pollutants. In addition, water depth is low and the ocean tidal flow is slow; thus, water recovery from pollution is weak. Gwangyang Bay is adjacent to a residential area, and the pollutants emitted travel with the sea breeze toward a residential area.
Figure 1. Map of the Gwangyang bay industrial complex in the Republic of Korea.
Ijerph 12 05905 g001

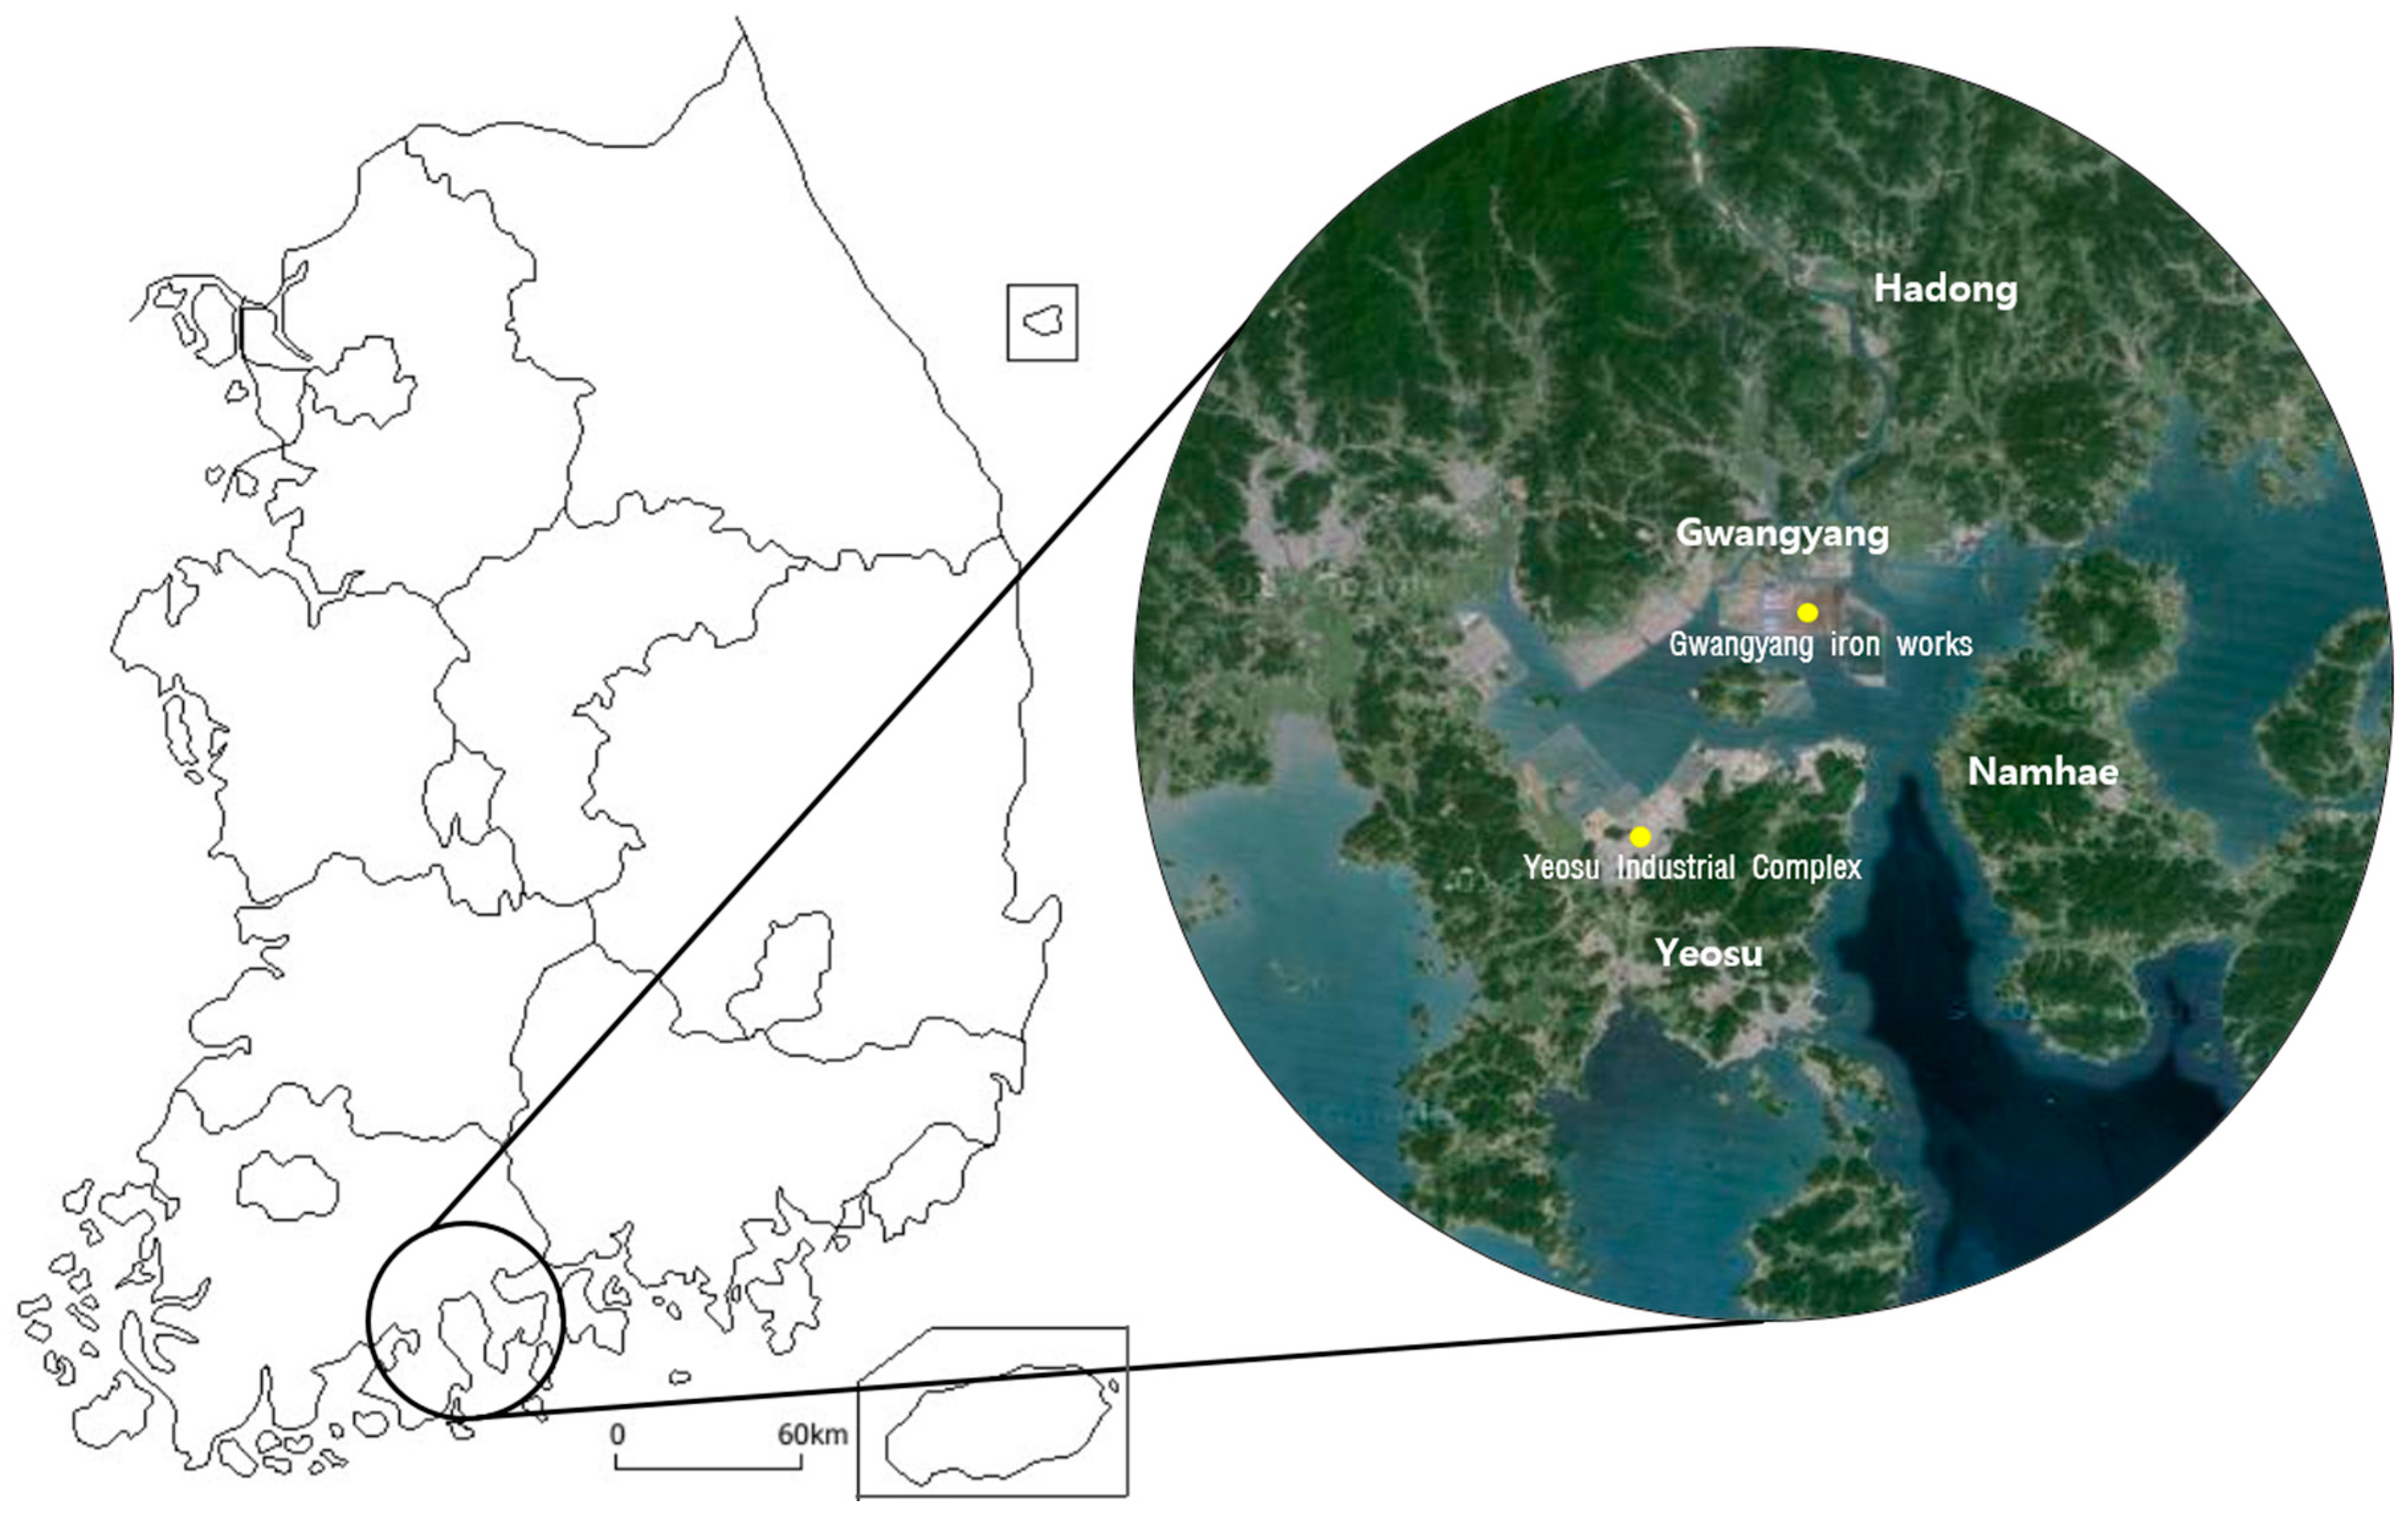
2.2. Subjects and Areas

The participants in the exposed group were residents in the Gwangyang Bay area. Toxic metal (Pb, Cd, Hg) assessments were performed intensively from May 2007 to November 2010, in the Gwangyang and Yeosu National Industrial Complex around Gwangyang Steel works as representative industrial areas in South Korea. Gwangyang and Yeosu aimed the Residents who lived within 5 km with National industrial complex as the center. The Hadong and Namhae aimed the residents who lived over than 5 km with National industrial complex as the center. Response: We have conducted a multiple linear regression analysis, after adding to exposure and control areas. Residents of Hadong and Namhae areas were the control group with limited or no occupational and environmental exposure to Pb, Cd, or Hg. The subjects (n = 592) for the study were collected from those who agreed to participate (n = 2838). Subjects were excluded if they had an unclear address, no biological sample (blood and urine) data, or their and urinary creatinine concentration was out of the range of 0.5–3.0. This study was approved by the Institutional Review Board of Soonchunhyang University.

2.3. Sampling and Survey

Six ml of whole blood was collected in a Vacutainer (BD Science, Parsippany, NJ, USA) green capped tube containing heparin for the Pb measurements. The samples were carried to the laboratory at 4 °C and frozen at −20 °C. After thawing, we used a roller mixer to re-mix the samples before analysis. Urine was collected in a specimen cup, transferred to a 15 mL conical tube, and delivered refrigerated (4 °C) to the laboratory for the analysis of urinary Cd and Hg. The urine was frozen at −20 °C until analysis, which was performed within 24 h. The final heavy metal concentrations in the urine were revised to µg/g creatinine (cr). A survey of the enrolled subjects was performed by personnel who were trained sufficiently through interviews, and a standardized questionnaire derived from the Korea National Institute of Environmental Research was used. Information, lifestyle, demographic characteristics, dietary habits, diseases and drugs were included in this questionnaire survey.

2.4. Sample Analysis

The analysis of B-Pb and U-Cd were performed with a GF-AA instrument (SOLLAR M6, Thremo, Cambridge, England). The limits of detection (LODs) were 0.1 and 0.3 µg/dL, respectively. Hg was analyzed with the Milestone DMA-80 direct mercury analyzer (Shelton, CT, USA), and the LOD was 0.1 µg/dL.
Standard Reference Material was used for the internal quality control (National Institute of Standards and Technology) product for Pb in the blood. During the test, the analyzing was performed in Lot and almost all results were correct (90% of total items).

2.5. Statistical Analysis

We used Excel (Microsoft Corp. Redmond, WA, USA) for heavy metal data collection and the SPSS ver. 20.0 software package (SPSS Inc., Chicago, IL, USA) for the statistical analysis. The general characteristics of the study subjects and the geometric mean concentrations of heavy metals are shown as averages. We compared the average differences in the heavy metal concentrations by Student’s t-test. Pearson’s correlation coefficients were used to investigate the relationship among factors affecting blood and urinary heavy metal concentrations. For studying the factors, which effected on the concentration of the heavy metal, we carried out a multiple regression analysis. A p < 0.05 was considered significant.

3. Results

The 592 participant’s (median age, 58 years; 48% men and 52% women) characteristics and levels of Pb, Cd, and Hg are shown in Table 1. About 70% of the participants were nonsmokers. Mean body mass index was 23.7 kg/m3. The median B-Pb concentration of the 592 subjects was 2.55 µg/dL and 0.98 and 5.09 µg/dL were the 5th and 95th percentile values. Median U-Cd concentration was 1.77 µg/L (0.33 and 6.98 µg/L were the 5th and 95th percentiles). The U-Cd Cr was 1.32 µg/g Cr (0.67 and 2.26 µg/g Cr were the 5th and 95th percentiles). The U-Hg was 1.18 µg/L (0.21 and 3.13 µg/L were the 5th and 95th percentiles). The U-Hg Cr, 1.07 µg/g cr (0.57 and 1.75 µg/g cr were the 5th and 95th percentiles).
Table 1. Participant characteristics and levels of biomarkers of Pb, Cd and Hg.
VariablesNo.PercentMedian(P5-P95) 1
Study group(exposed/control)59263/37
Sex (male/female)59248/52
Smoking (never/former/current)59270/6/24
Alcohol use (yes/no)59258/42
Education levels (Uneducated/elementary school/Middle and High school/Over college)59219/34/31/16
Income per month (Korean won, KRW) (< 1,000,000 / 1,000,000–2,000,000 / 2,000,000–4,000,000 / ≥ 4,000,000)59255/19/19/8
Age592 58.0(27.3–78.0)
Height592 161.0(146.1–175.0)
Weight592 60.0(45.0–80.5)
BMI592 23.7(18.8–28.8)
Blood-Pb (µg/dL)592 2.55(0.98–5.09)
Urinary-Cd (µg/L)592 1.77(0.33–6.98)
Urinary-Cd cr (µg/g cr)592 1.32(0.67–2.26)
Urinary-Hg (µg/L)592 1.18(0.21–3.13)
Urinary-Hg cr (µg/g cr)592 1.07(0.57–1.75)
1 5 percentile and 95 percentile.
Table 2 and Table 3 show a comparison between the heavy metal biomarkers in the exposed and control groups of women and men. The number of participants in the exposed and control groups were 186 and 106 women candidates and 185 and 115 man candidates, respectively. blood-Pb, urinary-Cd, urinary-Cd creatinine, and U-Hg were slightly higher in women of the exposed group than those in the control group. The geometric means were 2.21 µg/dL in the exposed group and 1.90 µg/dL in the control group (p < 0.01) for lood-Pb; 2.20 µg/L in the exposed group and 1.46 µg/L in the control group (p < 0.01) for urinary-Cd;1.43 µg/L in the exposed group and 1.25 µg/L in the control group (p < 0.01) in urinary-Cd creatitnine; and 1.23 µg/L in the exposed group and 0.98 µg/L in the control group (p < 0.05) for urinary-Hg. The geometric mean of urinary-Hg creatinine in women tended to be higher in the exposed group than that in the control group, but the difference was not significant. Blood-Pb, urinary-Hg and urinary-Hg cr were slightly higher in the exposed group of men than those in the control group. The geometric means were 3.18 µg/dL in the exposed group and 2.55 µg/dL in the control group (p < 0.01) for blood-Pb; 1.14 µg/L in the exposed group and 0.92 µg/L in the control group (p < 0.05) for urinary-Hg; and 1.06 µg/L in the exposed group and 0.96 µg/L in the control group (p < 0.05) for urinary-Hg creatinine. The geometric means of urinary-Cd and urinary-Cd creatinine in men of the exposed group tended to be higher than those in the control group, but the difference was not significant.
The correlation analysis results between the blood-Pb, urinary-Cd, urinary-Cd creatinine, urinary-Hg, and urinary-Hg creatinine, blood-Pb are shown in Table 4. All Pb, Cd and Hg biomarkers were correlated except for the correlations between urinary-Cd and urinary-Hg creatinine, and between urinary-Cd creatinine and urinary-Hg. The level of lead in the blood is the factors that effected on the gender and BMI from multiple regression analysis. The levels of Cd were the factors which effected significantly on gender, age, education, smoking status in adjusted urinary creatinine. The levels of Hg in the urine, the BMI and smoking were the effected factors (Table 5).
Table 2. Participant characteristics and levels of biomarkers of Pb, Cd and Hg.
VariablesExposed Control
GMGSD(P5–P95)1 GMGSD(P5–P95) 1
B-Pb (µg/dL)2.691.55(1.28–5.09) 2.511.60(0.98–4.76)
U-Cd (µg/L)1.76 **2.21(0.52–6.98) 1.222.22(0.33–4.25)
U-Cd cr (µg/g cr)1.76 **2.21(0.53–5.16) 1.222.22(0.33–4.25)
U-Hg (µg/L)1.222.08(0.27–2.94) 1.092.55(0.18–2.88)
U-Hg cr (µg/g cr)1.14 *2.12(0.30–3.08) 1.092.49(0.18–2.76)
1 5 percentile and 95 percentile; * p < 0.05, ** p < 0.01 by student’s t-test between exposed and control groups.
Table 3. Comparison between biomarkers of exposed and control group of women and man candidates.
VariablesWomen Man
Exposed (186) 1 Control (106) 1 Exposed (185) 1 Control (115) 1
GMGSD(P5–P95) 2 GMGSD(P5–P95) 1 GMGSD(P5–P95) 1 GMGSD(P5–P95) 1
B-Pb
(µg/dL)
2.21 **1.71(0.76–4.14) 1.901.73(0.72–4.07) 3.18 **1.59 (1.39–5.93) 2.551.47(1.44–4.94)
U-Cd
(µg/L)
2.20 **2.49 (0.47–8.44) 1.462.58(0.27–7.20) 1.552.64(0.28–6.11) 1.462.22(0.27–4.38)
U-Cd cr
(µg/g cr)
1.43 **1.45 (0.76–2.52) 1.251.50(0.58–2.15) 1.211.52(0.59–2.16) 1.171.38(0.68–1.78)
U-Hg
(µg/L)
1.23 *2.26(0.32–3.87) 0.982.31(0.24–3.16) 1.14 *2.05 (0.30–3.18) 0.922.08(0.31–2.80)
U-Hg cr
(µg/g cr)
1.121.40(0.60–1.73) 1.061.42(0.58–1.75) 1.06 *1.38(0.63–1.76) 0.961.40(0.61–1.81)
1 Number of participants; 2 5 Percentile and 95 percentile; * p < 0.05, ** p < 0.01 by student’s t-test between exposed and control groups.
Table 4. Pearson correlation coefficient between biomarkers of Pb, Cd, Hg (No.=592).
VariablesU-CdU-HgU-Cd crU-Hg cr
B-Pb0.102 *0.182 **0.091 *0.170 **
U-Cd 0.224 **0.857 **0.056
U-Hg 0.0250.838 **
U-Cd cr 0.170 **
* p < 0.05, ** p < 0.01.
Table 5. Participant characteristics and levels of biomarkers of Pb, Cd and Hg.
Variables FactorΒStandard errorp-ValueR2
B-PbConstant1.174 0.2300.0000.147
Sex−0.312 0.0400.000
Age−0.003 0.0020.058
BMI0.014 0.0050.008
Area−0.069 0.0360.057
Education level−0.023 0.0170.172
Smoking0.032 0.0240.190
U-CdConstant−0.858 0.3760.0230.319
Sex0.356 0.0650.000
Age0.019 0.0030.000
BMI0.013 0.0080.111
Area0.264 0.0590.000
Education level−0.127 0.0280.000
Smoking0.109 0.0400.006
U-Cd crConstant−0.856 0.3760.0230.320
Sex0.356 0.0650.000
Age0.019 0.0030.000
BMI0.013 0.0080.110
Area0.265 0.0590.000
Education level0.127 0.0280.000
Smoking0.109 0.0400.006
U-HgConstant0.149 0.4860.7590.034
Sex0.013 0.0840.874
Age−0.006 0.0040.082
BMI0.028 0.0110.008
Area−0.121 0.0760.111
Education level−0.030 0.0360.407
Smoking−0.149 0.0510.004
U-Hg crConstant−0.104 0.4750.8270.056
Sex0.158 0.0820.054
Age−0.005 0.0040.196
BMI0.029 0.0100.006
Area−0.181 0.0740.015
Education level−0.043 0.0350.228
Smoking−0.132 0.0500.009

4. Discussion

This study was the first national cohort study performed with residents who live in South Korea’s industrial complex area. We investigated heavy metal concentrations in biological samples among people who live in the Gwangyang and Yeosu industrial complex area.
The average B-Pb concentration was 2.21 µg/dL in women and 3.18 µg/dL in men of the exposed group, which was higher than those values in the control groups of men and women (1.90 µg/dL in women and 2.55 µg/dL in men). The average (control) Korean B-Pb concentration is 1.91 µg/dL [19], whereas it is 1.12 µg/dL the USA [11] and 1.34 µg/dL in Canada [20]. However, the B-Pb levels in this study were lower than those reported in Germany (3.07 µg/dL) [21] and Brazil (2.37 µg/dL) [22]. In this study, males (2.55 µg/dL) had higher B-Pb levels than those of females (1.90 µg/dL), which was similar to previous studies [21,22,23]. Males had higher B-Pb levels than those of females in German human biomonitoring commission research [24]. As age increases, blood concentrations of heavy metals increase, particularly in those between 40–59 years old, who have recorded the highest concentration of 2.56 µg/dL [2,25]. The age difference reflects the difference between the amount of activity and the environment. It is generally reported that older people’s B-Pb concentrations are higher, and that the rapid increase in B-Pb concentration is caused by postmenopausal women’s bone loss [25].
Women in the exposed group had significantly higher U-Cd (2.20 µg/L) and U-Cd cr (1.43 µg/g) than those in the control group (1.46 µg/L for U-Cd and 1.25 µg/g for U-Cd cr) (p < 0.01). The U-Cd levels in previous reports of a Korean (control) survey showed 1.23 µg/L for U-Cd and 1.56 µg/g for U-Cd cr [26]. The geometric mean U-Cd levels in other locations include 1.40 µg/g cr for U-Cd cr in Bangkok [27], 1.51 µg/g cr for U-Cd cr in Kuala Lumpur [28], 1.21 µg/g cr for U-Cd cr in Manila [29], and 1.59 µg/g cr for U-Cd cr in a Taiwan survey [30]. Higher U-Cd was observed in a Japanese study than the values observed in our study [31]. These reports show comparable values to our control group. However, the geometric mean U-Cd cr value in a Japanese study was higher (4.39 µg/g cr) than the results of our study (1.43 µg/g cr). Cooked rice as a main energy source is a strong determinant of variations in dietary Cd intake [31,32]. According to the US NHANES survey, the potential exposure risks for Cd in urine are occupational and smoking [11].
Because many factories exist in the industrial complex, the residents could be affected by Hg emissions into the atmosphere. Geometric means that could influence residents of the exposed group were 1.23 µg/L and 1.14 µg/L in U-Hg of women and man candidate. It was slightly higher (p < 0.05) than the concentration of control group (0.98 and 0.92 µg/L in U-Cd). However, in case of U-Hg, exposed group was significantly higher (1.12 and 1.06 µg/g cr in woman and man candidates) than control group (1.06 and 0.96 in woman and men) in men (p < 0.05), but not in women (p > 0.05). The results of the control group in our study were higher than those found in Germany (0.34 µg/g cr) [21], the United States (0.46 µg/g cr) [11], and Canada (0.40 µg/g cr) [20]. People living in the Gwangyang and Yeosu industrial complex could be affected by exposure to Hg, compared to the people living in area that is not influenced by Hg.
Pearson’s correlation coefficients were significant for almost all variables except for the correlation between U-Cd and U-Hg cr, and between U-Cd cr and U-Hg. We suppose that these three toxic metals are emitted simultaneously, so that a higher Pb exposure results in higher Cd and Hg exposure. Participants in the exposed group were slightly affected by ambient air exposure, although the main exposure source is from intake of food especially seafood containing these three metals [33]. More study is necessary regarding the exposure routes from food sources and contaminant ambient air.

5. Conclusions

We suggest that the exposed group of residents were simultaneously exposed to Pb, Cd, and Hg from contaminated ambient air originating from the iron manufacturing industrial complex. Residents who live in the Gwangyang and Yeosu areas should be systematically monitored and continuously evaluated for health effects. We need to research the health damage to residents in industrial areas to provide basic data for expanding and establishing a center for environmental pollution control measures.

Acknowledgments

This research was supported by the Soonchunhyang University Research Fund. This study was supported by National Institute of Environmental Research of Korea, as “Korean National Cohort Study of biological monitoring and environmental contaminants 2007–2010”.

Author Contributions

Heejin Park and Kyoungho Lee conducted the data analysis, provided statistical support, and wrote the manuscript. Chan-Seok Moon aided with the concept and design of the study, and edited the manuscript. Kyungsook Woo and Eun-Kyung Chung contributed to data collection and analysis. Tack-Shin Kang contributed to data analysis and provided statistical support. Bu-Soon Son aided with the concept and design of the study, contributed to data collection and analysis, provided statistical support, and edited the manuscript. All authors have read the final manuscript, agreed that it is ready for submission, and accept responsibility for contents.

Conflicts of Interest

The authors declare no conflict of interest.

References

  1. NIER. The monitoring on exposure level and biomarker of environmental pollutants for industrial residents (Gwangyang Bay, 2nd Year). Available online: http://library.nier.go.kr/search/DetailView.ax?sid=1&cid=5001116 (accessed on 12 Auguest 2014).
  2. Im, J.-Y.; Chung, E.-K.; Park, H.-J.; Yu, S.; Jang, B.-K.; Son, B.-S. A study on concentrations of heavy metal in blood and urine of local area in Korea. J. Environ. Sci. 2013, 22, 59–72. [Google Scholar]
  3. Jeon, J.M.; Hur, D.; Kim, D.S. Trend of volatile organic compounds in the ambient air of yeosu industrial complex. J. Korean Soc. Atmos. Environ. 2003, 19, 663–677. [Google Scholar]
  4. Park, J.M.; Lee, S.B.; Cha, J.S.; Kwon, O.S.; Lee, S.H. Characteristics of heavy metal emissions from stationary sources. J. Korean Soc. Atmos. Environ. 2008, 24, 574–583. [Google Scholar]
  5. Choi, C.-I.; Kim, J.-H. An international comparative study on the relationship between economic growth and environmental pollution : Testing the existence of EKC in CO2. J. Korea Plan. Assn. 2006, 41, 153–166. [Google Scholar]
  6. NIER. The monitoring on exposure level and biomarker of environmental pollutants for industrial residents (Gwangyang Bay, 4nd Year). Available online: http://webbook.me.go.kr/DLi-File/NIER/06/013/5515618.pdf (accessed on 13 Auguest 2014).
  7. Jung, J.-H.; Cho, S.-W.; Lim, H.-S. Distribution characteristics of environmental contaminant at soil in an industrial complex area. Clean Technol. 2012, 18, 200–208. [Google Scholar] [CrossRef]
  8. Ho, M.K.; Lim, Y.W.; Lim, J.H.; Yang, J.Y.; Shin, D.C. Association between blood mercury concentration and factor of health/life. J. Environ. Toxicol. 2006, 21, 229–238. [Google Scholar]
  9. Jou, H.-M.; Choi, S.-H.; Chung, E.-K.; Jung, S.-W.; Yang, W.-H.; Son, B.-S. Hevey metal levels in urine of residents in industrial area. J. Environ. Sci. 2011, 20, 565–574. [Google Scholar]
  10. Thomas, K.W.; Pellizzari, E.D.; Berry, M.R. Population-based dietary intakes and tap water concentrations for selected elements in the EPA region v national human exposure assessment Survey (NHEXAS). J. Expo. Anal. Environ. Epidemiol. 1999, 9, 402–413. [Google Scholar] [CrossRef] [PubMed]
  11. CDC. Very high blood lead levels among adults—United States, 2002–2011. MMWR 2013, 62, 967–971. [Google Scholar]
  12. Ohn, Y.H.; Park, J.D.; Choi, B.S.; Hong, Y.P.; Chang, I.W. Blood cadmium and zinc and urinary n-acetyl-β-d-glucosaminidase activity in rural residents not exposed to cadmium. Chung-ang Journal of Medicine 1995, 20, 333–350. (In Korea) [Google Scholar]
  13. Peters, J.L.; Perlstein, T.S.; Perry, M.J.; McNeely, E.; Weuve, J. Cadmium exposure in association with history of stroke and heart failure. Environ. Res. 2010, 110, 199–206. [Google Scholar] [CrossRef] [PubMed]
  14. Agarwal, S.; Zaman, T.; Murat Tuzcu, E.; Kapadia, S.R. Heavy metals and cardiovascular disease: Results from the national health and nutrition examination Survey (NHANES) 1999–2006. Angiology 2011, 62, 422–429. [Google Scholar] [CrossRef] [PubMed]
  15. Weinhold, B. Environmental cardiology: Getting to the heart of the matter. Environ. Health Perspect. 2004, 112, 880–887. [Google Scholar] [CrossRef]
  16. Navas-Acien, A.; Guallar, E.; Silbergeld, E.K.; Rothenberg, S.J. Lead exposure and cardiovascular disease—A systematic review. Environ. Health Perspect. 2007, 115, 472–482. [Google Scholar] [CrossRef]
  17. Dietary Intake and Risk Assessment of Contaminants in Korean Foods; Korea Health Industry Development Institute: Seoul, Korea, 2004.
  18. Virtanen, J.K.; Voutilainen, S.; Rissanen, T.H.; Mursu, J.; Tuomainen, T.-P.; Korhonen, M.J.; Valkonen, V.P.; Seppänen, K.; Laukkanen, J.A.; Salonen, J.T. Mercury, fish oils, and risk of acute coronary events and cardiovascular disease, coronary heart disease, and all-cause mortality in men in eastern Finland. Arterioscler. Thromb. Vasc. Biol. 2005, 25, 228–233. [Google Scholar] [PubMed]
  19. NIER. Health Effects Survey of Abandoned Metal Mine (Chungnam, Chungbuk). Available online: http://webbook.me.go.kr/DLi-File/NIER/06/013/5511744.pdf (accessed on 13 Auguest 2014).
  20. Health_Canada. Health Canada Report on Human Biomonitoring of Environmental Chemicals in Canada: Results of the Canadian Health Measures Survey Cycle 1 (2007–2009). Minister of Health: Ottawa, Canada, 2010. [Google Scholar]
  21. Becker, K.; Schulz, C.; Kaus, S.; Seiwert, M.; Seifert, B. German environmental survey 1998 (GerES III): Environmental pollutants in the urine of the German population. Int. J. Hyg. Environ. Health 2003, 206, 15–24. [Google Scholar] [CrossRef] [PubMed]
  22. Kuno, R.; Roquetti, M.H.; Becker, K.; Seiwert, M.; Gouveia, N. Reference values for lead, cadmium and mercury in the blood of adults from the metropolitan area of Sao Paulo, Brazil. Int. J. Hyg. Environ. Health 2013, 216, 243–249. [Google Scholar] [CrossRef] [PubMed]
  23. Son, J.-Y.; Lee, J.; Paek, D.; Lee, J.-T. Blood levels of lead, cadmium, and mercury in the Korean population: Results from the second Korean national human exposure and bio-monitoring examination. Environ. Res. 2009, 109, 738–744. [Google Scholar] [CrossRef] [PubMed]
  24. Wolf, U.; Oberwöhrmann, S.; Roßkamp, E.; Schulz, C.; Voigt, M.; Wölke, G.; Szewzyk, R.; Ullrich, D.; Englert, N.; Seifert, B.; et al. Kinder-Umwelt-Survey—das Umweltmodul im KiGGS. Bundesgesundheitsbl-Gesundheitsforsch-Gesundheitsschutz 2004, 47, 1073–1077. [Google Scholar] [CrossRef]
  25. Lee, B.; Ha, J. The effects of smoking and drinking on blood lead and cadmium levels: Data from the fourth Korea national health and nutrition examination survey. Korean J. Occup. Environ. Med. 2011, 23, 31–41. [Google Scholar]
  26. Moon, C.S.; Paik, J.M.; Choi, C.S.; Kim, D.H.; Ikeda, M. Lead and cadmium levels in daily foods, blood and urine in children and their mothers in Korea. Int. Arch. Occup. Environ. Health 2003, 76, 282–288. [Google Scholar] [PubMed]
  27. Zhang, Z.-W.; Shimbo, S.; Watanabe, T.; Srianujata, S.; Banjong, O.; Chitchumroonchokchai, C.; Nakatsuka, H.; Matsuda-Inoguchi, N.; Higashikawa, K.; Ikeda, M. Non-occupational lead and cadmium exposure of adult women in Bangkok, Thailand. Sci. Total. Envir. 1999, 226, 65–74. [Google Scholar] [CrossRef]
  28. Moon, C.-S.; Zhang, Z.-W.; Watanabe, T.; Shimbo, S.; Ismail, N.H.; Hashim, J.H.; Lkeda, L. Non-occupational exposure of Malay women in Kuala Lumpur, Malaysia, to cadmium and lead. Biomarkers 1996, 1, 81–85. [Google Scholar] [CrossRef] [PubMed]
  29. Zhang, Z.W.; Subida, R.D.; Agetano, M.G.; Nakatsuka, H.; Inoguchi, N.; Watanabe, T.; Shimbo, S.; Higashikawa, K.; Ikeda, M. Non-occupational exposure of adult women in Manila, the Philippines, to lead and cadmium. Sci. Total Environ. 1998, 215, 157–165. [Google Scholar] [CrossRef] [PubMed]
  30. Ikeda, M.; Zhang, Z.W.; Moon, C.S.; Imai, Y.; Watanabe, T.; Shimbo, S.; Ma, W.-C.; Lee, C.-C.; Guo, Y.-L.L. Background exposure of general population to cadmium and lead in Tainan city, Taiwan. Arch. Environ. Contam. Toxicol. 1996, 30, 121–126. [Google Scholar] [CrossRef] [PubMed]
  31. Watanabe, T.; Zhang, Z.W.; Moon, C.S.; Shimbo, S.; Nakatsuka, H.; Matsuda-Inoguchi, N.; Higashikawa, K.; Ikeda, M. Cadmium exposure of women in general populations in Japan during 1991–1997 compared with 1977–1981. Int. Arch. Occup. Environ. Health 2000, 73, 26–34. [Google Scholar] [CrossRef] [PubMed]
  32. Moon, C.-S.; Lee, C.K.; Lee, J.T.; Kim, J.M.; Paik, J.-M.; Ikeda, M. Time trends in dietary cadmium intake of Korean women. Toxicol. Res. 2012, 1, 145–150. [Google Scholar] [CrossRef]
  33. Birgisdottir, B.E.; Knutsen, H.K.; Haugen, M.; Gjelstad, I.M.; Jenssen, M.T.S.; Ellingsen, D.G.; Thomassen, Y.; Alexander, J.; Meltzer, H.M.; Brantsæter, A.L. Essential and toxic element concentrations in blood and urine and their associations with diet: Results from a Norwegian population study including high-consumers of seafood and game. Sci. Total Envir. 2013, 463–464, 836–844. [Google Scholar] [CrossRef]

